Abhiman Das and Manjusha Senapati* |
| |
| This paper examines the major sources of strong profitability of Indian manufacturing companies during recent years. Changes over time in the value of a company's profit can arise from many sources. Isolation of them into factors of production and to pin down contributory variables that promote efficiency is challenging both theoretically and empirically. In this context, this paper applies a new index-number theory to data of Indian manufacturing companies over a period of seven years from 2000-2006, allowing changes in the company's profit to be broken down into separate effects due to productivity change, price changes and growth in input quantities used. The productivity of Indian manufacturing companies was found to be 24 per cent higher in 2006 as compared to that in 2000. The actual increase in companies' profit has outpaced the growth in the size of the input quantities on an average. The empirical results indicate that the companies have not passed the benefit from productivity improvement to consumers. |
| |
| JEL Classification : C43, D24, L60 |
Keywords : Productivity, Total Factor Productivity, Törnqvist Index |
| |
Introduction |
| |
The Indian economy has experienced strong growth during recent times. The acceleration in real gross domestic product (GDP) has been contributed by the sustained expansion in industry and services sector. In fact, growth of real GDP originating from industry has entered the fifth year of expansion, mainly driven by the manufacturing sector. Stepping up of the activity in the manufacturing sector and its robust growth have been facilitated by improvement in investor friendly and sector specific policies and focus on improving the infrastructure facilities. |
| |
| * The authors are Assistant Adviser and Research Officer in the Department of Statistics and Information Management (DSIM), respectively. The views expressed in the paper are strictly personal. Errors and omissions, if any, are the sole responsibility of authors. The usual disclaimers apply |
| |
Historically, the trends in industrial growth in India were not so robust. During the 1960s, the performance of Indian manufacturing was severely constrained by productivity (Ahluwalia, 1985). Low long-term productivity growth over 1965 to 1986 was, however, followed by definite signs of positive growth in productivity in the decade of 1980s. This improvement was widespread, touching all sub-sectors of manufacturing. Higher investment in power and transport sectors with increased efficiency and trade and industrial policy reforms had resulted in turnaround. This is well reflected in the performance of the manufacturing sectors during the post reform period, especially after 2000. For example, gross profits of the companies have registered an increase of 17 per cent per annum during 2000-2006.
Productivity may be defined as the ratio of output of goods and services to the inputs - human as well as others - used in the production process. Total Factor Productivity (TFP) is the contribution other than that emanating from the increased use of inputs (capital and labour). TFP thus measures the increase in efficiency with which resources are being used through innovations and improved management techniques to increase the output from a given combination of capital and labour. In general, higher productivity is associated with a higher profitability, larger market, a lower degree of import substitution, and lower capital intensity. Recent phase of enhanced profitability has raised the capital intensity of manufacturing sector even more. Against this, it will be interesting to isolate the effects of changes in company's profit, including utilisation of factors of production, and to pin down contributory factors that promote efficiency.
The objective of the paper is to explain the higher profitability of Indian manufacturing sector in recent times. Changes over time in the value of a company's profit can arise from many sources, such as growth in the quantity of inputs used, improvement in productivity and price changes, etc. Does higher productivity lead to higher efficiency of the companies? Until now, there have been no attempts in separating and quantifying these influences in the Indian context. The paper applies new index-number method to data of Indian manufacturing companies over a period of seven years from 2000-2006 allowing for changes in the company's profit to be broken down into separate effects due to productivity change, price change and growth in input quantities used.
The rest of the paper is organised as follows. Section I presents the brief literature review in Indian context. An overview of performance of Indian companies during 1992-2006 is presented in section II. Methodology of decomposing profit growth into size of input quantities, productivity and price changes are described in section III. Results are presented in section IV. Concluding remarks are set out in the final section. |
| |
Section I |
A Brief Literature Review |
| |
The Reserve Bank of India has been publishing annual special studies analysing performance of manufacturing sector since 1951-52. Based on various accounting ratios, these studies provide a comprehensive outlook of the corporate sector. However, issues relating to productivity are in general not attempted. Among earlier studies, Ahluwalia (1985) analysed the trends in industrial growth since mid-1950s and identified a phenomenon of persistent industrial stagnation since mid-1960s. It also pointed out towards the constraining role played by poor productivity growth in Indian industrialisation. Ahluwalia (1991) dealt with the issue of productivity growth in Indian manufacturing sector in greater detail and over a longer period 1960 to 1986 and showed that there was an increase in TFP growth in the late 1980s, the initial period of liberalisation. The two factors contributing to the growth in productivity were found to be infrastructure sector improvement and reorientation in the policy framework. The study had, however, taken the value added at the constant prices as the measure of output. Balakrishnan and Pushpangandan (1994) argued that such a measure is valid only if the prices of material inputs relative to prices of output are somewhat constant over the period of analysis. They made an attempt to construct a standard measure of productivity for Indian industry having accounted for the change in the prices of material inputs. They observed that contrary to what is believed, productivity growth in the 1980s may actually have been slower. |
| |
Rao (1996a) developed a procedure for construction of an index of TFP when output is reckoned in the value-added terms and applied it to the case of Indian manufacturing. He proposed a method for relaxing the assumption of the perfect competition in product markets and concluded that there was a transition in the early 1980s from a high positive rate of trend growth in productivity to a significant negative rate, a result contrary to Ahluwalia (1991) but similar to Balakrishnan and Pushpangandan (1994). Rao (1996b) again argued that the methods of measurement of productivity suffer from significant measurement bias due to high level of aggregation involving manufacturing as a whole. He studied productivity trends in Indian industry on the basis of particular scheme of disaggregation. The disaggregated productivity measures were then suitably aggregated to provide a revised index of productivity of Indian manufacturing.
Several other studies have also attempted to find the trends in productivity in the post reform period; the evidence from empirical studies by researchers is ambiguous, though anecdotal evidence, especially of trends in recent years, shows significant increases in productivity. While studies by Unel (2003) and Tata Services Ltd.find acceleration in the growth of TFP in the 1990s, Goldar and RBI (2004) find a deceleration in the TFPG. Despite the uncertainty regarding acceleration in TFP growth it is believed that trade liberalisation since 1991 has had a positive impact on the TFP growth in India (Krishna and Mitra, 1998; Chand and Sen, 2002; Das, 2003; and, Topalova, 2004). At the sectoral level, there is evidence of improved TFP growth for the exporting sectors vis-à-vis the non-exporting ones (Dholakia and Kapur, 2001; Unel, 2003). More recently, Kato (2005) finds that the smaller the market share of a firm, the higher is its productivity growth.
All these empirical studies in India have focused predominantly on the TFP growth. In addition to TFP growth, however, it is important to examine trends in profit achieved by the companies and the impact of the factors leading to higher profit for the companies in India. Moreover, several studies draw upon the data up to the year 2000 while, by all indications, significant gains in productivity have occurred in the more recent years, particularly in manufacturing (Reddy, 2005). |
| |
Section II |
Performance of Indian Companies during 1992-2006 |
| |
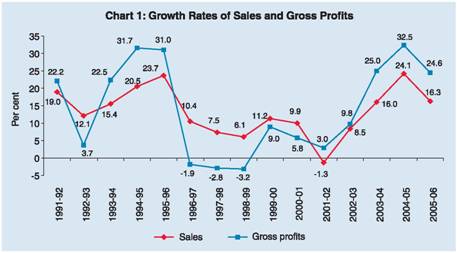
| Performance of Indian manufacturing companies during 1992-2006 is presented in this section using RBI data. During early years of deregulation, the profitability of the companies was not so robust. Growth in gross profits of the companies went down from 22.2 per cent in 1991-92 to 3.7 percent in 1992-93. Companies registered average gross profits growth of 13 per cent during 1990s. There was however, improvement in 2000-2006 when the average rate of profit growth increased to 17 per cent. Growth in gross sales followed more or less the same pattern as that of profit (Chart 1). During the period of apparent economic slowdown, for the three consecutive years, viz., 1996-97, 1997-98 and 1998-99, growth in sales of the companies went down, leading to gross profits growth rate turning negative for these three years. Profits retained increased at the rate of 10 per cent during 1990s, which jumped up to 61 per cent during 2000-2006. |
| |
|
Coinciding with growth phase of the business cycle, profitability ratios also went up during the current decade.
Companies were reinvesting about 74 per cent of their profits in their core business or to pay debts during the first half of 1990s. The ratio declined during the early 2000s. The ratio of 'tax provision to profits before tax' reflecting the amount of profit to be allocated for paying taxes also fell significantly during 2000s as compared to the 1990s. It is clear that the period after the year 2000 witnessed a reversal of reinvestment accompanied by a reduction in increased tax burden.
Soft interest rate regime helped companies' better performance as indicated by their interest payments. For example, interest payments by the companies recorded negative growth since 2001-02. Gross savings of the companies increased at an impressive rate of 21 per cent annually in the six years of 2000s, higher than the earlier range of 13 per cent in the 1990s. As a result, corporate sector witnessed high growth in fixed assets during the post reform period. The growth in borrowings of the companies declined from 17 per cent in 1990s to 6 per cent in 2000's. Overall, the performance of Indian corporate sector has had three distinct phases: both sales and gross profit were high till the mid 1990s. During the second phase, i.e. the latter years of the 1990s to the early 2000s, the performance of corporate sector was markedly low coinciding with the economic slowdown. Subsequently, as growth prospects of economy improved, performance of the corporate sector boomed back and has maintained a steady growth. |
| |
Section III |
Methodology |
| |
| At a basic level, the concept of productivity is relatively easy to define. It is the ratio of output to inputs for a specific production process. Rising productivity implies either more output is produced with the same amount of inputs, or that fewer inputs are required to produce the same level of output. The concept of productivity is closely linked with the issue of efficiency. If a company is efficient, it is said to be operating on the production frontier (i.e., it is achieving 'best practice'), where the production frontier is defined at some point in time with reference to a particular set of companies. Rising efficiency would therefore mean rising productivity. Equally, the shift outwards of a production frontier also implies productivity growth. In the case of constant returns to scale, efficiency and productivity are same. |
| |
Consider a single-output, single-input case; productivity is merely the ratio of company's output to input quantities. Suppose in
|
| |
| The productivity index shows how the productivity of the company has changed from period 0 to period 1. If multiple inputs and multiple outputs are involved, the simple ratios of input and output quantities in the above equation are replaced by a ratio of quantity indexes of output and input. In that case the index of multifactor productivity is |
|
literature, Törnqvist productivity index has been quite popular. It is measured by a weighted geometric mean of the relative quantities from the two periods. Considering the output quantity index first, of output bundle. |
| |
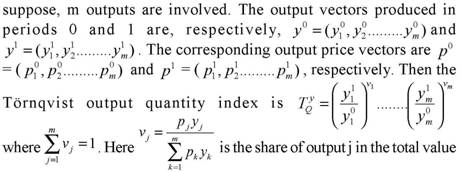 |
| As the value shares of individual outputs are different in two periods,
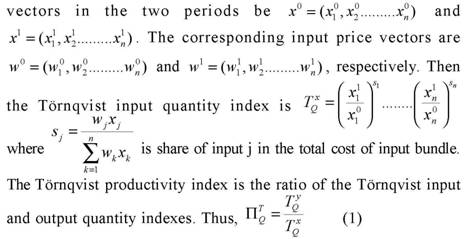
Similarly, let the input |
| |
 |
| |
| This measure based on gross output productivity measure will be referred to as TFP Growth (TFPG). Another measure of productivity using gross operating surplus type approach will be called Capital TFP Growth (KTFP) or simply productivity growth which is defined as follows (Lawrence et. al., 2006). |
| |
 |
| Then we can define an index of the growth in the profit of the company, between periods t and t - 1, as |
 |
Where p' and y' denote price and quantity vectors between periods t and t-1. Dividing this value ratio by the price index for the netputs between periods t and t-1 gives us an implicit netput quantity index as Gt / Pt . |
| |
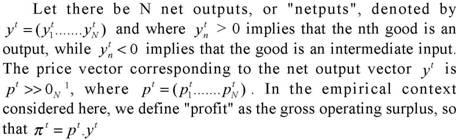
To introduce production into the analysis we assume that production of N netputs involves M primary inputs. The vector of M Consequently, productivity growth in (3) is the growth in the output quantity index that cannot be explained by growth in input utilization. By rearranging equation (3), we obtain:
|
| |
Any index number formula can be used for constructing the price and input indexes for use in (4). However, the Törnqvist (1936) index has several advantages that suggest its use in this context.
We can then define P t and K t in (4), respectively, as
the profit share of fixed input m. |
| |
By noting that the Törnqvist index formula has the form of a (weighted) geometric mean, we can write the aggregate price index as a product of individual price sub-indexes:
|
| |
P t is defined as the nth term in (5), and gives the contribution of
the price changes of the nth good to the aggregate price index.Similarly, the primary-input index in (4) can be written as: |
| |
|
the change in the mth component of the primary inputs to the aggregate primary input index. Together, equations (4), (7) and (8) represent a detailed decomposition of profit growth between t - 1 and t. |
| |
Note that by taking inputs as negative outputs, we are using value added (or gross operating surplus) type approach to output and productivity measurement rather than the gross output approach. In the following section, we will use both approaches for calculating productivity growth. Since the input base for KTFP growth is very much smaller than the input base for TFP growth, KTFPG will be very much greater than TFP growth.
The choice of the Törnqvist index over other index numbers has been motivated above by the ability to decompose it easily as the product of sub-indexes, as in equations (7) and (8). In addition, it can be shown that the Törnqvist index closely approximates the Fisher Ideal index, which has a slightly stronger justification from the axiomatic approach. This is a result in numerical analysis and does not depend on assumptions of optimising behaviour. Hence, there are strong reasons for the choice of the Törnqvist index over many other index-number formulae, and therefore a justification exists from the axiomatic approach to index numbers for the profit decomposition represented by equations (4), (7) and (8).
As we wish to consider changes in profit which only relate to industry changes in prices, productivity and inputs, we remove the effects of general inflation by dividing profit in each period by the that the purchaser of output n gets a benefit from his or her purchases |
| |
is positive, this means that the real wages received by this type of worker have increased going from period t - 1 to t. These benefits are made comparable over time by dividing by the natural numeraire price. |
| |
Section IV |
Results |
Growth, productivity and Price changes |
| |
To analyse the sources of profit growth using the above mentioned methodology, we used the data of Indian manufacturing sector pertaining to 2000 to 2006, collected from Prowess database, Centre for Monitoring Indian Economy (CMIE). It is a balanced panel of top 500 companies on the basis of their total assets. The production process is defined by a single output measured in terms of total sales, and four inputs indicated by 'raw materials stores and spares', 'power and fuel expenses', 'salaries and wages', and 'others'. 'Others' include labour charges, advertising expenses, marketing and distribution expenses.
Due to non availability of price information, all inputs and outputs are measured in terms of cost basis. So the data on all the inputs was divided by the appropriate price indices to get the equivalent quantities. Wholesale Price Index for Manufactured Products (WPI-MP) was used for output costs, wholesale price index for basic metals and others were used as raw material costs, wholesale price index for fuel, power, light and lubricants was used as price index for power, Consumer Price index for Industrial Workers (CPI-IW) was used for salaries, and CPI-IW for miscellaneous products was used for 'others'.
To analyse the changes in the productivity due to increase in size, the data was divided into four size classes on the basis of size of their total assets. The size classes were chosen so that there are almost equal numbers of companies in each size class. For each year, the companies with size of total assets less than or equal to Rs. 400 crore were taken in size class 1, companies with their total assets in the range of Rs. 400 crore to Rs. 800 crore were taken in size class 2, those with their assets in the range of Rs. 800 crore to Rs. 1200 crore were taken in size class 3 and companies with their assets greater than Rs. 1,200 crore were taken in size class 4.
Total factor productivity (TFP) measures the efficiency with which companies convert inputs into outputs. It differs from productivity concept of equation (3) in the sense that it is measured as a direct (rather than implicit) index of total output quantity formed from the one output component (sales) relative to a total input quantity index formed from the four inputs ('raw materials, stores and spares', 'power and fuel expenses', 'salaries and wages' and 'others'). As explained earlier, Törnqvist index was used for calculating both the input and output indices. The approach followed is the gross output approach for measuring productivity, rather than the value added approach as used in profit decomposition. It is evident from table 1 and Chart 2, that the TFP growth was 5.6 per cent higher in 2006 as compared to year 2000. |
| |
Table 1 : TFP using Output and Input Quantity Indices |
Year |
Input Quantity Index |
Output Quantity Index |
TFP |
Total Output Price |
Wholesale Price Index |
Labour Inputs Price |
1 |
2 |
3 |
4 |
5 |
6 |
7 |
2000 |
1.000 |
1.000 |
1.000 |
1.000 |
1.000 |
1.000 |
2001 |
1.081 |
1.067 |
0.988 |
1.178 |
1.072 |
1.037 |
2002 |
0.964 |
1.005 |
1.042 |
1.099 |
1.110 |
1.082 |
2003 |
0.968 |
1.066 |
1.102 |
1.105 |
1.148 |
1.126 |
2004 |
0.990 |
1.084 |
1.094 |
1.250 |
1.211 |
1.168 |
2005 |
1.132 |
1.105 |
0.976 |
1.334 |
1.289 |
1.215 |
2006 |
1.064 |
1.124 |
1.056 |
1.157 |
1.345 |
1.266 |
|
| |
 |
|
| Chart 3 presents changes in companies output and input price indices during 2000 to 2006. The overall price received by companies from the sales of its output increased by 16 per cent in 2006 as compared to year 2000. It is also interesting to note that the prices of outputs increased by a much faster rate since 2004. Over the same period, the wholesale price index increased by 34.5 per cent. |
| |
 |
| |
Sources of Change in Gross Return to Capital |
| |
In the remainder of the paper we use the term 'productivity' to refer to the 'capital total factor productivity' and denoted as ‘prod’ in figure 4 and 5 below. As can be seen from eq. (4) and (7), this allows for identification of impacts of changes in input prices also on profit growth. Now, we present sources of changes in real gross return to capital in table 2. Since the input base for KTFP growth is very much smaller than the input base for TFP growth, KTFPG will be very much greater than TFP growth. The KTFPG was 24 per cent higher in 2006 as compared to 2000. A large part of real gross return in 2006 came from improvement in productivity and increase in real output price.
Table 3 presents the percentage annual changes in real gross return to capital along with the percentage changes that could have occurred from each of the sources in isolation viz., size of input quantities, productivity and real output prices.
While all contributions happen simultaneously, the estimates thus have interpretations of being contributions to the real gross return to capital conditional on levels of others variables. Accordingly the fourth column of table 3 shows the year to year percentage change in real gross return to capital attributable to productivity change, the fifth column shows the percentage change in real gross return to capital attributable solely to changes in real output price and the last but one column shows the percentage change in the real gross return to capital attributable solely to changes in real input prices. Over the 6-year period, the real gross return to capital increased by an average 2 per cent per annum. As explained earlier, if there had been no productivity change and no change in real output and input prices but for the same growth in input quantities, the real gross return to capital would have increased by an average 1.5 per cent per annum. This means the actual increase in real gross return to capital has outpaced the growth in the size of the input quantities on average. |
| |
Table 2: Contributions to Real Gross Return to Capital |
Year |
Real Gross Return to Capital |
Contributions from |
Input Quantity Index |
Total Capital Productivity |
Real Output Price |
Real Input Price |
Labour Input Price |
1 |
2 |
3 |
4 |
5 |
6 |
7 |
2000 |
1.0000 |
1.0000 |
1.0000 |
1.0000 |
1.0000 |
1.0000 |
2001 |
1.0795 |
1.0834 |
0.9030 |
1.1778 |
0.9368 |
0.9884 |
2002 |
1.0265 |
0.9700 |
1.1720 |
1.0988 |
0.8217 |
0.9861 |
2003 |
1.0230 |
0.9790 |
1.3707 |
1.1050 |
0.6899 |
0.9888 |
2004 |
1.0988 |
0.9944 |
1.3720 |
1.2496 |
0.6445 |
0.9877 |
2005 |
1.0569 |
1.1317 |
0.8984 |
1.3342 |
0.7786 |
0.9880 |
2006 |
1.1129 |
1.0697 |
1.2410 |
1.1575 |
0.7246 |
0.9876 |
|
| |
Table 3: Annual changes in Real Gross Return to Capital |
Contributors to Annual Change in Real Gross Return to Capital |
Year |
Change in Real Gross Return to Capital |
Change in Real Gross Return to Capital solely due to |
Growth |
Total Capital Productivity |
Real Output Price |
Real Input Price |
Real Labour Price |
2001 |
7.95 |
8.34 |
-9.70 |
17.78 |
-6.32 |
-1.16 |
2002 |
-4.91 |
-10.46 |
29.80 |
-6.70 |
-12.29 |
-0.23 |
2003 |
-0.34 |
0.93 |
16.95 |
0.56 |
-16.04 |
0.28 |
2004 |
7.41 |
1.57 |
0.10 |
13.08 |
-6.58 |
-0.11 |
2005 |
-3.81 |
13.80 |
-34.52 |
6.77 |
20.81 |
0.03 |
2006 |
5.29 |
-5.47 |
38.13 |
-13.25 |
-6.94 |
-0.04 |
Average |
1.93 |
1.45 |
6.79 |
3.04 |
-4.56 |
-0.21 |
* Growth refers to % change in the primary input index Kt |
|
| |
| If all the benefits from productivity growth had been retained by the companies and there had been no growth in the input quantities and no change in real output and input prices then the real gross return to capital would have increased by 6.8 per cent per annum. In the absence of growth in the input quantities, productivity changes and the real labour price changes, real gross return to capital would have increased by 3 per cent per annum on average given the actual pattern of real output price changes. Finally, real input price changes in the absence of any other changes reduced real gross return to capital marginally by an average of 0.21 per cent annually. |
| |
 |
| |
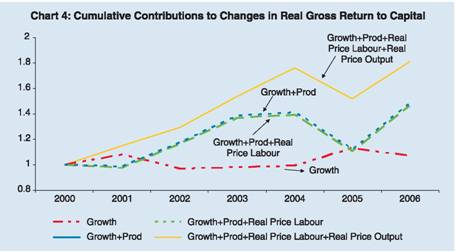
| The cumulative impact of growth, productivity and real price changes on real gross return to capital is shown in Chart 4. Here we take the real gross return to capital in 2000 as the base and look at the cumulative effect of the actual annual changes in each of the three sources of change and also look at the progressive impact of the sources of change on the real gross return to capital. The dashed line near the bottom of the figure shows what would have happened to the real gross return to capital over 6 years if there had been no productivity change and no change in real input and output prices. By 2006, the annual return to capital for that year would have been 6.97 per cent higher as compared to that in 2000. The small dashed line at the middle of the figure shows what would have happened to the real gross return to capital over the six years if there had been both the observed levels of growth and productivity change but no change in either real labour or average real output prices - by 2006, the annual real gross return to capital for that year would have been 48.37 per cent higher. The big dashed line at the middle of the figure shows what would have happened to the real gross return with growth, productivity and real price labour changes but no change in real output price. Finally, the solid line at the top of the figure shows the cumulative effect of all four contributors to changes in the real gross return to capital. |
| |
 |
| |
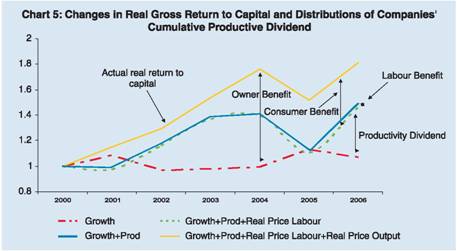
| Chart 5 shows the changes in real gross return to capital and distributions of companies' cumulative productive dividend. The gap between the 'Growth' and 'Growth+Prod' lines indicates the size of the potential contribution to companies' real gross return to capital from productivity improvements from 2000 onwards. The gap between the middle two lines shows the extent to which the benefits from companies' high productivity growth have been passed on to its labour force in the form of higher real wages (although this probably overstates the benefits to labour as it ignores skill and compositional changes). The large gap between the top (solid) line and the dashed line at the bottom of the chart indicates the extent to which the companies' owners have benefitted from the companies high productivity growth. The gap between the solid top line and small dashed line in the middle show the benefits of consumer from the companies' high productivity growth. |
| |
Table 4: Cumulative Productivity Dividend |
Year |
Cumulative Real Return Due to |
Productivity Dividend |
Growth |
Growth +Prod |
(2) +Real Price Labour |
(3)+Real Price Output |
Total |
To Labour |
To Consumer |
To Owner |
| |
(1) |
(2) |
(3) |
(4) |
(5)=(2)-(1) |
(6)=(2)-(3) |
(7)=(3)-(4) |
(8)=(4)-(1) |
2000 |
1.000 |
1.000 |
1.000 |
1.000 |
|
|
|
|
2001 |
1.083 |
0.986 |
0.975 |
1.153 |
-0.097 |
0.012 |
-0.178 |
0.069 |
2002 |
0.970 |
1.177 |
1.161 |
1.296 |
0.207 |
0.016 |
-0.135 |
0.325 |
2003 |
0.979 |
1.388 |
1.372 |
1.538 |
0.408 |
0.016 |
-0.166 |
0.559 |
2004 |
0.994 |
1.411 |
1.393 |
1.763 |
0.416 |
0.018 |
-0.370 |
0.769 |
2005 |
1.132 |
1.118 |
1.105 |
1.518 |
-0.013 |
0.014 |
-0.413 |
0.386 |
2006 |
1.070 |
1.484 |
1.465 |
1.812 |
0.414 |
0.018 |
-0.346 |
0.742 |
|
| |
Table 4 shows the cumulative productivity dividend over the period 2001 to 2006 for productivity change in the year 2000. The companies have not passed the benefit from productivity improvement to consumers as there is reduction of around 84 per cent in this benefit as compared to 2000. However, owners have benefitted in abundance from the productivity changes since 2000 as 179 per cent of the benefits have been passed on to the owners in the form of increased rate of return. Benefits of around 4.5 per cent have been passed on to the labour (in the form of increased salaries). This, however, overstates the benefit to the labour as skill and compositional changes are ignored. |
| |
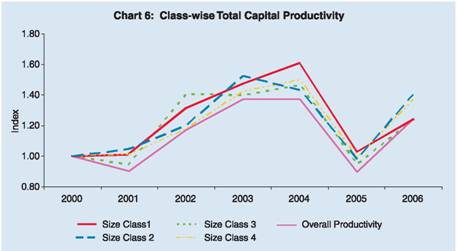
| Class-wise comparisons (Chart 6) shows that the 'productivity' indices for different classes follow almost the same pattern as the overall productivity. The productivity growth of smaller companies (companies belonging to size class 1) on, an average, is found to be 6.23 per cent. For size class 2, size class 3 and size class 4 companies, the average productivity growth during the period 2000-2006 were 8.59 per cent, 7.12 per cent and 8.03 per cent, respectively, indicating that the productivity growth in size class 2 companies was the highest as compared to the companies belonging to other size classes. |
| |
 |
| |
Over the 6-year period, the real gross return to capital increased by an average 0.74 per cent per annum for companies belonging to size class 1, 4.24 per cent for the companies belonging to size class 2, 1.95 per cent for companies belonging to size class 3 and 5.05 per cent for the companies belonging to size class 4. The highest increase in real gross return to capital was experienced by the large sized companies. If there had been no productivity change and no change in real output and labour prices but for the same growth in input quantities occurred then the real gross return to capital would have been the highest for size class 3 and size class 4 companies (it was 0.36 per cent for size class 1 companies, 1.86 per cent in size class 2 companies, 2.77 per cent in size class 3 companies and 2.8 per cent for size class 4 companies). This also means that the actual increase in real gross return to capital has outpaced the growth in the size of the input quantities on average for all size classes except size class 3 companies.
If all the benefits from productivity growth had been retained by the companies and there had been no growth in the input quantities and no change in real output and labour prices then the real gross return to capital would have increased for large sized companies (6.23 per cent per annum for size class 1 companies, 8.59 per cent for size class 2 companies, 7.12 per cent for size class 3 companies and 8.03 per cent for size class 4 companies). In the absence of growth in the input quantities, productivity changes and the real labour price changes, the real gross return to capital would have increased largely for size class 2 companies (3.5 per cent for size class 1 companies, 7.06 per cent for size class 2 companies, 3.62 per cent for size class 3 companies and 2.97 per cent for size class 4 companies) on average given the actual pattern of real output price changes. Finally, real labour price changes in size class 1 companies would have reduced majorly, (in the absence of any other changes) real gross return to capital by an average of 0.33 per cent annually as compared to other size classes (for size class 2, the annual reduction would have been 0.18 per cent, for size class 3 companies, the annual reduction would have been 0.22 per cent, and for size class 4 companies, the annual reduction would have been 0.14 per cent). |
| |
Table 5: Contributors to Changes in Real Gross Return to Capital |
Size Classes |
Change in Real Gross Return to Capital |
Change in Real Gross Return to Capital solely due to |
Growth |
Total Capital Produ ctivity |
Real Output Price |
Real Input Price |
Real Labour Price |
1 |
2 |
3 |
4 |
5 |
6 |
7 |
Size Class 1 |
0.74 |
0.36 |
6.23 |
3.48 |
-4.22 |
-0.33 |
Size Class 2 |
4.24 |
1.86 |
8.59 |
7.06 |
-4.24 |
-0.18 |
Size Class 3 |
1.95 |
2.77 |
7.12 |
3.62 |
-3.90 |
-0.22 |
Size Class 4 |
5.05 |
2.80 |
8.03 |
2.97 |
-3.15 |
-0.14 |
|
| |
Section V |
Concluding Observations |
| |
During recent period, Indian manufacturing companies achieved high growth in profits. It is, therefore, important to examine trends in profit achieved by the companies and the impact of the factors leading to higher profit for the companies in India. In the paper, the method for decomposing changes in companies’ real gross return to capital into contributions from changes in productivity, prices and input growth have been applied to Indian manufacturing companies' database for the period from 2000-2006. The decomposition of profits provides means of quantifying the distribution of benefits from productivity and real price changes. If one group, be it consumers or owners, capture all the benefits then it is detrimental for the sustainability of the reform process.
The productivity of Indian manufacturing companies was found to be 24 per cent higher in 2006 as compared to that in 2000. It was found that the actual increase in companies' profit has outpaced the growth in the size of the input quantities on average. Had the benefits from productivity growth been retained by the companies, without any changes in the input quantities and real output and input prices then the profit of the companies would have increased by 6.8 per cent per annum. Changes in output prices only would have increased the profit by 3 per cent per annum on average given the actual pattern of real output price changes. Finally, real input price changes in the absence of any other changes would have reduced the profit marginally by an average of 0.21 per cent annually.
It was found that the companies have not passed the benefit from productivity improvement to consumers as there is reduction of around 84 per cent in this benefit in the 2006 as compared to 2000. However, owners have benefitted at the cost of consumers in abundance from the productivity changes since 2000 as 179 per cent of the benefits have been passed on to the owners in the form of increased rate of return. Benefits of around 4.5 per cent have been passed on to the labour (in the form of increased salaries).
Size class wise comparisons show that the highest increase in profit was experienced by the large sized companies (companies with asset size more that Rs. 1200 crore). The actual increase in profits has outpaced the growth in the size of the input quantities on average for all size classes except size class 3 companies (companies with asset size in the range of Rs 800 to Rs. 1200 crore).Some assumptions were made here to make the analysis practical. In absence of exact price information on inputs and outputs, appropriate price indices were used. We assumed that inter-temporal variation in selected price indices will capture the price change of inputs and outputs. We also assumed that the type and quality of both inputs and outputs used remains constant over time. This in a way will underestimate the consumer benefit as no allowance was made for the increased utility associated with an increase in the consumer's choice set. Conversely, the extent of benefits flowing to labour was likely to be overestimated as no allowance was made for increase in average skill levels associated with technological change and downsizing. |
| |
References: |
| |
Ahluwalia, I. J. (1985), Industrial Growth in India, Stagnation since mid-sixties, Delhi: Oxford University Press.
Ahluwalia, I. J. (1991), Productivity and Growth in Indian Manufacturing, Delhi: Oxford University Press.
Balakrishnan, P. and K. Pushpangandan (1994), “ TFP Growth in Manufacturing Industry: A Fresh Look, Economic and Political Weekly, 31, 2028-2035.
Törnqvist, L. (1936), “The Bank of Finland’s Consumption Price Index”, Bank of Finland Monthly Bulletin, 10, 1-8.
Rao, J. M. (1996a), “Manufacturing Productivity Growth: Method and Measurement”, Economic and Political Weekly, 31, 2927–36.
Rao, J. M. (1996b), ‘Indices of Industrial Productivity Growth: Disaggrega-tion and Interpretation’, Economic and Political Weekly, 31, 3177–88.
Topalova, Petia (2003), “Trade Liberalisation and Firm Productivity: The Case of India”, Yale University, available at www.econ.yale.edu/seminars.
Tata Services Limited (2003), “Reforms and Productivity Trends in Indian Manufacturing Sector”, Department of Economics and Statistics, Tata Services Limited, Mumbai.
Unel, Bulent, “Productivity Trends in India’s Manufacturing Sectors in the last Two Decades”, IMF Working Paper No. WP/03/22.
Krishna, P. and D. Mitra (1998), “Trade Liberalisation, Market Discipline and Productivity Growth: New Evidence from India”, Journal of Development Economics, 56, 447-462.
Lawrence, Denis. , W. Erwin. Diewert and Kevin. J. Fox. (2006), ‘The Contributions to Productivity, Price Changes and Firm Size to Profitability’, Journal of Productivity Analysis, 26, 1-13.
Chand, S and K. Sen (2002), “Trade Liberalisation and Productivity Growth: Evidence from Indian Manufacturing”, Review of Development Economics, 6, 120-132.
Das, D.K. (2003), “Manufacturing Productivity Under Varying Trade Regimes: India in the 1980s and 1990s”, Working Paper No. 107, ICRIER.
Dholakia, R.H. and D. Kapur (2001), “Economic Reforms and Trade Performance: Private Corporate Sector in India”, Economic and Political Weekly, 36, 4560-4566.
Reserve Bank of India (2004), “Report on Currency and Finance, 2002-03”.
Goldar, Bishwanath (2004), “Productivity Trends in Indian Manufacturing in the Pre-and Post-Reform Periods” Working Paper No. 137, ICRIER.
Kato Atsushi (2005), “Product Market Competition and Productivity in Indian Manufacturing Industry”, Working Paper Series No. E/263, Institute of Economic Growth.
|
|