This article reviews India’s merchandise trade
performance during 2011-12 on the basis of data
released by the Directorate General of Commercial
Intelligence and Statistics (DGCI&S). It also analyses
disaggregated commodity-wise and direction-wise
details for the period 2011-12 (April-December).
Highlights
-
During 2011-12, exports stood at US$ 303.7 billion
and recorded a growth of 20.9 per cent as compared
with an increase of 40.5 per cent during the
previous year. While the exports performed well
during the first half of 2011-12, there was
significant deceleration in the second half as global
trading conditions deteriorated mainly reflecting
weakening of world demand inter alia caused by
euro zone crisis.
-
During 2011-12, imports at US$ 488.6 billion
registered a growth of 32.1 per cent as compared
with 28.2 per cent in the preceding year. There
has been a significant rise in import of petroleum,
oil and lubricants (POL), gold and silver and
machinery.
-
Petroleum, oil and lubricants (POL) imports at US$
155.6 billion in 2011-12 showed a higher growth
of 46.9 per cent, largely reflecting increase in
international crude oil prices, as compared with
21.6 per cent a year ago. The average price of
Indian basket of crude oil during 2011-12 stood at
US$ 111.6 per barrel, which was 31.1 per cent
higher than US$ 85.1 per barrel during 2010-11.
-
Gold and silver import at US$ 61.5 billion recorded
a growth of 44.4 per cent during 2011-12 as
compared with 43.5 per cent in 2010-11.
-
Non-oil non-gold & silver imports during 2011-12
at US$ 271.5 billion recorded a growth of 22.7 per
cent as compared with 29.0 per cent in the
preceding year.
-
Trade deficit during 2011-12 amounted to US$
184.9 billion, as compared with US$ 118.7 billion
during 2010-11.
-
The disaggregated data on commodity-wise
merchandise exports indicate that during 2011-12
(April-December), engineering goods, petroleum
products, chemicals, textiles, gems & jewellery and
agricultural products contributed more than 88
per cent of India’s exports.
-
While the share of exports to countries of
European Union in India’s total merchandise
exports declined marginally, the same of OPEC
countries declined by around two percentage point
during April-December 2011 over April-December
2010.
India’s Merchandise Trade during 2011-12
Exports
Export growth on monthly basis (year-on-year)
remained robust in the first half reflecting the
continued impact of export promotional measures
announced by the government. However, after peaking
in July 2011, monthly export growth started moderating
thereafter. In the second half of 2011-12, export growth
was as low as 5.1 per cent as compared with 43.9 per
cent in the first half (Chart 1).
Exports during 2011-12 stood at US$ 303.7 billion,
recording a lower growth of 20.9 per cent as compared
with an increase of 40.5 per cent during 2010-11
(Table 1 and Statement 1). Despite the rupee depreciation
in the second half of 2011-12, export growth showed
significant moderation mainly attributed to the
slowdown in global trade caused by dismal economic
and financial conditions in the US and euro zone
economies. Withdrawal of certain export incentives
(e.g., Duty Entitlement Passbook Scheme w.e.f. October
2011) might also have affected performance of certain
export products.
As per the commodity-wise exports data available
during 2011-12 (April-December), the share of
manufacturing sector in total merchandise exports declined from 63.0 per cent in April-December 2010 to
60.6 per cent in April-December 2011. In contrast, the
respective shares of petroleum products and primary
products increased during the period (Table 2). Within
manufacturing sector, the share of engineering goods and textile & textile products declined. Exports of
engineering goods seem to have been severely affected
during the second half as growth in exports from this
sector was significantly lower at 16.8 per cent during
April-December 2011 as compared with 49.5 per cent
during April-December 2010. Within engineering sector,
growth in exports of transport equipment, manufactures
of metals and iron and steel was significantly hit while
that of electronic goods moderated marginally.
Table 1: India's Merchandise Trade |
(US$ billion) |
Items |
2010-11 R |
2011-12 P |
| |
April - March |
1 |
2 |
3 |
Exports |
251.1 |
303.7 |
| |
(40.5) |
(20.9) |
Oil Exports |
41.4 |
– |
| |
(46.9) |
– |
Non-oil Exports |
209.7 |
– |
| |
(39.3) |
– |
Imports |
369.8 |
488.6 |
| |
(28.2) |
(32.1) |
Oil Imports |
106 |
155.6 |
| |
(21.6) |
(46.9) |
Non-oil Imports |
263.8 |
333.0 |
| |
(31.1) |
(26.2) |
Gold and Silver Import |
42.5 |
61.5 |
| |
(43.5) |
(44.4) |
Non-oil Non-gold & Silver Import |
221.3 |
271.5 |
| |
(29.0) |
(22.7) |
Trade Balance |
-118.7 |
-184.9 |
Oil Trade Balance |
-64.6 |
– |
Non-Oil Trade Balance |
-54.1 |
– |
R: Revised. P: Provisional. - : Not Available.
Note : Figures in parentheses show percentage change over the corresponding period of the previous year.
Source : Compiled from Ministry of Commerce and Industry and
DGCI&S data. |
Table 2: India’s Exports of Principal Commodities |
(Percentage Shares) |
Commodity Group |
2009-10 |
2010-11 |
2010-11 |
2011-12 |
April-March |
April-December |
1 |
2 |
3 |
4 |
5 |
I. Primary Products |
14.8 |
13.9 |
13.3 |
13.8 |
Agriculture and Allied Products |
9.9 |
9.8 |
9.4 |
11.2 |
Ores and Minerals |
4.8 |
4.1 |
3.8 |
2.6 |
II. Manufactured Goods |
64.4 |
65.4 |
63.0 |
60.6 |
Leather and Manufactures |
1.9 |
1.5 |
1.6 |
1.6 |
Chemicals and Related Products |
12.8 |
11.5 |
11.7 |
12.0 |
Engineering Goods |
21.4 |
27.4 |
24.5 |
21.9 |
Textiles and Textile Products |
11.1 |
9.3 |
9.7 |
9.0 |
Gems and Jewellery |
16.2 |
14.7 |
14.6 |
15.1 |
III. Petroleum Products |
15.8 |
16.5 |
16.2 |
19.1 |
IV. Others |
5.0 |
4.2 |
7.6 |
6.4 |
Total Exports |
100 |
100 |
100 |
100 |
Source: Compiled from DGCI&S data. |
Within manufacturing, other commodity groups,
viz., leather & manufactures, chemicals & related
products and textile & textile products witnessed higher
growth during April-December 2011 as compared with
the corresponding period of 2010-11. Exports of
petroleum products also grew by 54.2 per cent during
April-December 2011 as against 44.9 per cent in
corresponding period of 2010-11.Within primary
products, exports of ores and minerals continued to
show decline (Statement 2). Decline in exports of iron
ore was mainly due to multiple problems pertaining to
prolonged ban on mining in Karnataka, restriction on
mining in Orissa and Goa, high export duty, differential
railway freight and slowdown in international iron ore
prices. The government had hiked the export duty on
iron ore to 30 per cent in December 2011 from 20 per
cent.
During the 2011-12 (April-December), the share
of European Union and OPEC countries in India’s
exports declined as compared to April-December 2010
(Table 3). However, share of developing countries was
marginally higher during the period. Destination-wise, exports during 2011-12 (April-December) indicate that
the UAE continued to remain the biggest destination
for Indian goods with a share of 11.6 per cent, followed
by the US (11.1 per cent), Singapore and China (5.8 per
cent each) and Hong Kong (4.1 per cent). These five
countries together accounted for around 38 per cent of
India’s total exports during April-December 2011. In
spite of uncertainties prevailing in Europe, India’s
exports to Germany, U.K, Netherlands and Belgium
grew during April-December 2011 while the same to
France showed a decline of 5.8 per cent. Growth in
exports to Japan, SAARC region, Africa and some Latin
American countries showed moderation (Statement 3).
Table 3: India’s Exports to Principal Regions |
(Percentage Shares) |
Region/Country |
2009-10 |
2010-11 |
2010-11 |
2011-12 |
April-
March |
April-
December |
1 |
2 |
3 |
4 |
5 |
I. OECD Countries |
35.9 |
33.6 |
32.9 |
33.6 |
EU |
20.1 |
18.6 |
17.9 |
17.5 |
North America |
11.5 |
10.7 |
10.7 |
11.7 |
US |
10.9 |
10.2 |
10.2 |
11.1 |
Asia and Oceania |
2.9 |
2.8 |
2.9 |
2.7 |
Other OECD Countries |
1.3 |
1.5 |
1.4 |
1.7 |
II. OPEC |
21.1 |
22.3 |
20.6 |
18.5 |
III. Eastern Europe |
1.0 |
1.2 |
1.1 |
1.1 |
IV. Developing Countries |
39.2 |
41.5 |
39.3 |
40.3 |
Asia |
29.8 |
30.9 |
28.6 |
29.3 |
SAARC |
4.7 |
5.1 |
4.6 |
4.1 |
Other Asian Developing Countries |
25.1 |
25.8 |
24.0 |
25.2 |
People’s Republic of China |
6.5 |
7.8 |
6.8 |
5.8 |
Africa |
5.8 |
6.6 |
6.6 |
6.6 |
Latin America |
3.6 |
4.0 |
4.1 |
4.4 |
V. Others / Unspecified |
2.8 |
1.4 |
6.2 |
6.5 |
Total Exports |
100 |
100 |
100 |
100 |
Source: Compiled from DGCI&S data. |
Imports
During 2011-12, imports at US$ 488.6 billion
registered a growth of 32.1 per cent (28.2 per cent a
year ago) [Statement 2]. Import growth was primarily
led by a spurt in POL, gold & silver and capital goods.
During 2011-12, the POL imports at US$ 155.6 billion
showed a higher growth of 46.9 per cent (21.6 per cent
in 2010-11), reflecting increase in international crude
oil prices. The average price of Indian basket of crude
oil during 2011-12 stood at US$ 111.6 per barrel which
was 31.1 per cent higher than US$ 85.1 per barrel during
2010-11 (Table 4). However, non-oil non-gold & silver
imports at US$ 271.5 billion witnessed a lower growth
of 22.7 per cent during 2011-12 as compared with 29.0
per cent in 2010-11. As per the latest available data on
commodity-wise imports for 2011-12 (April-December),
petroleum and petroleum products continued to be a
major item of India’s imports, followed by capital goods
and gold & silver. Petroleum, petroleum products and
related material accounted for nearly 30.6 per cent of
India’s total merchandise imports. Import of gold &
silver showed a significantly higher growth of 55.1 per
cent as compared with 53.2 per cent in 2010-11. Higher
growth in imports of gold in value terms (50.9 per cent)
than that in international prices (29.0 per cent) during
April-December 2011 reflects that price as well quantum
factors led to surge in imports of gold during this period
(Statement 4).
Table 4: Trends in Crude Oil Prices |
(US$/barrel) |
Period |
Dubai |
Brent |
WTI* |
Indian
Basket** |
1 |
2 |
3 |
4 |
5 |
2001-02 |
21.9 |
23.3 |
24.1 |
22.5 |
2002-03 |
25.8 |
27.6 |
29.2 |
26.7 |
2003-04 |
26.8 |
29.1 |
31.4 |
28.0 |
2004-05 |
36.4 |
42.2 |
45.0 |
39.2 |
2005-06 |
53.5 |
58.2 |
59.8 |
55.7 |
2006-07 |
61.0 |
64.3 |
64.7 |
62.5 |
2007-08 |
77.3 |
82.3 |
82.1 |
79.2 |
2008-09 |
82.1 |
84.8 |
85.8 |
83.6 |
2009-10 |
69.5 |
69.8 |
70.5 |
69.8 |
2010-11 |
86.7 |
84.2 |
83.3 |
85.1 |
2011-12 |
110.0 |
114.4 |
97.3 |
111.6 |
* West Texas Intermediate.
** The composition of Indian Basket of Crude represents Average of Oman & Dubai for sour grades and Brent (Dated) for sweet grade in the ratio of 65.2:34.8 w.e.f. April 1, 2011.
Sources : International Monetary Fund, International Financial
Statistics; World Bank’s Commodity Price Pink Sheet; Ministry
of Petroleum and Natural Gas, Government of India. |
Non-oil imports during 2011-12 (April-December)
at US$ 251.2 billion witnessed a growth of 29.5 per cent as against 33.2 per cent during 2010-11. Deceleration
in non-oil imports was mainly on account of deceleration/
decline in growth of imports of export related items
and certain bulk items, viz., sugar, iron & steel. Import
growth in most of export-related items (viz., pearls,
precious and semi-precious stones and chemicals) was
lower. Imports growth in most of the categories of
capital goods was higher during April-December 2011-
12 than the corresponding period of 2010-11 (Table 5 and Statement 4).
Table 5: Imports of Principal Commodities |
(Percentage Shares) |
Commodity/Group |
2009-
10 |
2010-
11 |
2010-
11 |
2011-
12 |
April-
March |
April-
December |
1 |
2 |
3 |
4 |
5 |
1 Petroleum, Crude and Products |
30.2 |
28.7 |
27.9 |
30.6 |
2 Capital Goods |
22.8 |
21.2 |
21.7 |
19.9 |
3 Gold and Silver |
10.3 |
11.5 |
11.0 |
12.6 |
4 Organic and Inorganic Chemicals |
4.1 |
4.1 |
4.2 |
3.9 |
5 Coal, Coke and Briquettes, etc. |
3.1 |
2.7 |
2.9 |
3.7 |
6 Fertilisers |
2.4 |
1.9 |
2.3 |
2.6 |
7 Metalliferrous Ores, Metal Scrap, etc. |
2.7 |
2.6 |
2.7 |
2.8 |
8 Iron and Steel |
2.9 |
2.8 |
2.9 |
2.5 |
9 Pearls, Precious and Semi-Precious Stones |
5.6 |
9.4 |
8.4 |
6.7 |
10 Others |
15.9 |
15.1 |
15.9 |
14.6 |
Total Imports |
100 |
100 |
100 |
100 |
Source: Compiled from DGCI&S data. |
During 2011-12 (April-December), share of
European Union in India’s total imports declined
marginally to 11.9 per cent from 12.1 per cent during
the same period of 2010-11. On the other hand, the
share of OPEC group of countries, Africa and developing
countries rose during April-December 2011-12
(Table 6). Country-wise, China continued to be the
largest source of imports with a share of 12.4 per cent
in total imports, followed by the UAE, Switzerland,
Saudi Arabia and the US. These five countries together
constituted around 37.5 per cent of India’s imports.
During April-December 2011, growth in imports from
OPEC countries, viz., Iraq, Indonesia, Kuwait and Saudi
Arabia recorded a sharp increase while growth in
imports from UAE decelerated sharply (Statement 5).
Iraq replaced Iran as India’s second-largest crude oil
supplier in 2011-12 (Wall Street Journal, May 16, 2012).
Table 6: Shares of Groups/Countries in India’s Imports |
(Percentage Shares) |
Region/Country |
2009-10 |
2010-11 |
2010-11 |
2011-12 |
April-March |
April-December |
1 |
2 |
3 |
4 |
5 |
I. OECD Countries |
32.6 |
30.6 |
31.0 |
30.0 |
EU |
13.3 |
12.0 |
12.1 |
11.9 |
France |
1.4 |
1.0 |
1.0 |
0.8 |
Germany |
3.6 |
3.2 |
3.3 |
3.3 |
UK |
1.5 |
1.5 |
1.5 |
1.7 |
North America |
6.6 |
6.0 |
6.4 |
5.5 |
US |
5.9 |
5.4 |
5.7 |
5.0 |
Asia and Oceania |
6.8 |
5.4 |
5.7 |
5.7 |
Other OECD Countries |
5.9 |
7.2 |
6.8 |
6.9 |
II. OPEC |
32.0 |
33.6 |
33.0 |
34.6 |
III. Eastern Europe |
2.1 |
1.5 |
1.6 |
1.6 |
IV. Developing Countries |
32.5 |
33.0 |
33.6 |
33.4 |
Asia |
25.6 |
27.1 |
27.5 |
27.0 |
SAARC |
0.6 |
0.6 |
0.6 |
0.5 |
Other Asian Developing Countries |
25.1 |
26.5 |
26.9 |
26.5 |
Of which: |
|
|
|
|
People’s Republic of China |
10.7 |
11.8 |
12.3 |
12.4 |
Africa |
4.3 |
3.6 |
3.8 |
4.1 |
Latin America |
2.6 |
2.4 |
2.4 |
2.3 |
V. Others / Unspecified |
0.7 |
1.3 |
0.8 |
0.4 |
Total Imports |
100.0 |
100.0 |
100.0 |
100.0 |
Source: Compiled from DGCI&S data. |
Trade Deficit
The trade deficit during 2011-12 stood higher at
US$ 184.9 billion than US$ 118.7 billion during 2010-11
(Statement 1) mainly on account of large imports of
POL and gold & silver accounting for 44.4 per cent of
India’s imports. Trade deficit during 2011-12 was 55.8
per cent higher than the level recorded in 2010-11.
Global Trade
According to the International Monetary Fund’s
International Financial Statistics (May 2012 update),
the value of world merchandise export grew by 15.1
per cent during April-February 2011-12, lower than 20.6
per cent during April-February 2010-11 (Chart 2).
According to the WTO, India had the fastest export
growth among major economies in 2011, followed by
China with the second fastest export growth at 9.3 per
cent. World trade growth in 2011 was weighed down
by the ongoing sovereign debt crisis in eurozone
economies, supply chain disruptions from natural
disasters in Japan and Thailand, and turmoil in Arab
countries. As a result, global export growth remained
lower than anticipated in most advanced economies in
2011. In its latest WEO update of April 2012, the IMF
has revised the projections of growth in export volume
downwardly for advanced economies to 2.3 per cent
from the earlier projection of 2.4 per cent (in January
2012) for 2012 whereas the same has been revised upwardly in case of emerging and developing economies
to 6.6 per cent from 6.1 per cent.
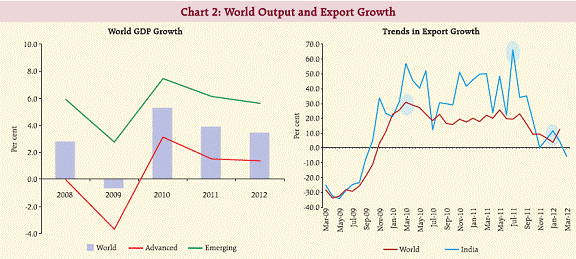 |
Cross-country comparison of export performance
indicates that India’s export growth was largest among
the major advanced and emerging economies during
2011 (Table 7). Further, India’s share in world export
also showed some improvement during the recent
period. Going forward, downward risks to India’s
exports continue on account of steeper than expected
downturn in Europe, financial contagion related to the
sovereign debt crisis, rapidly rising oil prices and
geopolitical risks.
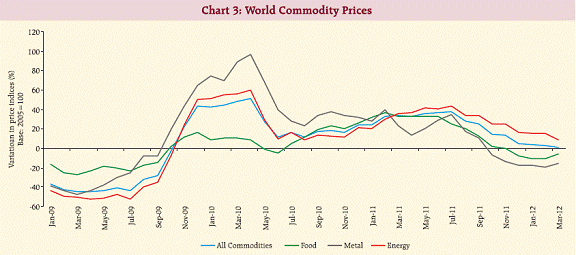
World Commodity Prices
During the second half of 2011, growth in world
commodity prices moderated. The average growth in
all commodities prices (on Y-on-Y) was lower at 20.9
per cent during H2 of 2011 as compared with 32.9 per
cent during H1 of 2011. Fall in commodity prices was
mainly on account of continued concerns about global
demand. Metals prices fell sharply from 25.6 per cent
in H1 of 2011 to 4.2 per cent in H2 mainly on account
of slowdown in world output. The leading factor behind
the commodity price declines in 2011 was higher-thanusual
uncertainty about near-term global economic
prospects. In 2011, growth in emerging and developing
economies slowed more than expected, and the
slowdown in the Chinese real estate market has renewed concerns about a hard landing there. In the
first three months of 2012, growth in major commodities
was either lower or turned negative as concerns relating
to world economy intensified. However, within energy
prices, crude oil prices have shown divergent trend
from that in broader commodity prices in recent
months. International crude oil prices broadly showed rising trend mainly due to geopolitical uncertainties
prevailing in some of the oil supplier countries. In its
World Economic Outlook in April 2012, the IMF
projected non-fuel commodity prices to fall by 10.3 per
cent in 2012. Going forward, growth in major Asian
economies will be one of the factors determining
international commodity prices.
Table 7: Growth rates and shares of Exports: Cross-Country Comparison |
(Per cent) |
Region/Country |
2009 |
2010 |
2011 |
2009 |
2010 |
2011 |
Growth Rates
(January-December) |
Share
(January-December) |
1 |
2 |
3 |
4 |
5 |
6 |
7 |
World |
-21.2 |
22.3 |
17.4 |
100.0 |
100.0 |
100.0 |
Advanced Economies |
-20.3 |
18.4 |
16.1 |
63.2 |
61.2 |
60.4 |
United States |
-17.3 |
21.1 |
16.0 |
8.5 |
8.5 |
8.4 |
France |
-20.6 |
8.7 |
13.5 |
3.8 |
3.4 |
3.3 |
Germany |
-21.1 |
12.8 |
17.5 |
9.1 |
8.4 |
8.3 |
Japan |
-24.6 |
34.2 |
7.1 |
4.7 |
5.1 |
4.7 |
Emerging and Developing Countries |
-22.5 |
29.0 |
19.1 |
37.2 |
39.2 |
39.8 |
Singapore |
-18.0 |
31.2 |
16.8 |
2.2 |
2.3 |
2.3 |
China, P.R.: Mainland |
-15.7 |
32.2 |
20.7 |
9.7 |
10.4 |
10.7 |
India |
-11.1 |
35.7 |
33.3 |
1.3 |
1.5 |
1.7 |
Indonesia |
-12.3 |
33.1 |
28.7 |
1.0 |
1.0 |
1.1 |
Korea, Republic of |
-12.4 |
29.1 |
19.8 |
2.9 |
3.1 |
3.1 |
Malaysia |
-19.3 |
27.9 |
14.5 |
1.3 |
1.3 |
1.3 |
Thailand |
-12.1 |
29.4 |
16.7 |
1.2 |
1.3 |
1.3 |
Source: (1) IMF (www.imfstatistics.org).
(2) DGCI&S for India. |
 |
Statement 1: India's Foreign Trade |
Year |
Exports |
Imports |
Trade Balance |
Total |
Oil |
Non-Oil |
Total |
Oil |
Non-Oil |
Total |
Oil |
Non-Oil |
| |
1 |
2 |
3 |
4 |
5 |
6 |
7 |
8 |
9 |
April-December |
Rupees crore |
2009-10 |
8,45,534 |
1,32,899 |
7,12,635 |
13,63,736 |
4,11,649 |
9,52,086 |
-5,18,202 |
-2,78,750 |
-2,39,452 |
| |
(0.6) |
(7.7) |
(-0.7) |
(-0.8) |
(-2.0) |
(-0.2) |
|
|
|
2010-11 R |
11,42,922 |
1,88,443 |
9,54,479 |
16,83,467 |
4,82,282 |
12,01,185 |
-5,40,545 |
-2,93,838 |
-2,46,707 |
| |
(35.2) |
(41.8) |
(33.9) |
(23.4) |
(17.2) |
(26.2) |
|
|
|
2011-12 P |
14,54,066 |
– |
– |
23,42,217 |
7,46,335 |
15,95,881 |
-8,88,151 |
|
|
| |
(27.2) |
|
|
(39.1) |
(54.8) |
(32.9) |
|
|
|
US dollar million |
2009-10 |
1,78,751 |
28,192 |
1,50,559 |
2,88,373 |
87,136 |
2,01,237 |
-1,09,621 |
-58,944 |
-50,678 |
| |
(-3.5) |
(2.3) |
(-4.6) |
(-5.0) |
(-7.0) |
(-4.2) |
|
|
|
2010-11 R |
2,51,136 |
41,404 |
2,09,733 |
3,69,769 |
1,05,964 |
2,63,805 |
-1,18,633 |
-64,561 |
-54,072 |
| |
(40.5) |
(46.9) |
(39.3) |
(28.2) |
(21.6) |
(31.1) |
|
|
|
2011-12 P |
3,03,719 |
– |
– |
4,88,640 |
1,55,639 |
3,33,001 |
-1,84,922 |
|
|
| |
(20.9) |
|
|
(32.1) |
(46.9) |
(26.2) |
|
|
|
P: Provisional. R: Revised. – Not available.
Notes : 1. Figures in brackets relate to percentage variation over the corresponding period of the previous year.
2. Data conversion has been done using period average exchange rates.
Source : DGCI & S. |
Statement 2: India's Exports of Principal Commodities |
(US $ million) |
Commodity/Group |
April-December |
Percentage Variation |
2009-10 |
2010-11R |
2011-12 P |
(2)/(1) |
(3)/(2) |
| |
1 |
2 |
3 |
4 |
5 |
I. Primary Products |
18,051.0 |
23,172.3 |
31,571.7 |
28.4 |
36.2 |
| |
(14.2) |
(13.3) |
(13.8) |
|
|
A. Agricultural & Allied Products |
12,385.4 |
16,499.8 |
25,535.2 |
33.2 |
54.8 |
| |
(9.7) |
(9.4) |
(11.2) |
|
|
Of which : |
|
|
|
|
|
1. Tea |
455.3 |
557.8 |
719.2 |
22.5 |
28.9 |
2. Coffee |
288.2 |
408.9 |
655.5 |
41.9 |
60.3 |
3. Rice |
1,783.0 |
1,726.6 |
3,246.2 |
-3.2 |
88.0 |
4. Wheat |
0.0 |
0.1 |
143.8 |
- |
- |
5. Cotton Raw incl. Waste |
1,039.1 |
2,018.0 |
2,576.9 |
94.2 |
27.7 |
6. Tobacco |
691.0 |
653.7 |
576.7 |
-5.4 |
-11.8 |
7. Cashew incl. CSNL |
453.5 |
435.5 |
714.5 |
-4.0 |
64.1 |
8. Spices |
940.4 |
1,258.5 |
2,055.7 |
33.8 |
63.3 |
9. Oil Meal |
1,180.6 |
1,519.0 |
1,748.6 |
28.7 |
15.1 |
10. Marine Products |
1,583.3 |
1,990.5 |
2,777.1 |
25.7 |
39.5 |
11. Sugar & Molasses |
19.9 |
578.3 |
1,306.5 |
- |
125.9 |
B. Ores & Minerals |
5,665.5 |
6,672.6 |
6,036.5 |
17.8 |
-9.5 |
| |
(4.5) |
(3.8) |
(2.6) |
|
|
Of which : |
|
|
|
|
|
1. Iron Ore |
3,774.3 |
3,902.2 |
3,352.8 |
3.4 |
-14.1 |
2. Processed Minerals |
891.0 |
1,780.8 |
1,296.4 |
99.9 |
-27.2 |
II. Manufactured Goods |
82,932.7 |
1,10,094.6 |
1,38,286.0 |
32.8 |
25.6 |
| |
(65.2) |
(63.0) |
(60.6) |
|
|
Of which : |
|
|
|
|
|
A. Leather & Manufactures |
2,454.0 |
2,737.5 |
3,613.1 |
11.6 |
32.0 |
B. Chemicals & Related Products |
16,391.4 |
20,422.2 |
27,375.2 |
24.6 |
34.0 |
1. Basic Chemicals, Pharmaceuticals & Cosmetics |
11,321.3 |
13,626.8 |
17,706.0 |
20.4 |
29.9 |
2. Plastic & Linoleum Products |
2,356.5 |
3,317.0 |
4,937.7 |
40.8 |
48.9 |
3. Rubber, Glass, Paints & Enamels, etc. |
1,981.0 |
2,524.7 |
3,525.2 |
27.4 |
39.6 |
4. Residual Chemicals & Allied Products |
732.6 |
953.8 |
1,206.3 |
30.2 |
26.5 |
C. Engineering Goods |
28,670.8 |
42,854.1 |
50,034.7 |
49.5 |
16.8 |
Of which : |
|
|
|
|
|
1. Manufactures of Metals |
4,052.3 |
6,370.3 |
6,810.9 |
57.2 |
6.9 |
2. Machinery & Instruments |
7,000.8 |
8,327.9 |
10,576.4 |
19.0 |
27.0 |
3. Transport Equipments |
7,596.8 |
12,252.3 |
15,942.6 |
61.3 |
30.1 |
4. Iron & Steel |
2,619.4 |
3,771.2 |
4,862.2 |
44.0 |
28.9 |
5. Electronic Goods |
4,350.1 |
5,507.2 |
6,843.6 |
26.6 |
24.3 |
D. Textiles & Textile Products |
14,296.5 |
16,894.3 |
20,587.7 |
18.2 |
21.9 |
1. Cotton Yarn, Fabrics, Made-ups, etc. |
2,536.4 |
4,315.5 |
5,062.9 |
70.1 |
17.3 |
2. Natural Silk Yarn, Fabrics Made-ups etc. (Incl. silk waste) |
222.4 |
269.2 |
162.5 |
21.0 |
-39.6 |
3. Manmade Yarn, Fabrics, Made-ups, etc. |
2,603.6 |
2,958.9 |
3,855.2 |
13.6 |
30.3 |
4. Manmade Staple Fibre |
251.0 |
306.6 |
404.5 |
22.1 |
31.9 |
5. Woollen Yarn, Fabrics, Made-ups,etc. |
64.6 |
74.4 |
113.4 |
15.2 |
52.4 |
6. Readymade Garments |
7,796.4 |
7,729.0 |
9,848.5 |
-0.9 |
27.4 |
7. Jute & Jute Manufactures |
165.7 |
345.8 |
347.0 |
108.7 |
0.3 |
8. Coir & Coir Manufactures |
119.7 |
110.6 |
156.8 |
-7.7 |
41.9 |
9. Carpets |
536.6 |
784.4 |
636.9 |
46.2 |
-18.8 |
(a) Carpet (excl. silk) Handmade |
529.0 |
782.8 |
633.5 |
48.0 |
-19.1 |
(b) Carpet Millmade |
0.0 |
0.0 |
0.0 |
|
|
(c) Silk Carpet |
7.6 |
1.5 |
3.4 |
-80.2 |
125.2 |
E. Gems & Jewellery |
19,820.7 |
25,507.3 |
34,455.3 |
28.7 |
35.1 |
F. Handicrafts |
155.8 |
157.6 |
192.0 |
1.2 |
21.8 |
III. Petroleum Products |
19,525.1 |
28,300.2 |
43,633.1 |
44.9 |
54.2 |
| |
(15.4) |
(16.2) |
(19.1) |
|
|
IV. Others |
6,673.7 |
13,215.3 |
14,549.9 |
98.0 |
10.1 |
Total Exports |
1,27,182.5 |
1,74,782.4 |
2,28,040.7 |
37.4 |
30.5 |
P: Provisional. R: Revised.
Note: Figures in brackets relate to percentage to total exports for the period.
Source : DGCI&S. |
Statement 3: Direction of India's Foreign Trade-Exports |
(US $ million) |
Group/Country |
April-December |
Percentage Variation |
2009-10 |
2010-11R |
2011-12 P |
(2)/(1) |
(3)/(2) |
1 |
2 |
3 |
4 |
5 |
I. O E C D Countries |
46,174.4 |
57,508.3 |
76,626.1 |
24.5 |
33.2 |
A. European Union |
26,116.0 |
31,216.4 |
39,989.6 |
19.5 |
28.1 |
Of which : |
|
|
|
|
|
1. Belgium |
2,591.4 |
3,693.5 |
5,312.1 |
42.5 |
43.8 |
2. France |
2,462.8 |
3,508.6 |
3,304.1 |
42.5 |
-5.8 |
3. Germany |
3,917.8 |
4,442.1 |
5,959.3 |
13.4 |
34.2 |
4. Italy |
2,396.5 |
3,175.5 |
3,682.2 |
32.5 |
16.0 |
5. Netherlands |
5,014.4 |
5,194.9 |
7,388.0 |
3.6 |
42.2 |
6. U K |
4,668.0 |
4,910.0 |
6,516.4 |
5.2 |
32.7 |
B. North America |
14,675.3 |
18,755.5 |
26,750.7 |
27.8 |
42.6 |
1. Canada |
822.7 |
946.3 |
1,470.9 |
15.0 |
55.4 |
2. U S A |
13,852.7 |
17,809.2 |
25,279.8 |
28.6 |
41.9 |
C. Asia & Oceania |
3,717.5 |
5,055.1 |
6,116.1 |
36.0 |
21.0 |
Of which : |
|
|
|
|
|
1. Australia |
1,013.0 |
1,272.9 |
1,651.7 |
25.7 |
29.8 |
2. Japan |
2,495.5 |
3,640.2 |
4,274.4 |
45.9 |
17.4 |
D. Other O E C D Countries |
1,665.7 |
2,481.2 |
3,769.8 |
49.0 |
51.9 |
Of which : |
|
|
|
|
|
1. Switzerland |
425.0 |
461.6 |
796.5 |
8.6 |
72.5 |
II. O P E C |
26,882.6 |
35,924.7 |
42,236.3 |
33.6 |
17.6 |
Of which : |
|
|
|
|
|
1. Indonesia |
2,348.9 |
3,709.8 |
4,430.6 |
57.9 |
19.4 |
2. Iran |
1,430.1 |
1,930.2 |
1,912.2 |
35.0 |
-0.9 |
3. Iraq |
375.7 |
529.9 |
529.8 |
41.0 |
0.0 |
4. Kuwait |
571.4 |
1,393.4 |
899.9 |
143.9 |
-35.4 |
5. Saudi Arabia |
2,947.1 |
3,462.5 |
3,968.5 |
17.5 |
14.6 |
6. U A E |
16,399.2 |
21,763.7 |
26,449.0 |
32.7 |
21.5 |
III. Eastern Europe |
1,282.5 |
1,908.2 |
2,433.5 |
48.8 |
27.5 |
Of which : |
|
|
|
|
|
1. Russia |
696.6 |
1,125.3 |
1,328.5 |
61.5 |
18.1 |
IV. Developing Countries |
48,974.6 |
68,640.0 |
91,851.1 |
40.2 |
33.8 |
A. Asia |
37,119.7 |
50,045.3 |
66,736.9 |
34.8 |
33.4 |
a) S A A R C |
5,774.0 |
8,026.0 |
9,290.3 |
39.0 |
15.8 |
1. Afghanistan |
362.8 |
294.3 |
376.7 |
-18.9 |
28.0 |
2. Bangladesh |
1,710.5 |
2,305.6 |
2,469.0 |
34.8 |
7.1 |
3. Bhutan |
81.0 |
121.6 |
164.0 |
50.0 |
34.9 |
4. Maldives |
61.1 |
75.8 |
93.9 |
24.1 |
23.8 |
5. Nepal |
1,082.1 |
1,451.2 |
1,818.2 |
34.1 |
25.3 |
6. Pakistan |
1,120.0 |
1,487.5 |
1,130.6 |
32.8 |
-24.0 |
7. Sri Lanka |
1,356.5 |
2,290.1 |
3,238.0 |
68.8 |
41.4 |
b) Other Asian Developing Countries |
31,345.7 |
42,019.3 |
57,446.6 |
34.1 |
36.7 |
Of which : |
|
|
|
|
|
1. People's Republic of China |
7,563.4 |
11,838.8 |
13,123.6 |
56.5 |
10.9 |
2. Hong Kong |
5,435.7 |
7,067.0 |
9,318.7 |
30.0 |
31.9 |
3. South Korea |
2,435.4 |
2,507.5 |
3,401.5 |
3.0 |
35.7 |
4. Malaysia |
2,182.9 |
2,919.9 |
2,853.9 |
33.8 |
-2.3 |
5. Singapore |
5,388.8 |
6,842.6 |
13,318.6 |
27.0 |
94.6 |
6. Thailand |
1,260.6 |
1,603.3 |
2,095.6 |
27.2 |
30.7 |
B. Africa |
7,714.4 |
11,480.6 |
15,077.0 |
48.8 |
31.3 |
Of which : |
|
|
|
|
|
1. Benin |
151.2 |
186.5 |
522.1 |
23.3 |
180.0 |
2. Egypt Arab Republic |
1,028.7 |
1,562.4 |
1,695.7 |
51.9 |
8.5 |
3. Kenya |
1,135.4 |
1,663.0 |
1,520.2 |
46.5 |
-8.6 |
4. South Africa |
1,536.6 |
3,102.9 |
3,492.3 |
101.9 |
12.5 |
5. Sudan |
327.0 |
346.5 |
568.1 |
6.0 |
63.9 |
6. Tanzania |
709.0 |
901.5 |
1,200.1 |
27.1 |
33.1 |
7. Zambia |
63.3 |
73.9 |
152.9 |
16.7 |
106.9 |
C. Latin American Countries |
4,140.5 |
7,114.2 |
10,037.2 |
71.8 |
41.1 |
V. Others |
505.8 |
848.7 |
550.3 |
67.8 |
-35.2 |
VI. Unspecified |
3,362.5 |
9,952.6 |
14,343.4 |
196.0 |
44.1 |
Total Exports |
1,27,182.5 |
1,74,782.4 |
2,28,040.7 |
37.4 |
30.5 |
P: Provisional. R: Revised.
Source : DGCI&S. |
Statement 4: India's Imports of Principal Commodities |
(US $ million) |
Commodity/Group |
April-December |
Percentage Variation |
2009-10 |
2010-11R |
2011-12 P |
(2)/(1) |
(3)/(2) |
1 |
2 |
3 |
4 |
5 |
I. Bulk Imports |
90,287.6 |
1,10,188.1 |
1,56,995.5 |
22.0 |
42.5 |
| |
(43.6) |
(40.9) |
(43.4) |
|
|
A. Petroleum, Petroleum Products & Related Material |
61,661.3 |
75,211.4 |
1,10,789.3 |
22.0 |
47.3 |
| |
(29.7) |
(27.9) |
(30.6) |
|
|
B. Bulk Consumption Goods |
6,470.8 |
6,760.4 |
8,874.1 |
4.5 |
31.3 |
1. Wheat |
5.3 |
56.0 |
0.0 |
- |
- |
2. Cereals & Cereal Preparations |
36.4 |
44.0 |
53.9 |
21.0 |
22.5 |
3. Edible Oil |
3,963.6 |
4,768.7 |
7,370.8 |
20.3 |
54.6 |
4. Pulses |
1,589.9 |
1,295.2 |
1,416.9 |
-18.5 |
9.4 |
5. Sugar |
875.6 |
596.5 |
32.4 |
-31.9 |
-94.6 |
C. Other Bulk Items |
22,155.5 |
28,216.3 |
37,332.2 |
27.4 |
32.3 |
1. Fertilisers |
5,939.2 |
6,243.5 |
9,476.9 |
5.1 |
51.8 |
a) Crude |
499.9 |
512.9 |
1,092.9 |
2.6 |
113.1 |
b) Sulphur & Unroasted Iron Pyrites |
78.8 |
168.1 |
382.4 |
113.4 |
127.5 |
c) Manufactured |
5,360.6 |
5,562.4 |
8,001.5 |
3.8 |
43.8 |
2. Non-Ferrous Metals |
2,250.5 |
3,054.7 |
3,743.3 |
35.7 |
22.5 |
3. Paper, Paperboard & Mgfd. incl. Newsprint |
1,115.8 |
1,583.7 |
2,021.5 |
41.9 |
27.6 |
4. Crude Rubber, incl. Synthetic & Reclaimed |
737.8 |
1,363.3 |
1,818.0 |
84.8 |
33.4 |
5. Pulp & Waste Paper |
638.9 |
864.9 |
1,035.4 |
35.4 |
19.7 |
6. Metalliferrous Ores & Metal Scrap etc. |
5,396.5 |
7,219.2 |
10,198.9 |
33.8 |
41.3 |
7. Iron & Steel |
6,076.7 |
7,887.1 |
9,038.3 |
29.8 |
14.6 |
II. Non-Bulk Imports |
1,17,027.6 |
1,58,987.1 |
2,05,031.4 |
35.9 |
29.0 |
| |
(56.4) |
(59.1) |
(56.6) |
|
|
A. Capital Goods |
49,269.0 |
58,317.5 |
71,984.9 |
18.4 |
23.4 |
1. Manufactures of Metals |
1,808.7 |
2,251.5 |
2,997.9 |
24.5 |
33.2 |
2. Machine Tools |
1,189.1 |
1,597.7 |
2,193.9 |
34.4 |
37.3 |
3. Machinery except Electrical & Electronics |
14,308.4 |
17,441.5 |
22,316.4 |
21.9 |
28.0 |
4. Electrical Machinery except Electronics |
2,345.5 |
2,778.1 |
3,813.7 |
18.4 |
37.3 |
5. Electronic Goods incl. Computer Software |
17,425.8 |
21,100.6 |
26,577.4 |
21.1 |
26.0 |
6. Transport Equipment |
9,074.6 |
8,600.2 |
7,671.4 |
-5.2 |
-10.8 |
7. Project Goods |
3,116.9 |
4,547.9 |
6,414.1 |
45.9 |
41.0 |
B. Mainly Export Related Items |
21,624.3 |
37,054.9 |
42,421.6 |
71.4 |
14.5 |
Of which : |
|
|
|
|
|
1. Pearl Precious Semi-Precious Stones |
10,428.2 |
22,744.1 |
24,171.2 |
118.1 |
6.3 |
2. Chemicals, Organic & Inorganic |
8,754.7 |
11,402.4 |
14,219.2 |
30.2 |
24.7 |
3. Textile Yarn, Fabric, etc. |
1,929.9 |
2,456.7 |
3,014.3 |
27.3 |
22.7 |
4. Cashew Nuts |
511.5 |
451.8 |
1,009.3 |
-11.7 |
123.4 |
C. Others |
46,134.3 |
63,614.8 |
90,624.9 |
37.9 |
42.5 |
Of which : |
|
|
|
|
|
1. Gold & Silver |
19,262.7 |
29,501.8 |
45,765.6 |
53.2 |
55.1 |
2. Artificial Resins & Plastic Materials etc. |
3,665.6 |
5,338.8 |
5,588.7 |
45.6 |
4.7 |
3. Professional Instruments etc., except Electrical |
2,694.3 |
3,291.5 |
3,875.6 |
22.2 |
17.7 |
4. Coal, Coke & Briquettes etc. |
6,687.5 |
7,717.8 |
13,468.8 |
15.4 |
74.5 |
5. Medicinal & Pharmaceutical Products |
1,555.3 |
1,897.5 |
2,205.7 |
22.0 |
16.2 |
6. Chemical Material & Products |
1,695.6 |
2,221.0 |
2,710.6 |
31.0 |
22.0 |
7. Non-Metallic Mineral Manufactures |
800.8 |
1,140.8 |
1,551.5 |
42.5 |
36.0 |
Total Imports |
2,07,315.2 |
2,69,175.2 |
3,62,026.9 |
29.8 |
34.5 |
Memo Items |
|
|
|
|
|
Non-Oil Imports |
1,45,653.9 |
1,93,963.8 |
2,51,237.6 |
33.2 |
29.5 |
Non-Oil Imports excl. Gold & Silver |
1,26,391.2 |
1,64,462.0 |
2,05,472.0 |
30.1 |
24.9 |
Mainly Industrial Inputs* |
1,11,865.5 |
1,48,847.7 |
1,84,720.8 |
33.1 |
24.1 |
P: Provisional. R: Revised.
* Non oil imports net of gold and silver, bulk consumption goods, manufactured fertilisers and professional instruments.
Note: Figures in brackets relate to percentage to total imports for the period.
Source : DGCI & S. |
Statement 5: Direction of India's Foreign Trade-Imports |
(US $ million) |
Group/Country |
April-December |
|
Percentage Variation |
2009-10 |
2010-11R |
2011-12 P |
(2)/(1) |
(3)/(2) |
| |
1 |
2 |
3 |
4 |
5 |
I. O E C D Countries |
69,270.2 |
83,439.9 |
1,08,630.6 |
20.5 |
30.2 |
A. European Union |
28,651.1 |
32,619.3 |
43,100.0 |
13.8 |
32.1 |
Of which : |
|
|
|
|
|
1. Belgium |
4,512.9 |
5,959.7 |
7,717.5 |
32.1 |
29.5 |
2. France |
3,131.2 |
2,751.8 |
2,823.1 |
-12.1 |
2.6 |
3. Germany |
7,705.4 |
8,844.1 |
11,851.7 |
14.8 |
34.0 |
4. Italy |
2,768.1 |
3,215.8 |
4,153.5 |
16.2 |
29.2 |
5. Netherlands |
1,535.8 |
1,437.3 |
1,778.8 |
-6.4 |
23.8 |
6. U K |
3,227.5 |
3,935.9 |
5,996.8 |
21.9 |
52.4 |
B. North America |
15,049.5 |
17,137.0 |
19,902.6 |
13.9 |
16.1 |
1. Canada |
1,714.3 |
1,688.7 |
1,952.0 |
-1.5 |
15.6 |
2. U S A |
13,335.2 |
15,448.3 |
17,950.6 |
15.8 |
16.2 |
C. Asia and Oceania |
14,043.2 |
15,400.6 |
20,657.5 |
9.7 |
34.1 |
Of which : |
|
|
|
|
|
1. Australia |
8,808.7 |
8,478.9 |
11,073.1 |
-3.7 |
30.6 |
2. Japan |
4,861.5 |
6,395.5 |
8,970.8 |
31.6 |
40.3 |
D. Other O E C D Countries |
11,526.4 |
18,283.1 |
24,970.6 |
58.6 |
36.6 |
Of which : |
|
|
|
|
|
1. Switzerland |
9,352.4 |
16,883.9 |
23,520.5 |
80.5 |
39.3 |
II. O P E C |
63,943.0 |
88,765.8 |
1,25,176.9 |
38.8 |
41.0 |
Of which : |
|
|
|
|
|
1. Indonesia |
6,217.3 |
7,255.0 |
11,279.0 |
16.7 |
55.5 |
2. Iran |
8,459.6 |
8,010.0 |
8,597.6 |
-5.3 |
7.3 |
3. Iraq |
5,251.7 |
5,528.5 |
13,942.0 |
5.3 |
152.2 |
4. Kuwait |
6,030.5 |
6,827.1 |
11,204.5 |
13.2 |
64.1 |
5. Saudi Arabia |
11,805.5 |
15,130.5 |
22,978.3 |
28.2 |
51.9 |
6. U A E |
12,203.4 |
23,656.2 |
26,436.8 |
93.9 |
11.8 |
III. Eastern Europe |
4,776.9 |
4,390.3 |
5,772.6 |
-8.1 |
31.5 |
Of which : |
|
|
|
|
|
1. Russia |
2,882.6 |
2,916.7 |
3,403.0 |
1.2 |
16.7 |
IV. Developing Countries |
67,907.3 |
90,513.1 |
1,20,845.6 |
33.3 |
33.5 |
A. Asia |
53,547.8 |
73,907.9 |
97,742.0 |
38.0 |
32.2 |
a) S A A R C |
1,177.2 |
1,586.2 |
1,847.3 |
34.7 |
16.5 |
1. Afghanistan |
88.7 |
107.7 |
68.9 |
21.4 |
-36.1 |
2. Bangladesh |
185.2 |
288.9 |
422.8 |
56.0 |
46.3 |
3. Bhutan |
109.4 |
142.5 |
147.4 |
30.2 |
3.4 |
4. Maldives |
2.6 |
30.9 |
16.9 |
- |
-45.3 |
5. Nepal |
344.5 |
398.0 |
334.4 |
15.5 |
-16.0 |
6. Pakistan |
203.2 |
248.7 |
268.6 |
22.4 |
8.0 |
7. Sri Lanka |
243.7 |
369.5 |
588.4 |
51.6 |
59.3 |
b) Other Asian Developing Countries |
52,370.6 |
72,321.7 |
95,894.7 |
38.1 |
32.6 |
Of which : |
|
|
|
|
|
1. People’s Republic of China |
22,608.0 |
33,055.7 |
45,044.8 |
46.2 |
36.3 |
2. Hong Kong |
3,216.6 |
6,272.4 |
8,713.2 |
95.0 |
38.9 |
3. South Korea |
6,269.8 |
7,637.8 |
9,526.7 |
21.8 |
24.7 |
4. Malaysia |
3,728.7 |
4,554.5 |
7,124.5 |
22.1 |
56.4 |
5. Singapore |
4,686.4 |
5,486.7 |
6,499.0 |
17.1 |
18.4 |
6. Thailand |
2,146.4 |
3,158.0 |
3,946.0 |
47.1 |
25.0 |
B. Africa |
8,985.9 |
10,218.9 |
14,768.0 |
13.7 |
44.5 |
Of which : |
|
|
|
|
|
1. Benin |
115.4 |
130.5 |
256.0 |
13.0 |
96.2 |
2. Egypt Arab Republic |
1,199.5 |
911.7 |
2,406.8 |
-24.0 |
164.0 |
3. Kenya |
56.1 |
85.8 |
92.4 |
53.0 |
7.7 |
4. South Africa |
4,211.9 |
5,452.4 |
7,616.5 |
29.5 |
39.7 |
5. Sudan |
330.3 |
497.1 |
353.8 |
50.5 |
-28.8 |
6. Tanzania |
161.3 |
207.8 |
140.2 |
28.8 |
-32.6 |
7. Zambia |
73.8 |
20.7 |
116.3 |
-72.0 |
462.4 |
C. Latin American Countries |
5,373.6 |
6,386.4 |
8,335.6 |
18.8 |
30.5 |
V. Others |
618.9 |
288.3 |
454.0 |
-53.4 |
57.5 |
VI. Unspecified |
798.9 |
1,777.8 |
1,147.2 |
122.5 |
-35.5 |
Total Imports |
2,07,315.2 |
2,69,175.2 |
3,62,026.9 |
29.8 |
34.5 |
P: Provisional. R: Revised.
Source: DGCI&S. |
|