This study, based on a sample survey of the bank branches across the major centres in India, reveals that electronic wires/SWIFT transfers are the most dominant mode of remitting money to India. The cost of remittances across various modes of transfers has moderated during 2012-13 as compared with the findings of earlier surveys conducted in July 2006 and in September 2009. Gulf region followed by North America continues to be the important source region of remittances to India. Survey shows that while a major portion of remittances received is being utilised for family maintenance, the proportion of remittances for investment purposes has gradually increased.
Introduction
The flow of funds from migrant workers back to their families in their home country is an important source of income in many developing economies. In practice, the transfers are typically recurrent payments by migrant workers who send money to their families in their home country with regular intervals. The recipients often depend on remittances to cover their day-to-day living expenses, to provide a cushion against emergencies and, in some cases, also as a source of fund for small investments.
Workers’ remittances have remained an important source of external finance for India since the last three decades. These flows have not only been a dominant component of India’s invisible receipts, but also stable in their trend over the years as in the case of many other developing countries. Even during the phase of global financial crisis, remittances remained relatively resilient, unlike capital flows. As per the latest estimates released by the World Bank (2013), the remittance flows to developing countries were around US$ 389 billion in 2012 as against US$ 303 billion in 2009. The share of developing countries in the global remittances flows has increased to 75 per cent in 2012 as compared to 72.5 per cent in 2009. The share of South Asia in total remittances to developing countries and all countries has increased from 24.8 per cent and 17.9 per cent, respectively, in 2009 to 27.5 per cent and 20.6 per cent in 2012, mainly led by India. As per the World Bank projections, the upward trend of these shares are likely to continue.
Remittances essentially represent household income from foreign economies arising mainly from the temporary or permanent movement of workers to source economies. From the balance of payments (BoP) perspective, remittances are funds that flow through formal channels, such as electronic wire, or through informal channels, such as cash carried across borders in pockets. They may consist almost entirely of funds sent by individuals who have migrated to a new economy and have become residents there, and of net compensation of border, seasonal, or other short-term workers who are employed in an economy in which they are not residents. Measurement and analysis of cross border remittances are very complex as they are heterogeneous in nature, with numerous small transactions conducted by individuals through a large variety of channels. According to the International Trade in Remittances: Guide for Compilers and Users, remittances are derived from mainly two components in the BoP – (i) personal transfers, and (ii) compensation of employees. In India, private transfers, which are termed as personal transfers by the IMF, are considered as remittances and the compensation of employees data are separately presented under income account1.
With a view to track the micro aspects of remittances such as the modes of transfer, transaction cost at receivers’ end, speed of delivery, frequency of transfers and utilisation of remittances, the Reserve Bank of India had conducted surveys in July 2006 and in November 2009 and the results of the surveys were published in the November 2006 and April 2010 issues of the RBI Bulletin, respectively.
A similar survey was conducted during January-April 2013 focusing on the following aspects of remittances to India:
-
Instruments & arrangement for remittances transfers,
-
Speed of remittances i.e., time taken to deliver remittances,
-
Cost of remitting the fund,
-
Size and frequency of remittances,
-
Utilisation of remittances received, and
-
Sources of inward remittances.
Survey was conducted through a sample of bank branches across major centres in India – Ahmedabad, Bengaluru, Bhubaneswar, Chandigarh, Chennai, Delhi, Hyderabad, Jaipur, Jammu, Kochi, Kolkata, Lucknow, Mumbai, Patna and Ranchi. From the sample information, all-India average was estimated, assigning different weights to each centre based on its share in remittances. Findings of the survey on various aspects of total remittances are set out below:
1. Instruments and Arrangements for Remittance Transfers
The main instruments used by the migrant workers to send remittances to India include Electronic Wires/SWIFT, drafts, cheques, debit/credit cards, money orders and direct transfers to bank accounts. Apart from these instruments, a few banks introduced online remittance transfer facilities which are both cost effective and less time consuming. For example, State Bank of India provides ‘SBI Express Remit’ to transfer money from USA/UK with 24 X 7 services without visiting any branch/bank. Similarly, ICICI Bank also provides web-based wire transfer facilities called ‘Power Transfer’ to remit money to India in as short a time as 48 hours. It eliminates the errors associated with a normal wire transfer by giving remitters a printed wire instruction form and a tracking number to monitor the status of remittance transaction online.
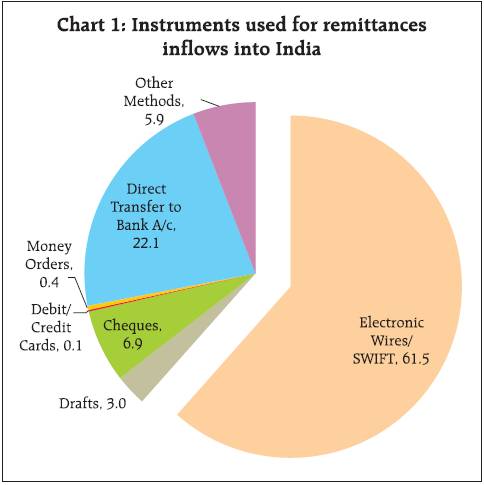
The survey, based on the information received from major Authorised Dealers (ADs) branches spread across 15 centers, reveals that electronic wires/SWIFT is still being used as a dominant mode of transferring remittances from abroad by overseas Indians (Chart 1). Although it is argued that the SWIFT/wire transfer is a costlier mean of transfer, particularly for small value remittance transactions, a higher use of this mode can be attributed to a relatively wider network of the Indian bank branches abroad to provide electronic fund transfer as compared to that of money transfer operators (MTOs). The share of direct transfers to bank account and online money transfers is increasing over the years. All India average of remittance transfer through direct credits to bank account and on line money transfers works out to around 22 per cent in 2012-13 as compared to around 14 per cent in 2009. The traditional banking modes of remittance transfer i.e., drafts and cheques which together constitute about 10 per cent of total remittances continued to be other major means of remitting money to India, albeit their share has declined over the period.
 The pattern of shares of different instruments for remitting money across centers is set out in table 1. The remittance through direct transfer to bank account has been significantly large in four centres, viz., Kochi, Mumbai, Bengaluru and Bhubneswar.
Table 1: Instruments used for Sending Remittances to India (Percentage Share in Total Remittances) |
Centre |
Electronic Wires/SWIFT |
Drafts |
Cheques |
Debit/Credit Cards |
Money Orders |
Direct Transfer to Bank Account |
Other Methods |
Total |
1 |
2 |
3 |
4 |
5 |
6 |
7 |
8 |
9 |
10 |
Ahmedabad |
63 |
3 |
8 |
0 |
0 |
8 |
18 |
0 |
100 |
Bengaluru |
46 |
3 |
2 |
0 |
0 |
26 |
22 |
1 |
100 |
Bhubaneswar |
64 |
0 |
2 |
0 |
0 |
34 |
0 |
0 |
100 |
Chandigarh |
66 |
6 |
20 |
0 |
0 |
4 |
2 |
2 |
100 |
Chennai |
79 |
1 |
8 |
0 |
0 |
2 |
2 |
8 |
100 |
Hyderabad |
93 |
4 |
2 |
0 |
0 |
0 |
1 |
0 |
100 |
Jaipur |
70 |
21 |
3 |
0 |
0 |
2 |
4 |
0 |
100 |
Jammu |
68 |
13 |
4 |
3 |
0 |
12 |
0 |
0 |
100 |
Kochi |
42 |
9 |
19 |
1 |
2 |
25 |
1 |
0 |
100 |
Kolkata |
90 |
3 |
2 |
0 |
0 |
3 |
1 |
0 |
100 |
Lucknow |
81 |
5 |
5 |
1 |
0 |
10 |
0 |
0 |
100 |
Mumbai |
62 |
2 |
5 |
0 |
0 |
26 |
0 |
6 |
100 |
New Delhi |
90 |
2 |
2 |
0 |
0 |
0 |
5 |
0 |
100 |
Patna |
88 |
1 |
4 |
0 |
0 |
6 |
1 |
0 |
100 |
Ranchi |
68 |
4 |
6 |
0 |
0 |
0 |
16 |
5 |
100 |
All India |
|
|
|
|
|
|
|
|
|
2012-13 |
62 |
3 |
7 |
- |
- |
22 |
2 |
4 |
100 |
2009-10 |
63 |
10 |
12 |
1 |
- |
9 |
5 |
|
100 |
2006-07 |
53 |
22 |
15 |
- |
- |
3 |
7 |
|
100 |
-: nil/negligible |
2. Speed of Remittance Transfers
The time taken to deliver the remittances may vary depending on the geographical location of the sender and the recipient, and the mode of transfer used. The time taken in delivering remittances through various modes as gathered through the survey is set out in Table 2.
Table 2: Time Taken to Deliver Remittances |
(No. of days) |
Centre |
SWIFT/ Electronic
Wires |
Drafts |
Cheques |
Debit/Credit
Cards |
Money Orders |
Prepaid cards |
Other Methods |
Online |
Exchange House |
1 |
2 |
3 |
4 |
5 |
6 |
7 |
8 |
9 |
Ahmedabad |
1-4 |
1-30 |
7-30 |
- |
- |
- |
- |
|
Bengaluru |
1-3 |
7-30 |
5-28 |
|
7-28 |
- |
5 |
|
Bhubaneswar |
1-3 |
7 |
5-21 |
|
- |
- |
5 |
|
Chandigarh |
2-3 |
14-21 |
21-25 |
4 |
14 |
4 |
1 |
|
Chennai |
1-5 |
1-13 |
15-30 |
- |
- |
- |
- |
|
Delhi |
1-5 |
1-30 |
7-30 |
|
- |
0 |
5 |
1 |
Hyderabad |
1 |
25 |
20 |
|
- |
- |
- |
|
Jaipur |
1-3 |
2-15 |
2-30 |
|
- |
- |
- |
|
Jammu |
1-3 |
6-15 |
6-30 |
- |
- |
- |
- |
|
Kochi |
1-3 |
3-25 |
10-30 |
1 |
1-10 |
1 |
0-2 |
|
Kolkata |
1-4 |
4-21 |
21-30 |
|
- |
0 |
- |
|
Lucknow |
1-2 |
5-25 |
12-36 |
|
|
|
1-2 |
|
Mumbai |
1-10 |
4-36 |
|
|
- |
1 |
1-5 |
1 |
Patna |
1-5 |
1-10 |
12-36 |
|
- |
- |
1-2 |
2-5 |
Ranchi |
1-5 |
1-30 |
7-36 |
|
- |
- |
2 |
|
All India |
|
|
|
|
|
|
|
|
2012-13 |
1-10 |
1-36 |
2-36 |
1-4 |
1-28 |
1-4 |
0-5 |
1-5 |
2009-10 |
1-7 |
1-30 |
3-45 |
1-4 |
1-15 |
|
|
|
- On-line money transfers, debit/credit and pre-paid cards are the most efficient modes followed by SWIFT/electronic wires. Remittances made through cheques and drafts are the most time consuming.
3. Cost of Sending Remittances
The cost of remittances can be of two types: (a) explicit cost – amount charged on remitting money, and (b) hidden cost – the implicit charge in the form of exchange rate applied for conversion of foreign currency into domestic funds.
The explicit cost of remitting money in turn has two components viz., (i) charges paid to the overseas MTO or the correspondent bank, and (ii) the cost paid by the receiver domestically in the form of handling charges. The latter includes the charges levied by the receiving bank when the beneficiary is customer of another domestic bank. Charges are also levied when the receiver is in remote locations where the funds are delivered by the receiving bank by making a rupee demand draft.
It is often argued that remittance transactions for family maintenance, which are generally smaller in size, are offered less favourable exchange rate and the cost on this account can be exorbitant for some countries with less developed exchange markets. However, in the Indian context, it is understood that the exchange rates applied for conversion into domestic funds are reasonably transparent and do not constitute the cost in any significant measure. In case of transfer of funds from the Gulf countries that are remitted mainly through exchange houses, conversion into rupees is made at the point of origin and the recipient in India does not bear any cost of converting foreign exchange into rupee.
An attempt was made to collect the information on charges levied by bank to transfer funds from locations such as the US to India. Information was collected from ten commercial banks which had their overseas branches or the correspondent relationship with the remitting overseas banks. As summarised in Table 3, the following are the main points:
Table 3: Instrument-wise Cost of Remitting Funds: A Select Case of Some Banks |
(US$) |
Bank |
SWIFT |
Drafts |
Cheques |
<=500 |
<=1000 |
<=500 |
<=1000 |
<=500 |
<=1000 |
1 |
2 |
3 |
4 |
5 |
6 |
7 |
State Bank of India |
1 to 15 |
|
2 to 5 |
8 |
0.5 to 5 |
1 to 5 |
|
(0.2-3.0%) |
|
(0.4-1.0%) |
-1.00% |
(0.1-1.0%) |
(0.1-0.5%) |
Bank of India |
5 |
|
|
|
|
|
|
-1% |
|
|
|
|
|
Punjab National Bank |
3 to 8 |
|
5 |
7 |
0.5 |
1 |
|
(0.6-1.6%) |
|
(1.0%) |
(<1.0%) |
(0.1%) |
(0.1%) |
Axis Bank |
1 to 15 |
15 |
|
|
5 to 8 |
5 to 8 |
|
(0.2 to 3.0 %) |
(1.5%) |
|
|
(1.0-1.6%) |
(< 1%) |
Oriental Bank of Commerce |
5 |
5 to 15 |
|
|
5 |
8 |
|
(1.0%) |
(0.5 to 1.5%) |
|
|
(1.0%) |
(0.8%) |
Indian Overseas Bank |
1 to10 |
2 to 10 |
5 |
10 |
1.25 |
2.5 |
|
(0.2 to 2.0%) |
(0.2 to 1.0%) |
(1.0%) |
(1.0%) |
(0.25%) |
(0.25%) |
Canara Bank |
5 |
10 |
5 |
10 |
1.25 |
2.5 |
|
(1.0%) |
(1.0%) |
(1.0%) |
(1.0%) |
(0.25%) |
(0.25%) |
ICICI Bank |
2.5 |
2.5 |
2 |
2.5 |
2.5 |
2.5 |
|
(0.5%) |
(0.25%) |
(0.4%) |
(0.25%) |
(0.5%) |
(0.25%) |
Standard Chartered Bank |
1.25 |
2.5 |
1.25 |
2.5 |
1.25 |
2.5 |
|
(0.25%) |
(0.25%) |
(0.25%) |
(0.25%) |
(0.25%) |
(0.25%) |
Kotak Mahindra Bank |
5 to 15 |
10 to 20 |
5 |
10 |
5 |
10 |
|
(0.2 to 3.0%) |
(1.0-2.0%) |
(1.0%) |
(1.0%) |
(1.0%) |
(1.0%) |
2012-13 (in per cent) |
0.2 – 3.0 |
0.2 – 2.0 |
0.25 – 1.0 |
0.25 – 1.0 |
0.1 – 1.0 |
0.1 – 1.0 |
2009-10 (in per cent) |
0.2 – 5.0 |
0.1 – 2.5 |
0.4 – 2.0 |
0.25 – 1.0 |
0.1 – 2.0 |
0.1 – 1.0 |
2006-07 (in per cent) |
2.5 – 8.0 |
0.7 – 2.5 |
2.0 |
0.5 – 1.5 |
0.7 – 2.0 |
0.4 – 1.0 |
Note: Figure in bracket represents the cost as percentage of the funds remitted. |
-
Survey shows that SWIFT is the costliest means of transferring funds. There has been a tapering effect in the cost of remitting as compared with the previous round of survey reflecting increasing competition and introduction of fast money transferring infrastructure. The cost of remitting more than US$ 500 to US$ 1,000 works out to be lower.
-
Besides the above mentioned charges paid on remitting funds from overseas locations, the handling charges imposed domestically on rerouting funds to deliver to non-customers or remote locations are found to be in the range of 0.1-0.5 per cent of the total value of funds.
4. Size and Frequency of Remittances
The average size of remittance reflects a number of factors, such as, the average earning level of the migrants, their skill content, duration of stay (generally an inverse relationship between the duration of stay and the propensity to remit) and economic activity in the host country. Apart from these, the size and frequency of remittances also reflect the utilisation pattern. Frequent remittances of a lesser amount indicate that the remittance is used mostly for family maintenance. However, less frequent and high size of remittances may be directed towards investment purposes rather than for family maintenance needs.
Pattern of size and frequency of remittances across centres are set out in Table 4 and Table 5 respectively.
- The share of transactions with average size of individual remittance of ` one lakh and above is relatively higher and accounts for 45 per cent of the total value of remittances and remittances with an average size of less than ` 50 thousand constitute 37 per cent of the total remittances.
Table 4: Size of Remittances sent by Overseas Indians
(Percentage share in Total Remittances) |
Centre |
Less than 1,000 |
1,000-5,000 |
5,000-10,000 |
10,000-20,000 |
20,000-50,000 |
50,000-1,00,000 |
Above 1,00,000 |
Total |
1 |
2 |
3 |
4 |
5 |
6 |
7 |
8 |
9 |
Ahmedabad |
0 |
6 |
12 |
13 |
17 |
14 |
39 |
100 |
Bengaluru |
3 |
5 |
6 |
7 |
13 |
33 |
33 |
100 |
Bhubaneswar |
0 |
0 |
1 |
2 |
16 |
16 |
65 |
100 |
Chandigarh |
0 |
5 |
5 |
6 |
6 |
7 |
71 |
100 |
Chennai |
2 |
8 |
9 |
5 |
24 |
12 |
40 |
100 |
Delhi |
4 |
14 |
2 |
7 |
19 |
30 |
26 |
100 |
Hyderabad |
0 |
1 |
1 |
2 |
10 |
13 |
73 |
100 |
Jaipur |
3 |
9 |
14 |
23 |
24 |
13 |
14 |
100 |
Jammu |
0 |
5 |
10 |
15 |
20 |
12 |
38 |
100 |
Kochi |
0 |
4 |
6 |
13 |
25 |
22 |
30 |
100 |
Kolkata |
1 |
3 |
3 |
3 |
2 |
14 |
75 |
100 |
Lucknow |
14 |
5 |
4 |
18 |
4 |
7 |
47 |
100 |
Mumbai |
0 |
12 |
3 |
5 |
13 |
15 |
52 |
100 |
Patna |
7 |
12 |
5 |
9 |
13 |
24 |
29 |
100 |
Ranchi |
7 |
10 |
10 |
12 |
13 |
15 |
33 |
100 |
All India |
|
|
|
|
|
|
|
|
2012-13 |
1 |
10 |
4 |
6 |
16 |
18 |
45 |
100 |
2009-10 |
9 |
6 |
15 |
13 |
15 |
15 |
27 |
100 |
Table 5: Frequency of sending Remittances by Overseas Indians
(Percentage share in Total Remittances) |
Centre |
Once in a Month |
Once in 2 Months |
Once in 3 Months |
Once in 6 Months |
Once in a Year |
Others |
Total |
1 |
2 |
3 |
4 |
5 |
6 |
7 |
8 |
Ahmedabad |
19 |
4 |
16 |
20 |
31 |
9 |
100 |
Bengaluru |
27 |
6 |
7 |
25 |
10 |
25 |
100 |
Bhubaneswar |
63 |
13 |
7 |
5 |
5 |
7 |
100 |
Chandigarh |
15 |
11 |
10 |
23 |
33 |
7 |
100 |
Chennai |
41 |
16 |
23 |
5 |
11 |
5 |
100 |
Delhi |
50 |
5 |
3 |
6 |
34 |
3 |
100 |
Hyderabad |
28 |
14 |
23 |
15 |
15 |
6 |
100 |
Jaipur |
39 |
11 |
13 |
18 |
10 |
10 |
100 |
Jammu |
28 |
12 |
26 |
16 |
14 |
3 |
100 |
Kochi |
59 |
13 |
18 |
5 |
4 |
1 |
100 |
Kolkata |
25 |
18 |
12 |
11 |
31 |
3 |
100 |
Lucknow |
29 |
9 |
8 |
34 |
20 |
0 |
100 |
Mumbai |
31 |
11 |
14 |
20 |
19 |
6 |
100 |
Patna |
37 |
10 |
13 |
11 |
22 |
7 |
100 |
Ranchi |
33 |
19 |
13 |
15 |
12 |
7 |
100 |
All India |
|
|
|
|
|
|
|
2012-13 |
37 |
11 |
14 |
16 |
17 |
5 |
100 |
2009-10 |
42 |
11 |
12 |
8 |
13 |
14 |
100 |
In terms of frequency, the survey results indicate that about 60 per cent of the total remittance inflows are received at least once a quarter, while 48 per cent of the total remittances are received with a frequency of two months.
Comparison of size and frequency of remittances during 2012-13 with the preceding survey conducted in 2009-10 shows that while size of remittances has increased, frequency of remittances has fallen. These trends seem to suggest that over the years, a higher proportion of remittances are being directed towards investment purposes. This inference is also corroborated by the analysis of responses received on the specific question on utilisation pattern.
5. Utilisation Pattern of Remittances
Survey findings about the possible end-use of the funds remitted by the overseas Indians to their families back home are set out in Table 7 and Chart 2.
-
A predominant portion of the remittances received are utilised for family maintenance i.e., to meet the requirements of migrant families regarding food, education, health etc. The use of remittances for investment purposes has gradually increased.
-
Use of remittances for investment purposes is comparatively large in centres like Hyderabad, Bengaluru, Mumbai, Lucknow, Kolkata and Jammu (Table 6) .
Table 6: Utilisation Pattern of Remittances
(Percentage share in Total Remittances) |
|
Family maintenance |
Deposits in banks |
Investment in land and property |
Investment in equity/shares, etc. |
Investment in gold instruments |
For social/ religious function |
Others |
1 |
2 |
3 |
4 |
5 |
6 |
7 |
8 |
Ahmedabad |
72 |
17 |
1 |
0 |
0 |
6 |
5 |
Bengaluru |
50 |
22 |
2 |
10 |
0 |
5 |
11 |
Bhubaneswar |
62 |
16 |
0 |
0 |
0 |
10 |
12 |
Chandigarh |
62 |
14 |
2 |
0 |
0 |
0 |
22 |
Chennai |
53 |
27 |
0 |
0 |
0 |
1 |
19 |
Delhi |
50 |
9 |
2 |
2 |
0 |
1 |
35 |
Hyderabad |
61 |
29 |
3 |
3 |
0 |
2 |
3 |
Jaipur |
75 |
19 |
3 |
0 |
0 |
2 |
1 |
Jammu |
60 |
19 |
3 |
3 |
0 |
0 |
15 |
Kochi |
61 |
28 |
3 |
1 |
0 |
1 |
6 |
Kolkata |
44 |
31 |
4 |
1 |
0 |
2 |
17 |
Lucknow |
62 |
29 |
6 |
0 |
0 |
0 |
2 |
Mumbai |
45 |
18 |
3 |
5 |
0 |
3 |
25 |
Patna |
63 |
11 |
1 |
0 |
0 |
14 |
12 |
Ranchi |
63 |
24 |
1 |
0 |
0 |
2 |
10 |
All India |
|
|
|
|
|
|
|
2012-13 |
49 |
20 |
3 |
4 |
0 |
3 |
21 |
2009-10 |
61 |
20 |
4 |
3 |
|
|
12 |
2006-07 |
54 |
20 |
10 |
3 |
|
|
13 |
6. Source Regions of Remittance Inflows, Tenure of Stay and Currency Compositions
Based on the survey coupled with available information on country profile of non-resident Indian deposits, the region-wise inflows of private transfers to India was estimated for 2012-13 (Table 7). The remittances received from different destinations broadly reveal the migration pattern, skill content of the migrants and the earning levels.
Table 7: Region-wise Distribution of Private Transfers Inflows to India |
(US$ Million) |
Period |
Gulf Countries |
North America |
South America |
Europe |
Africa |
East Asia |
Others |
Total |
1 |
2 |
3 |
4 |
5 |
6 |
7 |
8 |
9 |
2009-10 |
16,431 |
15,934 |
2,197 |
10,446 |
1,731 |
2,250 |
4,647 |
53,636 |
2010-11 |
20,506 |
19,097 |
1,449 |
6,794 |
1,618 |
3,734 |
2,421 |
55,618 |
2011-12 |
24,382 |
22,706 |
1,723 |
8,078 |
1,923 |
4,440 |
2,878 |
66,129 |
2012-13 |
24,934 |
23,220 |
1,762 |
8,260 |
1,967 |
4,541 |
2,943 |
67,627 |
There was a significant increase in private transfers from Gulf region, North America, East Asia, while the proportion of private transfer receipts from Europe, Africa and South America moderated during 2012-13 as compared with that of earlier surveys (Table 7).
- Region wise distribution of remittances across centres surveyed is presented in Table 8. Share of North America has been highest across all centres, except Kochi, Jaipur, Mumbai and Bhubaneswar where remittances from the Gulf region are the highest (Table 8).
Table 8: Source Regions of Remittance Inflows
(Percentage share in Total Remittances) |
|
Gulf Countries |
North America |
South America |
Europe |
Africa |
East Asia (including Japan) |
Australia/ New Zealand |
Total |
1 |
2 |
3 |
4 |
5 |
6 |
7 |
8 |
9 |
Ahmedabad |
10 |
40 |
9 |
25 |
12 |
3 |
1 |
100 |
Bengaluru |
14 |
34 |
8 |
17 |
7 |
13 |
7 |
100 |
Bhubaneswar |
46 |
30 |
0 |
2 |
0 |
21 |
1 |
100 |
Chandigarh |
37 |
29 |
4 |
14 |
10 |
2 |
5 |
100 |
Chennai |
13 |
50 |
10 |
9 |
1 |
14 |
3 |
100 |
Delhi |
23 |
49 |
1 |
14 |
4 |
8 |
2 |
100 |
Hyderabad |
10 |
64 |
8 |
11 |
2 |
2 |
3 |
100 |
Jaipur |
66 |
12 |
2 |
6 |
5 |
6 |
3 |
100 |
Jammu |
39 |
23 |
6 |
17 |
4 |
7 |
4 |
100 |
Kochi |
63 |
22 |
0 |
8 |
1 |
3 |
3 |
100 |
Kolkata |
21 |
49 |
4 |
8 |
5 |
8 |
4 |
100 |
Lucknow |
22 |
39 |
14 |
14 |
4 |
3 |
5 |
100 |
Mumbai |
36 |
34 |
3 |
13 |
3 |
7 |
5 |
100 |
Patna |
24 |
35 |
2 |
18 |
6 |
10 |
5 |
100 |
Ranchi |
30 |
30 |
3 |
24 |
2 |
9 |
2 |
100 |
All India |
|
|
|
|
|
|
|
|
2012-13 |
37 |
34 |
3 |
12 |
3 |
7 |
4 |
100 |
2009-10 |
27 |
38 |
6 |
18 |
4 |
5 |
2 |
100 |
2006-07 |
24 |
44 |
6 |
13 |
2 |
8 |
3 |
100 |
Currency Composition
The survey on remittances indicates that about 57 per cent of the total remittance inflows are received in terms of dollar, while 16 per cent of remittances are received in Saudi riyal and UAE dirham. The share of Euro and pound sterling are 7 per cent and 8 per cent, respectively (Table 9).
Table 9: Currency Composition
(Percentage share in Total Remittances) |
Centre |
Saudi Riyal |
UAE Dirham |
US Dollar |
GB Pound |
Euro |
Others |
Total |
1 |
2 |
3 |
4 |
5 |
6 |
7 |
8 |
Ahmedabad |
0 |
0 |
78 |
11 |
5 |
6 |
100 |
Bangaluru |
1 |
1 |
72 |
6 |
15 |
5 |
100 |
Bhubaneswar |
0 |
0 |
94 |
0 |
5 |
1 |
100 |
Chandigarh |
1 |
2 |
35 |
9 |
6 |
47 |
100 |
Chennai |
1 |
7 |
56 |
3 |
6 |
28 |
100 |
Delhi |
0 |
1 |
67 |
7 |
6 |
19 |
100 |
Hyderabad |
0 |
0 |
83 |
3 |
9 |
4 |
100 |
Jaipur |
0 |
0 |
64 |
3 |
7 |
26 |
100 |
Jammu |
5 |
4 |
64 |
13 |
11 |
3 |
100 |
Kochi |
7 |
19 |
46 |
7 |
8 |
13 |
100 |
Kolkata |
3 |
0 |
66 |
16 |
14 |
15 |
113 |
Lucknow |
6 |
13 |
57 |
8 |
15 |
2 |
100 |
Mumbai |
9 |
9 |
57 |
8 |
6 |
10 |
100 |
Patna |
0 |
3 |
70 |
6 |
7 |
14 |
100 |
Ranchi |
1 |
7 |
63 |
10 |
9 |
9 |
100 |
All India |
|
|
|
|
|
|
|
2012-13 |
7 |
9 |
57 |
8 |
7 |
12 |
100 |
Distribution of Remittances and Tenure of Stay Abroad
The survey indicates that the remittances received from NRIs staying abroad for less than one year varies from negligible to 10 per cent across centres. From balance of payments perspective, this does not qualify for workers’ remittances as these inflows are classified under compensation of employees of the primary income (Table 10).
Table 10: Distribution of remittances from NRIs According to tenure NRIs Stay Abroad |
(Per cent) |
Centre |
less than a year |
1-2 year |
2-3 year |
more than 3 years |
Total |
1 |
2 |
3 |
4 |
5 |
8 |
Ahmedabad |
0 |
4 |
22 |
74 |
100 |
Bangaluru |
7 |
10 |
16 |
67 |
100 |
Bhubaneswar |
3 |
12 |
34 |
51 |
100 |
Delhi |
10 |
15 |
25 |
50 |
100 |
Hyderabad |
3 |
5 |
8 |
85 |
100 |
Jaipur |
1 |
6 |
9 |
84 |
100 |
Jammu |
10 |
21 |
30 |
39 |
100 |
Kochi |
8 |
21 |
34 |
38 |
100 |
Kolkata |
8 |
13 |
22 |
58 |
100 |
Lucknow |
10 |
15 |
3 |
72 |
100 |
Mumbai |
7 |
10 |
25 |
59 |
100 |
Patna |
8 |
27 |
43 |
22 |
100 |
Ranchi |
6 |
26 |
21 |
46 |
100 |
All India |
7 |
12 |
25 |
53 |
100 |
Conclusions
The study based on the sample survey of ‘Remittances from Overseas Indians: Modes of Transfer, Transaction Cost and Time Taken’ reveals the following important dimensions of inward remittances from overseas Indians:
i. While electronic wires/SWIFT continues to be the dominant mode of transferring remittances by the overseas Indians, in the recent period, there has been a significant increase in the share of remittances transmitted through direct transfer to bank accounts and through on-line mode.
ii. Out of the total remittance transfers to India, the high value remittances (` 50,000 and above) accounted for 63 per cent of the total value of remittance inflows.
iii. The cost of remittances across various modes of transfers has moderated over the years reflecting increasing competition and introduction of fast money transferring infrastructure.
iv. The major sources of remittances are Gulf countries and North America accounting around 37 per cent and 34 per cent of total remittances, respectively. Major portion of remittances to India are dollar denominated (57 per cent) followed by Saudi riyal/UAE dirham (16 per cent).
v. A predominant portion of the remittances received (49 per cent) are utilised for family maintenance. The share of remittances for investment has gradually increased.
|