This annual article, third in the series, presents the findings of Industrial Outlook Survey (IOS) conducted quarterly during FY:2014-15 (covering 66th to 69th rounds of the survey). In the first two quarters, the business sentiments in the manufacturing sector reflected improvements followed by weaker conditions in third quarter. However, the fourth quarter witnessed some reversal with improving business sentiments, which is partly due to seasonality. On an annual basis, the business situation remained better during FY:2014-15 as compared to FY:2013-14. I. Introduction The Reserve Bank of India monitors trends in various macroeconomic indicators in the process of formulating the monetary policy in India. However, most of these indicators are available with a time lag. In order to bridge the gap, the Reserve Bank conducts a few forward looking surveys covering corporate and household sectors. With more economic activities coming in the ambit of organised sector and the corporate sector being one of the key sectors in the economy, business sentiment surveys, which capture the sentiments that drive the current and near term business decisions, provide key information inputs for policy formulation. Many other central banks also conduct such business sentiment surveys seeking qualitative information on various business parameters. In line with international practices, the Reserve Bank has been conducting the Industrial Outlook Survey (IOS) for Indian manufacturing sector on a quarterly basis, since 1998. The survey captures the assessment of business sentiments for the current quarter and expectation for the ensuing quarter, based on qualitative responses on a set of parameters pertaining to the demand conditions, financial conditions, employment conditions and price situation. The survey schedule is canvassed among a fixed panel of 2,500 manufacturing companies, mostly with paid-up capital above ₹5 million, representing a good mix of size and industry groups. The panel of respondents is kept uniform to the extent possible and is updated with addition of new companies or deletion of closed/merged companies as and when felt necessary. The survey is voluntary and the response rates have been around 70 per cent in 2014-15. This article analyses the survey responses for four quarters- from April-June 2014 to January-March 2015 (i.e. FY:2014-15). The quarterly survey results are regularly disseminated through the RBI website. The related data tables (annual series) are presented in Annex. II. Business sentiments improved The Business Expectation Index (BEI), which is computed as a weighted average of the Net Response (NR)1 of nine select performance parameters2, gives a single snapshot of the industrial outlook in each quarter. For each of the survey round, two indices are computed – one based on the assessment of current quarter and another based on expectation of next quarter. During the financial year 2014-15, the BEI (based on assessment) remained optimistic, hovering over the threshold level of 100, which separates contraction and expansion in the economy. The BEI (assessment) fell below 100 during Q2 and Q3 of the previous year (FY:2013-14). The BEI (assessment) showed improvement in the business situation in the first two quarters of FY:2014-15 and moderated in the third quarter. However, it again showed a pick-up in the last quarter, which is partly due to seasonality (Chart 1). 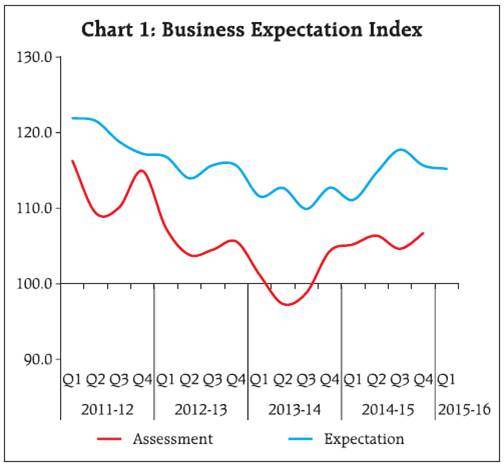 On an annual basis, the 4-quarter average3 BEI for 2014-15 stands at 105.7, which was 100.4 in the previous year. The improvement in business situation in the 2014-15, as indicated by BEI is seen across most of the parameters (which constitute BEI), except three, viz., ‘Inventory of raw material’, ‘inventory of finished goods’ and ‘exports’. Significant improvements are seen in the parameters ‘overall business situation‘, ‘production’, ‘order books’ and ‘profit margin’ (Chart 2). Generally the index based on expectation remains higher than the index based on assessment. The BEI (outlook/expectation) continued to be above the BEI (assessment) in FY:2014-15; and their gap widened in the third quarter of the year and narrowed down subsequently in Q4. On an annual basis, the 4-quarter average BEI (outlook) stood higher at 114.8 in FY:2014- 15 as compared to 111.7 in FY:2013-14. III. Demand conditions indicate improvement in FY:2014-15 The survey collects perceptions of Indian manufacturers on the demand conditions through various parameters, namely, production, order books, capacity utilisation, level of inventory, exports and imports. In respect of most of the above parameters, outlook during 2014-15 improved as compared to the corresponding position a year ago. Outlook on production declined in the quarter Q1:2014-15, partly reflecting seasonality; it improved gradually in the next two quarters and again went down in Q4. The outlook matched the assessment in the first half of the financial year. However, the sentiments appeared to be somewhat opposite in the second half (Chart 3). The assessment of order book improved in Q1:2014-15 and gradually declined in the next two quarters and again picked-up significantly in the last quarter. Nevertheless, in absolute sense, the net response for production and order books remained in the positive territory throughout the year, which is indicative of sustained growth (Chart 4). The outlook on capacity utilisation (CU) reflected similar movement as of production (Chart 5). The net response of capacity utilisation (assessment) also remained in the positive zone throughout the year since Q2:2013-14, when it touched the neutral (zero) level. However, it bounced back significantly in Q4:2013-14. On an annual basis, the CU remained marginally higher in FY:2014-15 from previous year. Outlook on exports remained range bound during 2014-15 and the assessment showed a gradual decline except for a marginal improvement in Q2:2014-15 (Chart 6). As indicated in the earlier section, this is one of the nine parameters used for the computation of BEI and one of the three parameters, which remained less optimistic in 2014-15 as compared to the previous year on an annual basis. The outlook on imports continued to fluctuate during the first three quarters in FY:2014-15 (Chart 7). However, the outlook remained flat during the last quarter of the year as well as in the first quarter of 2015-16. The assessment of Imports showed a declining trend since Q2:2014-15. According to the survey, in FY:2014-15 most of the responding firms (about 80 per cent) reported ‘average’ in the inventory levels of both raw material and finished goods on a quarterly basis. Of the remaining, on annual basis, relatively higher percentage of respondents reported with ‘above average’ level of inventory than those reported ‘below average’ during FY:2014-15. As indicated in the earlier section, both these components of BEI, did not contribute towards the increase of the composite index. IV. Revival of Financial situation is in a modest pace The survey assesses the financial situation based on several parameters. In addition to an evaluation of the overall financial situation, responses are obtained specifically on availability of finance, cost of external finance and profit margin. The optimism level in the assessment of overall financial situation gradually increased except in Q3:2014-15 when it dipped marginally. However, improvement was observed in the last quarter (Chart 8). The optimism level in the expectation of overall financial situation continued to be upward since Q3:2013-14. This happened subsequent to the declining period from Q1:2011-12 to Q3:2013-14. Nevertheless, during these period it remained in the positive territory. The outlook for Q1:2015-16 remains flat. As regards availability of finance (different sources like, internal accruals, banks/other financial institutions and overseas are covered separately), majority of companies (varying in the range of 65-90 per cent for different sources) reported ‘no change’ in the situation. Based on the remaining responses, the assessment remained optimistic but range bound in the first three quarters of FY:2014-15 and showed some improvement in the last quarter. Though most of the companies indicated ‘increase’ or ‘no change’ in ‘cost of finance’, the sentiment has improved gradually during 2014-15; the outlook for Q1:2015-16 indicated further improvement (Chart 9). The assessment of ‘profit margin’ continued to remain negative since Q1:2008-09. During the year, the assessment remained range bound for the first three quarters. However, in the last quarter it improved substantially although it continued to remain in the zone of pessimism (Chart 10). The outlook (expectation) improved substantially in Q3:2014-15 and entered in the zone of optimism, which was not witnessed since Q2:2011-12. The outlook for Q1:2015-16 remained range bound. V. Employment and Price Situation The survey seeks perception of the companies on employment. Generally 70-80 per cent of companies reported ‘no change’ in the employment level on quarter-to-quarter basis and based on the remaining responses the optimism level was the highest in Q4:2014-15. However, the outlook for Q1:2015-16 indicated a reversal in the optimism level. As regards price situation, the survey elicits current assessment as well as one quarter ahead outlook on cost of raw material and selling prices from the respondent companies. The sentiment on cost of raw material, which improved during the year, extended the trend since Q3:2013-14 (Chart 11). Although, net response of ‘cost of raw material’ continued to remain pessimistic, the secular (upward) trend indicates that lesser number of companies assessed and expected that cost of raw material would rise. The outlook for Q1:2015-16 indicated further easing in the cost of raw material. The percentage of respondent reporting ‘decrease’ in the cost of finance and cost of raw material has increased gradually during the year. Further, the net response of selling price continued to witness downward trend during the year. The downward trend in selling price was sharper in the assessment than in the expectation (Chart 12). VI. Conclusion During the FY:2014-15, the BEI (assessment) showed improvement over FY:2013-14 except in Q3:2014-15. Majority of individual parameters (used for BEI computation) showed improvement during FY:2014- 15 over FY:2013-14. In particular, the net responses of production, capacity utilisation and order books showed marked improvement in FY:2014-15 over FY:2013-14. Going forward, BEI (expectation) for Q1:2015-16 indicates no change in the business sentiments. Improved sentiments on cost of finance and cost of raw material were observed during FY:2014-15 along with the declining selling price. The net response of profit margin, although in negative terrain, has improved during FY:2014-15 over the previous year.
Annex | Table 1: Assessment & Expectation for Production | | (Percentage responses)@ | | Year $ | Total response | Assessment | Expectation | | Increase | Decrease | No change | Net response# | Increase | Decrease | No change | Net response# | | 2009-10 | 1189 | 41.8 | 18.0 | 40.2 | 23.7 | 41.5 | 14.6 | 43.9 | 26.8 | | 2010-11 | 1395 | 51.5 | 11.4 | 37.1 | 40.2 | 51.7 | 8.2 | 40.1 | 43.5 | | 2011-12 | 1429 | 44.1 | 15.8 | 40.1 | 28.3 | 49.5 | 9.3 | 41.2 | 40.2 | | 2012-13 | 1414 | 37.7 | 18.7 | 43.6 | 19.1 | 45.8 | 10.5 | 43.7 | 35.3 | | 2013-14 | 1216 | 33.0 | 20.0 | 47.0 | 13.0 | 40.5 | 12.0 | 47.5 | 28.5 | | 2014-15 | 1533 | 35.4 | 17.2 | 47.4 | 18.2 | 42.2 | 10.3 | 47.4 | 31.9 | | Q1:2015-16 | | | | | | 39.6 | 10.9 | 49.5 | 28.7 | ‘Increase’ in production is optimistic.
@: Due to rounding off percentage may not add up to 100.
#: Net Response (NR) is the difference of percentage of the respondents reporting optimism and that reporting pessimism.
$: Annual responses are arithmetic mean of quarterly responses.
The above footnotes (@, # and $) are applicable for all the tables from 1 to 17. |
| Table 2: Assessment & Expectation for Order Books | | (Percentage responses) | | Year | Total response | Assessment | Expectation | | Increase | Decrease | No change | Net response | Increase | Decrease | No change | Net response | | 2009-10 | 1189 | 37.4 | 18.0 | 44.5 | 19.4 | 38.7 | 15.9 | 45.4 | 22.8 | | 2010-11 | 1395 | 44.7 | 9.7 | 45.5 | 35.0 | 46.5 | 6.9 | 46.5 | 39.6 | | 2011-12 | 1429 | 39.1 | 16.2 | 44.8 | 22.9 | 44.3 | 9.5 | 46.2 | 34.8 | | 2012-13 | 1414 | 32.7 | 18.7 | 48.6 | 14.0 | 40.4 | 10.5 | 49.1 | 29.9 | | 2013-14 | 1216 | 29.7 | 20.4 | 49.9 | 9.3 | 36.3 | 12.2 | 51.5 | 24.1 | | 2014-15 | 1533 | 31.4 | 16.5 | 52.0 | 14.9 | 38.3 | 9.7 | 52.0 | 28.5 | | Q1:2015-16 | | | | | | 37.8 | 10.5 | 51.7 | 27.3 | | ‘Increase’ in order books is optimistic. |
| Table 3: Assessment & Expectation for Pending Orders | | (Percentage responses) | | Year | Total response | Assessment | Expectation | | Below Normal | Above Normal | Normal | Net response | Below Normal | Above Normal | Normal | Net response | | 2009-10 | 1189 | 5.1 | 20.7 | 74.2 | 15.6 | 4.8 | 19.6 | 73.7 | 14.8 | | 2010-11 | 1395 | 7.2 | 12.6 | 80.2 | 5.4 | 7.3 | 10.7 | 82.0 | 3.5 | | 2011-12 | 1429 | 5.4 | 16.2 | 78.4 | 10.7 | 6.6 | 12.4 | 81.0 | 5.8 | | 2012-13 | 1414 | 5.1 | 18.4 | 76.4 | 13.3 | 5.6 | 14.2 | 80.2 | 8.7 | | 2013-14 | 1216 | 4.5 | 19.1 | 76.4 | 14.6 | 4.9 | 16.1 | 79.0 | 11.2 | | 2014-15 | 1533 | 5.1 | 17.1 | 77.8 | 11.9 | 5.5 | 12.6 | 81.9 | 7.1 | | Q1:2015-16 | | | | | | 6.9 | 13.1 | 80.1 | 6.2 | | ‘Below Normal’ in pending orders is optimistic. |
| Table 4: Assessment & Expectation for Capacity Utilisation | | (Percentage responses) | | Parameter | Options | Assessment | Expectation | | 2011-12 | 2012-13 | 2013-14 | 2014-15 | 2011-12 | 2012-13 | 2013-14 | 2014-15 | | Capacity Utilisation (CU)-(main product) | Increase | 28.5 | 24.2 | 22.2 | 23.0 | 33.1 | 30.6 | 26.6 | 27.8 | | No Change | 56.7 | 58.7 | 58.9 | 60.5 | 57.6 | 58.7 | 61.3 | 61.6 | | Decrease | 14.8 | 17.1 | 18.9 | 16.5 | 9.3 | 10.6 | 12.1 | 10.6 | | Net Response | 13.6 | 7.6 | 3.4 | 6.6 | 20.0 | 14.5 | 17.1 | 17.1 | | Level of CU (compared to the average in last 4 quarters) | Above normal | 12.6 | 9.8 | 9.0 | 9.8 | 13.5 | 11.2 | 10.3 | 10.2 | | Normal | 71.0 | 71.4 | 70.9 | 71.4 | 75.6 | 76.6 | 74.8 | 76.5 | | Below Normal | 16.4 | 18.9 | 20.0 | 18.8 | 10.9 | 12.3 | 14.9 | 13.2 | | Net Response | -3.8 | -9.1 | -11.0 | -9.0 | 2.5 | -1.1 | -4.6 | -3.0 | | Assessment of Production Capacity (with regard to expected demand in next 6 months) | More than adequate | 11.9 | 13.3 | 14.9 | 13.9 | 12.2 | 12.6 | 14.5 | 13.0 | | Adequate | 80.3 | 78.4 | 77.0 | 77.2 | 81.3 | 80.5 | 78.1 | 80.3 | | Less than adequate | 7.8 | 8.3 | 8.5 | 8.4 | 6.5 | 6.9 | 7.4 | 6.7 | | Net Response | 4.2 | 4.9 | 6.0 | 5.5 | 5.6 | 5.7 | 7.0 | 6.3 | | ‘Increase’ in capacity utilisation is optimistic. |
| Table 5: Assessment & Expectation for Exports | | (Percentage responses) | | Year | Total response | Assessment | Expectation | | Increase | Decrease | No change | Net response | Increase | Decrease | No change | Net response | | 2009-10 | 1189 | 23.6 | 22.3 | 54.1 | 1.4 | 24.6 | 17.3 | 58.2 | 7.3 | | 2010-11 | 1395 | 31.8 | 12.5 | 55.6 | 19.3 | 32.4 | 9.5 | 58.1 | 22.9 | | 2011-12 | 1429 | 28.8 | 14.6 | 56.7 | 14.2 | 32.5 | 9.9 | 57.6 | 22.6 | | 2012-13 | 1414 | 25.3 | 15.0 | 59.7 | 10.2 | 29.6 | 10.2 | 60.1 | 19.4 | | 2013-14 | 1216 | 25.6 | 14.6 | 59.8 | 10.9 | 27.9 | 10.0 | 62.1 | 17.8 | | 2014-15 | 1533 | 24.8 | 14.0 | 61.2 | 10.9 | 29.8 | 8.6 | 61.5 | 21.2 | | Q1:2015-16 | | | | | | 27.6 | 8.1 | 64.3 | 19.5 | | ‘Increase’ in exports is optimistic. |
| Table 6: Assessment & Expectation for Imports | | (Percentage responses) | | Year | Total response | Assessment | Expectation | | Increase | Decrease | No change | Net response | Increase | Decrease | No change | Net response | | 2009-10 | 1189 | 21.9 | 12.8 | 65.3 | 9.1 | 19.2 | 11.2 | 69.6 | 7.9 | | 2010-11 | 1395 | 27.7 | 6.7 | 65.6 | 20.9 | 26.0 | 5.4 | 68.6 | 20.6 | | 2011-12 | 1429 | 22.9 | 8.1 | 69.0 | 14.8 | 24.1 | 6.5 | 69.4 | 17.6 | | 2012-13 | 1414 | 20.3 | 10.7 | 69.0 | 9.6 | 22.1 | 7.4 | 70.5 | 14.7 | | 2013-14 | 1216 | 18.8 | 11.9 | 69.3 | 7.0 | 20.0 | 9.0 | 71.0 | 11.1 | | 2014-15 | 1533 | 19.8 | 9.3 | 70.9 | 10.5 | 19.8 | 7.0 | 73.2 | 12.9 | | Q1:2015-16 | | | | | | 20.3 | 7.9 | 71.8 | 12.4 | | ‘Increase’ in imports is optimistic. |
| Table 7: Assessment & Expectation for level of Inventory (Raw Material and Finished Goods) | | (Percentage responses) | | Parameter | Options | Assessment | Expectation | | 2011-12 | 2012-13 | 2013-14 | 2014-15 | 2011-12 | 2012-13 | 2013-14 | 2014-15 | | Inventory of raw material | Below average | 6.9 | 7.6 | 8.2 | 8.1 | 5.6 | 5.6 | 6.0 | 6.2 | | Average | 79.5 | 80.4 | 78.9 | 79.2 | 84.2 | 84.3 | 83.8 | 84.0 | | Above average | 13.6 | 12.0 | 13.0 | 12.7 | 10.2 | 10.0 | 10.2 | 9.8 | | Net Response | 10.2 | 10.0 | 10.2 | 9.8 | -4.7 | -4.4 | -4.2 | -3.6 | | Inventory of finished goods | Below average | 6.3 | 7.0 | 7.6 | 7.7 | 5.7 | 6.4 | 6.5 | 6.7 | | Average | 78.9 | 78.6 | 76.6 | 76.3 | 83.9 | 84.1 | 82.3 | 82.6 | | Above average | 14.8 | 14.3 | 15.8 | 16.6 | 10.5 | 9.5 | 11.2 | 10.7 | | Net Response | -8.5 | -7.3 | -8.1 | -8.3 | -4.8 | -3.2 | -4.7 | -4.0 | | ‘Below average’ in inventory of raw material and finished goods is optimistic. |
| Table 8: Assessment & Expectation for Employment Outlook | | (Percentage responses) | | Year | Total response | Assessment | Expectation | | Increase | Decrease | No change | Net response | Increase | Decrease | No change | Net response | | 2009-10 | 1189 | 16.3 | 10.1 | 73.6 | 6.2 | 14.0 | 9.7 | 76.4 | 4.3 | | 2010-11 | 1395 | 24.0 | 6.1 | 70.0 | 17.9 | 22.7 | 4.7 | 72.5 | 18.0 | | 2011-12 | 1429 | 21.4 | 6.9 | 71.6 | 14.5 | 22.0 | 5.3 | 72.8 | 16.7 | | 2012-13 | 1414 | 17.3 | 9.7 | 73.0 | 7.7 | 19.2 | 6.6 | 74.2 | 12.6 | | 2013-14 | 1216 | 13.7 | 11.5 | 74.8 | 2.2 | 14.9 | 8.1 | 77.0 | 6.8 | | 2014-15 | 1533 | 15.4 | 9.0 | 75.6 | 6.5 | 15.8 | 6.7 | 77.6 | 9.1 | | Q1:2015-16 | | | | | | 15.8 | 7.0 | 77.2 | 8.8 | | ‘Increase’ in employment is optimistic. |
| Table 9: Assessment & Expectation for Overall Financial Situation | | (Percentage responses) | | Year | Total response | Assessment | Expectation | | Better | Worsen | No change | Net response | Better | Worsen | No change | Net response | | 2009-10 | 1189 | 35.5 | 11.9 | 52.6 | 23.5 | 36.4 | 11.1 | 52.6 | 25.3 | | 2010-11 | 1395 | 39.1 | 7.3 | 53.6 | 31.7 | 42.9 | 5.2 | 51.9 | 37.8 | | 2011-12 | 1429 | 30.2 | 13.8 | 56.0 | 16.4 | 36.7 | 7.9 | 55.4 | 28.9 | | 2012-13 | 1414 | 27.0 | 14.3 | 58.7 | 12.8 | 34.7 | 8.6 | 56.7 | 26.0 | | 2013-14 | 1216 | 23.3 | 15.9 | 60.7 | 7.4 | 31.9 | 10.1 | 58.0 | 21.7 | | 2014-15 | 1533 | 27.1 | 12.9 | 60.0 | 14.2 | 33.7 | 7.4 | 58.9 | 26.3 | | Q1:2015-16 | | | | | | 34.3 | 8.0 | 57.7 | 26.3 | | ‘Better’ overall financial situation is optimistic. |
| Table 10: Assessment & Expectation for Working Capital Finance Requirement | | (Percentage responses) | | Year | Total response | Assessment | Expectation | | Increase | Decrease | No change | Net response | Increase | Decrease | No change | Net response | | 2009-10 | 1189 | 39.8 | 10.9 | 46.9 | 26.9 | 33.7 | 5.6 | 60.7 | 28.2 | | 2010-11 | 1395 | 38.1 | 4.8 | 57.0 | 33.3 | 36.6 | 3.7 | 59.7 | 32.8 | | 2011-12 | 1429 | 39.2 | 5.5 | 55.3 | 33.7 | 38.1 | 4.5 | 57.4 | 33.6 | | 2012-13 | 1414 | 36.0 | 6.2 | 57.8 | 29.8 | 36.0 | 4.3 | 59.6 | 31.7 | | 2013-14 | 1216 | 33.4 | 7.2 | 59.4 | 26.2 | 33.0 | 5.8 | 61.2 | 27.3 | | 2014-15 | 1533 | 32.5 | 6.5 | 61.0 | 26.1 | 32.8 | 5.0 | 62.2 | 27.8 | | Q1:2015-16 | | | | | | 32.3 | 5.1 | 62.6 | 27.2 | | ‘Increase’ in working capital finance is optimistic. |
| Table 11: Assessment & Expectation for Availability of Finance | | (Percentage responses) | | Parameter | Options | Assessment | Expectation | | 2013-14 | 2014-15 | 2013-14 | 2014-15 | Availability of finance
(from internal accruals) | Improve | 20.4 | 23.0 | 24.6 | 25.7 | | No Change | 67.2 | 66.2 | 67.9 | 67.5 | | Worsen | 12.3 | 10.7 | 7.5 | 6.8 | | Net Response | 8.1 | 12.3 | 17.1 | 19.0 | Availability of Finance
(from banks & other sources) | Improve | 17.1 | 19.7 | 19.0 | 20.8 | | No Change | 74.2 | 73.1 | 76.2 | 24.6 | | Worsen | 8.7 | 7.2 | 4.8 | 4.6 | | Net Response | 8.4 | 12.6 | 14.2 | 16.2 | Availability of Finance
(from overseas, if applicable) | Improve | 9.8 | 11.3 | 10.9 | 11.8 | | No Change | 80.9 | 83.3 | 84.4 | 84.6 | | Worsen | 6.3 | 5.4 | 4.8 | 3.6 | | Net Response | 3.5 | 5.9 | 6.1 | 8.2 | | ‘Improvement’ in availability of finance is optimistic. |
| Table 12: Assessment & Expectation for Cost of External Finance | | (Percentage responses) | | Year | Total response | Assessment | Expectation | | Decrease | Increase | No change | Net response | Decrease | Increase | No change | Net response | | 2009-10 | 1189 | 23.7 | 8.4 | 67.9 | -15.3 | 25.1 | 6.8 | 68.1 | -18.3 | | 2010-11 | 1395 | 36.5 | 4.9 | 58.6 | -31.7 | 30.7 | 4.8 | 64.5 | -25.9 | | 2011-12 | 1429 | 50.2 | 3.4 | 46.4 | -46.8 | 42.5 | 3.8 | 53.7 | -38.6 | | 2012-13 | 1414 | 32.1 | 7.1 | 60.9 | -25.0 | 29.7 | 8.4 | 61.9 | -21.3 | | 2013-14 | 1216 | 33.2 | 6.4 | 60.4 | -26.8 | 27.4 | 7.0 | 65.6 | -20.4 | | 2014-15 | 1533 | 25.7 | 6.6 | 67.7 | -19.2 | 23.9 | 6.1 | 70.0 | -17.8 | | Q1:2015-16 | | | | | | 21.8 | 8.8 | 69.4 | -13.0 | | ‘Decrease’ in cost of external finance is optimistic. |
| Table 13: Assessment & Expectation for Cost of Raw Material | | (Percentage responses) | | Year | Total response | Assessment | Expectation | | Decrease | Increase | No change | Net response | Decrease | Increase | No change | Net response | | 2009-10 | 1189 | 51.5 | 7.7 | 40.7 | -43.8 | 39.4 | 7.9 | 47.3 | -31.5 | | 2010-11 | 1395 | 66.7 | 2.5 | 30.7 | -64.2 | 52.8 | 2.6 | 44.5 | -50.2 | | 2011-12 | 1429 | 65.6 | 4.5 | 29.9 | -61.0 | 55.9 | 3.8 | 40.4 | -52.1 | | 2012-13 | 1414 | 60.7 | 4.0 | 35.3 | -56.7 | 51.7 | 3.2 | 45.2 | -48.5 | | 2013-14 | 1216 | 58.9 | 3.5 | 37.5 | -55.4 | 50.0 | 3.3 | 46.7 | -46.7 | | 2014-15 | 1533 | 48.3 | 6.1 | 45.6 | -42.1 | 45.0 | 3.9 | 51.0 | -41.1 | | Q1:2015-16 | | | | | | 38.8 | 6.0 | 55.2 | -32.8 | | ‘Decrease’ in cost of raw material is optimistic. |
| Table 14: Assessment & Expectation for Selling Price | | (Percentage responses) | | Year | Total response | Assessment | Expectation | | Increase | Decrease | No change | Net response | Increase | Decrease | No change | Net response | | 2009-10 | 1189 | 19.9 | 17.9 | 62.0 | 2.0 | 17.9 | 16.2 | 65.9 | 1.7 | | 2010-11 | 1395 | 30.8 | 11.4 | 57.8 | 19.5 | 24.8 | 8.8 | 66.4 | 16.0 | | 2011-12 | 1429 | 28.0 | 14.4 | 57.6 | 13.6 | 27.9 | 9.7 | 62.4 | 18.2 | | 2012-13 | 1414 | 25.6 | 11.7 | 62.7 | 13.8 | 25.6 | 7.9 | 66.5 | 17.7 | | 2013-14 | 1216 | 22.7 | 13.7 | 63.6 | 9.0 | 22.7 | 8.8 | 68.5 | 14.0 | | 2014-15 | 1533 | 20.1 | 13.8 | 66.1 | 6.3 | 21.4 | 8.0 | 70.5 | 13.4 | | Q1:2015-16 | | | | | | 19.1 | 8.8 | 72.1 | 10.3 | | ‘Increase’ in selling price is optimistic. |
| Table 15: Assessment & Expectation for Profit Margin | | (Percentage responses) | | Year | Total response | Assessment | Expectation | | Increase | Decrease | No change | Net response | Increase | Decrease | No change | Net response | | 2009-10 | 1189 | 17.5 | 30.8 | 51.7 | -13.3 | 18.2 | 26.6 | 55.2 | -8.4 | | 2010-11 | 1395 | 21.2 | 24.3 | 54.5 | -3.0 | 23.8 | 17.8 | 58.4 | 5.9 | | 2011-12 | 1429 | 16.5 | 30.4 | 53.1 | -13.9 | 21.2 | 20.7 | 58.1 | 0.5 | | 2012-13 | 1414 | 15.6 | 31.8 | 52.6 | -16.2 | 19.9 | 22.0 | 58.1 | -2.0 | | 2013-14 | 1216 | 13.2 | 33.5 | 53.3 | -20.3 | 17.7 | 23.2 | 59.0 | -5.5 | | 2014-15 | 1533 | 14.1 | 28.5 | 57.4 | -14.5 | 18.3 | 20.2 | 61.6 | -1.9 | | Q1:2015-16 | | | | | | 18.8 | 19.3 | 61.9 | -0.5 | | ‘Increase’ in profit margin is optimistic. |
| Table 16: Assessment & Expectation for Overall Business Situation | | (Percentage responses) | | Year | Total response | Assessment | Expectation | | Better | Worsen | No change | Net response | Better | Worsen | No change | Net response | | 2009-10 | 1189 | 41.6 | 13.0 | 45.4 | 28.7 | 42.0 | 12.0 | 46.0 | 30.0 | | 2010-11 | 1395 | 48.0 | 7.0 | 45.0 | 41.0 | 50.4 | 5.4 | 44.2 | 45.1 | | 2011-12 | 1429 | 37.5 | 13.6 | 48.9 | 23.9 | 45.1 | 7.6 | 47.3 | 37.5 | | 2012-13 | 1414 | 32.7 | 15.2 | 52.1 | 17.5 | 42.3 | 8.5 | 49.1 | 33.8 | | 2013-14 | 1216 | 29.3 | 17.5 | 53.3 | 11.8 | 39.1 | 9.9 | 50.9 | 29.2 | | 2014-15 | 1533 | 33.3 | 13.1 | 53.6 | 20.2 | 42.2 | 7.2 | 50.6 | 35.0 | | Q1:2015-16 | | | | | | 42.7 | 6.7 | 50.6 | 36.0 | | ‘Better’ Overall Business Situation is optimistic. |
| Table 17: Assessment & Expectation for Salary/Other Remuneration | | (Percentage responses) | | Year | Total response | Assessment | Expectation | | Better | Worsen | No change | Net response | Better | Worsen | No change | Net response | | 2013-14 | 1216 | 29.5 | 3.5 | 67.0 | 26.1 | 23.9 | 2.9 | 73.2 | 21.0 | | 2014-15 | 1533 | 31.1 | 3.9 | 65.0 | 27.2 | 26.9 | 3.3 | 69.8 | 23.6 | | Q1:2015-16 | | | | | | 27.4 | 3.9 | 68.7 | 23.5 | | ‘Increase in Salary / other remuneration’ is optimistic. |
| Table 18: Business Expectation Index (BEI) | | Year | BEI-Assessment | BEI-Expectation | | 2009-10 | 109.5 | 110.8 | | 2010-11 | 119.9 | 122.7 | | 2011-12 | 112.7 | 119.9 | | 2012-13 | 105.3 | 115.5 | | 2013-14 | 100.4 | 111.7 | | 2014-15 | 105.7 | 114.8 | | Q1:2015-16 | | 115.2 |
|