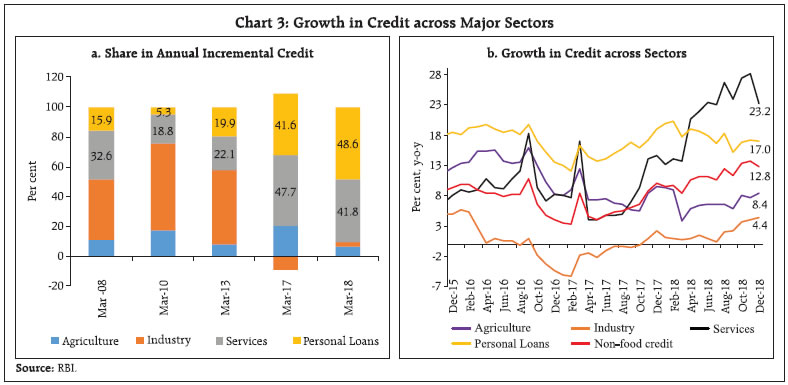
The sectoral deployment of bank credit has undergone a qualitative shift with aggressive lending to the retail segment and in the form of personal loans. Credit to industry has gradually gained momentum in 2018-19 so far after a prolonged contraction. The pick-up in economic activity has boosted credit demand, while firmer weighted average lending rates of banks and the overhang of non-performing loans have depressed it. Introduction In an economy in which banks are the principal financial intermediaries as in India, the bank lending channel is the most important channel of monetary policy transmission, a theme on which interest in the literature goes back to seminal works in the latter half of the twentieth century (Brunner and Meltzer, 1963; Bernanke and Blinder, 1988). Markets for bank credit are notoriously asymmetric and prone to excluding/ rationing out disadvantaged participants. In this context, policy interventions have been advocated to correct market failure, produce inclusive equilibria and ensure efficient price discovery to drive the allocation of credit (Canales and Nanda, 2012). In India, the period up to the 1980s was marked by the dominance of the State in the allocation of credit and policy-administered lending rates. Since 1990s, liberalisation brought with it reduction in statutory pre-emptions, the progressive deregulation of interest rates and the infusion of competition with entry of new private banks. Given this history, however, adequate and equitable distribution of bank credit among productive sectors of the economy has been an abiding concern among academics and policy makers alike (Yakubu and Affoi, 2014 and Makinde, 2016). Accordingly, considerable attention and resources have been devoted to measuring and monitoring the flow of bank credit to various sectors of the economy. Information on the sectoral flow of gross bank credit has been tracked through the Basic Statistical Returns (BSR) data collection system on an annual basis and more recently, on a quarterly basis since Q1:2014-15. In view of the need for higher frequency monitoring with minimum time lags for the purpose of formulation of monetary policy, information on sectoral deployment of credit from select banks – currently 41 banks that account for about 90 per cent of gross bank credit – is obtained. These data cover all important sectors of the economy and are released on the Reserve Bank’s website on the last working day of every month with a lag of about a month. They are also disseminated through various publications of the Reserve Bank and its data warehouse. This is consistent with global best practices as also data dissemination standards of multilateral agencies (Annex Table I). Analyses of these data are provided in the Reserve Bank’s flagship publications and form critical inputs for evaluating the transmission of monetary policy across sectors. Furthermore, these data throw light on sectoral responses to monetary policy shocks, financing conditions, borrowing costs and credit-intensities of output. Against this backdrop, the principal motivation of this article is to analyse recent movements in overall non-food credit co-incident with underlying sectoral dynamics. After presenting some stylised evidence in Section II, Section III addresses key sectors attracting bank credit flows. Some empirical findings on the factors affecting credit flow to key sectors of the economy are discussed in Section IV. The final section offers the concluding remarks. II. Non-food Credit: Some Stylised Facts In India’s bank-based financial system, the share of bank credit in total credit to the commercial sector1 remains high (Chart 1a). More recently, however, there are signs of a structural shift, with other sources of credit gaining foothold, though their shares remain low (Chart 1b). Credit disbursed by the scheduled commercial banks (SCBs) to industry has a dominant share though it has been declining over the years (Chart 2a). The share of credit to agriculture has remained stable over the years, while services and personal loans are the sunrise segments (Annex Tables II and III). The procyclicality of bank credit is evident in the case of India (Chart 2b); however, the presence of multiple categories of banks does help to mute this effect. The period 2009-13 marked a bank credit boom, with non-food credit growth averaging 17 per cent. Over the following quinquennium, however, it slowed to 10 per cent as the credit cycle turned down under the weight of a large overhang of stress on banks’ balance sheets due to pervasive loan impairment. By 2015, credit slumped to single digits and it is only since May 2017 that a tenuous recovery is gradually taking hold. The worst hit has been the industrial sector, saddled with a huge pile of non-performing assets (NPAs). Non-bank credit intermediaries, viz., mutual funds, insurance companies and non-bank financial companies (NBFCs) have taken away some share of credit from the banking sector. Some disintermediation can also be attributed to the buoyant corporate bond market, foreign portfolio investors (FPIs) and domestic institutional investors (Table 1). Bank credit has also witnessed a qualitative shift, with aggressive lending to the retail segment; accordingly, the personal loan portfolio has grown well above the industry average. Personal loans contributed 48.6 per cent to the incremental credit in March 2018, a sharp jump from 20.0 per cent in March 2013 (Chart 3a). Industry’s share has remained at a third over the years followed by personal loans and services. Credit to industry went into contraction during most part of 2016-17 and recovered into positive territory only in November 2017 (Chart 3b and Annex Table II). 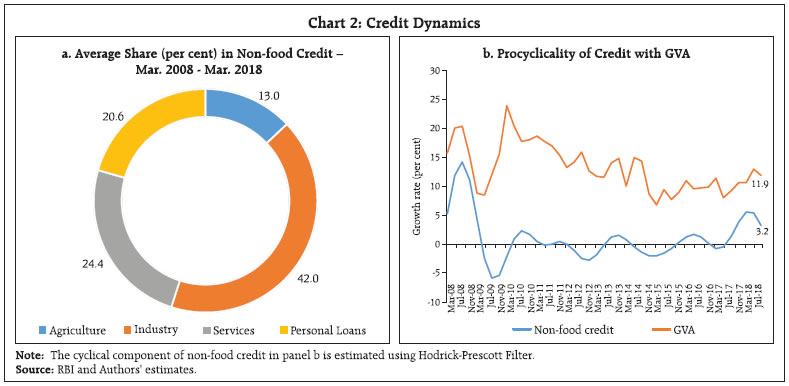
| Table 1: Flow of Financial Resources to the Commercial Sector | | (₹ Billion) | | | April-March | Apr 1 to Jan 18 | | Source | 2015-16 | 2016-17 | 2017-18 | 2017-18 | 2018-19 | | A. Adjusted Non-food Bank Credit (NFC) | 7,754 | 4,952 | 9161 | 3634 | 7071 | | i) Non-Food Credit | 7,024 | 3882 | 7959 | 2959 | 6773 | | of which: petroleum and fertilizer credit | -18 | 133 | 27 | -224 | -153 $ | | ii) Non-SLR Investment by SCBs | 731 | 1070 | 1202 | 675 | 298 | | B. Flow from Non-banks (B1+B2) | 6,241 | 9,578 | 11,220 | 7,716 | 7,946 | | B1. Domestic Sources | 3,782 | 6,820 | 7,836 | 5,762 | 5,677 | | 1 Public issues by non-financial entities | 378 | 155 | 438 | 174 | 84 * | | 2 Gross private placements by non-financial entities | 1,135 | 2,004 | 1,462 | 1121 | 1123 * | | 3 Net issuance of CPs subscribed to by non-banks | 517 | 1,002 | -254 | 570 | 2018 @ | | 4 Net Credit by housing finance companies | 1,188 | 1,374 | 1986 | 1,117 | 1141 $ | | 5 Total accommodation by 4 RBI regulated AIFIs - NABARD, NHB, SIDBI & EXIM Bank | 472 | 469 | 951 | 545 | 1021 * | | 6 Systemically important non-deposit taking NBFCs (net of bank credit) | -277 | 1,539 | 2,875 | 1,959 | 128 * | | 7 LIC's net investment in corporate debt, infrastructure and Social Sector | 369 | 277 | 378 | 276 | 163 * | | B2. Foreign Sources | 2,459 | 2,758 | 3,385 | 1,954 | 2,269 * | | C. Total Flow of Resources (A+B) | 13,995 | 14,530 | 20,381 | 11,350 | 15,017 | Note: (i) Higher net credit flows from NBFCs-NDSI in 2017-18 was mainly due to an increase in reporting by Government companies. Negative net credit flows from NBFCs-NDSI in 2015-16 was mainly due to change in classification norm for NBFCs-NDSI, according to which asset size for being classified as NBFC-NDSI was increased from ₹100 crore to ₹500 crore and more. Additionally, conversion of two large NBFCs viz., Bandhan and IDFC into banks during the year also contributed to the decline in credit flow from NBFCs to the commercial sector in 2015-16.
(ii) $: Up to November 2018 *: Up to December 2018 @: Up to mid-January 2019.
Source: RBI, SEBI, BSE, NSE, Merchant Banks, LIC and NHB. |
 The pick-up in credit since May 2017 has been driven largely by private sector banks, while public sector banks (PSBs) continue to lag, burdened by a large stock of NPAs (Chart 4). III. Bank Credit to Key Sectors Among the key sectors, credit to industry which was growing above 20 per cent until 2011-12, has moderated in the recent years, registering a modest growth in 2017-18, after contracting sharply during 2016-17. While credit growth to the agriculture sector remained somewhat volatile, flows in the form of personal loans has remained broadly constant over the years (Table 2). | Table 2: Credit Deployment to Select Sectors | | | Outstanding (₹ Billion) | Growth (per cent, y-o-y) | | Mar-08 | Mar-11 | Mar-14 | Mar-18 | Nov-18 | 2010-11 | 2013-14 | 2017-18 | Dec-18 | | Non-food credit (1 to 4) | 22,048 | 36,674 | 55,296 | 76,884 | 81642 | 20.7 | 13.6 | 8.4 | 12.8 | | 1. Agriculture & Allied Activities | 2,753 | 4,806 | 6,660 | 10,302 | 10821 | 15.6 | 12.9 | 3.8 | 8.4 | | 2. Industry (Micro & Small, Medium and Large) | 8,583 | 16,046 | 25,165 | 26,993 | 27494 | 22.4 | 12.8 | 0.7 | 4.4 | | of which | | | | | | | | | | | (i) Infrastructure | 2,053 | 5,214 | 8,364 | 8,909 | 9719 | 37.2 | 14.6 | -1.7 | 9.2 | | (a) Power | 951 | 2,666 | 4,869 | 5,196 | 5476 | 41.9 | 17.1 | -1.1 | 5.3 | | (b) Telecommunications | 383 | 933 | 882 | 846 | 906 | 57.2 | 0.5 | -0.6 | 6.0 | | (c) Roads | 345 | 906 | 1,579 | 1,665 | 1870 | 23.2 | 20.2 | -7.5 | 9.8 | | (ii) Basic Metal & Metal Product | 1,076 | 2,130 | 3,608 | 4,160 | 3,799 | 30.7 | 14.9 | -1.2 | -8.1 | | (iii) Food Processing | 494 | 768 | 1,463 | 1,554 | 1,478 | 17.0 | 24.6 | 6.8 | 2.8 | | 3. Services | 5,493 | 8,942 | 13,375 | 20,505 | 22330 | 23.0 | 16.1 | 13.8 | 23.2 | | (i) Trade | 1,238 | 1,850 | 3,258 | 4,669 | 4860 | 12.5 | 18.1 | 9.1 | 10.3 | | (ii) Non-Banking Financial Companies (NBFCs) | 789 | 1,903 | 2,938 | 4,964 | 5709 | 67.7 | 12.9 | 26.9 | 55.1 | | 4. Personal Loans | 5,218 | 6,879 | 10,097 | 19,085 | 20997 | 17.5 | 12.5 | 17.8 | 17.0 | | (i) Housing (Including Priority Sector Housing) | 2,603 | 3,499 | 5,386 | 9,746 | 10966 | 16.3 | 17.9 | 13.3 | 17.1 | | (ii) Vehicle Loans | 586 | 726 | 1,063 | 1,898 | 1,992 | 13.8 | -4.3 | 11.3 | 8.8 | Note: Data are provisional and relate to select banks which cover about 90 per cent of total non-food credit extended by all SCBs.
Source: RBI. | III.1 Agriculture and Allied Activities Notwithstanding the volatility in growth, the share of agriculture (including farm credit, loans for agricultural infrastructure and ancillary activities) in total non-food credit has remained broadly unchanged at around 13 per cent over the years, which could be largely attributed to priority sector lending (PSL). Despite targeted lending, credit disbursement to agriculture in 2017-18 has deviated from trend (Chart 5a), reflecting drought in some states in the southern region, while expectations of announcement of farm loan waivers have made banks generally averse to lending to this sector. Consequently, exposures of both public and private sector banks has been falling (Chart 5b). III.2. Industry Based on limits for investment in plant and machinery, the industrial sector can be broadly classified into three categories, viz., micro and small, medium and large industries. Large industries constitute around 80 per cent of the credit offtake by the industrial sector as a whole, while the share of medium industries has come down significantly over the last decade. Micro and small industries have managed a credit share in a range of 10-15 percent, benefiting from eligibility to be classified under priority sector lending. The industrial sector had been in deceleration/contraction zone since its peak in December 2010, mainly due to the dismal performance of large industries over the years. Information on credit to industry is obtained for 18 broad sub-categories of the industrial sector, in alignment with the classification of the Basic Statistical Returns (BSR) System/National Industrial Classification (NIC). Infrastructure accounts for roughly one-third of the credit offtake by industry, followed by basic metals and metal products and textiles. Credit offtake by infrastructure witnessed a significant increase from one-fifth of the credit offtake by industry in March 2007 to one-third in March 2018. Basic metals have retained their share in credit offtake, while textiles have witnessed a moderation (Chart 6). Industry had been reeling under financial stress since the beginning of 2016-17, with credit growth plummeting to 0.7 per cent in 2017-18. Stalled projects have increased at an alarming pace. Improvement in capacity utilisation, alongside the modest pickup in credit growth to industry, point to a recovery gradually gaining hold in 2018-19 (Chart 7). a. Infrastructure Credit to infrastructure, which accounts for about one-third of bank credit to industry, contracted by 1.1 per cent in 2017-18, prolonging the retrenchment that started since April 2016. The contraction ebbed going into 2018-19, however, with offtake returning to positive territory in July 2018. The dismal performance of this sector could be attributed to loan impairment resulting in lending constraints due to tighter regulatory norms and adverse effects on profitability, especially in telecommunication and power. The National Highway Development Project (NHDP), Phase VII of the Government of India is the latest initiative to boost road infrastructure and incentivise borrowing. The power sector, which accounts for almost half of the credit to infrastructure, has decelerated/contracted in 2017-18, though some easing of stress was observed during 2018-19 (Chart 8). b. Basic Metals The basic metals segment accounts for nearly 15 per cent of the credit offtake by industry. It turned out to be the key sector responsible for the fall in industrial credit growth since the beginning of 2016. In this segment, iron and steel accounts for nearly three quarters of the credit offtake. Basic metals have remained in contraction zone during most part of 2017-18, though the sector managed to clock positive growth during the current financial year. India’s iron and steel sector faces stiff competition from cheaper imports from Russia, China and South Korea. Moreover, shortage of coal in the past few years led to increase in the input cost of steel production. Nevertheless, India has emerged as the second largest steel producer in the world in 2018-19. c. Textiles Textiles constituted around 8 per cent of the credit offtake by industry and its share remained constant since May 2014. It has been facing several hurdles due to operational problems faced by the small and decentralised textile units post-GST, decline in exports of yarns due to withdrawal of various incentives and loss in competitive edge in international market. The textiles segment is broadly classified into three categories, with cotton accounting for 50 per cent share, followed by man-made fibres and jute textiles. The share of cotton textiles has increased in the past decade, while man-made fibres have doubled their share. India’s textiles sector has witnessed stiff competition from cheap imports over the years, leading to credit contraction in 2016-17 from a growth of 23.0 per cent in 2007-08 (Annex Table IV). 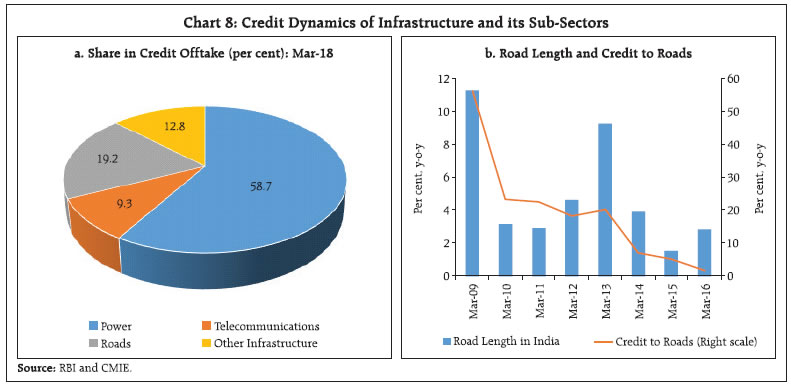 Most of the industrial sub-components are interlinked in the production process. For instance, the cement and cement products sector largely depends on the performance of construction, real estate and the infrastructure sectors. Using data from January 2015 to March 2018, a positive and significant correlation between credit offtake of the cement and cement products sector with construction (0.27) and infrastructure sectors (0.45) was observed. The uptick in recent credit demand may be attributable to initiatives promoting affordable and rural housing, road and irrigation projects. III.3. Services The services sector, with a share of around 55 per cent in India‘s gross value added (GVA), accounts for roughly a quarter of the total non-food credit disbursed by the SCBs – 27 per cent as of March 2018. Credit growth has remained in double digits in recent years, although demonetisation appears to have delivered a shock in 2016-17 followed by some recovery in H2:2017-18 when it grew by 13.1 per cent. Within services, trade and NBFCs account for about 22 per cent and 25 per cent of credit to total services, respectively, while commercial real estate comes third in line followed by professional services (Chart 9). Other constituents include transport operators, computer software, tourism hotel and restaurants, shipping and others. During 2017-18, some weakness in trade was observed; however, robust performance of the NBFCs managed to keep credit demand buoyant. a. Trade Credit growth to trade remained modest during 2017-18, growing by 9.1 per cent as compared with 14.0 per cent in the previous year. Credit to this sector has been declining in the past few years, with its growth touching its lowest at 3.4 per cent in November 2016. Trade is further sub-divided into retail trade and the wholesale trade, with the former’s share remaining dominant and rising marginally since 2007. The growth in credit to retail trade has usually outpaced the wholesale segment and with e-commerce flourishing, this segment is expected to receive a further boost against the backdrop of increasing pace of digitisation. b. Non-banking Financial Companies (NBFCs) The share of NBFCs in services has been steadily increasing from around 11 per cent in March 2007 to a quarter of the total credit offtake by services in March 2018. However, credit growth to this sector by SCBs moderated during the last decade and almost halved in 2017-18 as compared to 2007-08. Credit growth declined substantially post-demonetisation, though the sector has witnessed an uptick in 2018-19 in spite of GST-related uncertainties. III.4. Personal Loans In the personal loans segment, credit has been growing much above the industry average, largely driven by housing, while vehicles have lost some momentum recently. This sector has seen its share in incremental credit rising in the last few years. Unsecured lending has been growing at a robust pace as reflected in the high growth of other personal loans and credit cards outstanding (Chart 10). Housing and vehicle loans account for more than 60 per cent of the personal loan portfolio, with the former remaining the main driver of credit growth (Chart 11a). Credit card outstanding, though not very large in overall credit, has also shown a significant increase. Education witnessed slower credit-offtake, while credit to consumer durables remained in the contraction zone during 2017-18. a. Housing Loans Housing loans account for nearly a half of the credit offtake by the personal loans sector. This sector has remained the main driver of growth of personal loans, though credit offtake has slowed in the recent months with implications for other sectors like construction, steel and cement. Demand for housing tends to be high during periods of high inflation as a hedge against declining real savings. A significant portion of this sector also belongs to the priority sector category. b. Vehicle Loans Indian automobiles industry is one of the largest in the world, comprising commercial vehicles, passenger vehicles, three-wheelers and two-wheelers, with the latter accounting for the largest share. A growing middle class, the young population and development of the rural economy has further aided the two-wheeler segment. Vehicles loans have managed to grow by around 10 per cent in 2017-18, despite some hiccups in the beginning of the year. The growth in vehicle loans in the recent period has moderated, reflecting lower automobile sales (Chart 11b). With mandatory implementation of Bharat IV2 norms from April 2017 and new insurance norms implemented in 2018, automakers resorted to various means of disposing unsold inventory by offering discounts and shipping inventory to markets where older norms were still prevalent. Another disruption which impacted the automobile industry was the implementation of the GST since July 2017, which categorised automobiles into the highest slab of 28.0 per cent with varying levels of cess, though some original equipment manufacturers (OEMs) passed the benefits to customers as effective rates were lower after implementation of GST. c. Consumer Durables The consumer durables market in India in both segments − urban and rural − has potential to prosper due to rising incomes of the middle class. The sector’s share is at a meagre 1.0 per cent of the total offtake on account of personal loans and it contracted during 2017-18. The consumer durables segment had grown by over 50 per cent in 2014 owing to falling consumer inflation (Chart 12). However, credit growth to this sector suffered during 2017-18 which could be attributed to the uncertainty surrounding GST and increase in prices of some products like air conditioners and refrigerators. IV. Some Empirical Findings Is there a long run relationship between credit growth and macro-financial variables? Credit flow to key sectors of the economy has been estimated by an autoregressive distributed lag (ARDL) model as the variables are not of same order of integration i.e., either I(0) or I(1). The models were estimated based on lag length determined by the minimum Akaike information criterion. The estimated models confirm Lagrange Multiplier test for no serial correlation among errors and parameter stability tests. The long-run parameters were obtained from the cointegrating relationship. Dummy variables representing structural reform measures, i.e., demonetisation and GST and policy uncertainty index were included as exogenous variables. The growth rate of non-food credit was positively associated with growth rate of GVA, interest rate spread (IRSPD) – measured by the difference between weighted average lending rate (WALR) and term deposit rate – , deposit growth of SCBs (DEPOSIT) and the business expectation index (BEI). A positive relationship between interest rate spread and non-food credit growth could be due to higher profit margin incentivising banks to lend. The ratio of gross NPAs to total advances (NPA) was adversely related with the growth rate of non-food credit (Annex Table V). 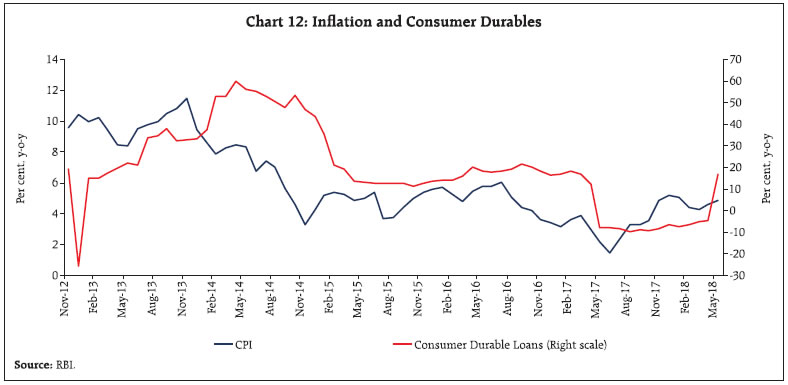 Agriculture credit growth turned out to be positively associated with growth of GVA in agriculture (AGR_GVA) and deposit growth of SCBs, while it is adversely related with growth rate of GVA in industry (IND_GVA) and WALR (Annex Table VI). The inverse relationship between credit to agriculture and industrial sector growth could be attributed to the substitution effects. Credit to the industrial sector was estimated with control variables, viz., industrial GVA (IND_GVA) growth, interest rate, capacity utilisation (CU) and the gross NPA ratio. The empirical findings indicate that capacity utilisation and industry GVA were the most important factors in driving credit to industry, while the lending rate and NPA ratio adversely impacted credit offtake to industry (Annex Table VII). Credit to sub-sectors, viz., transport operators, tourism, hotels and restaurants and trade (TTTH) was positively associated with GVA growth of trade, hotel, transport and communications (THTC_ GVA), railways freight growth (RAILF) and sale of commercial vehicles (CVSALE), while the lending rate may dampen credit demand. Growth of foreign tourist arrival (FTA) may reduce demand for credit through revenues generated in foreign exchange (Annex Table VIII). Credit to the sub-sectors, viz., professional services, commercial real estate, non-banking financial companies, housing (including priority sector housing) and real estate loan by NBFC was positively associated with deposits growth, credit-deposit ratio and BEI, while inversely related with WALR (Annex Table IX). To summarise, empirical findings suggest that there is a long run relationship between credit growth and macro-financial variables. While economic activity, deposit growth of SCBs and business expectations positively impact credit growth, a higher lending rate and overhang of non-performing loans dampen credit demand. V. Conclusion The analysis of the data on sectoral deployment of bank credit provides useful insights into the direction of flow of credit to the key sectors of the economy. The surge in retail lending appears modest at present as a major portion of the credit is secured, while credit growth to industry has turned and a recovery is gaining traction. NPAs have depressed credit to major sectors, while sector specific issues have also driven the direction of credit. Empirical analyses further show industry’s growth crowding out the credit to agriculture. Credit growth has gone through cycles. The nascent recovery, which set during the second half of 2017-18, has continued into 2018-19, supported by several factors – uptick in fixed asset formation and easing stress in infrastructure. Within industries, credit offtake by the medium and large segments has returned to positive territory in recent months, but remained insipid. Credit flow to micro and small industries continues to be negligible, with growth still in the contraction zone. Several policy efforts, viz., speeding up of loan processing by banks, placing of adequate collateral system and loan guarantees can further enhance credit to micro, small and medium enterprises. Policy efforts are needed on several fronts such as improving the ease of doing business further, expediting resolution of distressed assets by addressing the NPA problem of the banking sector and speeding up implementation of stalled projects to make the recovery broad-based. References Bernanke, B. S. and Blinder, A. (1988), “Credit, Money and Aggregate Demand”. American Economic Review. Vol.75, No.1, 435–439. Brunner, K., and Meltzer, A. H. (1963), “The Place of Financial Intermediaries in the Transmission of Monetary Policy”. American Economic Review, Vol. 53, No.2, 372-382. Canales, R. and Nanda, R. (2012), “A Darker Side to Decentralized Banks: Market Power and Credit Rationing in SME Lending”. Journal of Financial Economics, Vol. 105, 353-366. Makinde, H.O. (2016), “Implications of Commercial Bank Loans on Economic Growth in Nigeria (1986- 2014)’’. Journal of Emerging Trends in Economics and Management Sciences, Vol.7, No.3:124-136. Yakubu, Z. and Affoi, A.Y. (2014), “An Analysis of Commercial Banks’ Credit on Economic Growth in Nigeria”. Current Research Journal of Economic Theory, Vol. 6, No.2, 11-15.
| Annex Table I: Data Release on Sectoral Deployment of Bank Credit – Country Practices | | Country | Sector | Frequency | | Bangladesh | Agriculture & Allied Activities, Export and Small and Cottage Industries, Commercial sector | Monthly | | Bhutan | Agriculture & Allied Activities, Manufacturing/Industry, Commerce and trade | Monthly | | Brazil | Industry, Rural credit, Commerce private sector, Households, Housing and credit by economic activities | Monthly | | India | Agriculture & Allied Activities ,Industry, Services, Personal Loan | Monthly | | Indonesia | Agriculture, Mining, Manufacturing, Construction, Trade, Transport and Service sectors, Mortgages | Monthly | | Maldives | Agriculture & Allied Activities, Tourism, Transport and communication | Monthly | | México | Agricultural (including livestock), Commercial, Construction, Communications and transportation, Industrial (manufacturing), Services | Quarterly | | Nepal | Agriculture & Allied Activities, Construction, Electricity, Gas and Water, Finance, Insurance and Real Estate | Monthly | | Pakistan | Agriculture & Allied Activities, SME, Personal Loans, Housing, Corporates, Consumers, Commerce and trade | Quarterly | | South Africa | Agriculture & Allied Activities, Mining, Manufacturing, Energy, Construction | Quarterly | | Switzerland | Agriculture, forestry and fishing, Information and communication, Real estate, Professional, scientific and technical activities, Administrative and support service | Monthly | | Thailand | Non-financial business, Financial business, Households, Housing Loans for Personal Consumption (mortgages) | Monthly | | Zambia | Agriculture & Allied Activities, Mining, Manufacturing, Energy, Construction | Quarterly | | Source: Websites of central banks/ statistics authority. |
| Annex Table II: Growth in Credit across Various Sectors | | (Per cent, y-o-y) | | Sector | Jun-17 | Sep-17 | Dec-17 | Mar-18 | Apr-18 | May-18 | Jun-18 | Sep-18 | Oct-18 | Nov-18 | Dec 18 | | Non-food Credit | 4.8 | 6.1 | 10.0 | 8.4 | 10.7 | 11.1 | 11.1 | 11.3 | 13.4 | 13.8 | 12.8 | | Agriculture Activities | 7.5 | 5.8 | 9.5 | 3.8 | 5.9 | 6.4 | 6.5 | 5.8 | 8.0 | 7.7 | 8.4 | | Industry (Micro , Medium and Large) | -1.1 | -0.4 | 2.1 | 0.7 | 1.0 | 1.4 | 0.9 | 2.3 | 3.7 | 4.0 | 4.4 | | Micro | 0.5 | 1.7 | 7.2 | 0.9 | 0.3 | 0.2 | 0.7 | -1.4 | 1.6 | 1.1 | -0.9 | | Medium | -8.1 | -8.0 | -9.7 | -1.1 | 3.6 | 4.1 | 2.7 | 3.3 | 10.9 | 11.0 | 9.2 | | Large | -1.0 | -0.4 | 1.9 | 0.8 | 1.0 | 1.5 | 0.8 | 2.9 | 3.8 | 4.2 | 5.1 | | Services | 4.7 | 7.0 | 14.7 | 13.8 | 20.7 | 21.9 | 23.3 | 24 | 27.4 | 28.1 | 23.2 | | Transport Operators | 4.4 | 7.3 | 12.8 | 9.8 | 11.6 | 11.3 | 11.0 | 12.5 | 14.5 | 12.8 | 13.1 | | Computer Software | -11.9 | -0.9 | -0.3 | 4.1 | 2.5 | 5.9 | 8.5 | 6.0 | 12.0 | 13.0 | 6.7 | | Tourism, Hotels & Restaurants | -4.0 | -3.9 | -1.9 | -2.7 | 3.1 | 3.3 | 1.4 | 1.0 | 5.5 | 4.5 | 5.6 | | Shipping | -24.6 | -23.2 | -31.6 | -24.7 | -13.7 | -11.7 | -11.5 | -12.1 | -7.5 | -15.4 | -14.4 | | Professional Services | 12.6 | 8.2 | 19.1 | 12.9 | 14.1 | 19.3 | 20.2 | 24.0 | 25.5 | 24.5 | 20.7 | | Trade | 5.3 | 7.3 | 16.4 | 9.1 | 13.6 | 15.5 | 15.2 | 10.8 | 12.5 | 10.8 | 10.3 | | Wholesale Trade (other than food procurement) | 4.5 | 3.6 | 13.3 | 6.2 | 11.7 | 16.3 | 14.6 | 11.8 | 13.0 | 10.8 | 10.6 | | Retail Trade | 6.0 | 10.3 | 19.0 | 11.5 | 15.2 | 14.8 | 15.7 | 10.0 | 12.2 | 10.7 | 10.1 | | Commercial Real Estate | -3.3 | 2.9 | 2.6 | 0.1 | 1.6 | 3.3 | 5.2 | -0.8 | 2.1 | 3.2 | 4.1 | | Non-Banking Financial Companies (NBFCs) | -1.2 | 4.4 | 14.3 | 26.9 | 29.5 | 30.0 | 35.4 | 41.5 | 55.6 | 57.2 | 55.1 | | Other Services | 14.0 | 12.5 | 21.3 | 15.9 | 36.7 | 36.6 | 36.5 | 37.9 | 35.6 | 39.2 | 23.7 | | Personal Loans | 14.1 | 16.8 | 18.9 | 17.8 | 19.1 | 18.6 | 17.9 | 15.1 | 16.8 | 17.2 | 17.0 | | Housing | 11.4 | 12.8 | 14.2 | 13.3 | 14.9 | 15.5 | 15.8 | 15.6 | 17.6 | 16.8 | 17.1 | | Advances against Fixed Deposits | -2.5 | -1.6 | -7.1 | 9.6 | 22.0 | 10.5 | 13.7 | 12.8 | 30.5 | 26.9 | 24.5 | | Advances to Individuals against share, bonds, etc. | -7.0 | -3.6 | 21.8 | 17.0 | 4.9 | 7.5 | 8.3 | 10.6 | 11.3 | 9.4 | 6.9 | | Credit Card Outstanding | 33.4 | 38.7 | 36.2 | 31.6 | 35.2 | 33.1 | 31.3 | 31.7 | 30.9 | 33.8 | 31.7 | | Education | 1.8 | 1.1 | -1.3 | -0.5 | -1.4 | -0.8 | -1.3 | -4.0 | -3.4 | -3.5 | -1.8 | | Vehicle Loans | 9.7 | 9.2 | 9.3 | 11.3 | 9.9 | 10.4 | 11.1 | 9.4 | 9.1 | 9.9 | 8.8 | | Other Personal Loans | 28.0 | 37.0 | 44.5 | 35.3 | 35.5 | 32.2 | 27.5 | 21.6 | 22.1 | 24.7 | 23.8 | Note: 1, Data are provisional and relate to select banks which cover about 90 per cent of total non-food credit extended by all scheduled commercial banks.
2. Times series data are available in the Database on Indian Economy and can be accessed at https://dbie.rbi.org.in/DBIE/dbie.rbi?site=publications.
Source: RBI and Authors’ calculations. |
| Table IV: Growth in Credit across Various Sectors | | (Per cent, y-o-y) | | Industry | Jun 17/ Jun 16 | Sep 17/ Sep 16 | Dec 17/ Dec 16 | Mar 18/ Mar 17 | Apr 18/ Apr 17 | May 18/ May 17 | Jun 18/ Jun 17 | Jul 18/
Jul 17 | Aug 18/ Aug 17 | Sep 18/ Sep 17 | Oct 18/ Oct 17 | Nov 18/ Nov 17 | Dec 18/ Dec 17 | | Mining & Quarrying (incl. Coal) | -3.5 | -3.8 | -2.3 | 19.7 | 6.4 | 22.5 | 22.2 | 24.6 | 30.1 | 29.8 | 32.3 | 31.8 | 24.9 | | Food Processing | -0.7 | 0.6 | 11.6 | 6.8 | 5.6 | 5.2 | 3.3 | 1.4 | 1.8 | 2.2 | 4.2 | 1.3 | 2.8 | | Sugar | -20.1 | -11.5 | -5.4 | -11.5 | -13.3 | -13.6 | -7.0 | -4.4 | -7.0 | -10.5 | -7.5 | -9.8 | -7.8 | | Edible Oils & Vanaspati | -5.5 | 6.2 | 16.4 | 15.0 | 13.9 | 15.7 | 15.5 | 16.9 | 12.5 | 16.5 | 14.6 | 9.9 | 10.2 | | Tea | 18.1 | 5.1 | 32.2 | 25.7 | 39.3 | 36.0 | 23.6 | 19.1 | 24.3 | 23.7 | 28.4 | 15.6 | 10.7 | | Others | 8.1 | 3.7 | 15.7 | 10.9 | 9.4 | 8.4 | 3.3 | -0.7 | 1.3 | 2.3 | 4.4 | 2.0 | 3.8 | | Beverage & Tobacco | -0.1 | -4.5 | -0.8 | -9.7 | -12.5 | -7.7 | -15.7 | -22.1 | -22.9 | -16.4 | -12.7 | -15.9 | -16.3 | | Textiles | -3.2 | 0.4 | 7.6 | 6.9 | 5.1 | 5.6 | 5.5 | 4.2 | 2.5 | 1.3 | 1.7 | 1.8 | -0.4 | | Cotton Textiles | -0.6 | 4.8 | 11.7 | 9.7 | 6.7 | 5.9 | 3.8 | 4.0 | 1.4 | 0.1 | 1.3 | 2.0 | -0.2 | | Jute Textiles | 14.1 | 23.1 | 22.4 | -4.6 | -0.3 | 1.8 | -3.2 | -25.2 | -29.1 | -24.7 | -18.6 | -12.5 | -14.8 | | Man-Made Textiles | 8.2 | 12.7 | 20.5 | 19.3 | 18.5 | 11.1 | 10.7 | 8.7 | 7.3 | 6.7 | 3.7 | 3.9 | 2.5 | | Other Textiles | -9.7 | -8.3 | -1.1 | 0.5 | -0.4 | 3.7 | 6.5 | 4.3 | 3.7 | 2.3 | 2.4 | 1.3 | -1.1 | | Leather & Leather Products | 0.6 | 3.3 | 8.4 | 5.7 | 8.3 | 6.3 | 4.8 | 5.1 | 5.4 | 2.6 | 4.4 | 3.7 | -1.6 | | Wood & Wood Products | -2.2 | 2.0 | 6.5 | 3.3 | 7.3 | 9.8 | 9.6 | 10.1 | 9.5 | 6.4 | 7.9 | 8.3 | 8.4 | | Paper & Paper Products | -6.5 | -11.4 | -8.8 | -6.1 | -7.1 | -6.6 | -4.5 | -5.0 | -3.8 | -5.4 | -2.1 | -1.6 | -3.2 | | Petroleum, Coal Products & Nuclear Fuels | 0.3 | -5.5 | -4.0 | 9.4 | 16.0 | 19.7 | 21.8 | 5.9 | 10.8 | 18.5 | 9.5 | 15.1 | 20.7 | | Chemicals & Chemical Products | -1.4 | 2.2 | 10.6 | -5.5 | -1.8 | 4.2 | 2.3 | 4.9 | 7.7 | 11.7 | 11.0 | 9.3 | 11.0 | | Fertiliser | 8.6 | -1.4 | 0.6 | -8.6 | 16.9 | 16.8 | -0.3 | 4.2 | 21.3 | 34.1 | 3.7 | 11.9 | 11.7 | | Drugs & Pharmaceuticals | -18.2 | -4.2 | 0.5 | 4.4 | 7.6 | 12.2 | 16.0 | 10.4 | 13.0 | 8.4 | 12.9 | 13.6 | 7.6 | | Petro Chemicals | 29.5 | 15.1 | 36.6 | -23.7 | -27.4 | -18.9 | -20.0 | -15.6 | -15.8 | -8.8 | -1.5 | -8.3 | 4.5 | | Others | -10.5 | 0.5 | 7.6 | 8.1 | 8.5 | 14.1 | 13.5 | 21.2 | 18.4 | 23.6 | 25.9 | 20.8 | 20.9 | | Rubber, Plastic & their Products | 6.3 | 7.6 | 12.4 | 8.2 | 10.6 | 10.6 | 6.9 | 7.6 | 11.0 | 8.8 | 8.8 | 7.7 | 9.5 | | Glass & Glassware | -9.6 | -10.0 | 3.2 | 6.5 | 9.2 | 15.0 | 18.0 | 28.6 | 25.9 | 30.3 | 30.6 | 23.7 | 23.3 | | Cement & Cement Products | -7.7 | 3.3 | -0.2 | -3.1 | -2.3 | 5.7 | 2.7 | -4.8 | -5.5 | -10.4 | -4.2 | 4.5 | 3.7 | | Basic Metal & Metal Product | -1.0 | 0.1 | 0.1 | -1.2 | -0.9 | -3.6 | -5.5 | -8.3 | -7.8 | -7.9 | -8.8 | -8.2 | -8.1 | | Iron & Steel | 2.3 | 3.6 | 3.4 | 2.2 | 1.0 | -2.8 | -6.5 | -10.4 | -9.2 | -9.2 | -10.6 | -9.8 | -9.3 | | Other Metal & Metal Product | -10.9 | -10.1 | -9.8 | -11.8 | -7.3 | -6.4 | -2.2 | -1.2 | -2.9 | -3.4 | -2.6 | -2.9 | -3.6 | | All Engineering | -4.3 | -1.7 | 3.0 | 3.8 | 4.4 | 4.8 | 4.3 | 4.3 | 6.0 | 3.8 | 4.6 | 5.1 | 6.7 | | Electronics | -15.6 | -1.9 | 2.7 | 2.3 | 3.9 | 7.1 | 5.9 | 6.6 | 11.9 | 2.8 | 0.4 | 6.5 | 6.9 | | Others | -0.6 | -1.7 | 3.0 | 4.2 | 4.5 | 4.2 | 3.8 | 3.7 | 4.4 | 4.1 | 5.9 | 4.7 | 6.6 | | Vehicles, Vehicle Parts & Transport Equipment | 3.0 | -2.6 | 2.0 | 7.0 | 3.8 | 0.5 | 6.0 | 6.0 | 6.7 | 9.1 | 10.6 | 10.2 | 10.8 | | Gems & Jewellery | -0.8 | 4.0 | 0.7 | 5.3 | -1.4 | 0.5 | -1.3 | 0.1 | -2.3 | -3.7 | -0.3 | -0.2 | -1.5 | | Construction | 12.4 | 5.7 | 8.9 | 9.5 | 10.6 | 8.3 | 7.3 | 10.5 | 8.4 | 8.7 | 9.6 | 8.8 | 7.8 | | Infrastructure | -2.5 | -1.0 | -0.7 | -1.7 | -1.3 | -0.7 | 0.0 | 2.2 | 4.3 | 4.7 | 8.0 | 8.9 | 9.2 | | Power | -1.6 | -0.7 | -1.5 | -1.1 | -0.8 | -1.0 | -1.2 | 0.4 | 1.6 | 1.1 | 3.5 | 5.4 | 5.3 | | Telecommunications | -9.1 | 13.2 | 6.9 | -0.6 | 4.2 | 5.3 | 6.8 | 9.5 | 10.5 | 5.5 | 12.6 | 6.6 | 6.0 | | Roads | -6.5 | -6.5 | -5.3 | -7.5 | -8.0 | -4.9 | -5.7 | -5.4 | 0.0 | 1.6 | 3.6 | 6.8 | 9.8 | | Other Infrastructure | 5.6 | -2.9 | 4.9 | 3.7 | 2.8 | 2.9 | 8.7 | 16.8 | 18.9 | 26.0 | 32.9 | 29.9 | 28.7 | | Other Industries | 5.1 | -3.3 | 1.4 | -4.2 | -1.1 | -2.4 | -5.0 | -11.0 | -3.4 | -1.8 | -1.3 | -2.5 | -0.3 | | Industries | -1.1 | -0.4 | 2.1 | 0.7 | 1.0 | 1.4 | 0.9 | 0.3 | 1.9 | 2.3 | 3.7 | 4.0 | 4.4 | Note: 1. Data are provisional and relate to credit extended to the sub-sectors of industries by select scheduled commercial banks.
2. Times series data are available in the Database on Indian Economy and can be accessed at https://dbie.rbi.org.in/DBIE/dbie.rbi?site=publications.
Source: RBI and Authors’ calculations. |
| Annex Table V: Long-run ARDL Regression for Non-food Credit | | Explanatory variables | Model: ARDL (1, 0, 3, 0, 3, 4)
Dependent variable: Non-food credit growth
(Period: Q1:2008 to Q3:2018) | | Coefficient | t-Statistic | | Constant | -253.47 | -3.55*** | | GVA | 0.44 | 2.48** | | IRSPD(-1) | 7.17 | 2.22** | | NPA(-1) | -0.50 | -1.42 | | DEPOSIT(-1) | 0.66 | 2.92*** | | Log of BEI | 50.78 | 3.79*** | | R2 | 0.94 | | DW statistic | 2.06 | | F-Statistics Bound Test | 5.58*** | | Speed of adjustment / Cointegration parameter | -0.96 | -6.38*** | Note: ***, ** and * indicate 1 per cent, 5 per cent and 10 per cent level of significance, respectively.
Source: Authors’ estimates. |
| Annex Table VI: Long-run ARDL Regression for Agriculture Credit Growth | | Variables | Model: ARDL (1, 4, 4, 3, 2)
Dependent variable: Agriculture credit growth
(Period: Q1:2008 to Q3:2018) | | Coefficient | t-Statistic | | Constant | 24.64 | 2.65*** | | IND_GVA(-2) | -1.16 | -4.21*** | | AGR_GVA(-1) | 0.80 | 2.40** | | WALR | -2.71 | -2.13** | | DEPOSIT(-1) | 0.85 | 3.18*** | | R2 | 0.93 | | DW statistic | 2.07 | | F-Statistics Bound Test | 9.18*** | | Speed of adjustment / Cointegration parameter | -0.77 | -7.39*** | Note: ***, ** and * indicate 1 per cent, 5 per cent and 10 per cent level of significance, respectively.
Source: Authors’ estimates. |
| Annex Table VII: Long-run ARDL Regression for Credit to Industry | | Explanatory variables | Model: ARDL (1, 0, 3, 0, 0)
Dependent variable: Credit to industry
(Period: Q1:2008 to Q3:2018) | | Coefficient | t-Statistic | | Constant | -232.00 | -2.03** | | IND_GVA | 0.17 | 0.80 | | Log of CU | 117.17 | 2.56** | | WALR | -4.13 | -2.11** | | NPA | -1.94 | -4.12*** | | R2 | 0.96 | | DW statistic | 2.01 | | F-Statistics Bound Test | 6.96*** | | Speed of adjustment / Cointegration parameter | -0.51 | -6.31*** | Note: ***, ** and * indicate 1 per cent, 5 per cent and 10 per cent level of significance, respectively.
Source: Authors’ estimates. |
| Annex Table VIII: Long-run ARDL Regression for Credit to Transport Operators, Tourism, Hotels & Restaurants and Trade | | Variables | Model: ARDL (1, 1, 3, 1, 3, 3)
Dependent variable: Credit to TTTH
(Period: Q1:2008 to Q3:2018) | | Coefficient | t-Statistic | | Constant | 0.59 | 0.03 | | THTC_GVA | 0.71 | 2.93*** | | WALR(-4) | -0.67 | -0.30 | | RAILF | 0.72 | 2.06* | | CVSALE(-3) | 0.10 | 1.85* | | FTA | -0.40 | -1.95* | | R2 | 0.91 | | DW statistic | 2.21 | | F-Statistics Bound Test | 6.24*** | | Speed of adjustment / Cointegration parameter | -0.66 | -6.78*** | Note: ***, ** and * indicate 1 per cent, 5 per cent and 10 per cent level of significance, respectively.
Source: Authors’ estimates. |
| Annex Table IX: Long-run ARDL Regression for Credit to Professional Services, Commercial Real Estate, Non-Banking Financial Companies, Housing and Real Estate | | Variables | Model: ARDL (2, 3, 4, 2, 4)
Dependent variable: Credit to services
(Period: Q1:2008 to Q3:2018) | | Coefficient | t-Statistic | | Constant | -430.91 | -5.85*** | | WALR | -9.07 | -5.89*** | | DEPOSIT | 1.45 | 9.40*** | | CD_RATIO | 3.45 | 9.69*** | | Log of BEI(-1) | 63.86 | 6.37*** | | R2 | 0.95 | | DW statistic | 2.15 | | F-Statistics Bound Test | 15.36*** | | Speed of adjustment / Cointegration parameter | -0.94 | -9.64*** | Note: ***, ** and * indicate 1 per cent, 5 per cent and 10 per cent level of significance, respectively.
Source: Authors’ estimates. |
|