Financial variables, both prices as well as quantities, provide useful information in assessing economic conditions and consequently serve as important inputs for policy making. In this article, we attempt to study the movement in equity prices using a fundamental tool of valuation termed as Dividend Discount Model (DDM). The DDM framework values equities using the present discounted value approach and helps to attribute the changes in equity prices to factors including growth expectations, risk-free rate and equity risk premium (ERP). Decomposition of changes in equity prices indicate that the rise in equity prices during 2016 to early 2020 was mainly supported by decrease in interest rates and ERP, with increase in forward earnings expectations contributing to a lesser extent. Thereafter, spike in ERP on COVID-19 concerns initially contributed significantly to equity prices declining sharply to compensate for increased risks. However, equity prices registered impressive recovery subsequently aided by easing of ERP. Introduction Movements in equity prices alongside a range of other assets reveal expectations of economic agents and provide important information to central banks for shaping appropriate policy actions in pursuit of their mandate of price stability, financial stability and economic growth. Equity prices contain information about both current and future economic conditions. Transmission of monetary policy actions to the broader economy takes place through various channels, including asset price channel, which leads to change in market value of equities and other securities. Assessment of equity prices may also help to identify financial imbalances or risks in an economy as it contains information about the degree of uncertainty around the economic outlook. The analysis of equity prices and understanding of the drivers of change in equity prices assumes significance as it interacts with monetary policy and could have different implications for policy actions. Against this backdrop, this article attempts to decompose equity price movements in India since 2005 to 2020 into contribution of changes in growth expectations, interest rates and Equity Risk Premium (ERP) using DDM. Section II discusses the relevance of understanding movement in equity prices. Section III discusses the DDM framework and the specification of the model deployed for the study. Section IV outlines the estimates of unknown variable, i.e., ERP. Section V discusses the results of DDM model, followed by the conclusion. II. Why Equity Prices are Relevant? Financial variables provide useful information in assessing economic conditions and consequently serve as an important input in monetary policy making. Further, monetary policy transmission also takes place through financial channel, which eventually influences the real sector. The immediate impact of monetary policy actions is mirrored in the prices and returns of financial assets, which is transmitted to broader economy through resultant actions of economic agents including households and firms. Unlike other lagging macroeconomic indicators including GDP and inflation, these variables are available on continuous basis and are also not subject to revisions, and hence can be used for real-time monitoring of macroeconomic conditions. In this context, understanding the movement of equity prices, which directly reveals the expectations of economic agents about future economic activity assumes critical importance. This is premised on the traditional equity valuation model, which suggests that stock prices equal the present value of expected future earnings. Ceteris paribus, rising equity prices reflect optimism over future profitability of companies. Other than economic outlook, equity prices may also convey information about risk perception. High risk perception is associated with low equity prices and vice versa because investors demand higher premium to compensate for higher risk against alternate safer investments in bonds thereby driving equity prices lower. Thus, movement of equity prices represents the interplay of different forces and hence there is a need to identify these separate factors for effective policy making. Monitoring equity prices is also relevant from the standpoint of its linkages with the macro economy defined within the demand side framework, i.e., consumption and investment. Easy monetary policy boosts asset prices including equity prices which, increases households’ wealth, prompting them to consume more. This is popularly known as wealth effect. Moreover, higher equity prices also increase business demand by reducing the cost of equity finance and enable them to finance investment at a reduced cost. This relationship between equity market and investment was propounded by James Tobin and is known as Tobin’s ‘q’ theory. Conversely, tighter monetary policy lower equity prices and dampens the aggregate demand of both consumers and business firms. However, the quantum and timing of effect of monetary policy changes on equity prices will depend on the extent to which the policy changes were ex-ante anticipated by market participants and also the extent to which future policy expectations are altered in response to central bank’s actions. Central banks also monitor equity prices in pursuit of their objective of maintaining financial stability, which is a prerequisite for price and economic stability. Financial stability risks may arise when equity prices deviate from fundamental levels as dictated by the present value of future income stream and the market is characterised by wide fluctuations in prices. Easy monetary policy for a sustained period may lead to build up of financial excesses by raising equity prices which foster excessive credit risk taking being translated into excessive investments and thereby fuelling asset prices further. These kinds of unsustainable booms not only lead to misallocation of resources but also create systemic risk with serious ramifications for real economy in an event of inevitable market correction, which would warrant appropriate action from monetary policymakers. III. Equity Valuation: Dividend Discount Model (DDM) Approach Equities can be valued using Gordon Growth Dividend Discount Model (DDM), a fundamental tool for valuation that involves discounting of the expected cash flows in the future by using an appropriate discount rate. The basic intuition that underlies this model is that the value of stock is measured by the cash flows it generates for its shareholders, which primarily include dividend payments. The basic DDM is represented by the following equation: In this equation, P0 is the current equity price, D1, D2, D3, …,Dn are the expected dividend payouts by companies to shareholders in periods 1, 2, 3 up to n, and ke is the cost of equity or expected return on equity. Assuming expected growth rate of dividends (g) to be constant and cost of equity (ke) to be greater than growth rate of dividends (i.e. ke > g), the equation may be re-written as: To incorporate greater flexibility in the set of assumptions, this article uses a two-stage DDM, which assumes high growth phase for short-term, and the terminal growth rate for long-term. Further, the model considers potential dividends instead of actual dividends as companies hold back cash and do not pay out the entire amount that they can afford to in the form of dividends or sometimes distribute cash through stock buybacks due to tax considerations and other reasons. Potential dividends are measured using free cash flow to equity (FCFE)1. Incorporating these modifications, the DDM is re-written as: In this equation, n represents the number of years of high growth, P0 is the current equity price, FCFEt is the expected free cash flow to equity (potential dividends) in period t, ke is the cost of equity or expected return on equity and gn is the long-term stable growth rate. All these factors drive the valuation of equity indices. Required return on equity can be computed using the model by incorporating the current price, which is observable, free cash flow to equity and long-term stable growth rate that are estimable. In our DDM framework, the value of equity benchmark Sensex is considered as representative price of Indian equities. Expected FCFE is assumed to be 60 per cent of expected net profits of constituent Sensex companies, which are derived using consensus forward earnings estimates of equity analysts for a three-year period (high growth phase) available on Bloomberg. Terminal growth rate is assumed to be equivalent to 10-year G-sec rate, which is also considered to be the risk-free rate. Further, the expected return on equity is equal to the risk-free rate plus a risk premium that investors demand for taking additional risk by investing in equities. Since risk-free rate is observable, implied ERP can be computed as residual of expected return on equity (ke) and risk-free rate (Rf). Implied ERP, calculated using this approach, is a forward-looking estimate of ERP and is consistent with the generally accepted belief that return on equities is driven by expectations. However, the reliability of implied ERP largely depends upon the accuracy of estimated future earnings, which may be subject to miscalculation and/or the bias of analysts. It is different from historical ERP that computes the premium over the risk-free rate earned by equity investors in the past. ERP is influenced by multiple factors, such as, risk-profile of investors, volatility in markets, etc. The details of ERP will be discussed in following section. Thus, DDM helps to establish the changes in equity prices on account of factors including growth expectations, risk free rate and ERP, which is implied from the model. For instance, the rise in equity prices can be attributed to improved growth outlook, which raises profitability expectation or decline in ERP. However, higher contribution from low ERP for prolonged period is likely to signal stretched valuations, raising concerns over financial stability. Similarly, equity prices might be falling not only because of weak growth prospects but may be due to rise in ERP. IV. Equity Risk Premium (ERP) ERP is conceptualised as the excess return that makes an investor indifferent between holding a risk-free investment, usually a government bond, and a risky equity investment. ERP is an indicator of uncertainty and is dependent upon various factors, such as, investors’ risk preferences, macro-economic fundamentals, savings rate, market liquidity, political stability, government policies, monetary policy, etc. ERP serves as a key input in determining cost of equity and thus warrants the need for monitoring. While the central bank’s action directly influences part of this cost by affecting the cost of debt, ERP is indirectly altered based on ability of monetary policy to influence risk taking behaviour of investors. From the financial stability point of view, a significantly lower ERP than what is implied by economic factors may lead to sharp and sudden drop in asset prices in any adverse event. The first key determinant of ERP is the risk aversion of investors that suggest equity risk is higher, if investors are risk averse and vice versa. Risk aversion amongst investors varies with age, i.e., older investors are more risk averse and, therefore, demand higher premium compared to the younger investors. This risk aversion increases if investors value current consumption more than future consumption and vice versa. Since risk aversion varies across individual investors, it is the collective risk aversion, which determines the movement in equity risk premium. Another important determinant is the economic risk. A more predictable economic scenario offers conducive environment for investment in equity resulting into lower risk premium and higher equity prices. Similarly, concerns over future equity returns in an environment of heightened macroeconomic uncertainty translates into higher ERP and lower equity prices. In this regard, several studies have established the relationship between risk premium and macroeconomic factors. In a study on the impact of macro-economic variables on stock prices as well as risk premium, the impact of GDP and inflation on ERP was found to be significant (Roll. et al.., 1986). Similarly, the inflation and GDP growth rates were found to influence risk premium in the US during the period 1802-2002 (Arnott and Beinstein, 2002). Also, declining ERP and persistently high stock valuations in the US during 1990s were ascribed to fall in macroeconomic risk, or volatility in the aggregate economy (Lettau, et al.., 2008). One important risk, which arises from investment in equity is the liquidity risk. An illiquid market means that the transaction cost of liquidating positions will be higher, making investors demand higher ERP. A study on the US stock returns between 1973 to 1997 concluded that liquidity accounts for a significant component of the overall ERP, and that its effect varies over time (Gibson and Mougeot, 2002). Another research showed that liquidity across the markets can partially explain the differences in equity returns and risk premiums across emerging markets (Baekart, Harvey and Lundblad, 2007). Further, several studies examined macroeconomic disasters which are low probability high consequence events and contributed to the strand of literature on the key reasons for existence of risk premium on equity (Rietz, 1988; Barro, 2006; Gabaix, 2008; Barro, Nakamura, Steinsson and Ursua, 2013). Broadly, there are three methods to compute ERP categorised into survey-based approach, ex-post calculation giving historical ERP and ex ante or implied ERP based on valuation models, which considers current market prices and interest rates. While the survey-based approach suffers from individual biases, historical ERP yields backward looking estimate. In this respect, implied ERP is considered a better indicator and is consistent with the generally accepted belief that return on equities is driven by market expectations. The DDM framework for Indian equity market yields average ERP estimates for the period under study (2005-2020) at 4.7 per cent. ERP peaked at 8.2 per cent during global financial crisis in 2008 followed by surge in 2020 to 6.0 per cent on account of coronavirus induced stress in the market (Chart 1). Since this framework is based on a set of assumptions, the ERP estimates are uncertain and, therefore, it is prudent to focus on change in ERP over time than its precise level. In the Indian context, ex-post ERP calculated using the difference between actual return on Sensex and 10- year G-sec yield for the period 2005-20 averaged at 4.8 per cent, which is close to the implied ERP estimated using DDM framework. 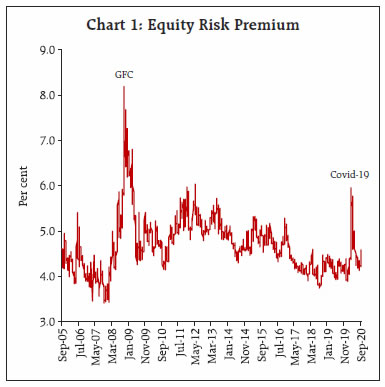 The DDM model enables the ascertainment of factors behind changing cost of equity. During the global financial crisis of 2008, the sharp spike in ERP translated into higher cost of equity/required return on equity even as risk-free rates were declining (Chart 2). The subsequent policy actions in the form of monetary and fiscal stimulus aided in lowering of risk premia and the cost of equity. Thereafter, the decline in cost of equity is attributable to easing of policy rates by the Reserve Bank amidst low inflation environment and reduction in risk-free rate. However, escalating coronavirus induced stress during 2020 pushed ERP higher and consequently resulted in higher cost of equity. The subsequent policy actions lowered interest rates and led to easing of ERP, helping to bring down cost of equity from elevated levels. ERP and Economic Activity In economic sense, rising uncertainty as reflected by higher ERP tends to have negative impact on economic activity. This is mainly because both businesses and consumers will prefer to postpone their investment and consumption decisions, respectively, in an environment of increased uncertainty, thus having negative impact on economic growth. However, the decrease in the risk premium need not necessarily translate into increased economic growth (Stein, 2014). Low ERP over sustained period could potentially lead to a build-up of financial vulnerability, which can translate into macroeconomic instability (Annex 1). 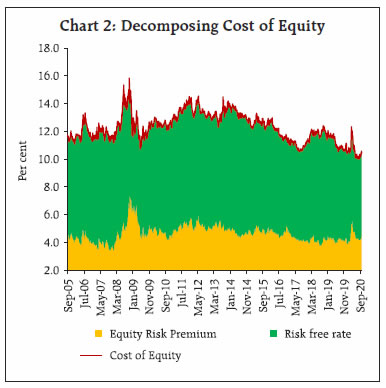 The computed ERP through DDM method shows high correlation with other measures of risk premium including India VIX and corporate bond spreads. Chart 3 depicts co-movement of India VIX, which measures market perceptions of risk, and ERP. Surge in volatility (VIX) is associated with unwillingness of investors to hold risky assets raising the premium (ERP) they demand for bearing risk or a flight to safety against sharp changes in asset prices. Another way of looking at risk perceptions is through measures of credit risk, which is determined by the spread of corporate bond yield over the risk-free rate. Changes in corporate bond spread reflects risk perceptions of investors, i.e., increase in corporate bond spread would mean increase in yield that investors demand for holding a corporate bond over an equivalent maturity government bond without any default risk suggesting prevalence of risk aversion and vice versa. Chart 4 outlines the co-movement of corporate bond spread and ERP for the period under study. However, the relationship weakened somewhat during 2018, which can plausibly be attributed to the asymmetric impact of default on its debt obligations by Infrastructure Leasing & Financial Services (IL&FS) on corporate bond market. V. Decomposing Indian Equity Prices using DDM A second important application of DDM is that it helps to understand the underlying factors driving movement in equity prices by enabling decomposition of change in equity prices into contributions of changes in risk-free rate, ERP and growth expectations. Such a decomposition is arrived by varying, one at a time, each of the three terms on the right side of DDM equation and determining the associated impact on change in equity prices. The impact on equity prices due to simultaneous change in two or more variables is captured by the interaction term. 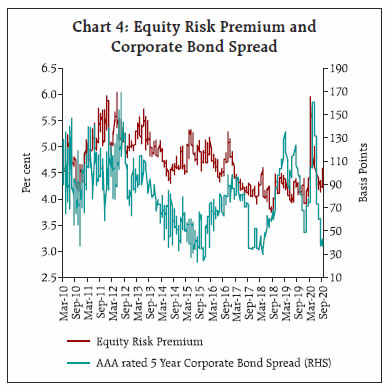 Indian equity market witnessed strong rally during the period 2005-08 before the contagion from global financial crisis beginning in 2007 triggered sharp decline in the BSE Sensex (Chart 5). However, the domestic equity market recovered from the stress at a faster pace during 2009-10, declining thereafter between 2010-13 amidst renewed global uncertainty owing to Euro crisis and taper tantrum. During this period, the negative sentiment was compounded by domestic factors including downgrade of India’s long-term rating outlook to negative from stable, worries over retrospective tax and general anti-avoidance rules (GAAR) and sharp slide of the Indian rupee. The positive momentum in the equity market from 2013 was restored by the Reserve Bank’s measures to rebuild appropriate liquidity buffers coupled with accommodative monetary policy stances of European Central Bank (ECB) and the Bank of Japan (BoJ) as well as relaxed approach of the US Federal Reserve to monetary policy normalisation. Going ahead, concerns over slowdown in China and asset quality in the banking system on the domestic front contributed to the fall in equity market during 2015-16. Since February 2016, equity market has generally exhibited uptrend barring transient blips till mid-January 2020. However, the Indian equity markets retreated thereafter in sync with global markets on fears over COVID-19 induced recession. Subsequently, markets made impressive recovery enthused by extraordinary monetary policy support and fiscal stimulus measures coupled with improvement in macro indicators amidst gradual unlocking of economy. All these factors driving market manifest into the components of DDM including earning expectations, risk premium and interest rates.  Application of the model The Chart 6 illustrates the contribution of different factors in driving the Indian equity prices since 2005: August 2005-January 2008: The sharp rally in the Indian equity market during this period pushed the BSE Sensex nearly three times to 20,000 levels. The DDM decomposition attributes this surge mainly to the increase in earnings expectations with the equity risk premium playing relatively minimal role. The cumulative positive impact of these factors was substantially large to offset the negative contribution from interest rates. January 2008 - March 2009: This phase is marked by the global financial crisis, which roiled financial markets across the globe. During this period, the BSE Sensex declined around 60 per cent in a short span of 15 months. According to the DDM decomposition, earnings expectations and equity risk premium contributed to the fall in equity market. Earnings expectations corrected sharply as economic outlook deteriorated, and equity risk premium spiked owing to increased perception of risk and uncertainty. However, the impact of accommodative monetary policy stance is reflected in the positive contribution of interest rate to the movement in equity prices. 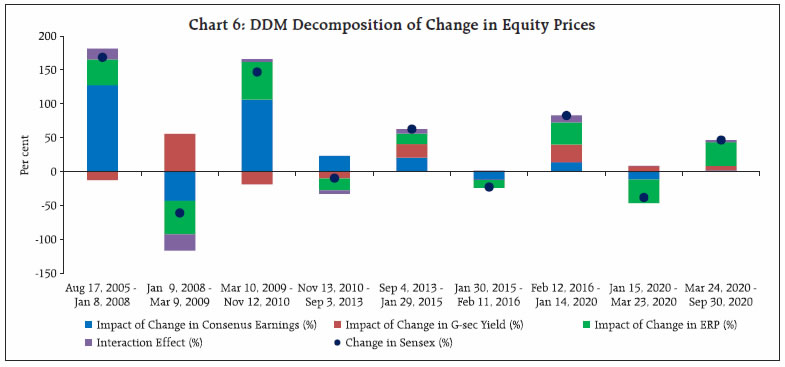 March 2009 - November 2010: Equity prices rebounded sharply during this period and the results of DDM illustrates the positive impact of ERP and earnings expectations. During this period, ERP fell sharply from peak of 8.2 per cent during crisis period to average of 4.8 per cent during this period. This can be attributed to the revival of risk sentiment due to both monetary and fiscal support in the aftermath of crisis. Further, Indian economy weathered financial crisis relatively well which meant outlook on earnings growth also recovered quickly. November 2010 - September 2013: DDM decomposition suggests that the decline in Indian equity market during this phase is explained by ERP and interest rates, even though earnings expectation contributed positively. Market was unsettled by the Euro area crisis beginning 2010 followed by the taper tantrum episode during May-August 2013, which drove ERP higher. Higher ERP amidst improved earnings expectations suggest that even as economic outlook remained positive, uncertainty surrounding that outlook had risen. September 2013 - January 2015: With concerted policy actions post the taper tantrum episode, the equity market resumed upward momentum helped both by ERP and interest rates as the DDM decomposition highlights. However, role of earnings expectations in driving equity prices declined compared to the previous period. January 2015 - February 2016: The downturn in equity prices was witnessed during this phase led by worsening outlook on earnings and rise in ERP, with interest rates causing negligible impact as illustrated by the DDM decomposition. February 2016 - January 2020: Since 2016, the BSE Sensex gained over 80 per cent touching a lifetime high of 41953 on January 14, 2020. However, this uptrend is driven largely by a combination of ERP and interest rates, with earnings expectations contributing to a lesser extent. Low interest rate environment attributable to low inflation prevailed alongside compression of risk premium. ERP touched a low of 3.7 per cent during this period and remained lower than the long-term average in the previous years. January 2020 - March 2020: This phase saw sharp correction in the Indian equity market in sync with the global markets due to COVID-19 pandemic. The BSE Sensex plummeted over 30 per cent during this period and the DDM decomposition suggests significant impact from the increase in ERP followed by faltering earnings expectations. At the same time, monetary accommodation is reflected in positive contribution from interest rates. March 2020 - September 2020: The BSE Sensex recovered nearly 50 per cent from the low of 25,981 on March 23, 2020 aided by sizable policy support on both monetary and fiscal fronts along with rally in global equity markets. DDM decomposition suggest significant contribution from the easing of ERP. However, unlike previous episodes of upswing, there is negligible contribution from earnings expectations. Conclusion The study uses Dividend Discount Model framework to determine implied Equity Risk Premium for Indian equities. The average ERP during 2005-2020 is estimated at 4.7 per cent. The empirical evidence suggests that ERP shot up sharply during global financial crisis of 2008 and during COVID-19 pandemic in March 2020. The relationship between change in ERP and GDP growth is found to be inverse and asymmetric with increase in ERP assuming significance in explaining the fall in GDP growth. ERP is also found to be highly correlated with other measures of uncertainty such as India VIX and corporate bond spread. Decomposition of change in equity price indicates that the rise in equity prices during 2016 to early 2020 was mainly supported by decrease in interest rates and ERP, with increase in forward earnings expectations contributing to a lesser extent. Thereafter, spike in ERP on COVID-19 concerns contributed significantly to the plunge in the equity prices. However, subsequently post-March 2020, markets registered impressive recovery aided by easing of ERP, even as the contribution of earnings expectations was negligible. References Dison, Will and Rattan, Alex (2017), “An improved model for understanding equity prices,” Bank of England Quarterly Bulletin, Bank of England, vol. 57(2), pages 86-97. Damodaran, Aswath (2019), “Equity Risk Premiums (ERP): Determinants, Estimation and Implications – The 2019 Edition”. Guangye Cao & Daniel Molling & Taeyoung Doh, (2015) “Should monetary policy monitor risk premiums in financial markets?”,Economic Review, Federal Reserve Bank of Kansas City. Norges Bank (2016), “Discussion Note on the Equity Risk Premium”. Remarks by Governor Ben S. Bernanke (2003), “Monetary Policy and the Stock Market: Some Empirical Results”, At the Fall 2003 Banking and Finance Lecture, Widener University, Chester, Pennsylvania. Panigirtzoglou, Nikolaos and Scammell, Robert (2002), Analysts’ Earnings Forecasts and Equity Valuations, Bank of England Quarterly Bulletin. Chen, Nai-Fu, Roll, Richard and Ross, Stephen A. (1986), “Economic Forces and the Stock Market”, The Journal of Business, Vol. 59, No. 3 Arnott, Robert D. and Bernstein, Peter L. (2002), “What Risk Premium is ‘Normal’?”, Financial Analysts Journal, Vol. 58, No. 2, 64-85 Lettau, M., Ludvigson, S., Wachter, J. (2008), “The declining equity risk premium: What role does macroeconomic risk play?”, Review of Financial Studies, 21, 1653-1687. Gibson, R., Mougeot, N. (2004), “The pricing of systematic liquidity risk: Empirical evidence from the US stock market”, Journal of Banking and Finance, 28, 157-178. Bekaert, G., Harvey, C., Lundblad, C. (2007), “Liquidity and expected returns: Lessons from emerging markets”, Review of Financial Studies, 20(6), 1783- 1831. Rietz, T. (1988), “The equity risk premium: A solution”, Journal of Monetary Economics, 22, 117-131. Barro, R. (2006), “Rare disasters and asset markets in the twentieth century”, Quarterly Journal of Economics, 121(3), 823-866. Nakamura, E., Steinsson, J., Barro, R., Ursua, J. (2013), “Crises and recoveries in an empirical model of consumption disasters”, American Economic Journal: Macroeconomics, 5(3), 35-74. Xavier Gabaix (2008), “Variable Rare Disasters: An Exactly Solved Framework for Ten Puzzles in Macro- Finance,” The Quarterly Journal of Economics, Oxford University Press, vol. 127(2), pages 645-700.
Annex I: ERP and Economic Activity To understand the macroeconomic implications of changes in equity risk premium, we have regressed both IIP and GDP on ERP as well as its past values. A distinction is made between increase and decrease in ERP, which are included separately to estimate their asymmetric impact. In evaluating the impact on IIP, monthly IIP is regressed on previous six months change in ERP and similarly, quarterly GDP on previous two quarters change in ERP (Chart 7). Lagged values of both IIP and GDP are included in regression to gauge the predictive power of ERP over and above the past values of independent variables (GDP and IIP). Lagged terms are identified based on improvement to the overall fit of the model.  The negative coefficients of increase as well as decrease in ERP establish the inverse relationship between economic activity indicators (IIP and GDP) and equity risk premium. However, both the regression results suggest that while the increase in ERP assumes significance in explaining the dependent variables, i.e., IIP and GDP, decrease in ERP is insignificant in line with the economic theories. This is largely consistent with the divergence between real economy and market observed in 2019 wherein ERP stayed low contributing to surge in equity markets to record-highs and GDP growth stayed muted. Overall, while the ERP has stayed below 4 per cent levels since 2016, real GDP growth has remained below 2016 level which was 8.7 per cent. | Table 1: Regression Results for GDP (Sample period: December 2006-September 2019) | | Explanatory variables | Coefficient | Std. Error | Prob. | | C | 0.02* | 0.01 | 0.04 | | GDP (-1) | 0.63* | 0.15 | 0.00 | | GDP (-2) | -0.08 | 0.17 | 0.63 | | GDP (-3) | 0.13 | 0.14 | 0.36 | | INCREASE_ERP | -1.30* | 0.61 | 0.04 | | DECREASE_ERP | -1.13 | 0.73 | 0.13 | | R-squared | 0.58 | F-statistic | 12.57 | | Adjusted R-squared | 0.53 | Prob(F-statistic) | 0.00 | | Log likelihood | 145.68 | | | | Note: * Significant at 5 per cent level of confidence. |
| Table 2: Regression Results for IIP (Sample period: March 2006-October 2019) | | Explanatory variables | Coefficient | Std. Error | Prob. | | C | 0.01* | 0.01 | 0.02 | | IIP (-3) | 0.58* | 0.08 | 0.00 | | IIP (-6) | 0.24* | 0.08 | 0.00 | | INCREASE_ERP | -2.98* | 0.72 | 0.00 | | DECREASE_ERP | -0.86 | 0.83 | 0.30 | | R-squared | 0.55 | F-statistic | 48.25598 | | Adjusted R-squared | 0.54 | Prob (F-statistic) | 0 | | Log likelihood | 313.81 | | | | Note: *Significant at 5 per cent level of confidence. |
|