As countries rush to inoculate their populations, the global economy should regain lost momentum in Q2. Bond vigilantes could, however, undermine the recovery, unsettle financial markets and trigger capital outflows from emerging markets. The Reserve Bank is striving to ensure an orderly evolution of the yield curve, but it takes two to tango and forestall a tandav. There is a restless urgency in the air in India to resume high growth, with signs that the capex cycle is uncoiling and turning, and earnings results of corporates having beaten market expectations. Inflation has witnessed upside pressures. Introduction In March, wrote Charles Dickens in his book Great Expectations, the sun shines hot and the wind blows cold. It is summer in the light, and winter in the shade. Winter is holding back, and spring is pulling forward - winds and clouds and changing skies, and then serene in an hour. Five developments marked the onset of March. First, calm returned after the flash bond sell-offs globally and in India that heralded the arrival of March, prompting a calling out of vigilantes who have returned to prowl markets, guns holstered and saddled up1 (Chart 1). In India, the benchmark 10-year yield, which had averaged 5.93 per cent during April 2020 to January 2021 surged to 6.13 per cent on February 2 on the announcement of the market borrowing programme of the central government, reportedly higher than what was expected2. Following the announcement of a slew of measures by the Reserve Bank on February 5, however, the benchmark eased to 5.96 per cent by February 11. Thereafter, global spillovers in the form of hardening crude prices, announcements of fiscal stimulus, inflation fright as revealed in break-evens and fears of central bank stance reversals, and a lukewarm response to the US Treasury’s primary auction sparked a worldwide stampede in bond markets. With the US 10-year benchmark soaring to 1.6 per cent from around 1 per cent, bond markets in India were pit-roasted by persistent selling and shorting; by March 5, the benchmark in India had touched 6.23 per cent, but the Reserve Bank’s announcements of large-sized operation twists soothed frayed nerves and settled the benchmark at around 6.21 per cent on March 9. Yields, however, firmed up subsequently on spillovers from the spike in US yields. 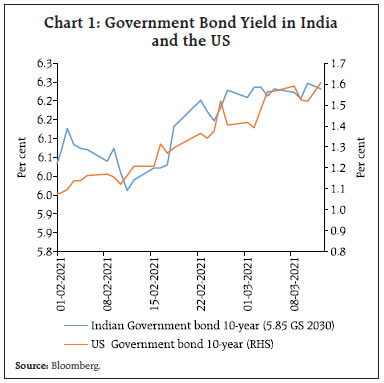 Although the turmoil was short-lived, it gave a glimpse of the destabilising impact of expectations running too far ahead of outcomes as if with the onset of spring, summer cannot be far behind – as if the recovery has gained full traction and inflation is round the corner. It is a familiar script. The pandemic stirs a heady cocktail - fiscal stimulus; monetary accommodation; release of pent-up demand; vaccine rollout - on which the bond vigilantes thrive. As growth forecasts for 2021 are ratcheted up, they see in them the spectre of long dormant inflation, the archenemy of bonds as it erodes the real value of the fixed income they provide. With these latent anxieties, bond vigilantes turn sceptical about the central bank’s promise to remain accommodative and start the rout. The pretext can be country-specific idiosyncratic factors - more than anticipated government borrowing in India although it is less than last year, both gross and net; the return of break-even inflation on the far horizon in the United States (US), but as the Federal Reserve Chairman pointed out, inflation dynamics can change over time but not over a dime. Moreover, the Fed has said that it will target average inflation of 2 per cent going forward, thereby tolerating inflation above 2 per cent for periods of time. Almost as suddenly, the worst fears about inflation have receded again. There are probably limits to how far an inflation scare can run this early in the economic recovery! Nevertheless, forewarned is forearmed: bond vigilantes are riding again, ostensibly trying to enforce law and order on lawless governments and central banks but this time around, they could undermine the economic recovery and unsettle buoyant financial markets. Fears over US interest rates have already started spilling over on to emerging market economies (EMEs). Investors have started pulling out money from EME stocks and bonds in an abrupt ending of a streak of inflows that had remained uninterrupted since October 2020. The Institute of International Finance (IIF) points out that foreign investment turned negative in emerging market equities and debt from the latter part of February, bringing back fears of the 2013 taper tantrum. While the external balances and debt profiles of many emerging economies are in better shape today than in 2013, they are not immune. Investors have, however, become more discerning in which assets to target, with corporate bonds faring particularly poorly thanks to the broader debt sell-off. The “push” factor of low yields in advanced economies (AEs) and the “pull” factor of potential currency appreciation in emerging markets could reverse. Sub-zero real yields have also induced investors to fan out into other segments of financial markets; the recent rise in yields has naturally caused equity and forex markets to seesaw nervously. Bond prices are countercyclical most of the time. This feature makes them very attractive diversifiers for equities, the prices of which are more procyclical, moving up and down in tandem with the economic cycle. Central banks across the world have at pains stressed that they remain true to their commitment of accommodation. In this context, it is worthwhile to ponder over recent remarks made by the Governor, Reserve Bank of India, in a press interview that was also widely televised: “An orderly evolution of the yield curve has to be orderly, it cannot be otherwise…..look at the RBI’s actions over the last one year…. from April till now, we have done a total open market operation (OMO) of more than ₹3 lakh crore. Considering the borrowing requirement of next year, there is no reason why RBI should do less OMO in the next year that is 2021-2022 than what we did in the current year…. We have again extended this dispensation for held to maturity (HTM). That opens up space for another ₹4 lakh crore. Now let us do the arithmetic. ₹3 lakh crore of OMO of last year, it could be even more, ₹4 lakh crore space created because of the HTM dispensation, that is ₹7 lakh crore. The net borrowing is ₹9 lakh crore, so therefore, the borrowing requirement of government of India is very much manageable…liquidity will continue to be sufficient, we will make available liquidity at the appropriate times and we will see that the borrowing programme goes through in a very orderly manner.” This type of calming forward guidance from central banks also hides a tension - their nerves can fray if they see a painfully extracted economic revival, and financial stability built at the altar of regulatory forbearance, threatened by adventurism. Will they engage in more aggressive actions? After all, they hold the Brahmastra - asset purchases. If bond yields get too high, the relentless weight of bond purchases by central banks will stabilise markets, but at the cost of market activity. The recent reiteration of the resolve of the Reserve Bank of Australia is a reminder that central banks have the firepower to cap bond yields, if they are determined to do so. Investors must understand their exposures when they set about to scour the landscape to exploit signs of market dysfunction. What markets do not realise beyond the break evens, TIPS and policy stimulus is that there is no way the economy can withstand higher interest rates in its current state. It is recovering but certainly not out of the woods yet. There is much sense in what the Reserve Bank of India is doing in striving to ensure an orderly evolution of the yield curve. But it takes two to tango and forestall a tandav. Macroeconomic policy making, as in everything else, runs on a demonstration effect. Among countries too, innovations that succeed tend to get emulated with varying degrees of success. For example, two experiments that worked for AEs also worked well for emerging economies – trade liberalisation; and inflation targeting. Two that have not enthused many of the latter much are capital account liberalisation and freely floating exchange rates. Now, in AEs, fiscal policy is on activist mode and monetary policy is accommodative. Similar policy stances characterise developing economies. It is a necessary configuration, but should it fail, it will lead to capital outflows and currency depreciation. Two factors suggest that India will decouple from other developing economies and ride out the storm. First, the rate of growth of GDP - the rate of the return on the economy - exceeds the rate of interest on the stock of public debt, the necessary condition of debt sustainability. Today’s stock of public debt at around 90 per cent of GDP will go down to about 85 per cent of GDP at end-March 2026. All that India has to do is to meet the sufficient condition - generate revenue surpluses net of interest payments to pay down the debt. Second, India enjoys monetary policy credibility3. Second, more than 363 million doses of COVID-19 vaccines have been administered around the world since December. Rich countries have stockpiled over 1 billion doses more than they need. The 54 richest countries account for 18 per cent of adults on earth, but 40 per cent of vaccine orders – enough to give each of their adults 2.5 two-dose regimens. As rich countries have rushed to inoculate their populations, poorer ones have watched from the sidelines. Ghana became the first country to receive a vaccine through the COVAX programme, a global coalition which distributes free doses to poor countries and is backed by the World Health Organisation. Ghana’s shots were provided by India (Chart 2). India has set out to win hearts and lives – दिल जीतिए, as the former Prime Minister late Shri Atal Bihari Vajpayee had advised the Indian cricket team. As on March 16, a total of 5.9 crore vaccines have been exported to 70 countries. Of these, 81 lakh are free doses sent to 20 nations, 1.65 crore under COVAX and 3.4 crore exported on commercial terms. India has also announced a gift of 2 lakh doses for the UN peace keeping forces. According to Dr. Peter Hotez, a top US scientist, India has “rescued the world”. As the COVID-19 vaccination drive encounters production glitches in Europe, hits distribution snags in America, and faces a geopolitical scramble for supply everywhere, an Indian biotechnology and pharmaceutical company4 has stood like Casabianca, the boy who stood on the burning deck, whence all but he had fled5. By the end of the year, it will add 1.5 billion COVID-19 shots to 1.3 billion - 1.5 billion doses against diseases from measles to tuberculosis that it already produces annually. These shots are cheap and do not need to be stored at ultra-low temperatures. They will inoculate the world’s poor. 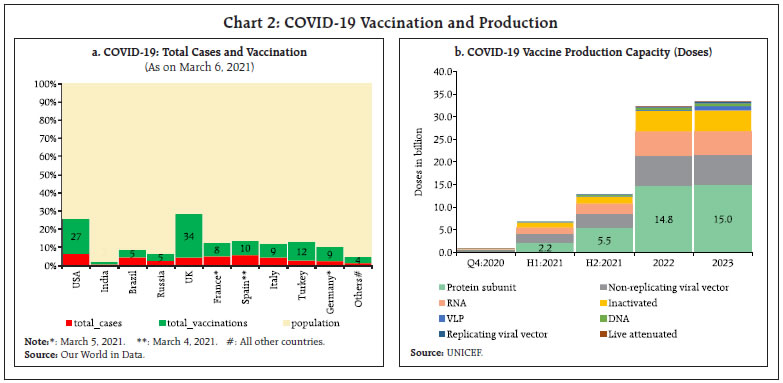 Third, on March 15, the Ministry of Commerce and Industry released provisional data on India’s foreign trade that showed that the recovery in merchandise exports that had spanned two successive months since December 2020 faltered and dipped. Abstracting from statistical base effects, this masks a more diabolical crisis brewing underneath. Global trade logistics disruptions pose a fresh challenge to the recovery. Around the planet, the pandemic has disrupted trade to an extraordinary degree, throwing into disarray the choreography of moving cargo from one continent to another. At the centre of the storm is the shipping container, the workhorse of globalisation. Since they were first deployed in 1956, containers have revolutionised trade by allowing goods to be packed into standard size receptacles and hoisted by cranes onto rail cars and trucks, effectively shrinking the globe. Containers that carried millions of masks to countries in Africa and South America early in the pandemic remain there, empty and uncollected, and frequently stuck for days in floating traffic jams because shipping carriers have concentrated their vessels on their most popular routes - those linking North America and Europe to Asia. Moreover, the pandemic and its restrictions have limited the availability of dock workers and truck drivers, causing delays in handling cargo from Southern California to Singapore. Empty containers are piled up at ports in Australia and New Zealand; containers are scarce at India’s port of Kolkata, forcing makers of electronics parts to truck their wares more than 1,000 miles west to the port of Mumbai, where the supply is better. Rice exporters in Thailand, Vietnam and Cambodia are forgoing shipments to North America because of the impossibility of securing containers (Chart 3). 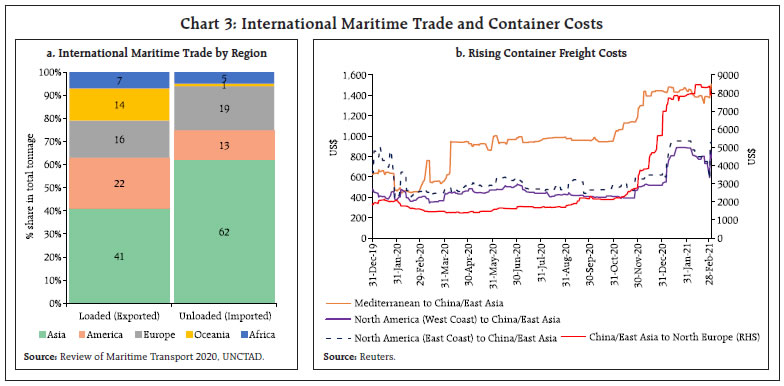 Fourth, the Organisation for Economic Co-operation and Development (OECD) released its interim economic outlook report on March 9, forecasting that India would be the fastest growing economy in 2021 and 2022. In its view, economic activity in India has moved above pre-pandemic levels in spite of vulnerability to risks from the spread of new mutations. The IMF’s Economic Counsellor had pointed out on March 8 that with 7 per cent of world GDP on a purchasing power parity basis, what happens in India has implications for many other countries in the world. With growth projected at 11.5 per cent in 2021-22, she added, India growing ensures positives for other parts of the world by increasing demand. Although still hesitant, there are signs that the capex cycle is uncoiling and turning. First, capital expenditure of the Union government recovered from a y-o-y decline of 11.6 per cent during H1:2020-21 and made a sharp turnaround, growing by 144.7 per cent during October 2020 to January 2021 (Chart 4a). Second, provisional monthly accounts for 20 states show that capital expenditure (net of loans and advances disbursed) has gradually recovered to pre-pandemic levels during H2:2020-21, with December and January registering robust growth of 28.4 and 23.9 per cent, respectively (Chart 4b). So far, 9 states have presented their budgets for 2021-22 in which their combined capital expenditure for 2021-22 is 35.7 per cent above the revised estimates for 2020-21. Third, quarterly results for Q3:2020-21 point to signs of revival of key capital goods producing firms, with revenue growth steadily improving. Infrastructure firms have also recorded a healthy expansion in order books, with demand from transmission, distribution, green energy business, roads and highways, railways and metro services. Fourth, there has been a revival in the real estate sector. With the inventory overhang coming down, construction activity has registered a growth of 6.2 per cent in Q3:2020-21. This is mirrored in steel consumption – a proximate indicator for construction activity. Fifth, investment in machinery and equipment is clearly recovering as evident in the co-movement upwards of imports and production of capital goods after a prolonged phase of contraction. Sixth, foreign portfolio investors (FPIs) have increased allocations towards the capital goods sector to a three-year high, driven by attractive valuations, brightened prospects of revenue realisation and a bulging order book. 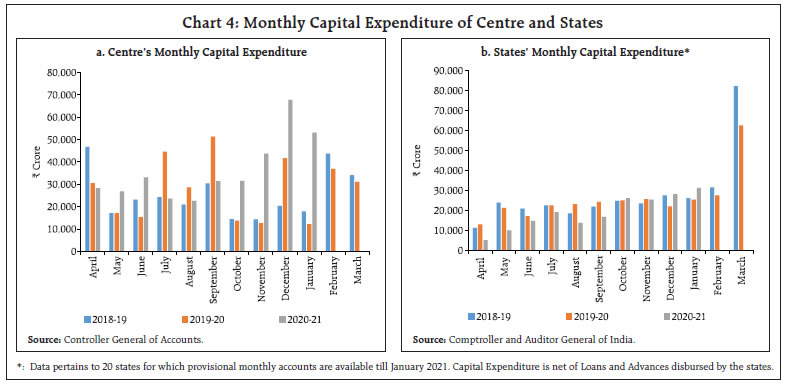 On February 26, the Reserve Bank revived and released the Report on Currency and Finance, reviewing India’s monetary policy framework. In view of the topical relevance of the theme – the inflation target has to be reviewed by March 31, 2021 –the focus of public interest will overridingly be on the target and the tolerance band around it. But the Report, probably a once in a lifetime offering, has many flowers that blush unseen in its rich bouquet. They must not wither; they need to find a place in the sun: -
EMEs are embracing inflation targeting (IT) and bringing in innovations, including the marriage of foreign exchange interventions with IT frameworks; they are lowering targets and narrowing bands. -
India’s regime shift towards flexible IT (FIT) moment arrived, not when it received legislative mandate in 2016, but back in the fateful summer of 2013 with the taper tantrum. -
Monetary policy is a contract between the people and the sovereign. Inflation is the metric by which this contract can be evaluated. In India, a societal intolerance to inflation at the double-digit threshold has manifested itself from time to time. -
Flexibility must be built into the framework, without undermining the discipline of the inflation target. -
The approach of the Monetary Policy Committee (MPC) has been gradualistic and forward-looking, reflecting sensitivity to output effects without being driven by past inflation readings while deciding the policy rate. -
Structural changes in the economy were underway even before FIT, slowing down growth – deceleration in India’s trend growth; moderation in saving and investment rates; declining pace in the growth of capital stock and employment; signs of reversal in demographic dividend; less favourable external environment on rising trade protectionism and climate change compulsions. -
The MPC has seen it all – unanimous decisions to divided views; dissent from the consensus view by both external and internal members; absence of groupthink and free-riders in monetary policy making in the FIT regime. -
Monetary transmission has been full and reasonably swift across the money market but less than complete in the bond markets; while there has been an improvement in transmission to lending and deposit rates of banks, external benchmarks across all categories of loans and deposits could improve transmission further. -
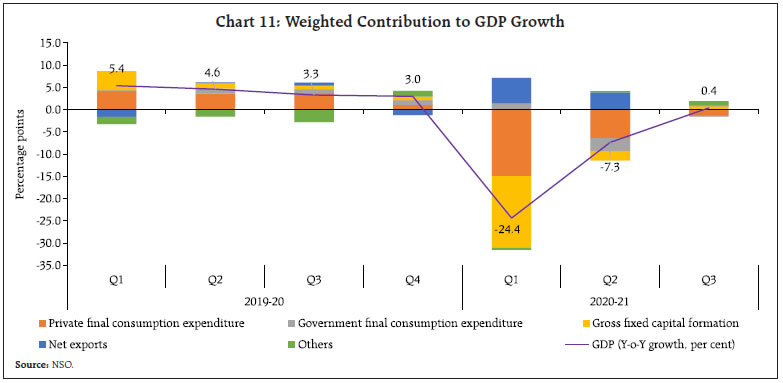
EMEs have been late movers in the adoption of FIT in view of…the ‘fear of floating’ and ‘fear of appreciation’. In practice, most EMEs…have resorted to frequent and large interventions…to deal with…excessive capital flows and …exchange rate volatility. The remainder of the article is organised into five sections. An overview of global conditions is presented in Section II. In Section III, we discuss recent developments in the domestic economy. Section IV summarises financial market conditions prevailing in the country while concluding remarks are laid out in Section V. II. The Global Setting As countries rush to inoculate their populations and others too, even as they struggle with resurgences and mutant strains, the lingering effects of the slowdown in global economic activity in Q4:2020 are beginning to fade in Q1:2021. It is looking more likely now than before that the global economy will regain lost momentum in Q2. This is validated by the OECD’s latest interim outlook. The global growth forecast for 2021 has been revised up by 1.4 percentage points in a span of three months (Table 1). The projection of growth for the United States (US) has more than doubled, bumped up by the US$1.9 trillion fiscal stimulus and rapid vaccination. The OECD foresees global output to exceed the pre-pandemic level by the middle of this year, though many countries would be lagging behind the level that was expected by end-2022 in the pre-COVID-19 world (OECD, 2021). Among early-March 2021 data arrivals, the global composite purchasing managers’ index (PMI) for February 2021 scaled a four-month high, with the US ruling the roost, followed by India (Chart 5). Within this indicator, the global manufacturing touched a three-year peak, but on a sobering note, cost pressures in input and output prices have risen to decadal highs. In the US, the labour market recovered from the pandemic-induced winter slump, which had shredded 3,06,000 jobs. In February, 3,79,000 positions were created, about 2.3 times more than in January. Even as new claims for unemployment benefits rose to 745,000 in the last week of February, the 4-week moving average was the lowest since early December. In the Euro area, unemployment in Spain soared to a five-year high in February while retail sales in Germany continued to decline in the wake of a protracted lockdown and re-calibration of sales tax6. World trade grew by 1.3 per cent in December 2020 over a year ago (Chart 6). By end-2020, global trade had achieved its level at the beginning of the year and had made up for the loss inflicted by COVID-19. Industrial production has also risen back to its level at the start of 2020. 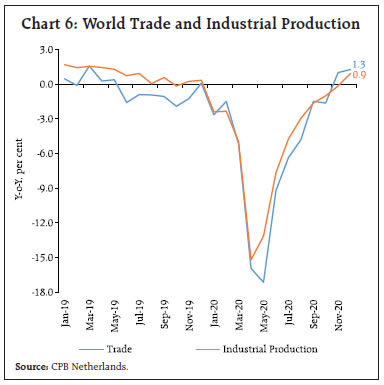 With economic uncertainty receding, gold continued to lose sheen as safe haven demand waned. Gold prices in the first half of March were the lowest since May 2020. Crude prices continue to boil as demand rises sharply, while the Organization of Petroleum Exporting Countries (OPEC) plus in its latest meeting decided to maintain status quo on output up to April 2021. Brent prices briefly crossed $70 a barrel in the second week of March for the first time since the pandemic after the world’s largest supplier – Saudi Arabia – stated that its energy facilities had been attacked, targeting the security and stability of global supplies. There is a growing consensus that a commodities super-cycle is forming (Goldman Sachs, JP Morgan Chase & Co. etc.) [Chart 7]. Global financial market conditions are in a Goldilocks moment7. After the end-January correction, stock markets across the world rose again up to mid-February with the US S&P and Indian Sensex, scaling new peaks (Chart 8a). Japan’s Nikkei surpassed 30,000 for the first time since 1990 on expectations of strong growth and business earnings. 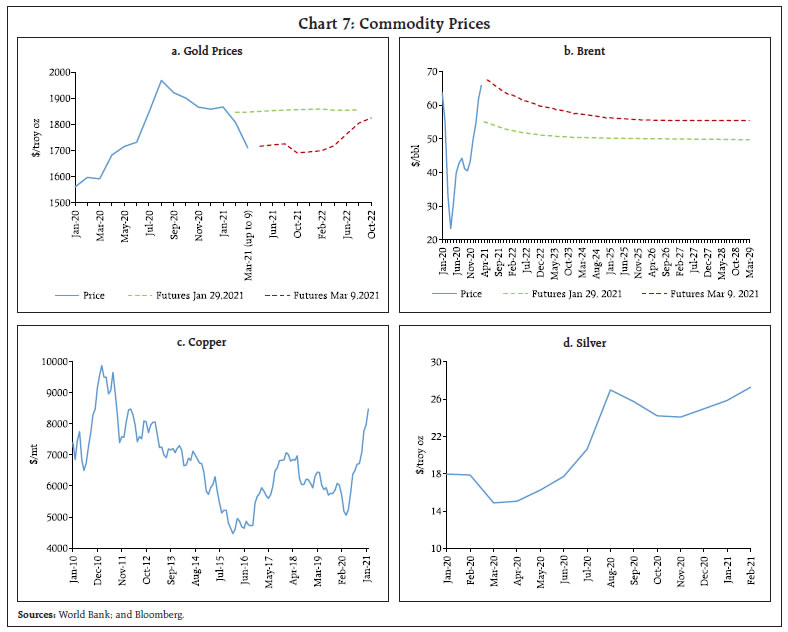 At the same time, reflation trade has been gathering strength and the 10-year break-even rate, which is a key measure of the market’s inflation expectations, rose sharply (Chart 8b). Guided by expectations of a strong recovery and hence firming inflation, there was a sell-off in US bonds. Long-term bond yields shot up – the 10-year yield has inched up close to 1.6 per cent, while the 30-year yield is near 2.25 per cent. With more fiscal stimulus in the offing and vaccination gathering pace, long-term rates were pushed up while near-term rates held steady, which increased the slope of the yield curve (Chart 8c). The sell-off in bonds and steepening of the yield curve in the US spread rapidly to other jurisdictions. 10-year benchmark yields ruled at their highest levels in a year in the US, United Kingdom (UK), Euro area, Japan, Australia, China and others (Chart 8d). Rising yields triggered corrections in equity markets across the world and capital outflows from the EMEs for the first time since October 2020, leading to weakening of the EME currency index (Charts 8e and 8f). The daily tracker of cross-border flows of the IIF covering data for 30 EMEs shows that foreign investment turned into daily outflows of about US$290 million during the first week of March, compared with daily inflows of about US$325 million in February. 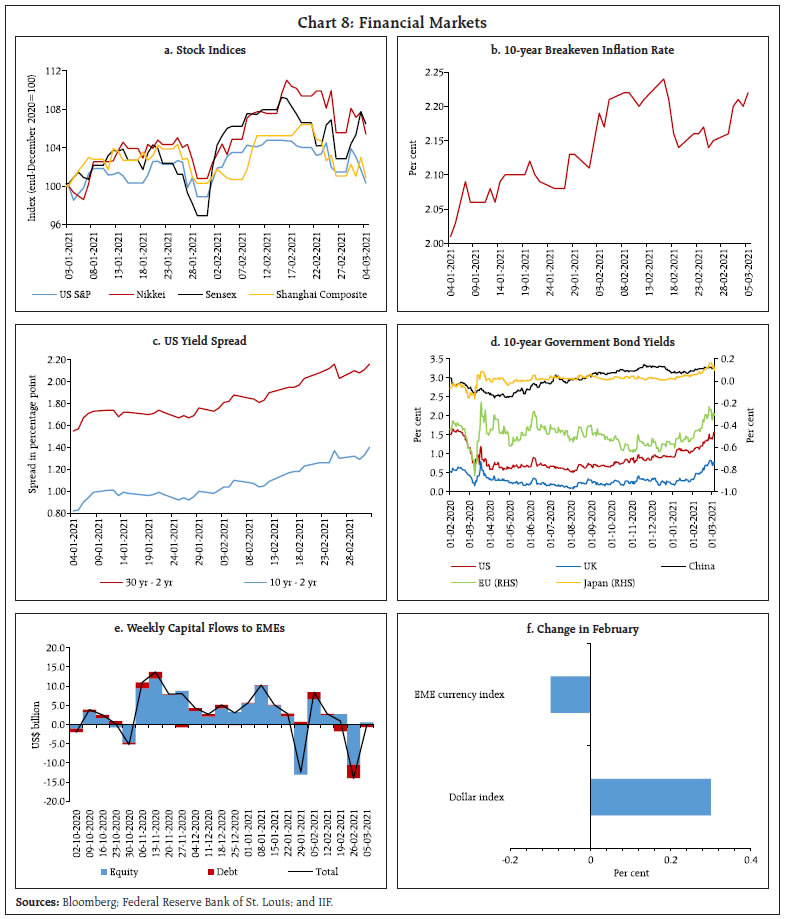 With prices for emerging market assets having come under pressure, the Morgan Stanley Capital International (MSCI) broad gauge of emerging market equities has dipped by 7 per cent in dollar terms from its high less than a month ago. Debt tracked by JPMorgan’s global EMBI index has recorded a loss of about 4 per cent from the end of 20208. After a two-month hiatus, major central banks resumed rate cutting in February with both Bank Indonesia and Banco de México reducing their policy rates by 25 basis points each to 3.5 per cent and 4.0 per cent, respectively. The European Central Bank has announced that asset purchases under the Pandemic Emergency Purchase Programme would be at a significantly higher pace over the next quarter than during the first months of the year. On the other hand, the Federal Reserve and the Reserve Bank of New Zealand (RBNZ) have announced winding down of a few temporary pandemic-support facilities with minimal usage. It has also been the season of modification of remits of MPCs. While the basic objectives and nominal anchors of monetary policy remain the same for both the UK and New Zealand, some elements have been added to the decision-making and policy-implementation process. The RBNZ’s MPC is henceforth required to outline, inter alia, the impact of its decisions on the government’s policy of sustainable house prices. The Bank of England MPC’s remit has been updated, mirroring the government’s economic strategy, which seeks to achieve growth that is environmentally sustainable and consistent with the transition to a net zero carbon economy. The key development on the fiscal front was the American Rescue Plan, the new stimulus of US$1.9 trillion – the second highest fiscal stimulus in the US – being signed into law, within a year of the highest ever stimulus. The OECD estimates that in its first full year of implementation, spanning from Q2:2021 to Q1:2022, the stimulus plan would expand output by about 3-4 per cent, roughly equal to the current spare capacity of the US economy. It would also increase demand in other economies, particularly Canada and Mexico, while also improving domestic employment and inflation prospects. III. Domestic Developments India’s vaccination drive faced off against localised surges in COVID-19 cases since mid-February. By March 16, India’s active caseload stood at 2,23,432 with daily cases averaging around 20,000 during the first half of March; 6 States account for 85 per cent of the cases (Chart 9a). The pace of vaccination is picking up, with 2.5 crore doses being administered in the same period. Cumulatively, India has administered around 3.3 crore doses so far (March 16, 2021), which is the third highest among vaccination programmes globally (Chart 9b). Meanwhile, Covaxin – a drug developed by Bharat Biotech – has shown an interim vaccine efficacy of 81 per cent alongside significant immunogenicity against the rapidly emerging variants. The swift pace of vaccination raises hopes of a faster recovery, given that the recent spike in COVID-19 infections is largely restricted to a few states, and restrictions in terms of partial lockdowns/squeeze in market hours/night curfews have been primarily local. 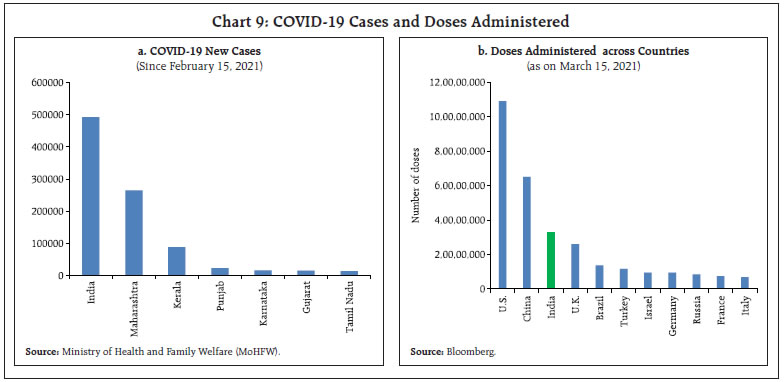 Mobility indicators, such as the Apple mobility index, indicate that movement has normalised across all major cities through February and March 2021, barring a slight blip in Mumbai and Pune owing to the recent surge in COVID-19 cases (Chart 10). The Google mobility index also reflects a steady improvement, except around retail and recreation that moderated somewhat in March. Aggregate Demand The second advance estimates (SAE) of national income of the National Statistical Office (NSO) show that the pace of contraction moderated across all components, with gross fixed capital formation (GFCF) emerging out of negative territory (Chart 11). A pick-up in private consumption, spurred by a strong release of pent-up demand, spending by Government, robust agricultural performance, and the coincident revival of manufacturing, construction, banking and real estate activity, provided the bedrock of the recovery. 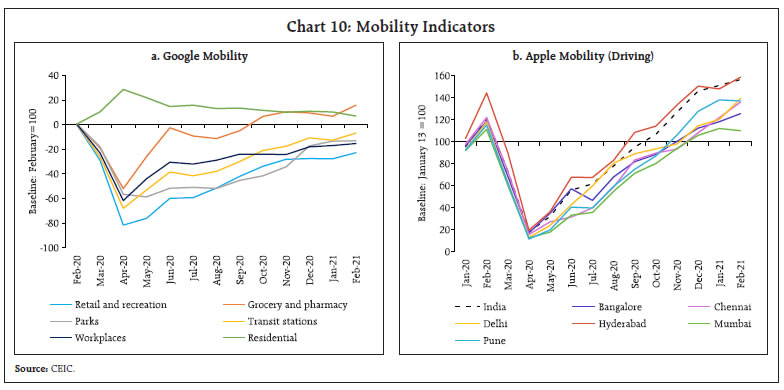
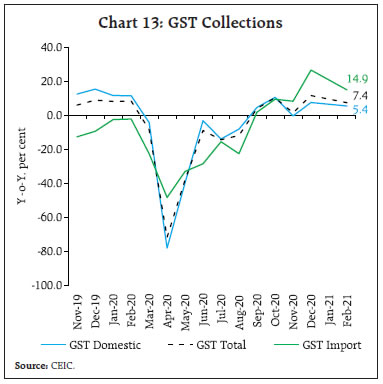
 Aggregate demand is expanding in a broad-based manner, and conditions continue to register steady improvement. Electricity generation was 16.5 per cent more during March so far than a year ago (Chart 12a). The average daily power demand in the country rose by 3.5 per cent in February, the sixth consecutive month to record a rise in electricity demand. Electricity usage in states like Gujarat, Punjab, Maharashtra, and West Bengal, where industrial and commercial requirements constitute 40 per cent of the overall demand, grew in the range of 0.4 to over 6.6 per cent (Chart 12b). Moody’s Investor Services has upgraded the outlook for the Indian power sector from ‘negative’ to ‘stable’. The 13th edition of the Retail Business Survey by the Retailers Association of India indicated that retail sales were 93 per cent of pre-COVID-19 levels in February 2021, driven by consumer durables and quick service restaurants. The industry is optimistic that the recent surge in COVID-19 cases should not impair nascent revival. Collections under the goods and services tax (GST) continued to remain above the ₹1 lakh crore mark for the fifth straight month in February 2021, marking an increase of 7.4 per cent over the previous year and reflecting the sustained business activity. Collections from domestic transactions grew by 5.4 per cent and by 14.9 per cent from imports (Chart 13). The inter-state analysis of domestic GST revenue collections indicate that Maharashtra, Gujarat, Karnataka, Tamil Nadu, Uttar Pradesh and Haryana contributed close to 57 per cent of the total (Chart 14). 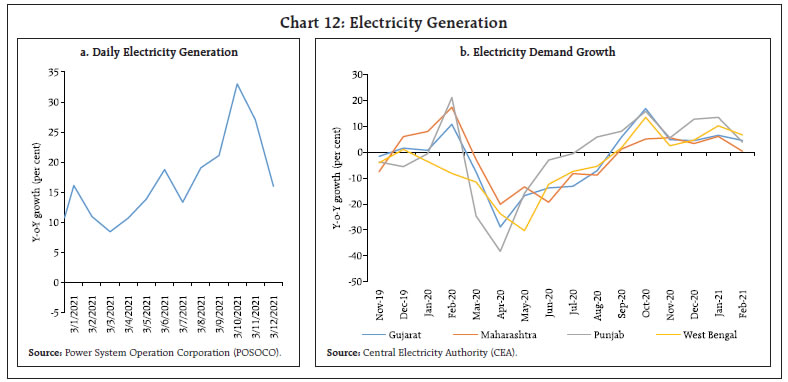
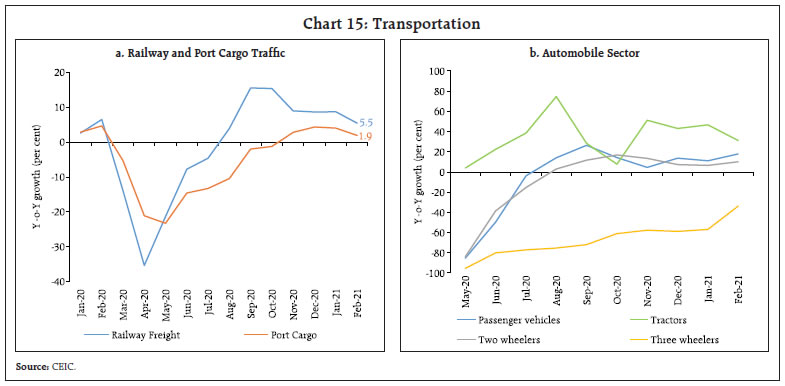
 High frequency indicators of transport reflect some moderation in growth in February 2021, coinciding with the surge in fresh COVID-19 cases in states like Maharashtra and Kerala. Port cargo moderated to a growth of 1.9 per cent and domestic air cargo reverted to sub-normalised freight quantities. On the other hand, railway freight traffic remained resilient, growing by 5.5 per cent in February 2021 (Chart 15a). Tractor sales continued their stellar run in February, posting a growth of 31.1 per cent on the back of a resilient agricultural/rural sector (Chart 15b). The automobile sector9 exhibited growth in February on the back of a low base effect with passenger vehicles and two wheelers driving growth in the wholesale segment. Retail sales of passenger vehicles increased, despite global semiconductor outage. Registrations of two wheelers, however, contracted. 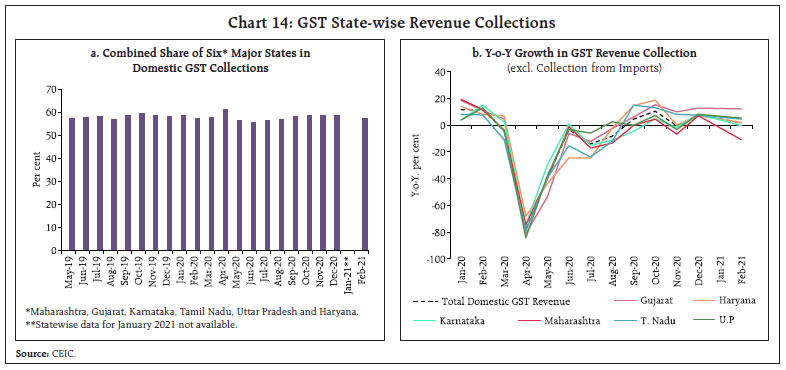
 The household survey of the Centre for Monitoring Indian Economy (CMIE) on employment reveals a blip in February 2021, with the average employment rate receding marginally to 37.7 per cent from 37.9 per cent a month ago. Consequently, the average unemployment rate rose moderately to 6.9 per cent from 6.5 per cent in January 2021, but was lower than the pre-pandemic level of 7.8 per cent (February 2020) [Chart 16]. The labour force participation stood at 40.5 per cent in February, slightly down from 40.6 per cent a month ago. Urban areas outperformed their rural counterparts, with urban unemployment easing to 7.0 per cent, the lowest in the last thirty months. Rural employment suffered, on the other hand, with unemployment increasing to 6.9 per cent from 5.8 per cent a month ago. A quickened pace of labour re-absorption in urban India may be reflective of economic activity normalising. Through the release of the periodic labour force survey (PLFS) for urban areas, an official estimate has been made for the first time on the extent of disruption faced by workers during April-June 2020 when economic activity was at its nadir (Box 1). 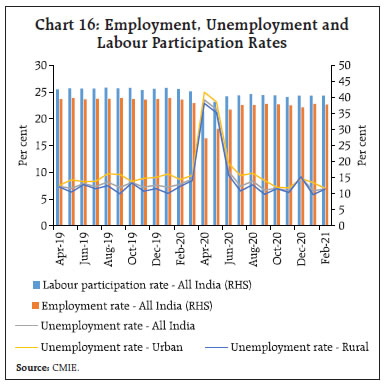
Box I: Movements in Urban Labour Market in April-June 2020 The Ministry of Statistics and Programme Implementation (MoSPI) has now released data from its periodic labour force survey (PLFS) for April-June 2020 for urban areas. Labour markets bore the extreme brunt of the COVID-19 outbreak and economic disruptions caused by the lockdown. According to the International Labour Organization1, India registered an annual average loss of 13.7 per cent in working hours in 2020. Officials numbers, by and large, are directionally in line with alternative data sources in terms of unemployment, which are showing a sharp increase in the unemployment rate (UR) (Chart 1). This sharp rise in unemployment in India is similar to the experience of the US where the adjustment occurred via the temporary laying off of workers, and opposing to the experience of the Euro Area where workers either remained on payrolls due to job retention scheme or left the job market completely (ECB 2020). During April-June 2020, the unemployment rate increased sharply to 20.9 per cent from 9.1 per cent in January-March 2020 and 7.9 per cent in October-December 2019. During the same period, the labour force participation rate (LFPR) declined to 35.9 per cent from 37.5 per cent in January-March 2020. However, the worker population ratio (WPR) declined very sharply, reflecting high job losses at 28.4 per cent in April-June 2020 as compared with 34.1 per cent in January-March 2020 and 34.2 per cent in October-December 2019. 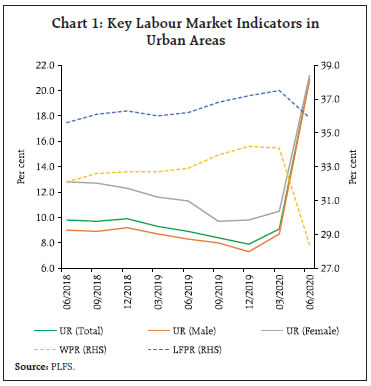 The impact of COVID-19 is more vividly visible when analysed in terms of transition from one employment category to another (Table 1). For this, activity of same persons is tracked for two adjacent quarters. It can be observed that all categories of workers were affected adversely, with share of unemployed in total working age population (> 15 years) rising to 9.9 per cent in April-June 2020 from 3.7 per cent in Jan-March 2020 and labour force participation declining to 45.9 per cent from 48.4 per cent during the same periods. While casual labourers were forced mostly to unemployment, regular wage earners and self-employed became unemployed and some moved completely out of economic activity. | Table 1: Distribution of Persons (>15 years) by Activity between Adjacent Quarters | | Activity during January-March 2020 | Activity during April-June 2020 | | Own Account Worker, Employer | Helper in Household Enterprise | Self- employed (1+2)# | Regular Wage/ Salary | Casual Labour | Unemployed | Not in Labour Force | All (3+4+5+6+7) | | 1 | 2 | 3 | 4 | 5 | 6 | 7 | 8 | | 1. | Own account worker, employer | 6.6 | 0.0 | 11.4 | 0.2 | 0.0 | 1.0 | 0.9 | 13.5 | | 2. | Helper in household enterprise | 0.0 | 1.1 | 1.7 | 0.0 | 0.0 | 0.1 | 0.4 | 2.2 | | 3. | Self-employed (1+2)# | 7.1 | 1.2 | 14.1 | 0.2 | 0.0 | 1.2 | 1.4 | 16.9 | | 4. | Regular wage/ salary | 0.1 | 0.0 | 0.3 | 18.7 | 0.0 | 2.1 | 1.1 | 22.2 | | 5. | Casual labour | 0.0 | 0.0 | 0.2 | 0.1 | 1.8 | 2.5 | 0.5 | 5.1 | | 6. | Unemployed | 0.0 | 0.0 | 0.1 | 0.1 | 0.2 | 3.7 | 0.3 | 4.3 | | 7. | Not in labour force | 0.1 | 0.1 | 0.2 | 0.2 | 0.1 | 0.3 | 50.8 | 51.6 | | 8. | All | 7.3 | 1.3 | 14.8 | 19.2 | 2.1 | 9.9 | 54.1 | 100.0 | Note: # : In column and row 3, self-employed workers who had work in household enterprise but did not work due to sickness or other reasons are also included.
Source: PLFS, MoSPI. | Furthermore, workers in younger age groups suffered disproportionately as the unemployment rate increased to abnormally higher levels of 34.7 per cent from 21.1 per cent in January-March 2020 and much above the increase in overall unemployment. The burden was primarily born by younger male workers (Chart 2). The state-level analysis of labour data reveals that urban unemployment was the highest in Maharashtra, the most urbanised and industrialised state of India (Chart 3). Incidentally, the maximum number of COVID-19 infections are recorded in Maharashtra.
References ECB. (2020). The impact of the COVID-19 pandemic on the euro area labour market. ECB Economic Bulletin(8). Retrieved from https://www.ecb.europa.eu/pub/economic-bulletin/articles/2021/html/ecb.ebart202008_02~bc749d90e7.en.html International Labour Organization. (2021). COVID-19 and the world of work. ILO Monitor.
|
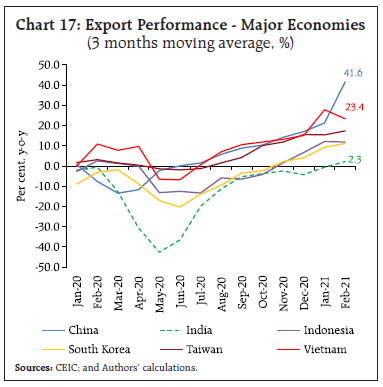 India’s merchandise trade has rebounded in recent months with the global trading environment improving as economies exit lockdowns on the back of faster than expected vaccine rollouts. The recovery in merchandise exports, however, falls short of major Asian peers (Chart 17). Merchandise exports and imports for February 2021 have normalised to pre-pandemic levels. Non-oil exports remained in growth terrain for the sixth consecutive month. Non-oil non-gold imports too witnessed a growth of 6.1 per cent in February 2021, indicating signs of revival in domestic economic activity (Chart 18). Export growth has been lifted by the performance of iron ore, drugs and pharmaceuticals and rice, which had also remained resilient through the pandemic. Other sectors like chemicals and plastics are also back to pre-COVID-19 levels. However, lower exports of petroleum products, gems and jewellery, electronics and engineering goods acted as a drag. Gold, electronic goods, and chemicals topped the list of commodities that spurred import growth in February 2021. In contrast, petroleum, coal and transport equipment were the commodities that pulled down import growth. The bright spot in this trade revival is import of capital goods, boding well for investment demand in the economy (Chart 19). Revised Estimates (RE) of key deficit indicators for 2020-21 for the 9 states that have presented their budgets reveal the extent of pandemic induced deterioration. The gross fiscal deficit rose to 5.3 per cent of gross state domestic product (GSDP) over the budgeted figure of 3.3 per cent. Revenue spending saw a contraction in the revised estimates, with expenditure rationalisation more than compensating for pandemic-related additional spending. Overall, the revenue balance saw a slippage of 2.3 percentage points, moving from a budgeted surplus to a deficit in the revised estimates, driven primarily by a fall in states’ own tax revenue and devolution from the centre. For 2021-22, states’ gross fiscal deficit has been budgeted at 4.0 per cent of GSDP. The consolidation is sought to be achieved through enhancing revenue receipts and cuts in revenue expenditure while hiking overall capex outlays (Table 2).
Aggregate Supply Aggregate supply – measured in terms of real gross value added (GVA) – registered a growth of 1.0 per cent in Q3:2020-21, exhibiting a sharp sequential recovery over Q2 (Chart 20). Agriculture growth accelerated to 3.9 per cent in Q3 on account of robust growth in kharif production, as per the recent second advance estimates (2nd AE) of crop production, 2020-21. Manufacturing regained some momentum and returned to positive zone with a growth of 1.6 per cent, after five successive quarters of contraction. With revival in construction, financial, real estate and professional services, value added in the services sector in Q3:2020-21 reached its level a year ago. | Table 2: State Government Finances* - Key Indicators | | (Per cent of GSDP) | | Item | 2019-20 | 2020-21 (BE) | 2020-21 (RE) | 2021-22 (BE) | | Revenue Receipts | 18.7 | 20.8 | 18.1 | 19.0 | | Capital Receipts | 0.4 | 0.1 | 0.1 | 0.1 | | Revenue Expenditure | 18.3 | 20.2 | 19.8 | 18.9 | | Capital Expenditure | 3.0 | 4.0 | 3.6 | 4.2 | | Revenue Deficit | -0.4 | -0.6 | 1.7 | -0.1 | | Gross Fiscal Deficit | 2.1 | 3.3 | 5.3 | 4.0 | *: Data pertains to 9 states that have presented their Budgets for 2021-22. Negative (-) sign indicates surplus.
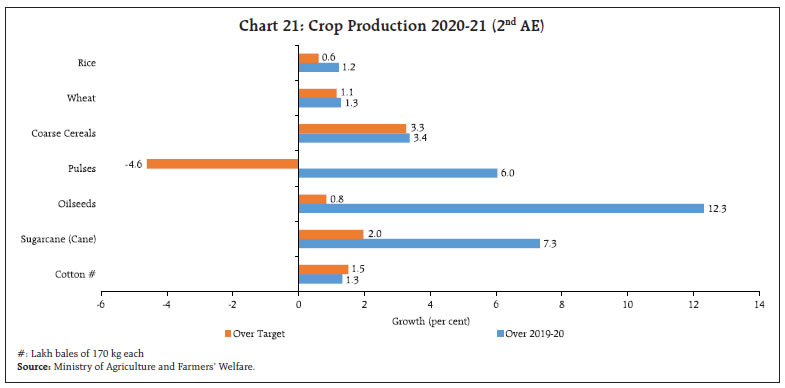
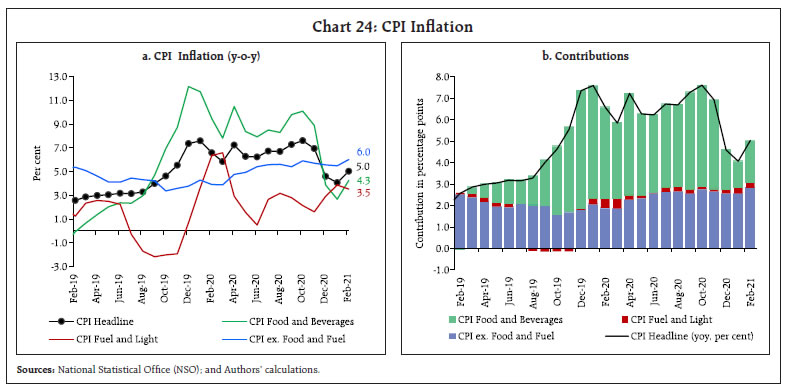
Source: Budget documents of state governments. | With the rabi season nearing to a close, the agriculture sector is set to harvest a bumper crop as per the 2nd AE for 2020-21 (Chart 21). Blessed by normal monsoon and procurement policy support, foodgrains production has touched 303.3 million tonnes - 2 per cent higher than the final estimates of a year ago. The growth in foodgrains is spread across all the principal crops in both rabi and kharif seasons. Foodgrains have beaten record production levels for the fifth consecutive year in a row. 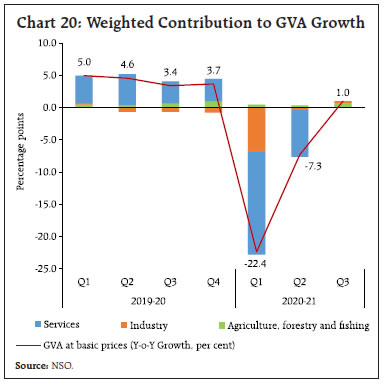
 Horticulture has registered a sharp rebound in production and acreage, far outpacing the foodgrains production since 2012-13. In 2020-21, the production of horticultural crops has been pegged at a record 326.6 million tonnes as per the first AE - 1.8 per cent higher than the final estimates of 2019-20. This was driven mainly by the step-up in production of fruits and vegetables (Chart 22). Production estimates for aromatics, medicinal plants and plantation crops have also been pegged higher than the previous year by 10.6 per cent. Among the three key vegetables (TOP), – production of potatoes and onions has jumped by 9.4 per cent and 0.8 per cent, respectively, spurred by increased acreage. This may soothe price pressures going forward. Tomato production has fallen by 4.8 per cent, despite an increase in acreage on account of the price crash during the lockdown leading to lower realisation by farmers. The headline manufacturing PMI stood at 57.5 in February 2021, continuing its expansive streak for the seventh successive month but easing slightly from 57.7 recorded in January 2021. As the health of the manufacturing sector improved, firms responded to strong increases in new work intakes by lifting production, input buying and stocking of purchases. Better demand conditions and smart marketing strategies steered new orders. February data pointed to the fastest increase in input inventories in the survey’s history. The expansion in input buying was the fastest in almost a decade. Future output remained steady at 60.6, signalling sustained strength of the sector going forward (Chart 23a). 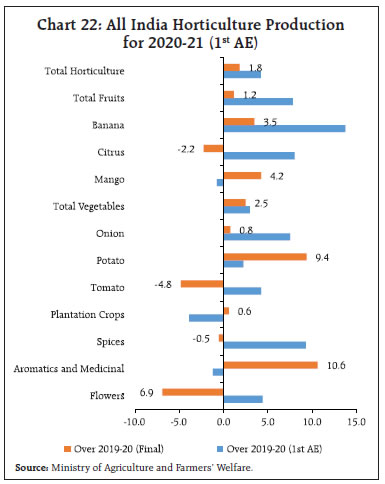 Bouyed by a sharp increase in new orders, the services PMI recorded the fastest pace of expansion in a year, rising to 55.3 in February 2021 (Chart 23b). The pace of expansion was higher than 52.8 a month ago and was above the long run average of 53.3. Overall input costs, however, surged amidst reports of higher freight, fuel and retail prices. The roll-out of COVID-19 vaccines generated optimism over future growth prospects and business confidence improved, as mirrored in the business expectations index, which rose to a twelve-month high to 59.2 in February. The Nomura India Business Resumption Index eased to 98.5 as on February 28 from 99.3 a week ago. Activity is now just 1.5 percentage points short of pre-COVID-19 levels, even though a rise in cases in a few states impacted mobility and poses a near-term localised risk. As per the services PMI release, transport and storage were the best performing segments in the services sector. Information and communication was the only sub-sector to have posted contraction in sales and business activity. Inflation In February 2021, CPI inflation was at 5.0 per cent, registering an increase of 97 basis points (bps) from the January 2021 reading of 4.1 per cent. A sharp increase in food and core inflation (CPI excluding food and fuel inflation) were the key drivers of the surge in headline inflation in February (Chart 24a). Food inflation increased to 4.3 per cent in February from 2.7 per cent in January. This was entirely on account of an adverse base effect of around 200 bps even as food prices registered a month-over-month decline of around 40 bps. Distinct inflation movements were observed in the food sub-groups in February. While five out of 12 food sub-groups exhibited double digit inflation, three sub-groups were in deflation. Inflationary pressures were visible in edible oils, protein-based food and non-alcoholic beverages. Cereal prices moved into deflation. Fuel price inflation softened in February due to LPG and firewood and chips. CPI excluding food and fuel inflation, which was already at an elevated level of 5.5 per cent in January, surged by an additional 50 bps to touch 6.0 per cent in February, the highest level since November 2018. This was propelled by a pick-up in inflation in transport and communication, health, clothing and footwear, recreation and amusement and household goods and services. Pan, tobacco and intoxicants and transport and communication saw double-digit inflation. Personal care and effects inflation remained elevated, despite some moderation due to fall in gold prices. Housing and education inflation remained muted. CPI excluding food and fuel (with a weight of 47.3 per cent) contributed to 56 per cent of the headline inflation in February (Chart 24b). 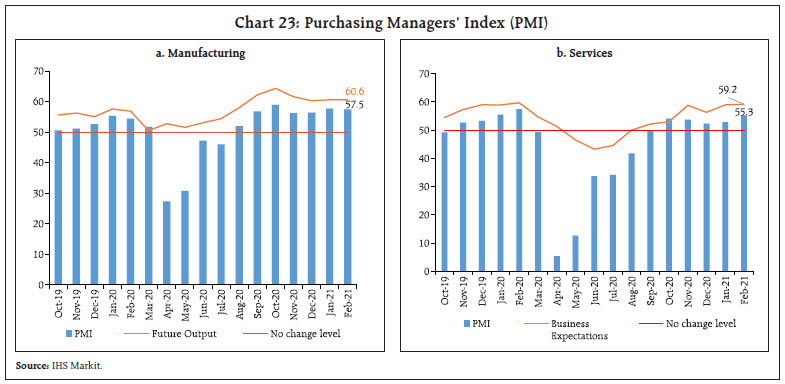
 High frequency food price data from the Ministry of Consumer Affairs, Food and Public Distribution (Department of Consumer Affairs) for March so far (March 1-12, 2021) points to further winter seasonal softening of prices in potatoes and tomatoes. Onion prices, after a pick-up in February, have softened in March. Cereals prices have also edged down. However, most pulses prices have remained steady or edged up further. The sharp upward price momentum for edible oils continued unabated in March (Chart 25). Following the decision of OPEC plus on March 4, 2021 to retain production at current levels till April and also due to a rise in geo-political tensions, crude oil prices edged up further in March so far (March 1-12, 2021). The Indian basket crude oil, which was at US$ 62 per barrel on March 3, 2021 jumped to US$ 68 per barrel on March 8, 2021. However, domestic pump prices, already at a historic high, were not revised since March 2, 2021. Domestic kerosene and LPG prices increased further in March tracking international prices (Table 3). 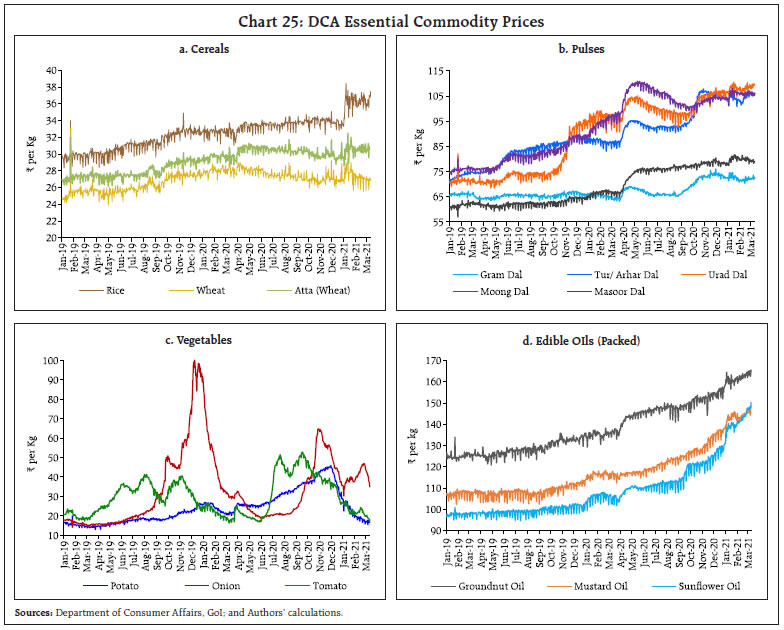 The food inflation trajectory would largely depend on the impact of favourable kharif and rabi seasons on cereal prices and the seasonal winter arrivals on vegetable prices on one hand, and the adverse impact of rising international prices on edible oil prices and the persisting demand-supply mismatches for protein-based food prices, on the other. For manufacturing and services, the escalation of input price pressures has come to a boil in recent months. In February, the PMI input price index hit an eight year high for services and for manufacturing it was at the highest level since mid-2018. As a result, core inflation pressures continue unabated, scaling a new high of 6 per cent in the post-lockdown period. With crude oil price increases showing no immediate signs of abating and post-lockdown taxes on petrol and diesel yet to be reversed, the oil marketing companies’ cap on price increases is preventing pump prices from brushing with the ₹100 per litre mark. In the face of such cost escalations, firms may choose to absorb some part of the input cost increases and face lower margins or may increasingly pass it on to consumers if they regain pricing power on robust demand recovery. | Table 3: Petroleum Product Prices (Average of four major metros) | | Item | Unit | Domestic Prices | Month-over-month
(per cent) | | Mar-20 | Feb-21 | Mar-21^ | Feb-21 | Mar-21 | | Petrol | ₹/litre | 72.9 | 91.3 | 93.3 | 4.2 | 2.2 | | Diesel | ₹/litre | 65.0 | 83.0 | 85.2 | 5.1 | 2.7 | | Kerosene | ₹/litre | 29.4 | 27.4 | 29.4 | 5.9 | 7.4 | | LPG | ₹/cylinder | 811.9 | 771.3* | 829.6 | 9.5 | 7.6 | ^: For the period March 1 -12, 2021. * Average price in February 2021.
Note: Average of prices charged by Indian Oil Corporation Limited (IOCL) in four major metros (Chennai, Delhi, Mumbai and Kolkata).
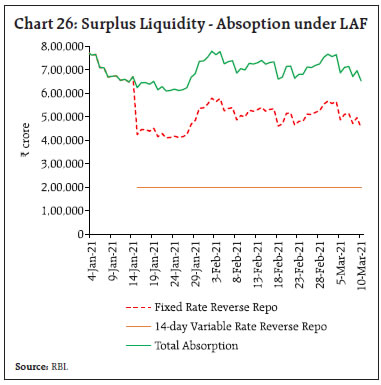
Sources: IOCL; Petroleum Planning and Analysis Cell (PPAC); and Authors’ calculations. | IV. Financial Conditions System liquidity remained plentiful with daily net liquidity absorption under the liquidity adjustment facility (LAF) averaging ₹6.40 lakh crore in February and March 2021 (upto March 12, 2021). The Reserve Bank continued to conduct fortnightly variable rate reverse repo auctions – its main liquidity management operation in surplus conditions – coinciding with the cash reserve ratio (CRR) maintenance cycle for an amount of ₹2 lakh crore (Table 4). All the auctions, including three auctions conducted in February-March, elicited a warm response from market participants, with bid-cover ratios of 1.3 or above. As system liquidity surged, total liquidity absorption under the fixed rate reverse repo continued to expand (Chart 26). | Table 4: Auctions of 14-day Variable Rate Reverse Repo (Main Operation) | | (Amount in ₹ crore) | | Auction date | Notified Amount | Offers Received | Accepted Amount | Bid-cover-ratio | | January 15, 2021 | 2,00,000 | 3,05,816 | 2,00,009 | 1.5 | | January 29, 2021 | 2,00,000 | 3,05,602 | 2,00,007 | 1.5 | | February 12, 2021 | 2,00,000 | 2,96,932 | 2,00,017 | 1.5 | | February 26, 2021 | 2,00,000 | 3,33,909 | 2,00,010 | 1.7 | | March 12, 2021 | 2,00,000 | 2,68,860 | 2,00,007 | 1.3 | | Source: RBI. |
 The Reserve Bank scaled up its open market operations (OMOs) and conducted one special OMO (operation twist) for an enhanced amount of ₹15,000 crore on March 4, 2021. In order to reinforce the compression of term premia as well as to inject liquidity to foster congenial financial conditions, asymmetrical special OMO involving purchase of securities worth ₹20,000 crore and sale of securities worth ₹15,000 crore was conducted on March 10, which elicited an ebullient response on the purchase leg as reflected in a bid-cover ratio of 4.0 and responsible bidding in line with evolving secondary market yield movements. On the sale side, however, only ₹10,895 crore could be auctioned. Excluding this one, the Reserve Bank has conducted twenty special OMOs (operation twists) starting from December 2019, with notified amounts for the purchase and sale legs being equal and, therefore, intended to be liquidity neutral. Under the weight of surplus liquidity, the overnight money market rates, i.e., the weighted average call rate (WACR), the tri-party repo rate and the market repo rate traded below the reverse repo rate. In February, the market repo rate plunged to a low of 0.01 per cent as a squeeze on account of bouts of short-selling caused a scramble to acquire specific securities by market participants to square obligations in the short sale market. In the tri-party repo market too, rates were pushed down by increased lending by mutual funds. This opened a wedge between the uncollateralised and collateralised rates, which, however, gradually closed as the collateralised rates in both the segments got re-aligned with the WACR by end-February. 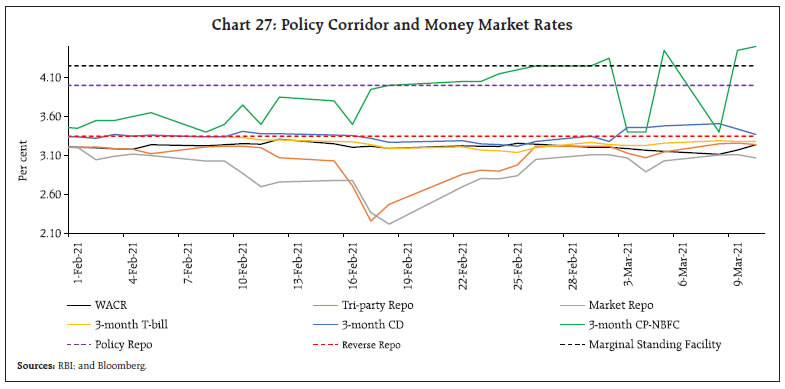 Among other key money market rates, the 3-month T-bill rate continued to trade below the reverse repo rate, though the rates on 3-month commercial paper (CP) issued by non-bank financial companies (NBFC) and 3-month certificates of deposit (CDs) traded above the reverse repo rate in March 2021 (Chart 27). Monetary and credit conditions eased further, mirroring the prevailing liquidity conditions. Reserve money (RM) adjusted for the first-round impact of changes in the CRR expanded by 17.4 per cent on a y-o-y basis as on March 5, 2021 (12.4 per cent a year ago) [Chart 28], propelled by currency in circulation (CiC) expanding by 19.8 per cent (11.4 per cent a year ago) on the components side, and by net foreign assets (NFA) on the sources side. Money supply (M3) grew by 12.8 per cent as on February 26, 2021 (9.3 per cent a year ago) with aggregate deposits increasing by 11.4 per cent. As a result, the currency to aggregate deposit ratio soared to 17.3 per cent implying precautionary hoarding of cash, the most liquid of the assets, by the public in response to pandemic-induced uncertainties. 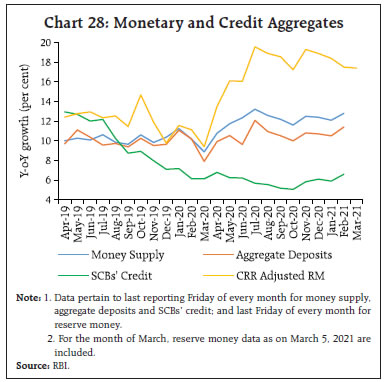
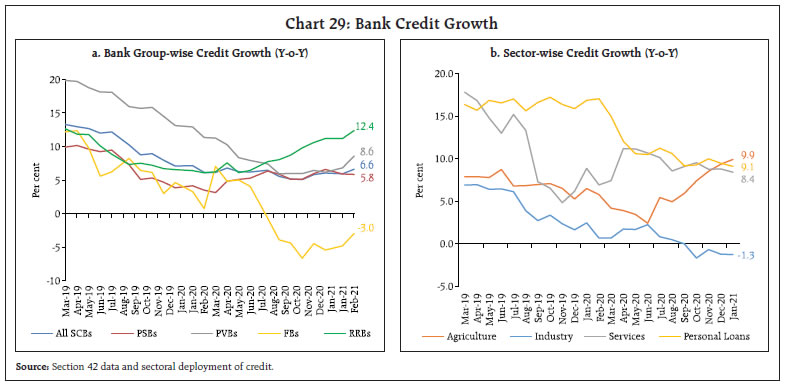 Credit growth of scheduled commercial banks (SCBs) appears to have bottomed out as it grew at 6.6 per cent year-on-year on February 26, 2021 compared with 6.1 per cent last year. Bank group-wise, growth in credit disbursed by public sector banks (PSBs) stabilised close to 6 per cent in 2021 (January-February), that of private sector banks (PVBs) and regional rural banks (RRBs) clocked robust pick-up to 8.6 per cent and 12.4 per cent, respectively, in February 2021, and contraction in credit growth of foreign banks (FBs) tapered sequentially (Chart 29a). The stabilisation in overall credit growth is also evident in sectoral disbursement of credit by SCBs (Chart 29b). Credit to agriculture, the brightest spot in sectoral credit offtake by the SCBs, which accounts for 13 per cent of the total credit disbursed in 2019-20, is rising steadily and grew at near double digits in January 2021. Credit growth to the services sector was at 8.4 per cent in January, propelled by strong credit disbursals to trade, tourism and transport sectors. Credit to other services10 grew at 17.5 per cent in January. Retail lending by banks for personal consumption grew at 9.1 per cent in January 2021. Within the personal loan segment, loans for consumer durables posted a robust growth of 14.6 per cent in January and other personal loans11 grew at 12.1 per cent. There was a steep acceleration in personal loans against gold jewellery to 132 per cent in January 2021 (20.4 per cent in January 2020). While overall lending by banks to industry remained in contraction, credit growth to medium industry was at 19.1 per cent in January 2021 (2.8 per cent a year ago) and to micro and small industries, inched close to 1 per cent (0.5 per cent in January 2020). Bank credit to large industries dragged down the overall credit to industry by banks as these firms, especially the high rated ones, took advantage of the prevailing low interest rate regime, and borrowed from the market to pay off some of their high cost bank credit. The transmission to lending and deposit rates of SCBs improved further in the current easing phase. In response to the cumulative reduction of the repo rate by 250 bps (i.e., since February 2019), the weighted average lending rate on fresh rupee loans sanctioned by SCBs declined by 183 bps, of which 112 bps cut was effected since March 2020. The median term deposit rate (MTDR), which reflects the prevailing card rates, has registered a sizeable decline of 211 bps (up to February 2021). The adjustment in deposit rates has accelerated in the aftermath of COVID-19 on account of persistent surplus liquidity amidst weak credit demand. During March 2020 through February 2021, the MTDR moderated by 144 bps. During the same period, the 1-year median marginal cost of funds-based lending rate (MCLR) softened cumulatively by 94 bps, indicating reduction in overall cost of funds (Table 5). Buoyed by various liquidity enhancing measures initiated by the Reserve Bank in the wake of the pandemic, the yield on government securities (G-sec) traded range bound. At the long end of the curve, yields, however, hardened with the 5-year and the 10-year Bloomberg generic G-sec yields firming up by 64 bps and 33 bps, respectively, during February-March 2021 (up to March 12) [Chart 30]. Fears over the size of the market borrowings for the ensuing year amplified by global spillovers as discussed earlier triggered sell-offs. The rise in the 10-year Indian G-sec was, however, moderate relative to the hardening of the US 10-year yield by 54 bps during this period. 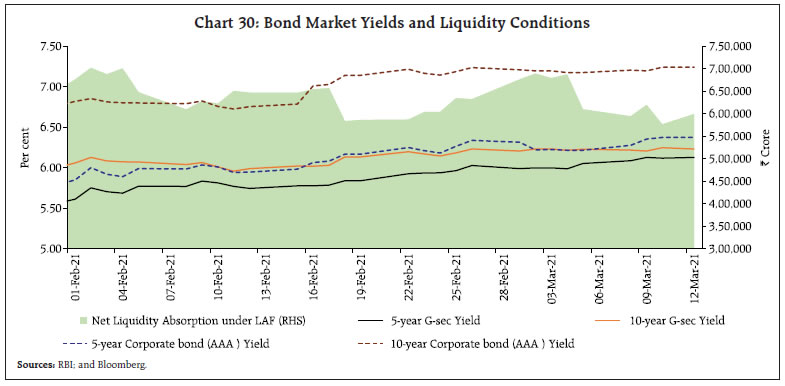
| Table 5: Transmission from the Repo Rate to Banks’ Deposit and Lending Rates | | (Basis points) | | Period | Repo Rate | Term Deposit Rates | Lending Rates | | Median Term Deposit Rate | WADTDR | 1 - Yr.
Median MCLR | WALR -
Outstanding Rupee Loans | WALR
- Fresh Rupee Loans | | Feb 2019 - Sep 2019 | -110 | -9 | -7 | -30 | 2 | -40 | | Oct 2019 - Feb 2021* | -140 | -175 | -138 | -120 | -95 | -143 | | Mar 2020 - Feb 2021* | -115 | -144 | -99 | -94 | -77 | -112 | | Feb 2019 - Feb 2021* | -250 | -211 | -145 | -150 | -93 | -183 | *: Latest data on WALRs and WADTDR pertain to January 2021.
WALR: Weighted Average Lending Rate. WADTDR: Weighted Average Domestic Term Deposit Rate;
MCLR: Marginal Cost of Funds-based Lending Rate.
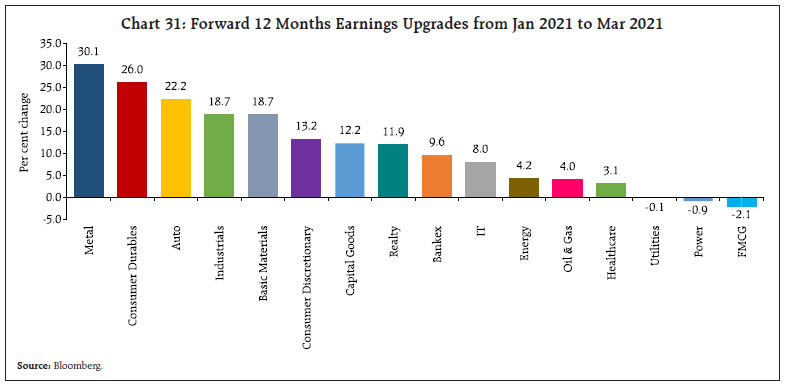
Source: RBI. | Tracking G-sec yields, corporate bond yields firmed up across the rating spectrum and issuer categories. Spreads on corporate bonds over G-secs of corresponding maturity issued by (i) corporates, and (ii) NBFCs, however, continued to narrow across the rating spectrum. The spreads on bonds issued by PSUs, Banks and FIs widened (Table 6). Q3:2020-21 earnings results of corporates have beaten market expectations with a stellar rise in profitability, riding on the back of a significant reduction in input costs. This led to an optimistic outlook on earnings per share, particularly in sectors such as metals, consumer durables, auto, industrials and basic materials (Chart 31). Upside was also provided by copper prices hitting a multi-year high on the London Metal Exchange, with prices of other major commodities, such as aluminium and steel, also exhibiting a significant rise in both domestic and global markets. Furthermore, consumer durables sector companies, particularly those manufacturing air conditioners, are likely to benefit from COVID-19 vaccine related commercial refrigeration requirements. The GoI’s Aatma Nirbhar Bharat programme and the production-linked incentive (PLI) scheme are also expected to boost output across various manufacturing sectors. The revival in corporate earnings has largely stemmed from higher margins due to lower operating and finance costs rather than higher revenues and sales volume. Cost reductions may not be sustainable for long with the rise in input prices. The recent rally in crude oil prices may also affect corporate margins in the next few quarters, though some of those risks might have already been factored in earnings estimates. | Table 6: 3-year Corporate Bond Yield and Spread | | Issuer | Rating | Yield | Spread | | Jan-21 | Feb-21 | Variation | Jan-21 | Feb-21 | Variation | | (Per cent) | (bps) | (bps) | | PSU, Banks and FIs | AAA | 4.96 | 5.57 | 61 | 26 | 52 | 26 | | AA | 5.62 | 6.16 | 54 | 92 | 111 | 19 | | BBB- | 8.75 | 9.32 | 57 | 405 | 427 | 22 | | Corporates | AAA | 4.85 | 5.20 | 35 | 16 | 16 | 0 | | AA | 5.74 | 5.99 | 25 | 105 | 96 | -9 | | BBB- | 9.69 | 9.89 | 20 | 500 | 486 | -14 | | NBFCs | AAA | 4.96 | 5.30 | 34 | 27 | 27 | 0 | | AA | 6.34 | 6.58 | 24 | 164 | 155 | -9 | | BBB- | 10.62 | 10.86 | 24 | 592 | 583 | -9 | Note: Yields and spreads are average of the month.
Source: FIMMDA. |
 Reversing the weak momentum prevailing towards the end of January 2021, the benchmark Sensex closed above the 50,000 mark for the first time in history on February 3, 2021 and scaled to a fresh all-time high of 52,154 on February 15, 2021 buoyed by budgetary proposals, double-digit outlook on GDP growth by the Reserve Bank and positive cues from global markets (Chart 32). Towards the end of the month, however, markets declined following a surge in US treasury yields, a rise in crude oil prices, and a fresh spike in COVID-19 cases in some Indian states. Markets commenced on an optimistic note in March 2021, buoyed by release of positive Q3:2020-21 GDP data and encouraging reports for February 2021 on auto sales, GST collections, and PMIs. Subsequently, Indian equity markets exhibited volatility, tracking the sell-off in global markets. Overall, the BSE Sensex increased by 95.5 per cent to close at 50,792 on March 12, 2021 far above the low of 25,981 on March 23, 2020. Trading was halted at the National Stock Exchange (NSE) for nearly four hours on February 24, 2021 reportedly due to telecom links failure leading to unavailability of the online risk management system of the NSE Clearing Limited (NCL), a wholly owned subsidiary of the NSE, which is responsible for clearing and settlement of all trades executed on the NSE. The outage occurred on the penultimate day of expiry of the February futures contracts when the transaction volume load was higher than usual. The NSE is one of the largest derivatives exchanges in the world and accounts for the leading market share (by total turnover) in India - 93.2 per cent in equity cash trading and 99.9 per cent in equity derivatives trading during 2019-20. On February 24, 2021, the turnover in the equity cash segment across the BSE and the NSE increased by 7.6 per cent over the preceding trading day, which was mostly supported by a block deal. However, aggregate notional turnover in stock options and futures and index options and futures declined by 45.1 and 20.1 per cent, respectively, over the preceding trading day. Besides the trading halt which led to disruption in market activity, the decline in turnover reflected absence of arbitrage opportunities following closure of one exchange and/or trading arrangements of some market participants only with NSE12. NSE announced extension of its trading session from 15:30 PM to 17:00 PM to enable squaring off of intra-day positions. The BSE, which functioned normally throughout, also stayed open late to facilitate this process. 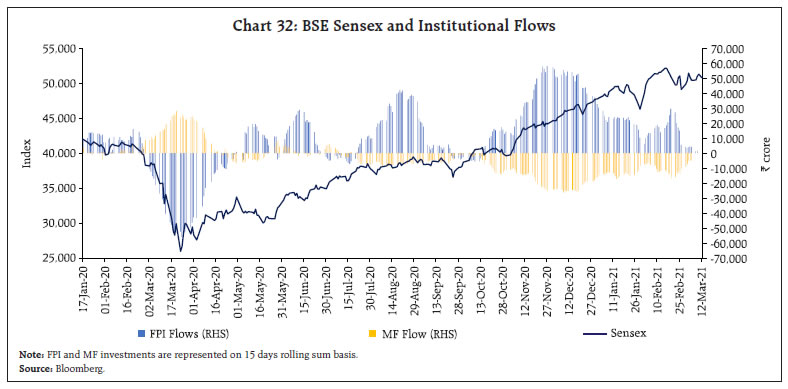 The major issue in this incident was the ineffectiveness of interoperability because of shutting down of the NCL. While the NSE’s trades are cleared by NCL, trades on the BSE are cleared through Indian Clearing Corporation Limited. In 2018, the Securities and Exchange Board of India (SEBI) had announced interoperability between these two clearing corporations to help brokers consolidate their clearing and settlement functions at a single clearing house, irrespective of the stock exchange on which the trade is executed. Another important failure was the inability to switch operations to the disaster recovery site. Robust risk management system encompassing disaster management and recovery are essential components for the smooth functioning of a stock exchange (In 2019, the SEBI had put in place a framework for business continuity plan (BCP) and maintaining disaster recovery sites for market infrastructure institutions, including exchanges and clearing corporations in case of such disruption). Brokers believe that timely communication and clarification could have averted the panic sell-off by online traders on the BSE and prevented huge losses to investors. Post the incident, the SEBI has advised the NSE to carry out a detailed root cause analysis of the trading halt and the reasons for trading not migrating to the disaster recovery site. Furthermore, the SEBI’s technical advisory committee has reportedly been mandated to probe the trading halt at the NSE and fix accountability. Allowing the benchmarks Nifty and Sensex to trade on all the stock exchanges, extension of interoperability to include usage of trading infrastructure of another exchange and allowing entry of more exchanges to increase competition may need to be considered, besides focusing on strengthening of risk management frameworks at the exchanges. Net foreign direct investment (FDI) flows moderated in January 2021 due to lower equity inflows. Nevertheless, net FDI increased to US$ 44.0 billion cumulatively in 2020-21 (April-January) from US$ 36.3 billion a year ago, reflecting a surge in net FDI through August-December 2020 (Chart 33). 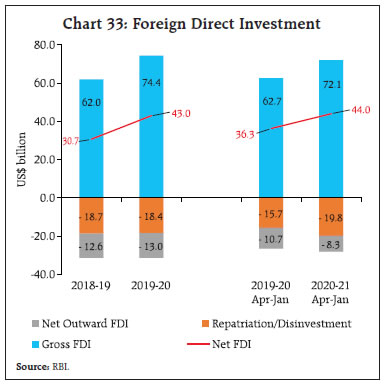
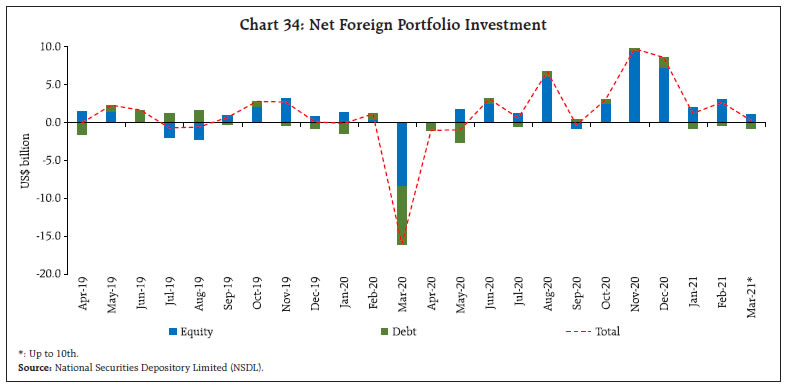 Foreign portfolio investors (FPIs) turned net buyers in the domestic capital market in the first week of March 2021, following a sell-off in the last week of February 2021. FPIs made net purchases in the equity segment, while remaining net sellers in the debt market during the period. Cumulatively, FPIs’ net investment in equities was to the tune of US$ 36.0 billion in 2020-21 so far (up to March 10), the highest since 2012-13 (Chart 34). The quality of FPI inflows also improved during the period as category-I FPIs, comprising central banks, sovereign wealth funds, pension funds, regulated entities and multilateral organisations, increased their stake to 95 per cent of total equity assets at end-February 2021 as compared with 87 per cent at end-December 2019. Foreign exchange reserves, after reaching its all-time high of US$ 590.2 billion on January 29, 2021, stood at US$ 580.3 billion on March 5, 2021, equivalent to 18.2 months of imports (Chart 35). In the foreign exchange market, the Indian rupee (INR) weakened towards the end of February 2021, reflecting net FPI outflows and the rise in international crude oil prices. However, it rebounded thereafter, with FPIs resuming their investments in the equity market. As on March 12, 2021, the INR appreciated by 3.7 per cent against the US dollar over its level at end-March 2020. In terms of the 40-currency real effective exchange rate (REER) index, the INR appreciated by 2.4 per cent in February 2021 over its level in March 2020 (Chart 36).
Payment System In February 2021, digital India had the pleasant experience of spring demand as wholesale and retail transactions expanded strongly. The Real Time Gross Settlement (RTGS)-led wholesale transactions volume edged up 18.4 per cent (y-o-y), 4 percentage points over the previous month (Table 7). Meanwhile, the value of RTGS transactions clocked a growth of 0.7 per cent after a transient blip in the month gone by. In the retail segment, the volume and value of National Electronic Funds Transfer (NEFT) transactions maintained a healthy momentum at 13.6 per cent and 15.1 per cent, respectively. The Unified Payment Interface (UPI) remained the mainstay of the digital ecosystem, with its volume remaining resiliently above the 2 billion mark for the fifth successive month. To achieve 100 per cent cashless tolling, the move to make FASTags mandatory from February 16, 2021 augured well for National Electronic Toll Collections (NETC), which hit 44.3 per cent and 38.8 per cent growth in volume and value terms, respectively, in the month. Consequently, as on February 25, 2021, the daily toll collection through FASTags witnessed the sharpest uptick to date at ₹104 crore13. Transactions volume through the Bharat Bill Payment System (BBPS) surged by 89.1 per cent and value hit a triple digit growth of 115.7 per cent. Overall, the daily average transactions across all major payment systems, both wholesale and retail, in February 2021 have gained traction over their values in the previous month. 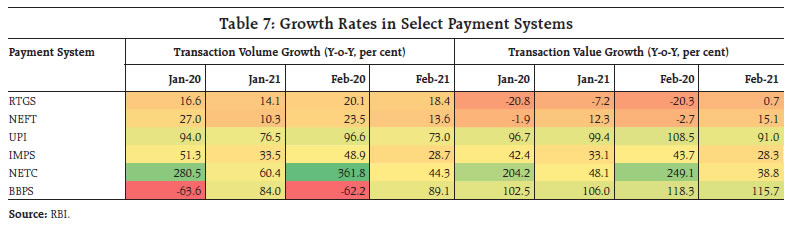 Getting on the digital bandwagon, the first ever paperless Union Budget 2021 allocated ₹1500 crore to boost the adoption of digital modes of payment. Furthermore, a FinTech Hub has been proposed to be set up in the Gujarat International Finance Tec-City (GIFT City) to bolster the FinTech revolution in the country. Market research shows that amidst the pandemic, India saw a 60 per cent increase in FinTech investments and surpassed China by clocking 33 FinTech fundraising deals worth US$ 647.5 million14. In the month of February 2021 alone, fundraising by the Indian FinTech sector saw an increase of 46 per cent to the tune of US$ 200 million, as against approximately US$ 137 million a year ago, on account of pandemic-fuelled proliferation of digital payments. Taking advantage of the push towards contactless deliveries, many FinTech players have customised offerings of their financial products and services for both consumers and merchants, thereby targeting local kirana (grocery) shops, burgeoning e-commerce platforms and online retail channels of brick-and-mortar stores. Recent collaborations between card issuing banks and FinTech companies, combined with crackdown on unauthorised overseas-based mobile apps, is expected to provide headroom to home-grown FinTech businesses to flourish. As opportunities for more technological innovation in the payment system increase, so do the challenges posed by cyber frauds. According to a study by the Bank for International Settlements (BIS)15, the pandemic has triggered a spike in cyber attacks on financial services firms globally due to a shift to remote work and cloud software. The Reserve Bank has issued a Master Direction on Digital Payment Security Controls that specifies requirements for robust governance and monitoring of certain minimum standards on common security controls for channels like internet and mobile banking, card payments. Moreover, the Reserve Bank will issue a code of conduct prescribing guidelines on payments outsourcing. The ‘RBI Says’ campaign has recently gone the ‘rap’ way to ramp up outreach and enhance customer awareness regarding safety in the digital payment space. In order to bring operational efficiency in paper-based clearing, it is proposed to bring all the branches that are yet outside the ambit of Cheque Truncation System (CTS) under the clearing mechanism by September 2021. The Reserve Bank has extended the timeline for submitting applications for setting up a pan-India New Umbrella Entity (NUE) for retail payments till March 31, 2021 to ensure an enabling and competitive environment for a varied digital payment ecosystem to thrive. Going forward, the vaccination drive and the flattening of the infections curve will help improve consumer sentiment, boost business spirits and make the digital payment industry the key driver of the post-COVID-19 revival agenda as it ushers in a transformation in how we work, learn, shop, pay and live. V. Conclusion India is poised on the cusp of two tipping points. First, there are ominous signs that infections are rising. A second wave? Time will tell. On the other hand, vaccinations have moved beyond health workers to senior citizens, but at 3.3 crore as on March 16, the entire process needs to be speeded up. Turning to the world, India, the pharmacy of the world16 with 60 per cent of global manufacturing capacity, launched itself against the pandemic. Commencing on January 20, more than 70 countries have received vaccines made in India. Today, India is alone no longer in the global vaccination drive. QUAD partners – Australia, India, Japan and the US – forged a ‘landmark partnership’17 to expand safe and effective COVID-19 vaccine manufacturing in 2021 to vaccinate the Indo-Pacific, each drawing on individual innate strengths. India will expand manufacturing of vaccines at its facilities, with concessional loans from Japan. The US will finance the increase in production capacity. Australia will contribute to provision of vaccines and last mile delivery support with a focus on Southeast Asia. Together, we will inoculate the world and share a brighter future in a post-pandemic world. Second, inflation has witnessed upside pressures. In fact, excluding vegetables, headline CPI inflation has moved in a tight range of 5.8 to 6.4 per cent from June, testing the upper tolerance band of the inflation target. Global oil markets are experiencing hardening of prices and production restraints. The ratcheting up of input prices to multi-year highs pose a dilemma – if they are passed on to consumers as pricing power returns to firms as aggregate demand picks up, there will be even higher inflation; if they are held back, profitability will be eroded as will gross valued added in the economy. India is in a strange place – rising prices amidst plenty. Surely, there is a way around it, as this article in its previous editions has pointed out. There is a restless urgency in the air in India to resume high growth, and incoming data point to even contact-intensive services such as personal care, recreation and hospitality gathering traction and pace even as agriculture crosses production highs in various crops and in horticulture, and manufacturing finally shrugs off the vice-like grip of contraction. All around, optimism is taking hold, among households and businesses, investors and markets. It is also likely that India will decouple from other emerging economies for which rising financing costs and rising pile-ups of debt hamstring the recovery. In the case of India, debt servicing did preempt more than 25 per cent of budgetary revenues in 2020-21, but there are saving graces: the maturity of public debt is 11 years18, reducing refinancing risk. Foreign holding of this debt is less than 2 per cent, which means low vulnerability to sudden outflows of capital because it has demonstrated capability to sell its debt in its own currency. Also, as stated earlier, India has growth credibility – the average rate of interest on public debt is less than the growth rate of the economy. Even so, another outbreak, more lockdowns and restraints, will get unbearable in spite of learning from the initial experience of living with the virus. In 2021, inflation will likely ease after June, but it will be higher than in prints because of statistical base effects of high inflation a year ago. Globally, policies will seek to stimulate, but markets will stare at tea leaves and ghosts of tightening of the past – neither growth nor inflation hard data support market movements so far. Central banks will go beyond their conciliatory open mouth operations if their stated stances are challenged. Central banks will perhaps step out of the ambit of their traditional mandates and go where they have not been before – environmental sustainability (UK); climate change (Euro area); house prices (New Zealand); yield control (Japan; Australia); asset purchases (everywhere). We live in interesting times!
|