India introduced asset reconstruction companies (ARCs) as private sector institutions as part of its financial sector reforms unlike many other countries that experimented with a public sector model of such institutions following banking crises. The evolution of Indian ARCs has been marked by phases of growth and lull, shaped by emerging macro-financial conditions and regulatory changes. The ARC sector remains reliant on domestic capital, particularly from banks. The cost of acquisition to book value ratio, although posting a slow rise, remains low and is marked by a wide variation across ARCs and sectors. There is a considerable concentration of security receipts of older vintage in ARCs’ books. 1. Introduction The deterioration in asset quality has been a subject of continued concern for the Indian banking sector since the last decade. The gross non-performing asset (NPA) ratio of banks, which had remained largely unchanged in the period immediately following the global financial crisis, started inching up from 2011 onwards, and increased sharply after 2015 (RBI, 2018). In 2015, the Reserve Bank undertook the Asset Quality Review (AQR) to encourage a proactive asset quality recognition by banks. While proactive asset recognition is important for a correct assessment of the health of the banking system, it needs to be followed by an effective asset resolution and recovery by banks. The absence of an effective resolution and recovery (often referred to as asset reconstruction) mechanism can discourage recognition of NPAs by banks in the first place. The lack of recourse to timely recovery can also deteriorate the economic value of assets adding to the losses incurred by banks over time. This article looks at asset reconstruction companies (ARCs), an important player in the asset resolution mechanism in India. Although introduced in 2002, the evolution of ARCs has been neither smooth nor steady. There have been phases of growth and lull for these institutions, explained by changes partly in macro-financial conditions and partly in regulatory environment surrounding these institutions. This article traces the evolution of these institutions, and analyses key features of their structure and business operations, and thereby their role in NPA resolution. Some of the relevant policy changes relating to these institutions have also been discussed. The article compares the Indian ARC model with those from other countries and highlights the international best practices emerging therefrom. The rest of the article is divided into six sections. Section 2 discusses the broad contours of the NPA resolution mechanism in India with a focus on ARCs. Section 3 compares the Indian ARC model with those in other countries. Section 4 provides key features of the ARC industry in India, while Section 5 analyses the key features of the business operations of these companies. Section 6 provides the concluding observations, and highlights certain issues relating to the future development of ARCs. 2. Evolution of the Asset Resolution Mechanism with Special Reference to ARCs An effective asset resolution mechanism is an integral part of a well-functioning financial system. It was with this understanding that the Recovery of Debts Due to Banks and Financial Institutions (RDDBFI) Act was passed in 1993 as part of financial sector reforms, following the recommendations of the Committee on the Financial System (CFS), popularly known as the Narasimham Committee I. With the enactment of the RDDBFI, Debt Recovery Tribunals (DRTs) were established as special tribunals to deal with loan recovery of cases involving a pecuniary limit of ₹10 lakh (increased to ₹20 lakh in 2018). The DRTs were also authorised to form Lok Adalat to decide on cases involving an amount of up to ₹20 lakh.1 The DRTs had a promising start, with the amount recovered through these tribunals as per cent of amount involved being in double digits in the initial years and reaching as high as 81 per cent in 2008-09 (Table 1). However, the rate of recovery reduced to single digits in the subsequent years; in 2019-20, the percentage of amount recovered through DRTs was about 4 per cent of the amount involved. These specialised tribunals were created for a speedy settlement to take the burden off civil courts of debt-related matters. In reality however, there were considerable delays in settlement by these tribunals, owing partly to their over-stretched capacity and inadequate infrastructure (Bhagwati et al., 2017). The passage of the Securitisation and Reconstruction of Financial Assets and Enforcement of Security Interest Act (SARFAESI Act) in 2002 empowered banks and financial institutions to recover secured loans by enforcing the security interest, and auctioning borrowers’ property without any court intervention. As part of the SARFAESI Act, ARCs were set up as another institutional alternative for NPA resolution in India. The ARCs, regulated and supervised by the Reserve Bank, were institutions created for the sale of financial assets by banks and financial institutions. | Table 1: Distribution of NPAs Recovered by Banks, Various Channels | | Year | Lok Adalat | DRTs | ARCs | IBC | Total | | Percent- age of total amt invol ved | Percent- age of total amt reco vered | Amt reco vered as per cent of amt involved | Percent- age of total amt invo lved | Percent- age of total amt reco vered | Amt reco vered as per cent of amt invol ved | Percent- age of total amt invol ved | Percent- age of total amt reco vered | Amt reco vered as per cent of amt invol ved | Percent- age of total amt invol ved | Percent- age of total amt reco vered | Amt recovered as per cent of amt invol ved | Total amount invol ved (₹ crore) | Total amount reco vered (₹ crore) | | 1 | 2 | 3 | 4 | 5 | 6 | 7 | 8 | 9 | 10 | 11 | 12 | 13 | 14 | 15 | | 2003-04 | 5.1 | 3.3 | 13.5 | 53.3 | 79.1 | 30.9 | 41.5 | 17.6 | 8.9 | - | - | - | 47535 | 9921 | | 2004-05 | 2.8 | 2.2 | 14.1 | 50.5 | 51.8 | 18.8 | 46.7 | 46.1 | 18.1 | - | - | - | 28342 | 5192 | | 2005-06 | 6.5 | 2.7 | 20.3 | 35.9 | 56.4 | 76.9 | 57.6 | 41.0 | 34.8 | - | - | - | 17055 | 8356 | | 2006-07 | 4.0 | 1.4 | 14.0 | 48.3 | 47.3 | 37.8 | 47.7 | 51.2 | 41.4 | - | - | - | 18972 | 7318 | | 2007-08 | 14.1 | 2.3 | 8.2 | 38.2 | 39.6 | 51.9 | 47.7 | 58.1 | 61.0 | - | - | - | 15224 | 7625 | | 2008-09 | 19.9 | 1.3 | 2.4 | 20.4 | 45.1 | 81.1 | 59.7 | 53.6 | 33.0 | - | - | - | 20220 | 7426 | | 2009-10 | 23.1 | 1.5 | 1.5 | 31.3 | 41.7 | 32.0 | 45.6 | 56.8 | 30.0 | - | - | - | 31281 | 7514 | | 2010-11 | 10.5 | 1.0 | 2.9 | 28.2 | 25.1 | 27.9 | 61.3 | 73.9 | 37.8 | - | - | - | 49950 | 15642 | | 2011-12 | 2.8 | 1.4 | 11.8 | 39.4 | 28.5 | 17.0 | 57.8 | 70.1 | 28.6 | - | - | - | 61100 | 14400 | | 2012-13 | 6.2 | 1.7 | 6.1 | 29.3 | 18.9 | 14.2 | 64.4 | 79.4 | 27.2 | - | - | - | 105700 | 23300 | | 2013-14 | 13.3 | 4.4 | 6.0 | 31.8 | 16.6 | 9.6 | 54.8 | 79.1 | 26.5 | - | - | - | 173800 | 32000 | | 2014-15 | 12.5 | 3.2 | 3.2 | 24.3 | 13.6 | 7.0 | 63.2 | 83.1 | 16.3 | - | - | - | 248200 | 30800 | | 2015-16 | 32.5 | 14.0 | 4.4 | 31.3 | 28.1 | 9.2 | 36.2 | 57.9 | 16.5 | - | - | - | 221400 | 22800 | | 2016-17 | 13.0 | 6.0 | 6.4 | 36.2 | 26.8 | 10.2 | 50.8 | 67.3 | 18.3 | - | - | - | 278300 | 38500 | | 2017-18 | 16.9 | 4.5 | 4.0 | 49.2 | 17.9 | 5.4 | 30.3 | 65.4 | 32.2 | 3.7 | 12.2 | 49.6 | 270631 | 40352 | | 2018-19 | 7.4 | 2.3 | 5.1 | 37.0 | 8.9 | 3.9 | 35.6 | 32.8 | 15.0 | 20.4 | 56.2 | 45.7 | 725996 | 118647 | | 2019-20 | 9.1 | 2.4 | 6.2 | 33.1 | 5.8 | 4.1 | 26.5 | 30.5 | 26.7 | 31.3 | 61.3 | 45.5 | 742431 | 172565 | * Amount recovered refers to amount recovered during a given year, which could be with reference to cases referred during the given year as well as earlier years.
Source: Report on Trend and Progress of Banking in India. | The creation of ARCs was an important financial sector reform following the recommendations of the Committee on Banking Sector Reforms (Narasimham Committee II), which was expected to speed up the process of resolution and recovery of secured assets. Finally, in 2016, came the Insolvency and Bankruptcy Code (IBC) that took the NPA resolution mechanism many steps further, as it was expected to streamline the insolvency resolution process for corporates and individuals, and protect the interests of not just secured but also unsecured creditors.2 The IBC has by far been the most significant reform concerning NPA resolution. In 2019-20, the amount recovered as per cent of the amount involved under IBC was 45.5 per cent, followed by 26.7 per cent for ARCs. While the amount recovered through ARCs as per cent of amount involved was significantly higher in the initial years of their inception, in the recent years, it has dipped below 30 per cent except for a spurt in 2017-18. The ARCs, however, continue to be an important channel of loan recovery for banks and have a role to play in the field of asset management even in the post- IBC world.3 Their share in total amount involved across all four channels of recovery has ranged between 25 per cent and 35 per cent since the introduction of the IBC. Furthermore, they account for about 30 per cent of the total amount recovered through all channels. 3. A Comparison of the Indian ARC Model with the Models in Other Countries The term ARC has been in usage in the Indian context; the common global parallel of it is an asset management company (AMC). AMCs can take two forms, those with a focus on bank resolution and those dealing with NPA resolution (Cerruti, 2018). There have been several experiments of AMCs dealing with NPA resolution in other countries. Some of the successful ones include, Securum of Sweden which was set up in 1992 and wound up in 1997, and which succeeded in recovering close to 86 per cent of the amount involved (Bergstrom et al., 2003). Similarly, Danaharta of Malaysia, set up following the Asian financial crisis and operational between 1998 and 2005, managed to recover about 58 per cent of the amount involved (Dreyer, 2020). Among the AMC experiments reviewed by the World Bank, the performance of the Non-Performing Assets Trust (NPART) of Ghana that was in existence from 1989 to 1997 was regarded as satisfactory (World Bank, 1997). While each of the above was a government-owned AMC, there have been experiments involving public-private partnership also. To illustrate, following the global financial crisis, Spain created Sareb in 2012 with a lifespan of 15 years, involving private (including Spanish banks and financial institutions) and public equity in a ratio of 55:45 (Cerruti, 2018 and EY, 2020). Similarly, Ireland set up National Asset Management Agency (NAMA) in 2009 following the global financial crisis with private investors and state treasury contributing 51 per cent and 49 per cent to its equity, respectively (ibid.). AMCs in certain countries were also financed using government-backed bonds. For instance, AMCs in South Korea and Thailand, set up after the Asian financial crisis, relied predominantly on government-backed AMC bonds to reduce stress on budgetary resources (Fung et al., 2004). There are cases, although a few, of entirely private sector AMCs, similar to that of India. For instance, Bankaktiengesellschaft (BAG) is a federal association of German cooperative banks that specialises in restructuring the problem loans of these banks. The common features that emerge from the foregoing discussion on AMC experiments are the following: a. AMCs in most countries were set up following a domestic and/or global banking crisis or crisis-like situation that led to a surge in banks’ non-performing loans; b. Most AMCs were in existence for a pre-defined period; c. Most AMCs were set up with either direct equity participation or support from the government. Evidently, the Indian ARC model differs from the models in other countries in some fundamental ways. Firstly, ARCs in India were set up at a time when the NPA ratios of banks were significantly high; the gross NPA ratio was rising between 1998 and 2002 and was in the range of 10-14 per cent. While the increasing trend in NPAs could be deemed as a proximate cause for strengthening the asset resolution mechanism, the move to set up ARCs was ultimately linked to the broad process of financial sector reforms, and could be considered as being more proactive than reactive in nature. As already noted, the passage of the SARFAESI Act was a fallout of the recommendations of the Narasimham Committee II.4 Secondly, as they were not strictly tasked with addressing any specific crisis, ARCs in India did not come into being for a pre-defined period. Thirdly, Indian ARCs have been private sector entities registered with the Reserve Bank. Public sector AMCs in other countries have often enjoyed easy access to government funding or government-backed funding (Cerruti and Neyens, 2016). By contrast, capital constraints have often been highlighted as an area of concern for ARCs in India (Bhagwati et al., 2017). Very recently, the Government of India has announced an asset reconstruction and asset management company backed by government guarantee to address the problem of NPAs with public sector banks.5 In setting up such a company, the international best practices on AMCs can be a useful guide. As per the World Bank and the Financial Stability Institute, the AMC experiments, including the ones discussed earlier, that succeeded in fulfilling their original mandate were the ones that had: (i) a narrow mandate (such as resolving NPAs) with clearly defined goals; (ii) a sunset clause defining their lifespan; (iii) supportive legal infrastructure involving bankruptcy and private property laws; (iv) a backing of a strong political will to recognise problem loans; (v) a commercial focus of the AMC including governance, transparency, and disclosure requirements (Cerruti and Neyens, 2016; Fung et al., 2004). 4. Major Features of the ARC Industry in India 4.1 Growth of the Industry The growth of the ARC industry has not been consistent over time and not always been synchronous with the trends in NPAs of banks and non-banking financial companies (NBFCs). The ARC industry began with the establishment of the Asset Reconstruction Company India Limited (ARCIL) in 2003. After remaining subdued in the initial years of their inception, a jump was seen in the number of ARCs in 2008, and then in 2016 (Chart 1). Notwithstanding the increase in the number of ARCs, the growth in their assets under management (AUM) has been largely trendless except for a major spurt in 2013-14.6 When compared with the volume of NPAs of banks and NBFCs, the AUM of ARCs has been on a declining trend except during the period of high growth in the AUM around 2013-14. 4.2 Concentration Although the number of ARCs has increased over time, their business has remained highly concentrated. Of the total AUM, about 62 per cent and 76 per cent was held by the top-three and top-five ARCs in March 2020, respectively. Furthermore, in terms of the capital base of the industry, 62 per cent was held by top-three ARCs; the corresponding share was 67 per cent for the top-five ARCs (Chart 2). 4.3 Shareholding Pattern Being private sector entities, the key shareholders of ARCs are banks and other financial institutions (Chart 3). In order to boost their capital base, ARCs were allowed to accept 100 per cent of foreign direct investment (FDI) through the automatic route in 2016.7 Notwithstanding the liberalisation relating to FDI, foreign entities account for a small portion of the total capital of these companies. 5. Salient Features of the Business Operations of ARCs The business model of ARCs consists of three stages, which are discussed below: Stage 1: The ARCs acquire NPAs from banks or financial institutions either through bilateral deals or auctions. After acquisition of the asset, they formulate schemes for inviting subscription to security receipts (SRs) by Qualified Institutional Buyers (QIBs) through one or more trusts set up exclusively for the purpose.8 The NPAs acquired are held in asset-specific or portfolio-specific schemes; the former is adopted when the size of the aggregate debt acquired from a bank or financial institution is large, while the latter type of scheme is invoked when the size of acquired debt is small, prompting the ARCs to create a portfolio of the debt from various banks or financial institutions. Debt can be acquired either through cash alone or a mix of cash and SRs. To ensure that ARCs have more skin in the game of acquisition, they are required to invest a minimum of 15 per cent of the SRs under each scheme on an ongoing basis till the redemption of all SRs.9 Stage 2: After asset acquisition, ARCs initiate the process of planning for resolution; the period for planning extends up to six months from the date of acquisition of assets from the originator. The resolution can take different forms, including change and takeover of the management of the business of the borrower, sale or lease of a part or whole of the business of the borrower, rescheduling of payment of debts payable by the borrower, enforcement of security interest, etc. Stage 3: Following the resolution, ARCs start recovery of debt and work on the redemption of SRs. ARCs are allowed a period of five years to recover the dues. However, the period can be extended upto eight years subject to the approval of their Boards. 5.1 Features relating to the General Operations of ARCs 5.1.1 Sources of Funds Borrowings constitute a major source of funds for ARCs, closely comparable with the net owned funds of these companies (Chart 4). Evidently, any constraints in raising capital may directly reflect in an increased reliance on borrowings by these companies. Furthermore, the sources of funds of ARCs have been largely bank-centric in nature. As already noted, the capital base of ARCs is made up largely by domestic sources, particularly banks and financial institutions, with foreign sources remaining weak. A break-up of the borrowings by ARCs too reveals their dependence on banks. In recent years, there has been a decline in the share of bank borrowings, with bonds and debentures emerging as a major source of borrowings for these companies (Chart 5).
5.1.2 Profitability The major source of earnings for ARCs are management/trusteeship fees, upside income arising out of the difference between recovery and acquisition cost of debt, and additional performance incentives given by banks for an early recovery. As per the extant guidelines, management fees are linked to the net asset value (NAV) of SRs (and not the volume of outstanding SRs as was the case earlier) to incentivise ARCs to focus on recoveries. Hence, any recovery rating downgrade for ARCs directly affects their management fees.10 From the recoveries, expenses incurred by the trust are extracted first, followed by management fees and additional incentive to the ARCs, and the balance is used for redemption of SRs. A major part of the expenditure for ARCs arises from operational expenses relating to the acquisition of debt and fees incurred for valuation of trusts, apart from interest costs on the extent of their leverage. The overall trends in profitability of ARCs suggests a largely stable return on assets (RoA) ranging close to 3 per cent (Chart 6). While the return on equity (RoE) showed a significant dip after 2014, it has revived from 2016 onwards to be close to about 7 per cent. Notably, the RoA of ARCs is higher than their NBFC counterparts. 5.2 Features specific to the Stage of Operation of ARCs 5.2.1 Acquisition of Assets ARCs generally acquire assets from banks and financial institutions. While bilateral deals with sponsor banks are prohibited, no such restrictions exist for bilateral deals with financial institutions or for auctions conducted by the banks and financial institutions. Of the two modes, auctions have dominated the ARC deals till now (Chart 7). Valuation of acquired assets is a critical business concern for ARCs in the process of acquisition. Considering that ARCs and banks are on two sides of the sale deal, a higher acquisition ratio (defined as acquisition cost to book value of assets) works in favour of banks. It has often been argued that a low acquisition ratio, and consequently a higher haircut, has hindered banks from getting stressed assets off their books. Over time, although the average acquisition ratio has gradually risen, it remains in the range of 30-35 per cent. Moreover, there continues to be a wide variation in the acquisition ratio across ARCs, with the variation too increasing over time (Chart 8). 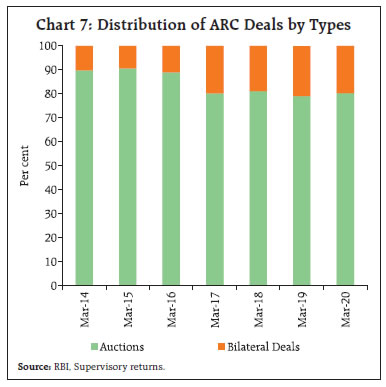 There is a wide variation in the acquisition ratio also across sectors. Iron and steel, and power sectors are the two sectors having a relatively high concentration in acquired assets, as they are also ridden with NPAs. The acquisition ratio in these two sectors has been much lower. By contrast, hospitality and real estate account for a smaller share in total assets acquired, but their acquisition ratio has been relatively high (Chart 9). 5.2.2 Resolution of Assets The acquisition of assets only marks the beginning of the operations of the ARCs; the second stage is about the resolution of acquired assets. Broadly speaking, the approach to resolution taken by an ARC can be viewed as either a liquidation approach or a going concern approach or a combination of both. The exact choice of the approach is driven by the viability of the underlying assets.
More specifically speaking, the resolution methods of ARCs can be divided into five categories as shown in Table 2, with ARCs preferring the method of rescheduling of the payment obligations over other methods. There has been a steady fall over time in the percentage of assets resolved by way of enforcing the security interest. Change in or takeover of management/taking possession of assets too has been used sparingly as a mode of resolution. 5.2.3 Recovery and Redemption of SRs The third stage of operation of ARCs relates to the recovery and redemption of SRs. Recovery of SRs is a critical indicator of the performance of ARCs. As per the regulatory guidelines, ARCs have to disclose the NAV of the SRs issued by them, which are used for valuation of the SRs by investors. To determine the NAV, ARCs have to obtain a recovery rating from an accredited credit rating agency (CRA). The CRA generally decides its recovery rating based on an assessment of the resolution method adopted. | Table 2: Distribution of Total Resolved Assets, by Method of Resolution, in per cent | | Resolution Method | Mar-16 | Mar-17 | Mar-18 | Mar-19 | Mar-20 | | 1 Rescheduling of payment of debt | 37.0 | 36.5 | 36.8 | 35.7 | 32.0 | | 2 Enforcement of security interest | 32.0 | 35.1 | 31.5 | 28.6 | 26.6 | | 3 Settlement of dues of borrower | 30.0 | 24.8 | 25.2 | 28.4 | 26.0 | | 4 Taking possession of assets | 2.0 | 3.9 | 6.2 | 7.2 | 1.5 | | 5 By sale of business | 0.0 | 0.4 | 0.3 | 0.1 | 13.9 | | Source: RBI Supervisory returns. | The concentration in net owned funds (NOF) and AUM that was discussed earlier is also reflected in the issuance of SRs; in March 2020, only two ARCs held about 62 per cent of the total SRs issued (Chart 10). Furthermore, banks continue to hold close to 70 per cent of the total SRs despite a change in the regulation disincentivising them from holding SRs above a specific threshold (Chart 11).11 The dominance of selling banks in holding SRs has often been described as a reason for limited secondary trading of SRs, despite the regulatory push to incentivise listing and trading of these instruments.12 The age profile of outstanding SRs shows a concentration of older SRs in the books of ARCs. Considering that the ARCs have a five-year horizon (extendable to eight years, as discussed earlier) to redeem the SRs, their redemption performance is expected to be driven by the age of the SRs issued. In other words, the outstanding stock of the SRs would be predominated by the younger SRs. However, about 42 per cent of the outstanding SRs as on March 2020 were more than five years of age and would have to be redeemed over the next four years to avoid write-offs (Table 3). 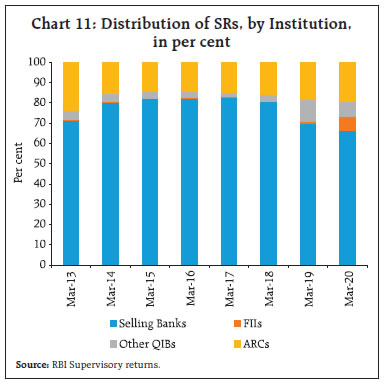
Table 3: Age Profile of SRs
(As on March 2020) | | Year | Total SRs outstanding
(₹ crore) | Age
(years) | Due for write-off in | | 2012-13 and before | 3,910 | More than 8 | 2020-21 | | | (3.6) | | | | 2013-14 | 16,393 | 7 | 2021-22 | | | (15.3) | | | | 2014-15 | 15,333 | 6 | 2022-23 | | | (14.2) | | | | 2015-16 | 9,401 | 5 | 2023-24 | | | (8.7) | | | | 2016-17 | 15,603 | 4 | 2024-25 | | | (14.5) | | | | 2017-18 | 14,834 | 3 | 2025-26 | | | (13.8) | | | | 2018-19 | 18,084 | 2 | 2026-27 | | | (16.8) | | | | 2019-20 | 14,318 | 1 | 2027-28 | | | (13.3) | | | | Total | 1,07,877 | - | - | | | (100.0) | | | | Weighted average age | - | 4.1 | - | Note: Figures in brackets indicate percentage share of SRs outstanding as on March 2020.
Source: RBI Supervisory returns. | 6. Concluding Observations ARCs have been an integral part of the institutional infrastructure for asset resolution in India. Unlike many other countries that experimented with a public sector model of asset management companies marked by their existence for a pre-defined period following banking crises or crises-like situations, India introduced ARCs as private sector institutions as part of its financial sector reforms. Given the difference in the constitution and mandate, the course of evolution of Indian ARCs has been distinct in many ways as compared to their counterparts in other countries. The evolution of ARCs in India has been marked by phases of growth and lull in terms of both their number and the assets under management. Their evolution has been shaped by macro-financial conditions and regulatory environment. The regulatory changes by the Reserve Bank have been broadly geared towards strengthening the ARC industry, ensuring genuine sale of NPAs by banks, enhancing the involvement of ARCs in the process of resolution, and deepening the market for SRs, among others. Following are the distinct features of the Indian ARC industry: Firstly, notwithstanding the increase in the number of ARCs over time, there has been a concentration in the industry in terms of AUM and relatedly SRs issued, and net owned funds. Secondly, despite the regulatory push to broaden, and thereby enhance, the capital base of these companies, they have remained reliant primarily on domestic sources of capital, particularly banks. Thirdly, given the private character of these companies, they have tended to rely heavily on borrowings, particularly from banks, as a major source of their funds. Considering that banks are not just the major shareholders of and lenders to ARCs but also sellers of NPAs to ARCs, it may be necessary to monitor if there is a circuitous movement of funds between banks and these institutions. A movement of this kind can have implications for the genuine sale of NPAs and the overall growth of the ARC industry. The business operations of the ARCs can be divided into three major stages, viz., acquisition of assets, resolution of assets, and finally, recovery and redemption of SRs. Each of these stages is marked by certain distinctive features. First, the current acquisition ratio for the ARC industry stands at around 35 per cent, marked by a wide variation across ARCs and sectors of economic activity. Secondly, ARCs have predominantly resorted to rescheduling of payment obligations as a method of resolution; resolution by way of enforcing the security interest has seen a decline over time. Thirdly, there is a considerable concentration of older SRs in the books of ARCs. The IBC, 2016 has been a milestone in the development of the asset resolution infrastructure in India. The percentage of assets recovered through IBC has been on a rise in recent years, while the percentage of assets recovered through ARCs has shown a decline. However, ARCs account for about 30 per cent of the total assets recovered through various channels and remain a complementary mechanism for asset resolution even in the post-IBC world. The movement in asset quality of banks and NBFCs following the COVID-19 pandemic could bring ARCs into greater focus and action. Going forward, the introduction of a new asset reconstruction company for addressing the NPAs of public sector banks may also shape the operations of the existing ARCs. There is a definite scope for the entry of a well-capitalised and well-designed entity in the Indian ARC industry; such an entity will strengthen the asset resolution mechanism further. References: Bergström, C., P. Englund, and P. Thorell (2003), “Securum and the Way Out of the Banking Crisis”, Summary of a Report commissioned by SNS (Centre for Business and Policy Studies), Stockholm. Bhagwati, J., M. Shuheb Khan and R. R. Bogathi (2017), “Can Asset Reconstruction Companies (ARCs) be Part Solution to the Indian Debt Problem?”, ICRIER Working Paper 338. Cerruti, C. (2018), “Public Asset Management Companies”, World Bank presentation at https://pubdocs.worldbank.org/en/531571527523031777/NPL-Conference-Day1-8-Caroline-Cerruti.pdf Cerruti, C. and R. Neyens, (2016), Public Asset Management Companies- A Toolkit, World Bank Group. Dreyer, M., (2020), Preliminary YPFS discussion Draft, Danaharta. Ernst and Young (2020), “Management of Non-performing Loans”, Presentation at www.assets.ey.com. Fung, B., J. George, S. Hohl and G. Ma (2004), “Public Asset Management Companies in East Asia: A Comparative Study”, FSI Occasional Paper No. 3. IBBI (2019), Understanding the IBC- A Handbook, New Delhi. Reserve Bank of India (2018), Report of the Expert Committee on NPAs and Frauds, Mumbai. World Bank (1997), Implementation Completion Report - Republic of Ghana.
|