Indian economy witnessed a bank credit boom during the period 2007-08 to 2013-14. In the subsequent years, however, the credit cycle reversed along with a noticeable qualitative shift in the sectoral deployment of bank credit due to dismal credit offtake in the industrial sector, with credit growth almost entirely being driven by the non-industrial sectors, especially personal loans. Analysis of thirty three select banks reveals that dominant-group, comprising six leading banks on the basis of their share in non-food credit, continued to lend to the non-industrial sectors but its lending to the industrial sector was subdued. The other-group comprising the rest of the banks recorded a drop in industrial credit, especially during the pandemic period. An empirical exercise using fixed effects panel regression revealed that during the pandemic period, the industrial sector was affected the most. I. Introduction Adequate and timely availability of credit is an essential prerequisite for economic growth. In India, despite market-based sources gaining importance in the recent years, bank credit has been the prime source of finance for various sectors of the economy. Apart from financing growth, variations in bank credit are an important channel for central banks that rely on interest rates to convey their policy stance (RBI, 2005). Fundamentally, bank credit assumes importance for individuals, business organisations, industries, as well as government1. Given the importance of bank credit flow to different productive sectors of the economy, the Reserve Bank has been compiling and publishing monthly sectoral deployment of bank credit data. The data is classified under the food and non-food credit (NFC) categories, with food credit being provided to the Food Corporation of India (FCI) and state agencies for procurement of food grains. As food credit is largely driven by external forces such as monsoons, size of the marketed surplus and Government procurements, non-food credit is generally used as a gauge of bank lending (Banerjee, 2011). Non-food credit is categorised into four broad categories - (i) agriculture and allied activities, (ii) industry, (iii) services, and (iv) personal loans. Among these four, the credit offtake to personal loans segment has emerged as the prime driver of overall non-food credit growth in the past couple of years, accounting for a share of around 29.0 per cent in non-food credit and a growth (y-o-y) of 10.2 per cent in March 2021. The evolving patterns in credit allocation across sectors assume greater significance, as banks’ credit allocation strategies could have a potential impact on the economy, particularly in the case of emerging market economies (EMEs) like India, where there is a paucity of capital to support economic growth. It is also important to know how the sectoral composition of credit has changed over time, as this can have implications for economic growth and employment generation. As a result, channelising credit to targeted sectors, such as, the micro, small and medium enterprises (MSMEs), which have greater linkages, both forward and backward, and higher employment potential has always been a part of planned policy initiatives of the Reserve Bank. In the recent past, Anthony et al. (2019) attempted to analyse movements of overall non-food credit along with its sectoral dynamics and noted a qualitative shift in the sectoral deployment of bank credit with aggressive lending to the retail segment in the form of personal loans. Prakash and Kumar (2021) further studied the developments in the sectoral deployment of bank credit during the period preceding the COVID-19 pandemic and compared them with that during the period of the first wave of COVID-19 in India and concluded that an already muted credit growth experienced a further setback in 2020-21 in the wake of the pandemic. These studies, however, focused on developments in non-food credit and its sectoral components. The bank-wise lending behaviour in different sectors has not been examined yet by any study. Against this backdrop, this article examines the changes in credit allocation, between industrial and non-industrial sectors2, along with the lending behaviour of banks3 since 2007-08. This study also empirically assesses the impact of COVID-19 pandemic on (a) credit delivery and (b) sectoral credit offtake. The analysis is relevant given the prevailing muted credit growth and provides important insights for shaping future policy for improving credit offtake and its allocation. The remainder of the article is organised as follows. Section II presents trends in sectoral credit. Section III analyses if credit offtake to the industrial sector is driven by some banks. Section IV presents performance and lending behaviour of the bank groups in extending credit to various industrial sub-sectors. Section V analyses performance of bank groups in extending credit to the non-industrial sectors. Section VI provides empirical estimation relating to what has been defined as dominant-group and other-group of banks for the pre-COVID-19 period and COVID-19 period and finally, Section VII presents concluding observations. II. Trends in Sectoral Credit Bank credit to private non-financial sector in India accounted for 57.4 per cent of GDP in 2020. As compared to some of the EMEs, bank credit to the private non-financial sector in India has shown a nearly flat trend in the recent past (Chart 1). An analysis of the sectoral composition of non-food credit reveals that the share of credit to the industrial sector in overall non-food credit offtake, which stood at over 45.0 per cent in 2013-14, declined to around 30.0 per cent by 2020-21. The share of credit to the industrial sector is still the highest, followed by personal loans, services, and agriculture (Chart 2). Over the years, personal loan segment and services sector credit have gained more prominence. The Indian economy witnessed a bank credit boom during the period 2007-08 to 2013-14 with non-food credit registering compound annual growth rate (CAGR) of 16.8 per cent, primarily driven by robust credit growth to the industrial sector as well as accelerated credit flows to the non-industrial sectors. Credit to the industrial sector recorded CAGR of 19.6 per cent, while credit to the non-industrial sectors registered CAGR of 14.6 per cent during the period. The relative contribution of credit to the industrial sector in overall non-food credit growth was nearly 50.0 per cent, indicating robust credit growth associated with significant expansion of credit to the industrial sector during the period (Chart 3). As a result of the robust credit flow, the industrial sector’s share in total non-food credit increased to 45.5 per cent in 2013-14 from 38.9 per cent 2007-08 (Chart 2). In the subsequent years, however, credit cycle reversed along with a noticeable qualitative shift in the sectoral deployment of bank credit. During 2014-15 to 2020-21, credit growth decelerated, registering a CAGR of 8.3 per cent, primarily due to a reversal in credit growth in the industrial sector. Credit to the industrial sector recorded a muted CAGR of 1.6 per cent against CAGR of 12.4 per cent registered by credit to the non-industrial sectors during the period 2014-15 to 2020-21. The overall non-food credit growth was almost entirely driven by an expansion of credit to the non-industrial sectors, especially to the retail segment in the form of personal loans, during the period (Chart 3). The muted performance of credit to the industrial sector was because of factors like subdued demand for industrial bank credit, alternate sources of financing, viz., foreign direct investment (FDI), equity, bonds, debentures, etc., coupled with some risk aversion on the part of banks owing to the problem of stressed assets in a few large industries. The slowdown in credit growth got further compounded after the outbreak of COVID-19 pandemic in 2020-21. 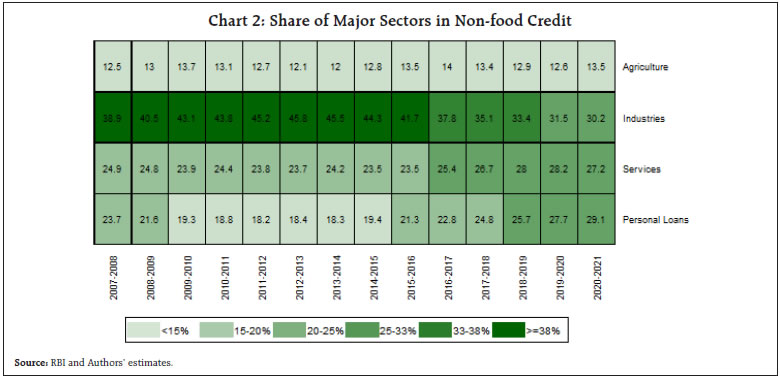
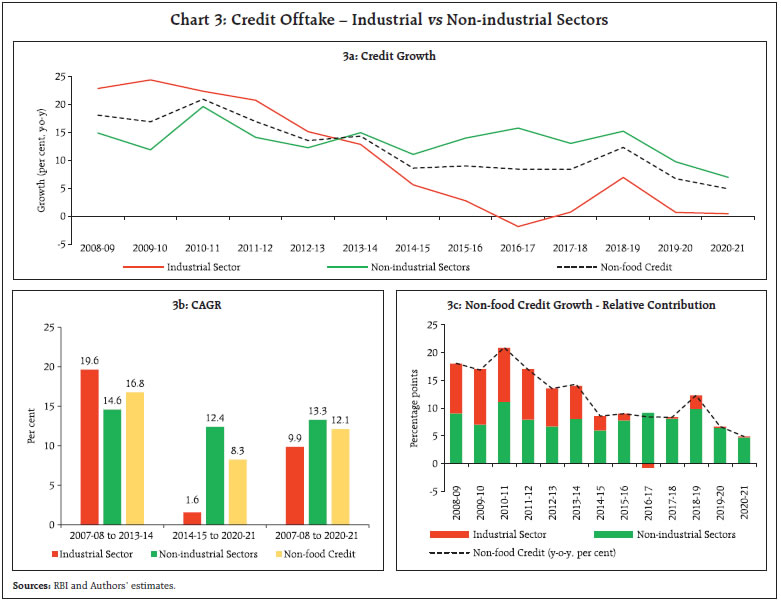 As a result of the pandemic and consequent shutdown of most of the economic activities, not only did real GDP decline, but credit demand was also adversely affected, leading to further deceleration in credit growth to the industrial sector along with softening of credit growth to the non-industrial sector. The sluggish credit growth to the industrial sector since 2014-15, which has also led to a moderation in the overall credit growth, warrants an investigation into the reasons; whether the slowdown in lending to the industrial sector is common to all the banks or there has been a divergence in behaviour across banks. III. Is Credit Offtake to the Industrial Sector Driven by Some Banks? With a view to studying the lending behaviour of banks, especially in the industrial sector, the sectoral non-food credit data, published by the Reserve Bank on a monthly basis, covering 33 select banks accounting for about 90 per cent of the total non-food credit extended by all scheduled commercial banks (SCBs), have been used. Based on a bank-wise analysis of data, it is observed that a few banks are contributing significantly to overall non-food credit offtake. Hence, the banks can be divided into two categories – (i) the dominant-group of banks, which includes six leading banks on the basis of their share in total non-food credit4, and (ii) the other-group of banks, which includes the remaining 27 banks. Credit growth to the industrial sector, which remained in double digits until 2013-14, witnessed sharp moderation subsequently, moving into negative territory in 2016-17 mainly due to a sharp contraction in credit offtake in the infrastructure sector, its largest component. It registered a recovery in 2018-19 but remained muted in the subsequent years. The robust credit growth to the industrial sector during 2007-08 to 2013-14 was due to the aggressive participation of both dominant-group and other-group of banks in lending to the industrial sector. It is also reflected in CAGR of 20.5 per cent and 18.9 per cent registered by dominant-group and other-group of banks’ credit extended to the industrial sector, respectively, during the period. Although, dominant-group’s credit offtake remained on the higher side, both in aggregate and incremental terms, the gap between credit offtake by dominant-group and other-group did not change much during this period (Chart 4). After this credit boom period, credit growth to the industrial sector witnessed a sharp reversal and registered a muted CAGR of 1.6 per cent during the period 2014-15 to 2020-21. This decline in credit growth was primarily caused by a contraction in credit disbursed by the other-group coupled with modest growth in credit extended by the dominant-group to the industrial sector during the period. Credit to the industrial sector extended by the other-group registered a negative CAGR of 1.6 per cent, while that by the dominant-group registered a modest CAGR of 3.7 per cent during the period. Credit growth to the industrial sector experienced a further setback in 2020-21 and barely managed positive growth of 0.4 per cent due to the outbreak of COVID-19 and the resulting nationwide lockdown. In the pandemic year, the credit extended by the dominant-group to the industrial sector registered an accelerated growth of 5.1 per cent though that delivered by the other-group contracted by over 7.0 per cent. Thus, it is evident from the above that a few banks are driving credit growth to the industrial sector, whereas, most of the other banks are lagging behind in extending credit to the industrial sector. The lending behavior of the two groups of banks within the industrial sector and the non-industrial sectors has been analysed in the next two sections.  IV. Lending Behaviour of the Dominant-group and Other-group of Banks within the Industrial Sector The industrial sector can be broadly categorised into micro & small, medium and large industries depending on the size of investment into plant and machinery. The share of large industries has been around 80 per cent in the overall credit offtake to the industrial sector. The deceleration in credit growth to the industrial sector since 2014-15 has primarily been due to a downturn in credit growth to large industries. Among the sub-sectors5, infrastructure accounts for close to two-fifth of the credit offtake to the industrial sector, followed by basic metal & metal product, textiles, chemical and chemical products, and food processing. In terms of distribution of credit extended to the industrial sector by the dominant-group and other-group of banks, the other-group has been consistently losing market share, more sharply after 2017-18, vis-a-vis the dominant-group. The share of the other-group in credit to the industrial sector declined to around 36 per cent at the end of March 2021 (Chart 5). The surge in industrial credit during the period 2007-08 to 2013-14 was primarily attributable to significant credit expansion to infrastructure by both groups. Credit to infrastructure, on an average, accounted for around 36 per cent and 40 per cent share in the industrial credit growth registered by dominant-group and other-group, respectively. Credit to basic metal & metal products industries contributed over 13 per cent to the growth of industrial credit registered by each group. A sharp reversal in credit growth to the industrial sector since 2014-15 was marked by deceleration/contraction in credit growth across major industries. This was also reflected in decline in each group’s relative contribution to industrial credit growth, especially in the case of the other-group. V. Performance of Bank Groups in Extending Credit to the Non-industrial Sectors While credit growth to the industrial sector has decelerated sharply since 2014-15 due to subdued lending by both dominant-group and other-group of banks to the industrial sector, credit growth to the non-industrial sectors continued to remain in the double digits until 2018-19, indicating that credit flows to the rest of the economy remained robust before slowing down during the last few years (Chart 6). This also points to the increasing divergence in credit growth to the industrial sector vis-à-vis the non-industrial sectors since 2014-15. The robust credit growth to the non-industrial sectors, primarily driven by the personal loan segment, was due to persistent credit delivery to these sectors by both groups of banks. The credit extended by dominant-group and other-group to the non-industrial sectors registered CAGR of 13.1 per cent and 16.6 per cent, respectively during 2007-08 to 2013-14, while it was 14.0 per cent and 10.1 per cent, respectively, during the period 2014-15 to 2020-21. VI. Empirical Estimation Relating to the Dominant-group and Other-group of Banks: Pre and During the COVID-19 Period In this section, an attempt has been made to empirically estimate if there existed a significant difference between dominant-group and other-group’s ratio of sectoral credit to non-food credit in pre-COVID-19 and during COVID-19 periods applying fixed effects panel regression method. For empirical estimation, monthly data for the period from March 2016 to March 2021 have been used. Results are presented in Table 1. COVID-19 is a dummy which takes value 0 till March 2020 and 1 for the months thereafter. To find out if the other-group was impacted more by the COVID-19, an interaction term is also included. It was seen that for all banks together, it was the industrial sector which was most impacted by COVID-19. The personal loans segment was not impacted much by the pandemic. When comparing the dominant-group and other-group, credit extended by the other-group to the industrial sector was affected significantly due to COVID-19. The other-group performed better as compared to the dominant-group in credit extended to agriculture and services sectors. | Table 1: Fixed Effects Panel Regression | | Variables | Ratio of Agriculture credit to NFC | Ratio of Industry Credit to NFC | Ratio of Services Credit to NFC | Ratio of Personal Loans to NFC | | COVID-19 | -0.316* | -3.237*** | 1.259** | 2.295*** | | (0.163) | (0.6) | (0.585) | (0.341) | | Bank type x Covid-19 Dummy | 1.408*** | -2.407*** | 1.198* | -0.198 | | (0.18) | (0.665) | (0.649) | (0.378) | | Constant | 11.65*** | 38.71*** | 30.58*** | 19.07*** | | (0.0309) | (0.114) | (0.111) | (0.065) | | Observations | 1980 | 1980 | 1980 | 1980 | | R-squared | 0.093 | 0.175 | 0.04 | 0.097 | | No. of Banks | 33 | 33 | 33 | 33 | Standard errors in parentheses
*** p<0.01, ** p<0.05, * p<0.1; NFC: Non-food credit | Within the industrial sector, it was the large industries where credit extended by other-group was impacted more than the dominant-group. For medium and small industries, other-group of banks could lend some support (Table 2). | Table 2: Fixed Effects Panel Regression within the Industrial Sector | | Variables | Ratio of Credit in Large Industries to Industrial Credit | Ratio of Credit in Medium Industries to Industrial Credit | Ratio of Credit in Micro & Small Industries to Industrial Credit | | COVID-19 | 0.424 | -0.179 | -1.335*** | | (0.518) | (0.27) | (0.391) | | Bank type x Covid-19 Dummy | -3.799*** | 0.496* | 3.303*** | | (0.555) | (0.299) | (0.434) | | Constant | 80.840*** | 4.541*** | 14.62*** | | (0.095) | (0.0514) | (0.0744) | | Observations | 1980 | 1980 | 1980 | | R-squared | 0.078 | 0.003 | 0.059 | | No. of Banks | 33 | 33 | 33 | Standard errors in parentheses
*** p<0.01, ** p<0.05, * p<0.1 | VII. Conclusion Bank credit growth has witnessed significant fluctuations in the past one and half decades. The period between 2007-08 to 2013-14 could be characterised as bank credit boom period in the Indian economy, as non-food credit registered double-digit growth, primarily driven by robust credit growth to the industrial sector. Both dominant-group and other-group of banks lent aggressively to the industrial as well as other sectors. Within industries, infrastructure, and basic metal & metal product industries accounted for a major portion of credit offtake from both the bank groups during the credit boom period. Thereafter, however, the credit cycle reversed along with a shift in the sectoral deployment of bank credit. During 2014-15 to 2020-21, overall credit growth decelerated, primarily driven down by reversal in credit growth to the industrial sector because of deleveraging by non-financial firms, increasing dependence on non-bank sources for financial resources, and some risk aversion on the part of banks, especially by the other-group of banks to lend to industries, which got further compounded after the outbreak of Covid-19 pandemic. An empirical exercise to gauge if there existed a significant difference between other-group and dominant-group ratio of sectoral credit to non-food credit in pre-COVID-19 period and during-COVID-19 period revealed that industrial sector was impacted the most during the COVID-19 period. Credit extended by the other-group to the industrial sector was affected significantly due to COVID-19 but the performance of the other-group is better than the dominant-group as far as credit to agriculture and services sectors is concerned. The overall non-food credit growth during the period 2014-15 to 2020-21 was almost entirely driven by expansion of credit to the non-industrial sectors, particularly lending to the retail segment in the form of personal loans. Active participation of both the dominant-group and the other-group of banks is driving credit growth to the non-industrial sectors. The sharp slowdown in industrial credit, especially by other-group of banks, warrants attention and steps to step up credit offtake commensurate with appropriate risk-taking, a number of which have already been taken by the Government and the Reserve Bank, could defreeze the credit market for the industrial sector and help in reviving the growth momentum derailed by the Covid-19 pandemic. After witnessing a significant slowdown in credit offtake during 2019-20 and 2020-21, there has been some uptick in credit growth in the recent months notwithstanding the second Covid wave, which augurs well for the economy. References Anthony, J.M., Shankar, S., and Sahoo, S. (2019), “Sectoral Deployment of Bank Credit in India”, RBI Monthly Bulletin, February. Banerjee, K. (2011), “Credit and Growth Cycles in India: An Empirical Assessment of the Lead and Lag Behaviour”, RBI WORKING PAPER SERIES NO. 22, January. Prakash, A., and Kumar, S. (2021), “Sectoral Deployment of Bank Credit in India: Recent Developments”, RBI Monthly Bulletin, February. Timsina, N. (2014), “Bank credit and economic growth in Nepal: An empirical analysis”, NRB Economic Review, 26(2), 1-24. The Reserve Bank of India (2005), Report on currency and finance 2003-04.
|