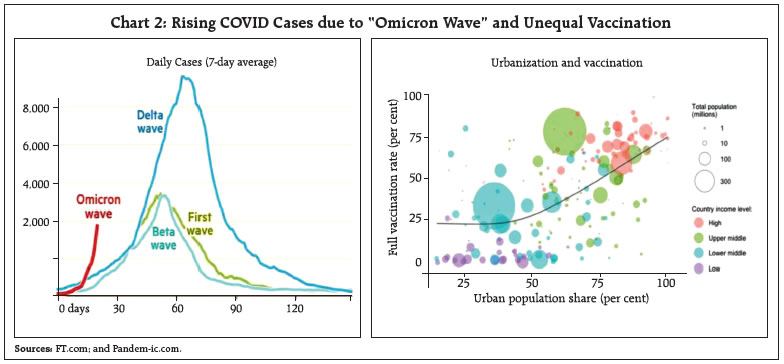
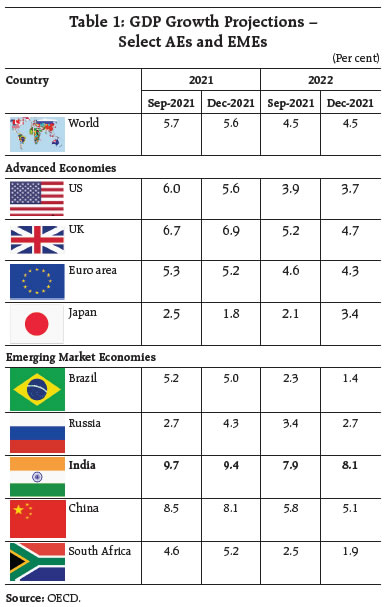
The global economy remains hostage to heightened uncertainty with Omicron sparking fresh containment measures. The Indian economy bounced back strongly in Q2:2021-22, with GDP surpassing its pre-pandemic levels, and inflation broadly aligning with the target. A host of incoming high frequency indicators are looking upbeat and consumer confidence is gradually returning. Aggregate demand conditions point to sustained recovery, albeit, with some signs of sequential moderation. On the supply front, farm sector situation remains strong with impressive progress of Rabi sowing, while the manufacturing and services record strong improvement on strengthening demand conditions and surge in new business. Introduction The global economy remains hostage to heightened uncertainty. In the wake of surging infections, supply chain snags, logistic disruptions and inflation touching multi-year highs in several economies, the new strain of COVID-19 − Omicron, B.1.1.529 – is sparking fresh waves of containment measures and travel restrictions. These developments have tempered the momentum of global growth and trade, even as mounting inflation risks have brought forward policy normalisation timelines in several countries. In spite of these global headwinds, the Indian economy bounced back strongly in Q2:2021-22, with GDP surpassing its pre-pandemic levels, and inflation broadly aligning with the target, barring some short-lived spikes. Recognising that it is necessary to revive and sustain growth on a durable basis, the Monetary Policy Committee (MPC) decided to pause and persevere with an accommodative policy stance. A host of incoming high frequency indicators are looking upbeat. With the tapering of infections, the active caseload plunged below 90,000 on December 14, its lowest level since end-May 2020. The inoculation rate has gathered steam, with average jabs given per day climbing to over 75 lakh in December, higher than the average of 55 lakh a month ago. The milestone of 1 crore doses administered in a single day was passed for the sixth time on December 4. On top of this, India exported close to 20 lakh COVID-19 vaccines to low and middle-income countries during November, with four-fifths being under the COVAX facility. Consumer confidence is gradually returning, as captured in the November 2021 round of the Reserve Bank’s consumer confidence survey (CCS). The overall outlook remains optimistic on the general economic situation, the employment scenario and household income. For the year ahead, consumers are buoyed by sentiments on income and employment. Mobility indicators have inched up. In the job market, hiring activity has surged, led primarily by the telecom and internet services. Construction sector activity has gathered pace backed by a spurt in cement production and demand for residential units gaining momentum. Revenue collections under the goods and services tax (GST) in November was the second highest ever although e-way bill issuances moderated somewhat pointing to moderation in GST collections in the month ahead. E-way bills generation has picked up again in December (upto December 12) posting sharp growth (month-on-month). On the other hand, toll collections remained resilient in November. With activity picking up, India’s power consumption continues to recover for the second month in a row. Coal stock at power plants has risen to nine days, assuaging concerns on supply shortages. The progress of ongoing rabi sowing remains impressive, having covered almost half of the annual average acreage. The headline manufacturing purchasing managers’ index (PMI) notched the strongest improvement in the past ten months on strengthening demand conditions and prudent marketing strategies. The headline services PMI continued to gain momentum reflecting a surge in new business. Supported by strengthening macroeconomic fundamentals, India is setting out on a path of durable growth. Set against this backdrop, the remainder of the article is structured into four sections. Section II captures the rapidly evolving developments in the global economy. An assessment of domestic macroeconomic conditions is presented in Section III. Section IV reviews financial conditions in India, while the last Section concludes the article. II. Global Setting The global economy is besieged by heightened uncertainty in the wake of the high positivity rate of the Omicron variant. Snarling supply chains and logistics disruptions continue to constrain manufacturing lines and trade, besides stoking inflation risks. With pandemic scars still healing, output gaps reveal substantial slack almost everywhere (Chart 1). With several central banks contemplating faster normalisation of monetary policy, financial market volatility has intensified. Risks to the global recovery remain tilted to the downside more so for developing economies, which continue to bear the brunt of pandemic because of slow and uneven inoculation rates (Chart 2). The vaccination rate is significantly lower in African countries, with only 10 per cent of their population (accounting for 16.7 per cent of the global population) receiving at least one dose. In its December 1, 2021 Economic Outlook, the Organisation for Economic Co-operation and Development (OECD) has scaled down the global growth forecast for 2021 by 0.1 percentage point to 5.6 per cent from its earlier projection made in September (Table 1). Growth projections for major economies have been revised down, reflecting the slowing of momentum due to persistent supply chain gridlocks, rising input costs and large labour shortages, despite employment and hours worked remaining below pre-pandemic level. As flagged by the OECD, most advanced economies (AEs) are poised to return to their pre-pandemic path by 2023, but only a handful of emerging market economies (EMEs) might attain full recovery by that period. Low-income countries are likely to fall short of their pre-pandemic output. For India’s GDP growth, there is a downward revision of 0.3 percentage points to 9.4 per cent for 2021, even as the projection for 2022 has been revised up by 0.2 percentage points to 8.1 per cent. 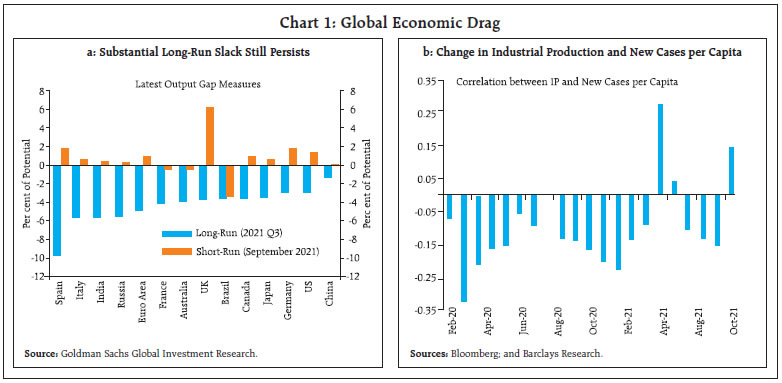
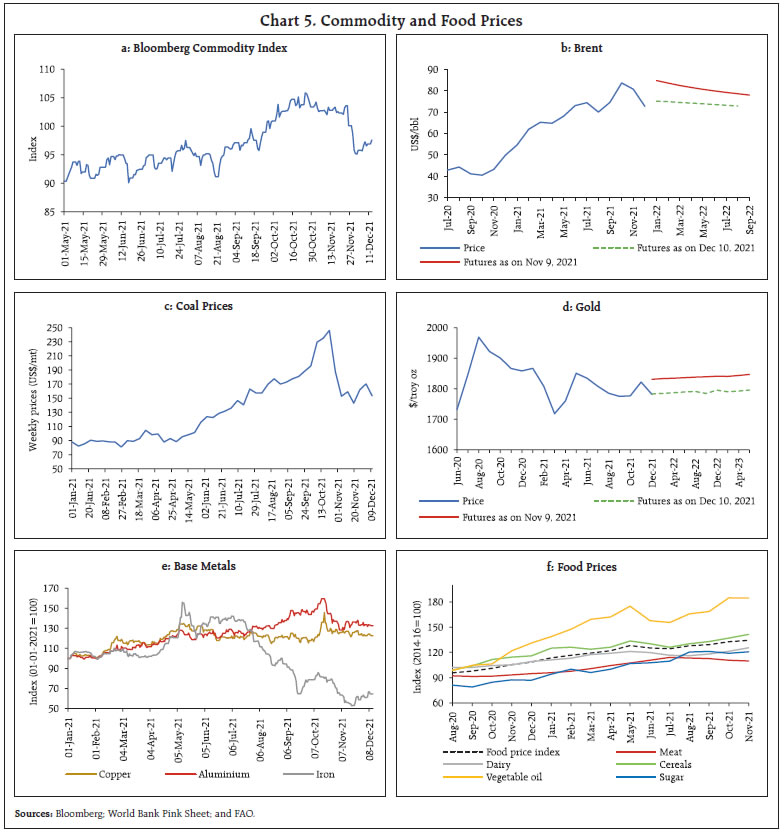
 Turning to more recent high frequency indicators, the global composite purchasing managers’ index (PMI) accelerated to a four-month high in November, with sustained growth in the services sector outweighing moderation in the manufacturing sector (Chart 3). Global manufacturing PMI, though in expansion zone for 17 months, was pulled down by persistent supply chain disruptions. The services PMI, on the other hand, remained steady at its three-month high reached in October, with robust growth in financial and business services counterweighing weakness in consumer services.  The latest reading of the Goods Trade Barometer released by the World Trade Organization (WTO) on November 15 at 99.5, points to slowing trade growth. Disruptions in critical sectors led to a broad-based loss in momentum for global goods trade, with all component indices of the barometer weakening. Merchandise trade volume growth decelerated on y-o-y basis for the fifth consecutive month in September on an unfavourable base effect (Chart 4a). Accordingly, the world goods trade volume growth declined by 1.1 per cent in Q3 (q-o-q), primarily reflecting slowdown in China’s trade. As per the United Nations Conference on Trade and Development (UNCTAD)’s November Global Trade Update, the quarterly growth in value of global goods trade, though positive, slowed to 0.7 per cent in Q3:2021, while services trade expanded by 2.5 per cent. In Q4, goods trade growth (q-o-q) is projected to be negligible, while services trade is expected to recover slowly, but likely to stay below the pre-pandemic level. Notwithstanding the recent slowdown, the UNCTAD projects the value of global trade in goods and services to increase by 23 per cent in 2021, reaching a level of US$28 trillion. After slipping by more than 50 per cent from its early October peak, the Baltic Dry Index – a measure of shipping charges for dry bulk commodities – showed some reversal since mid-November as prices hardened across all vessel segments following the rebound in coal flows (Chart 4b). Supply chain bottlenecks have showed some signs of easing in the last few weeks, with US ports making progress in working down the logjam of container ships. Nonetheless, the number of ships anchored offshore and waiting to unload at the ports are still hovering around record levels. The Bloomberg Commodity Price Index, which was treading a seven-year high, plummeted in the last week of November followed by some reversal in December so far (Chart 5a). Crude oil prices pulled back by more than 10 per cent on November 26, 2021 – the biggest one day fall since April 2020 – ending November with an overall decline of almost 17 per cent. With OPEC plus sticking to its plan of releasing 4,00,000 barrels per day in its December 02, 2021 meeting, crude prices extended losses into early December before registering some gains thereafter (Chart 5b). Among other fuels, prices of coal and natural gas have also edged down from recent highs as supplies improved and seasonal demand eased somewhat (Chart 5c). Gold prices exhibited seesaw movements, with early November gains getting erased in the latter part of the month on a strong US dollar and expectations of rate hikes being brought forward (Chart 5d). Base metal prices have been trading low, following China’s slowdown as well as on account of the strong US dollar. Concerns over the new variant added further to the downside in recent weeks (Chart 5e). The food price index, released by the Food and Agriculture Organization of the United Nations, maintained its uptrend in November on demand-supply imbalances, climbing for the fourth successive month to its highest level since June 2011. Mounting cereal prices, primarily decade high wheat prices, dairy and sugar prices led this increase (Chart 5f). 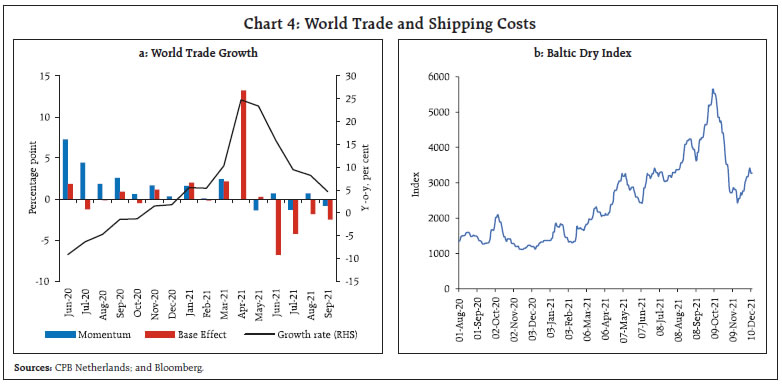
 During November, the US, India and the UK among others, announced the release of strategic petroleum reserves, expected to be around 70 million barrels1 (Chart 6). Inflation risks seem to be getting more embedded, with headline prints for most economies ratcheting up to their highest levels in more than a decade. According to the OECD’s latest projections, annual consumer price inflation for OECD economies is likely to end 2021 at around 5 per cent, followed by a decline to 3.5 per cent in 2022. Headline Inflation in the Euro area has soared to a 30-year high of 4.9 per cent in November amidst elevated energy costs and supply pressures (Chart 7a). In the US, consumer price inflation surged to 6.8 per cent in November – highest since June 1982 – on high energy and food prices resulting from strong consumer demand and supply disruptions. Inflation in the UK jumped to 4.2 per cent in October – highest since December 2011 – after easing in September, primarily led by a spike in housing and utilities costs followed by transport costs. Among major BRICS economies, inflation in Russia edged up further to 8.4 per cent in November, while in Brazil, it hit 18-year high of 10.74 per cent for the same month. In China, consumer prices have started picking with the inflation rate rising for the second consecutive month in November to its highest level since August 2020. Rising food prices on seasonal demand and persistent supply disruptions led to the pick up (Chart 7b). 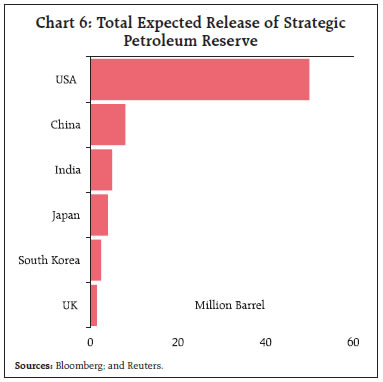 Financial markets continued to teeter with heightened uncertainty revolving around the new virus strain and the Fed’s pivot2 to faster tapering. Equity markets across AEs ended November in the red as rapid swings in sentiments led to sharp sell-offs; however, some reversal has been witnessed so far in December, with most indices paring November losses (Chart 8a). After scaling fresh peaks in early November, the US S&P index tumbled in the last week before recovering again in December. Moving in tandem with their AE counterparts, stock markets in EMEs shed gains, with the MSCI emerging market index clocking negative returns in November. With markets tipping into risk-off mode in November, the US 10-year bond yield eased, while shorter-term yields hardened on inflation worries, flattening the yield curve further (Chart 8b). The US dollar surged amidst a flurry of strong economic data, while the Fed’s shift in stance strengthened the rally further (Chart 8c). Concomitantly, most EME currencies depreciated in November, with net portfolio outflows exacerbating the downtrend. However, in December so far retrenchment in outflows led to some reversal (Chart 8d). 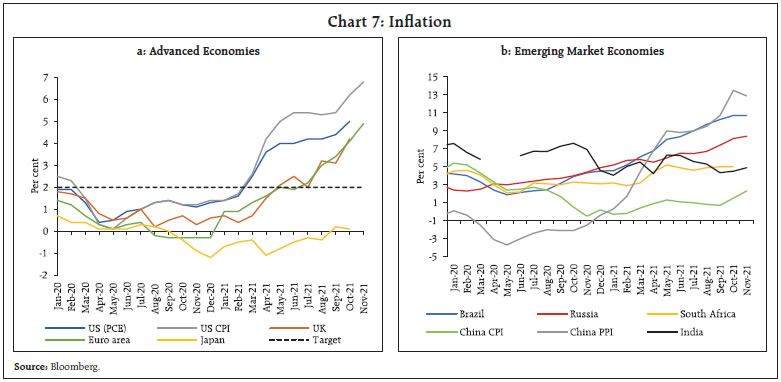 Monetary policy actions have diverged, with several economies accelerating their move towards policy normalisation. A few others continued to wait and watch amidst heightened uncertainty. The Fed indicated the possibility of a quicker withdrawal of monetary stimulus. In its November meeting, the Sveriges Riksbank kept its policy rate unchanged but announced the end of its net asset purchase programme by December 31, 2021. The Central Bank of Iceland raised its rate by 50 basis points (bps) in November, its fourth rate hike of 2021, while the Reserve Bank of New Zealand effected its second consecutive rate hike of 25 bps (Chart 9). After a pause in its October meeting, the Bank of Korea, hiked its policy rate by 25 bps as inflation continued to overshoot the target, while the Norges Bank paused in November after its first rate hike in September. The European Central Bank, on the other hand, maintained status quo. Most EME central banks have continued with policy tightening in Q4, with South Africa being the recent addition to the group as it raised its rate by 25 bps in November – its first hike in the last three years. Brazil effected its seventh rate hike for the year in December by 150 bps – the second consecutive hike of such scale – taking the total cumulative increase in 2021 to 725 bps. Among other EMEs, Mexico and Peru effected their fourth and fifth rate hikes, respectively, by magnitudes of 25 bps and 50 bps, respectively. A few other major EMEs, including Indonesia and Thailand, maintained status quo. Turkey, on the other hand, reduced its rate further in November by 100 bps following a reduction of 200 bps in October and 100 bps in September, thereby taking the total cumulative change for 2021 to (-)200 bps. In its December meeting, the People’s Bank of China lowered the reserve requirement for major commercial banks by 50 bps, effective December 15, releasing 1.2 trillion yuan (approximately US$188 billion) of long-term liquidity to support the economy.  The global economic outlook remains somewhat less sanguine, skewing the risks to the recovery to the downside. With inflation continuing to rule at multi-year highs for most economies, countries’ headroom for policy manoeuvre is getting compressed. The implications for overall financial stability are likely to be adverse. III. Domestic Developments For the Indian economy, the recovery is spearheaded by an uptick in private investment alongside a turnaround in bank credit offtake and high capex from the government sector (Centre and States). In conjunction, the employment situation has brightened. The outlook remains upbeat, though concerns revolving around the spread of the new Omicron variant are surfacing. The 7-day moving average of daily Covid-19 cases plummeted below 9000 by the close of November. After a blip during the festive season in the early part of November, the inoculation has gathered pace, with the 7-day moving average of vaccinations touching 80 lakhs per day by end November and crossing the 1-crore mark for the sixth time on December 4, 2021 (Chart 10a and 10b). 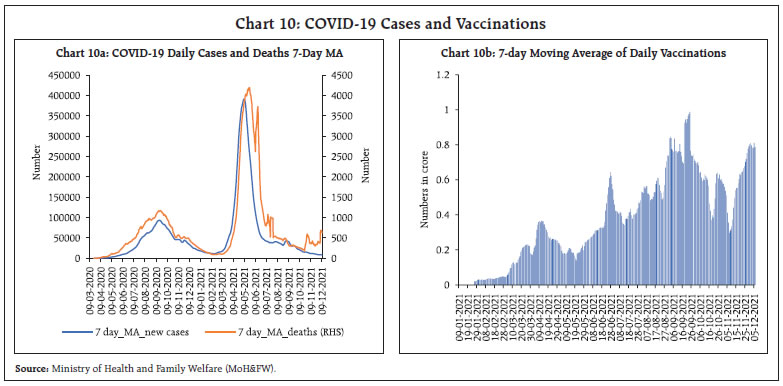 As per the National Statistical Office (NSO), November 30, 2021 release, India’s real GDP bounced back strongly in Q2:2021-22, hitting a growth of 8.4 per cent over a favourable base and exceeding the Reserve Bank’s estimates of 7.9 per cent. The GDP level surpassed that of Q2:2019-20 by 0.3 per cent. The recovery in aggregate demand remained broad-based, and in particular the government final consumption expenditure (GFCE), gross fixed capital formation (GFCF) and exports (Chart 11). Private final consumption expenditure (PFCE) posted an uptick on a y-o-y basis due to a faster resumption of contact-intensive services and restoration of consumer confidence but still remained below 2019-20 levels. India’s exports continued to register an impressive recovery, emerging as a key driver of the higher growth trajectory. Mobility continued to surge, sustaining the festive season spurt, with Google and Apple mobility indices surpassing levels recorded a year ago. The Google mobility index for mobility around parks, grocery and pharmacy, transit stations and workplaces reached pre-pandemic levels, while the Apple mobility index remained elevated across all major cities (Chart 12a and 12b). The weekly Nomura India business resumption index (NIBRI)3 recorded an uptick of 15.8 per cent during the week ended December 12, 2021 over pre-pandemic levels. Electricity generation picked up in the first week of December, surpassing pre-pandemic levels (Chart 12c). 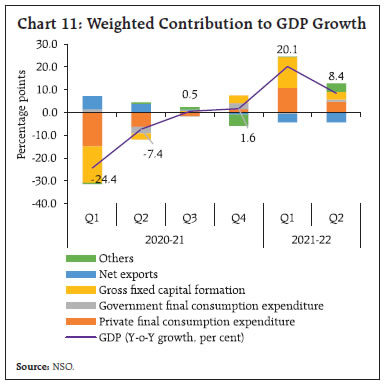 The National Family Health Survey, 2019-21 (NFHS-5)4 and the Annual Status of Education5 (ASER) [Rural] 2021 were released in November 2021. The NFHS shows an increase in the sex ratio of the total population to more than 1 (viz. 1020 women per 1000 men) for the first time since its inception, mainly in rural India. The Total Fertility Rate (TFR) has come down below the replacement level (2.1) to 2.0. Moreover, the survey reveals that the younger population (under-15) has dipped to 26.5 per cent during 2019-21 from 28.6 per cent in 2015-16, corroborating a demographic shift in the country. On the other hand, the ASER 2021 showed a shift in school enrolments from private to the government sector in rural India. Reflecting the transition to virtual modes of education in the pandemic, access to mobile phones among households of enrolled children accelerated from 36.5 per cent in 2018 to 61.8 per cent and 67.6 per cent in 2020 and 2021, respectively. Aggregate Demand Indicators of aggregate demand point to sustained recovery across spheres, but with signs of sequential moderation. Even as E-way bills generation remained above pre-pandemic levels (Chart 13a), there was some sequential dip in November on account of festive season fatigue in the first half of November. E-way bills generation has picked up again in December (up to December 12) posting sharp m-o-m growth. On the other hand, toll collections remained resilient with 71.5 per cent y-o-y growth in November 2021 (Chart 13b). The end of the festive season reflected in moderation in growth momentum of petroleum consumption, led by decline in diesel even as petrol consumption remained above pre pandemic levels and aviation turbine fuel recorded a steady pick-up in November 2021 (Chart 14a). Global supply chain and logistics disruptions continued to weigh heavily on the domestic automobile sector. The supply bottlenecks thwarted festive season sales of motor vehicles. Even so, vehicle registrations picked up led by non-transport vehicles (Chart 14c). Rural demand moderated with domestic sales of tractors registering a contraction by 22.5 per cent y-o-y in November. As per industry leaders, the decline in demand was attributed to a high base effect and delayed harvest of Kharif crops owing to late monsoons. Sales of two wheelers, three wheelers and motorcycles declined y-o-y and on a sequential basis, owing to a lackluster rural demand (Chart 14d). Within two wheelers, the electric segment continued to record a robust performance, increasing by 233.3 per cent y-o-y in November 2021 as online retailers turned to electric two wheelers for logistical operations and last mile deliveries. 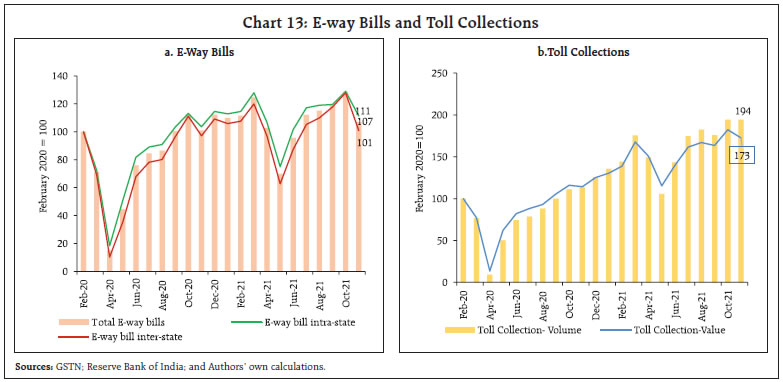
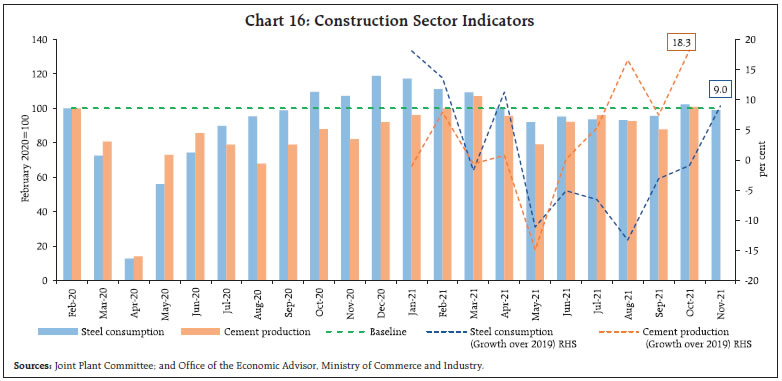
 Railways freight traffic registered a growth of 6.1 per cent y-o-y over a 9.0 per cent growth a year ago (Chart 15a). As shipping hurdles and container shortages worsened globally, port traffic growth moderated in November (Chart 15b). The moderation was led by a decline in shipment of iron-ore even as coking coal shipments increased. With as many as 101 projects identified under the PM Gati Shakti Yojana, port connectivity is expected to receive a boost, with a target of increasing cargo capacity at Indian ports by 37.2 per cent by 2024-25. Construction sector activity strengthened as cement production hit double digit y-o-y growth in October for the fourth consecutive month. Steel consumption moderated, mainly on account of lower demand from the automobile sector. Both cement production and steel consumption recorded growth over pre-pandemic levels (Chart 16). Demand for cement is likely to remain strong in the upcoming quarters due to the government’s push for infrastructure projects. Though the cement industry causes anthropogenic CO2 emissions, recent developments in green technologies, particularly related to reverse calcination, offer exciting opportunities for India (Box). In the aviation space, both passenger and cargo traffic have been on the pick-up mode since August 2021, with both international and domestic cargo freight normalising in November 2021. Passenger traffic has been gathering steam on the back of festive season travel. However, new travel guidelines coming in the wake of Omicron might derail the nascent growth. In the first ten days of December, daily domestic airport footfalls6 averaged 7.1 lakh per day – an uptick by 12.1 per cent over the corresponding period in November. International airport footfalls also improved by 24.7 per cent sequentially, while the cargo segment recorded growth of 23.3 and 18.3 per cent for domestic and international cargo, respectively. 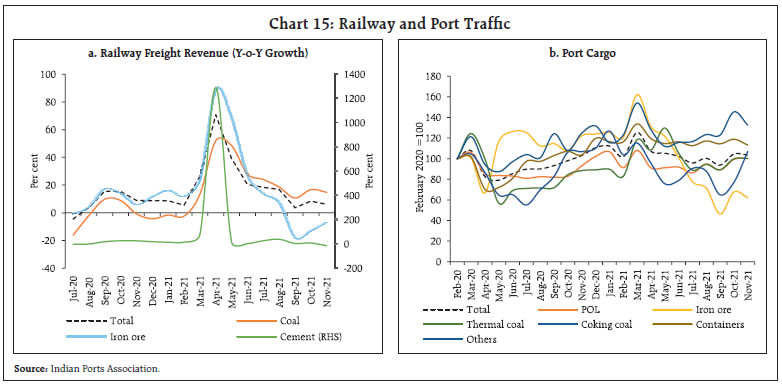
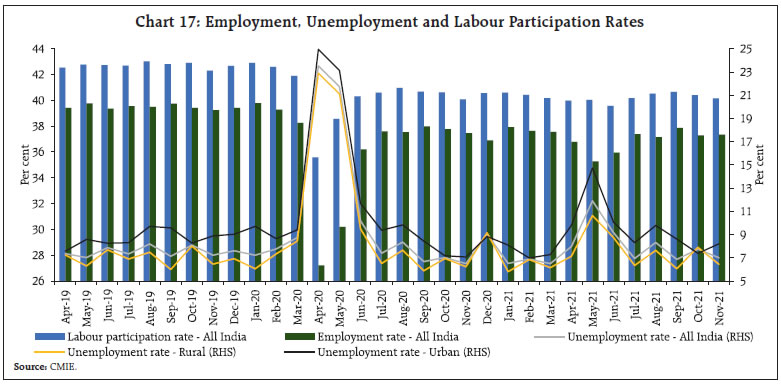 As per the household survey of the Centre for Monitoring Indian Economy (CMIE), the labour participation rate fell marginally from 40.4 in October 2021 to 40.2 in November after touching a 12-month high of 40.66 in September. The unemployment rate fell in November by 80 basis points to 7 per cent. The fall in unemployment rate was led by a 1.5 percentage points fall in rural unemployment (Chart 17). Organised sector labour market data, as captured by the Employees’ Provident Fund Organisation (EPFO) and the Employees’ State Insurance Corporation (ESIC), present a mixed picture with net ESIC subscriber additions moderating against a continued increase in net subscribers under the EPFO. As per the latest available data, the number of subscribers exiting their current jobs fell from 6.43 lakh in August 2021 to 3.31 lakh in September 2021. This is similar to what was observed in January-March 2021 when the economy was showing strong recovery (Chart 18). As per the CMIE’s employment statistics, the labour market moved closer to the pre-pandemic level, with the number of workers employed in October-November approaching the levels seen in 2019 (Chart 19). The employment segment of the PMI suggests both manufacturing and services sector jobs expanded marginally in November 2021. While the manufacturing sector employment reverted to expansion after three months, the services sector employment expansion moderated from last month (Chart 20).
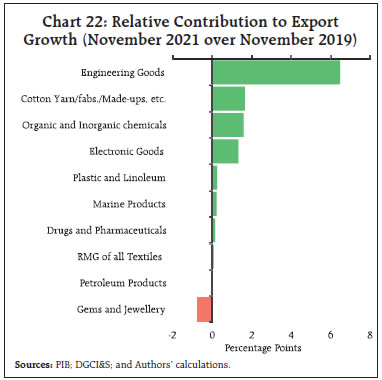
External demand for India’s merchandise trade remained robust, with exports clocking a growth of 16.6 per cent (US$ 30.0 billion) in November 2021 over pre-pandemic levels. There was, however, a sequential deceleration due to the persisting global supply chain bottlenecks, elevated shipping rates and global shipping container shortages (Chart 21a and 21b). Merchandise export growth stemmed from higher exports of engineering goods, cotton yarn, fabrics, handloom products, chemicals and electronics (Chart 22). Engineering goods exports stayed above US$ 8 billion mark for the ninth consecutive month in November 2021, supported by significant investment in power projects for infrastructure development. The Engineering Export Promotion Council (EEPC) expects that enhancing cost competitiveness through lower logistic costs and improved business environment could further boost these exports. 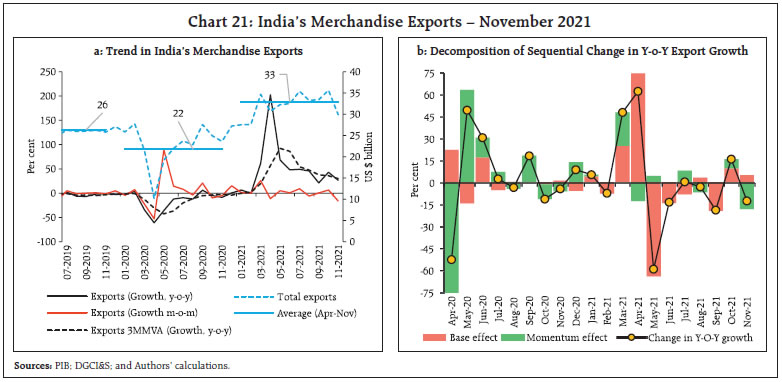
 India is also fast emerging as the world’s space hub for cost-effective launch of satellites. The space sector may see brightened future growth prospects, with private sector entities readying to produce launch vehicles and promote commercial launch programmes through leveraging on the infrastructure put in place by the Indian Space Research Organisation (ISRO). An active public-private partnership may push up exports of hardware segments like launch vehicles for the space industry. India’s merchandise imports remained above the US$ 50 billion mark for the third consecutive month, reflecting the strong underlying momentum in domestic economic activity (Chart 23a and 23b). Robust imports were driven by higher demand for petroleum products, coal, electronic products and gold (Chart 24). Moreover, nine out of ten major commodity groups comprising more than 70 per cent of imports recorded an expansion over the pre-pandemic levels, mirroring the broad-based demand uptick. Imports of coal, coke and briquettes more than doubled from pre-pandemic level and gained strong momentum during November, improving stock positions of thermal power plants (Chart 25a). Overall, non-oil non-gold imports manifested strong growth for the sixth consecutive month in November over pre-pandemic levels (Chart 25b). To reduce dependency on fossil sources like coal, the policy push for electric vehicles through schemes such as Faster Adoption and Manufacturing of Hybrid and Electric vehicles (FAME) would further push demand of rare earth elements (REE). The trade deficit stood at a record high of US$ 22.9 billion during November 2021 on account of the sharper expansion in imports than exports. 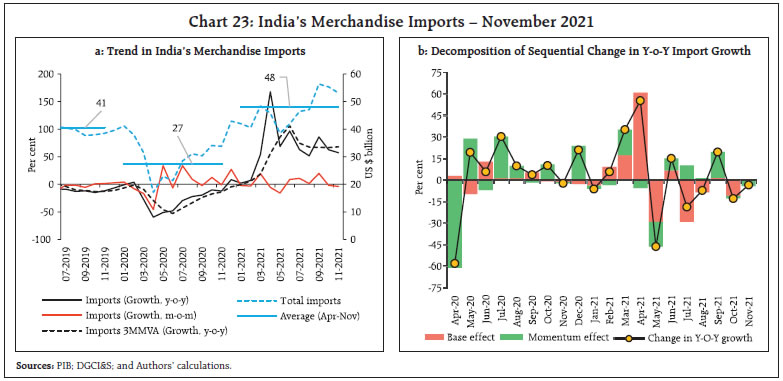
 The fiscal position of the Union government continued to be bolstered by net tax revenue touching an all-time high of 68.1 per cent of budget estimates (BE) and the gross fiscal deficit recording an all-time low of 36.3 per cent of BE during April-October (Chart 26). On the expenditure front, capital expenditure surged by 28.3 per cent while revenue expenditure expanded by 7.5 per cent over 2020-21. The growth in capital expenditure was spearheaded by the Ministry of Road Transport and Highways, which exhausted 68.2 per cent of its budgeted capital expenditure. As per cent of BE, however, both revenue and capital expenditure during April-October 2021 stayed below the level of preceding years. Total GST collections hit a growth of 25.3 per cent y-o-y in November, crossing ₹1.3 lakh crore mark for the second consecutive month in a row (Chart 27). GST revenue collection in November was the second highest since the introduction of GST.
On December 3, 2021, the Union government proposed a second Supplementary Demand for Grants (SDG-2) in the Parliament, which involves a net cash outgo of ₹2.99 lakh crore. Of this, ₹2.33 lakh crore is for revenue expenditure and ₹0.66 lakh crore is for capital expenditure (Table 2)7. The spurt in total expenditure proposed by the first and second SDGs amounts to ₹3.23 lakh crore, which will be partially offset by higher than budgeted tax and non-tax revenues. 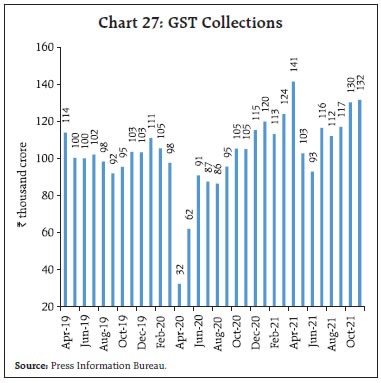
| Table 2: Cash Outgo Proposed by SDG (Dec 03, 2021) | | (Amount in ₹ crore) | | Ministry/ Department | Purpose | Revenue | Capital | Total | | Ministry of Chemicals and Fertlizers | Fertiliser Subsidy | 58,430 | | 58,430 | | Department of Food and Public Distribution | Food Subsidy | 49,805 | | 49,805 | | Ministry of Civil Aviation | Equity infusion in Air India etc. | 2,135 | 64,685 | 66,820 | | Ministry of Finance | Export Incentives/Remissions | 53,123 | | 53,123 | | Ministry of Housing and Urban Affairs | Pradhan Mantri Awas Yojana – Urban | 14,102 | | 14,102 | | Ministry of Rural Development | Mahatma Gandhi National Rural Employment Guarantee Scheme | 22,039 | | 22,039 | | Others | 33,774 | 1,150 | 34,924 | | Total Cash Outgo | 2,33,408 | 65,835 | 2,99,243 | In April-October 2021, both total receipts and total expenditure in 2021-22 as a per cent of budget estimates for states have largely reverted to pre-pandemic levels. Consequently, fiscal pressure has eased somewhat, boding well for expenditure plans for the rest of the year without causing undue fiscal slippage or stress. Furthermore, States’ resources in November 2021 got an additional lift of ₹47,541 crores through release of two installments8 of tax devolution to step up investment, infrastructure, and growth. Going forward, revenue expenditure (less of interest payments and subsidies) of the general government (Centre plus 18 States) during November-March 2021-22 is expected to grow by 27 per cent, after accounting for expenditure proposals contained in the SDG-2 and assuming States will meet their budgeted targets. Similarly, capital expenditure is expected to grow by 54 per cent during November-March (Chart 29). The higher revenue expenditure growth, a proxy of government final consumption expenditure, is expected to support economic recovery, while robust capex could crowd in private investment and improve medium-term growth prospects. Aggregate Supply The farm sector situation remains strong supported adequately by comfortable reservoir positions (Chart 30a). The availability of major fertilisers was higher than the requirement in November (Chart 30b). The progress of Rabi sowing is well on track: the area sown so far at 513.3 lakh hectares remains higher by 1.9 per cent than the corresponding period a year ago (Chart 30c). Notably the sowing of rapeseed and mustard, the major Rabi oilseed, has recorded a coverage of 114.3 per cent of full season normal reflecting farmers’ improved price expectations. In addition to this, the lower sowing of foodgrains could also have been triggered by the delayed harvesting of standing Kharif crops due to excessive unseasonal rains in many parts of the country. Sowing of all major crop groups barring coarse cereals has recorded increase over the previous year. 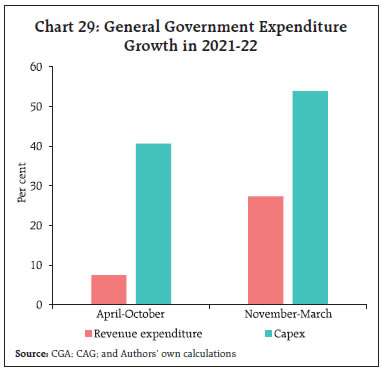 Robust sowing activity may be contributing to the reduction in demand for work under the Mahatma Gandhi National Rural Employment Guarantee Scheme (MGNREGS) [Chart 30d]. Paddy procurement for the current Kharif marketing season (KMS) [commencing from October 01, 2021] has progressed smoothly, with purchase of over 34.6 million tonnes up to December 12, 2021 as against 37.3 million tonnes a year ago. About 2.9 million farmers have benefitted from the ongoing KMS procurement operations with an outflow of ₹67,825 crores under the minimum support price (MSP) scheme. Buffer stocks of rice and wheat stood well above the quarterly norms (4.4 and 1.8 times, respectively) by end-November. In the industrial sector, the headline manufacturing PMI improved to 57.6 in November from 55.9 a month ago, pointing to the strongest revival in overall operating conditions since February 2021. Improvement in output and new orders drove firms to scale up production and deploy more inputs. PMI services remained in expansion at 58.1 propelled by increase in new orders. The business expectations index (BEI) for services continued to expand for the fourth successive month in November (Chart 31).
The services sector exhibited strong growth as mirrored by improvement in trade, hotels, transport communication and GST e-way bills (Table 3). Inflation As per the data released by the NSO on December 13, 2021, headline CPI inflation for the month of November 2021 was 4.9 per cent (y-o-y) registering an increase of 43 bps from 4.5 per cent in the month of October (Chart 32a). Price momentum (month-on-month change in prices in the current month) of around 70 bps was partially offset by favourable base effects of around 30 bps. Among constituents, food and beverages inflation increased to 2.6 per cent in November from 1.8 per cent in October, driven primarily by the continuing elevation in vegetables prices. Cereals, milk, fruits and sugar and confectionery also contributed to the increase in food inflation. On the other hand, inflation in respect of edible-oils, meat and fish, pulses, non-alcoholic beverages, prepared meals and spices registered a softening. CPI food (with a weight of 45.86 per cent in the CPI basket) contributed 25 per cent of headline inflation in November (Chart 32b). Fuel inflation moderated from the all-time high of 14.3 per cent (in the 2012=100 base year series) in October to 13.3 per cent in November (Chart 32a), primarily on account of electricity prices sinking into deflation even as LPG and kerosene prices remained at highly elevated levels. CPI fuel (weight of 6.84 per cent in the CPI basket) contributed 17 per cent of headline inflation in November (Chart 32b). CPI inflation excluding food and fuel9 or core inflation edged up to 6.2 per cent in November from 5.9 per cent in October (Chart 32a) on the back of a pick-up in inflation in clothing and footwear, household goods and services, recreation and amusement, housing, and personal care and effects sub-groups. Inflation in transport and communication and health sub-groups remained elevated. High frequency food price data from the Ministry of Consumer Affairs, Food and Public Distribution (Department of Consumer Affairs) for December so far (December 1-13, 2021) point to some softening of price pressures. Cereal price momentum appears to be decelerating. Pulses prices have also registered some softening. Under edible oils, prices of groundnut oil and mustard oil remained steady, and sunflower oil prices declined further. Among key vegetables, in December so far, tomatoes, onions and potatoes have registered price declines from end-November levels (Chart 33).
In the first half of December, retail selling prices of petrol and diesel in the four major metros remained largely unchanged, barring for the reduction of ₹8.56 per liter in petrol pump prices in Delhi on December 2, 2021 due to a cut in the VAT rate. LPG prices have remained steady since October 2021 while kerosene prices registered a decline in the first half of December (Table 4). Input costs pressures, as reflected in the PMIs, persisted in November across manufacturing and services. Selling price increases remained muted in manufacturing, while services sector registered price increases higher than the long-run average. | Table 4: Petroleum Product Prices | | Item | Unit | Domestic Prices | Month-over- month (per cent) | | Dec-20 | Nov-21 | Dec-21^ | Nov-21 | Dec-21 | | Petrol | ₹/litre | 86.27 | 105.57 | 103.03 | -0.7 | -2.4 | | Diesel | ₹/litre | 77.59 | 91.69 | 90.51 | -6.4 | -1.3 | | Kerosene (subsidised) | ₹/litre | 23.21 | 39.51 | 38.68 | 14.3 | -2.1 | | LPG (non-subsidised) | ₹/cylinder | 704.63* | 910.13 | 910.13 | 0.0 | 0.0 | *: As on December 15, 2020. ^: For the period December 1-13, 2021.
Note: Other than kerosene, prices represent the average Indian Oil Corporation Limited (IOCL) prices in four major metros (Delhi, Kolkata, Mumbai and Chennai). For kerosene, prices denote the average of the subsidized prices in Kolkata, Mumbai and Chennai.
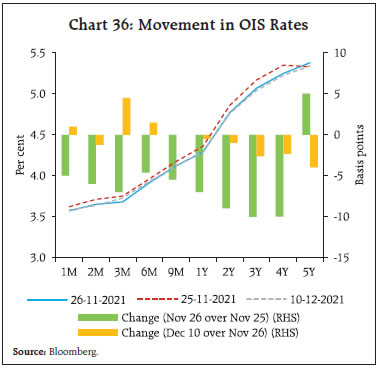
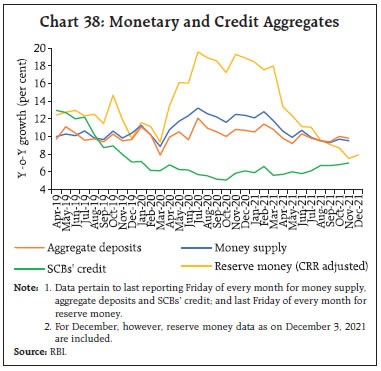
Sources: IOCL; Petroleum Planning and Analysis Cell (PPAC); and RBI staff estimates. | IV. Financial Conditions The Reserve Bank announced various liquidity related measures in the monetary policy statement of December 8, 2021. The amount absorbed under the 14-day variable rate reverse repo (VRRR) auctions stands enhanced to ₹6.5 lakh crore on December 17; and further to ₹7.5 lakh crore on December 31. From January 2022 onwards, liquidity absorption would be undertaken mainly through the auction route. With this rebalancing of liquidity surplus from the fixed rate overnight reverse repo window to the VRRR auctions, it is sought to re-establish the 14-day VRRR auction as the main liquidity management instrument. As a step towards rebalancing the liquidity surplus, it has now been decided to provide one more option to banks to prepay the outstanding amount of funds availed under the Targeted Long-Term Repo Operations (TLTRO 1.0 and 2.0) announced on March 27 and April 17, 2020. Moreover, given that banks took limited recourse to the marginal standing facility (MSF) window in the post-pandemic period due to surplus liquidity conditions, the normal dispensation of allowing banks to dip up to 2 per cent of their net demand and time liabilities (NDTL) has been reinstated (instead of 3 per cent) for overnight borrowing under the MSF from January 1, 2022. Overall financial conditions stayed buoyant as the system remained inundated with liquidity. The average daily absorption under the liquidity adjustment facility (LAF) increased from ₹8.5 lakh crore in the second half of November to ₹9.5 lakh crore during December 2021 so far (up to December 13). Of this, the amount absorbed under the fixed rate reverse repo dipped, averaging ₹2.0 lakh crore. Cut off rates under the auctions have reached 3.99 per cent, taking the weighted average rate of total absorption under the LAF to 3.82 per cent (Chart 34). Rates in the overnight money market segment – the weighted average call rate (WACR), the tri-party repo rate and the market repo rate – gravitated towards the lower bound of the corridor, following a brief period of hardening. Tri-party repo dominated the activity in the overnight segment, accounting for nearly 75 per cent of overall money market volumes in November. In the term segment, viz., 3-month T-bill, certificates of deposit (CDs) and commercial paper - NBFCs (CP-NBFCs), rates continued to hover higher reflecting repriced monetary policy expectations at the short end of the curve since the October policy, reinforced by hawkish Fed policy minutes. Their respective spreads over the reverse repo rate were 16 bps, 19 bps and 69 bps, respectively, during the latter part of November and up to early December (Chart 35). Primary issuances in the CP market remained buoyant at ₹2.9 lakh crore in November as compared to ₹1.1 lakh crore in October 2021. Overnight indexed swap (OIS) rates registered a broad-based decline across the curve on November 26 as risk-off sentiment gripped markets following reports over emergence of the Omicron variant. The decline was led by the 5-year OIS rate, which closed at 5.38 per cent, while the 1-year OIS rate closed at 4.29 per cent on November 26, 2021. The decline generally continued thereafter with marginal hardening for 3 months and 6 months rates (Chart 36). At the short end of the curve, G-sec yields exhibited a hardening bias while yields for longer maturities generally declined (Chart 37a), flattening the yield curve. The 10-year G-sec yield closed at 6.39 per cent on December 7, hardening from 6.37 per cent earlier. Mirroring G-sec yields, corporate bond yields too hardened for short tenors – yields on AAA rated 1-year and 3-year bonds increased by 15 bps and 26 bps, respectively, during the second half of November 2021 and early December (Chart 37b). The overall monetary and credit conditions stayed in sync with the normalising macroeconomic conditions. Reserve money (RM) excluding the first-round impact of the cash reserve ratio (CRR) restoration expanded by 7.9 per cent (y-o-y) as on December 3, 2021 (19.3 per cent a year ago), with currency in circulation – its largest component – growing at a similar pace (21.9 per cent a year ago) and implying a substantial decline in propensity to hold cash (Chart 38). On the other hand, money supply (M3) grew at 9.5 per cent as on November 19, 2021 (12.5 per cent a year ago) on the back of robust deposit growth of 9.8 per cent. The growth in scheduled commercial banks’ (SCBs’) credit to the commercial sector accelerated to 7.0 per cent on November 19, 2021 (5.8 per cent a year ago). 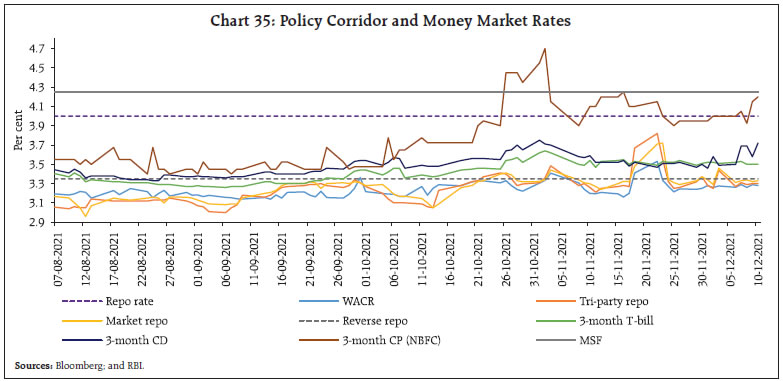
 Large surplus liquidity continues to facilitate monetary transmission in the credit market. The one-year median marginal cost of funds-based lending rate (MCLR) of SCBs softened cumulatively by 105 bps through March 2020 to November 2021. Across bank groups, public and private sector banks exhibited similar pass-through with respect to the 1-year MCLR. The median term deposit rate on fresh deposits dipped by 154 bps during the same period. The reduction in the overall cost of funds prompted SCBs to reduce their weighted average lending rate (WALR) on outstanding rupee loans. In addition, the increase in the share of external benchmark-linked loans in total outstanding floating rate loans from 9.4 per cent in March 2020 to 32 per cent in June 2021 also contributed to faster transmission in case of WALR on outstanding loans10. Since March 2020, the WALR on outstanding loans for SCBs declined by 107 bps (Chart 39). 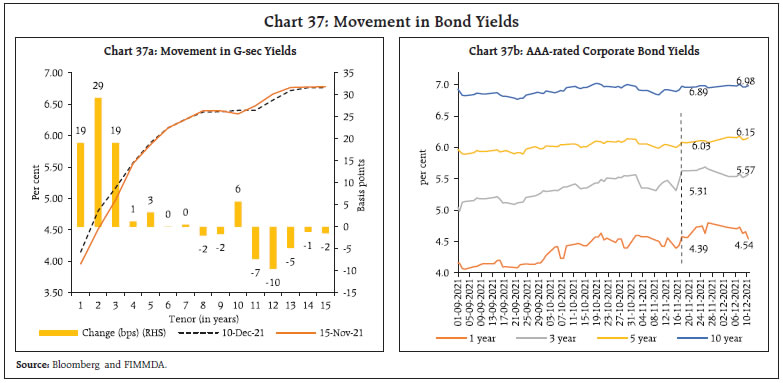
 There has been a moderation in term deposit rates across all tenors, with the maximum pass-through visible for shorter tenor deposits of up to 1 year maturity (181 bps) and the least for longer tenor deposits of maturity above 3 years (107 bps). Across domestic banks, private banks exhibit a higher pass-through to term deposit rates on account of robust deposit mobilisation as compared to their public sector counterparts (Chart 40). Interest rates on small saving instruments (SSIs), which are higher than the requisite formula-based rates, will be reviewed on December 31, 2021. The existing rates of interest for SSIs were higher by 42-168 bps than the formula-based rates in Q4:2021-2211. Equity markets commenced November 2021 on a positive note, following positive macroeconomic data releases (Chart 41). Sharp downswings became pronounced towards the close of the month, triggered by Omicron. Overall, the BSE Sensex declined by 3.8 per cent during November 2021.
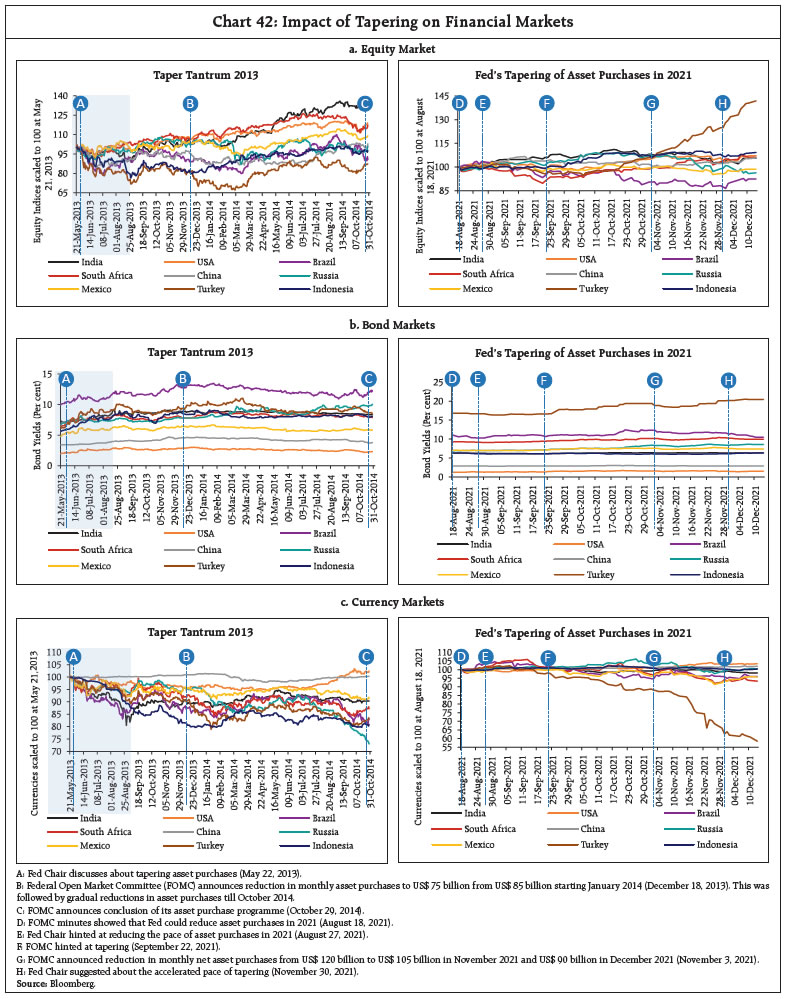
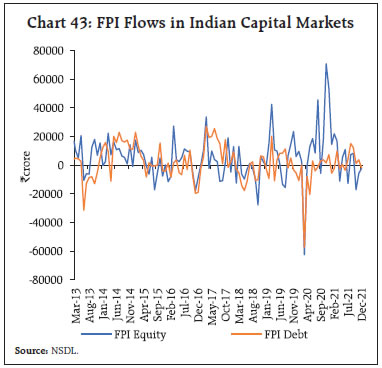
In the month of December 2021 (up to December 10), the BSE Sensex rebounded by 3 per cent as investors took cues from strong Q2:2021-22 GDP data, robust GST collections and expansion in manufacturing and services PMI for November 2021. The market sentiment was also buoyed by positive cues from global markets coupled with the Reserve Bank’s announcement to keep the policy repo rate unchanged and continue with the accommodative stance in its fifth bi-monthly monetary policy statement for 2021-22. A comparison of the tapering announcement by the Fed this time around with the previous such episode in 2013 shows that equity, bond and currency markets in EMEs have exhibited greater resilience so far than in 2013 (Chart 42a, 42b and 42c). Furthermore, in the immediate aftermath of the taper tantrum in 2013, India experienced portfolio outflows aggregating to ₹79,375 crore from capital markets, including ₹19,165 crore from equity markets and ₹60,210 crore from debt markets during May 23-August 30, 2013 (Chart 43). The latest announcement of reduction in asset purchases on November 3, 2021 by the Fed did not have much impact as portfolio flows remained relatively stable. The equities segment recorded net outflows of ₹8,854 crore, while the debt segment recorded net inflows of ₹1,147 crore during the period November-December 10, 2021. 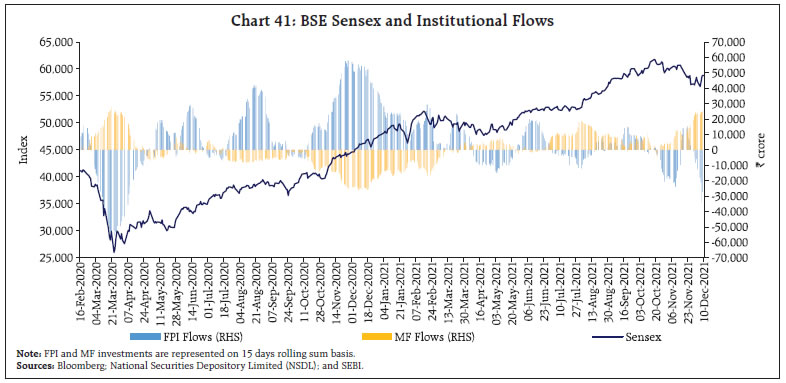
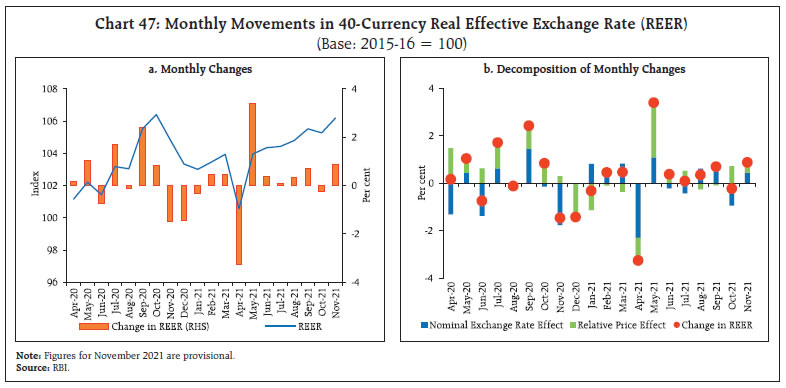
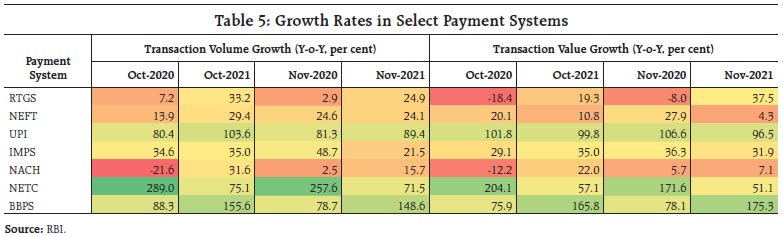
 During April-October 2021, gross inward foreign direct investment (FDI) at US$ 48.4 billion was comparable with its level a year ago (Chart 44). Net FDI was US$ 23.8 billion as compared with US$ 27.9 billion a year ago, reflecting rising outward FDI from India. The major FDI equity recipient sectors included manufacturing, computer services, communication services, financial services, and retail and wholesale trade. Foreign portfolio investors (FPIs) were net sellers in the domestic equity market in November 2021 amidst concerns over the new COVID variant and policy normalisation in the US (Chart 45). Other major EMEs also recorded outflows during the month. However, net purchases of US$ 0.5 billion by FPIs in the debt market were a tad higher than a month ago. The flows in the debt segment have largely been guided by the direction of the US dollar and US treasury yields. Net disbursements of external commercial borrowings (ECB) to India, including inter-company borrowings, were to the tune of US$ 6.8 billion during April-October 2021 as compared with net outflows of US$ 2.0 billion a year ago, while net disbursements excluding repayments and inter-company borrowings were of the order of US$ 4.0 billion as against net repayment of US$ 4.8 billion a year ago. The foreign exchange reserves were at US$ 635.9 billion on December 3, 2021 (Chart 46), equivalent to about 14 months of imports projected for 2021-22. In the foreign exchange market, the Indian rupee (INR) appreciated against the US dollar in November 2021 by 0.6 per cent (m-o-m). This was reflected in the movement of the INR in terms of the 40-currency real effective exchange rate (REER) index, which appreciated by 0.9 per cent over its level a month ago (Charts 47a and 47b). Payment Systems After a robust performance in October owing to festival demand, digital transactions across wholesale and retail channels sustained their growth momentum (y-o-y) in November and December (up to December 8). Large-value transfers through Real Time Gross Settlement (RTGS) jumped 18 percentage points over the previous month’s growth rate (y-o-y), backed by double-digit volume growth. Retail payment modes also gained further traction (Table 5). Transactions under the Unified Payment Interface (UPI) channel stayed well above the record 400 crore-mark attained last month. Recently, the NPCI International Payments Limited (NIPL) has partnered with PPRO, a global payment provider, to expand global acceptance of UPI and RuPay cards12. Buoyed by the consumption boost during the festival season, credit card spending jumped by 56 per cent (y-o-y) to cross an all-time high of ₹1 lakh crore in October 2021. In a span of 7 months, i.e., between April to October 2021, the payment modes have touched 84 per cent of the total digital payments recorded in 2020-21, indicating fast-paced digital adoption in the country. 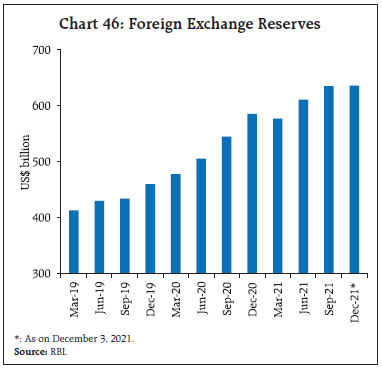
 With the operationalisation of the Payment Infrastructure Development Fund (PIDF) scheme13 from January 1, 2021, the total number of acceptance devices deployed have reached 57.82 lakh, and the corpus stands at ₹614 crore (end-September 2021). More than half of the devices deployed has been in Tier 5 and Tier 6 centres, followed by Tier 3 and Tier 4 centres, the north-eastern states, and the Tier 1 and Tier 2 centres covered under the PM Street Vendor’s AtmaNirbhar Nidhi (PM SVANidhi) scheme14. As a testimony to rising merchant acceptance, the penetration of payment touchpoints can further facilitate efficient digital payments and enhance financial inclusion. Rapid digitisation exhibited during the pandemic has given impetus to the Indian FinTech sector, as corroborated by robust funding momentum and the rise in the number of FinTech unicorns15. In the nine months of 2021, the FinTech sector received investments worth US$ 4.6 billion, nearly thrice the total investments received in 2020 (US$ 1.6 billion)16. In 2021 so far, 8 FinTechs have attained unicorn status (as against 3 in 2020)17. In continuation of its endeavour to leverage on the potential of FinTechs to redefine the digital landscape, the Reserve Bank has launched the first-ever global hackathon event ‘HARBINGER 2021 – Innovation for Transformation’ with the theme of smarter digital payments18. On November 18, 2021, the Reserve Bank released the report of the Working Group on digital lending, including lending through online platforms and mobile apps, to safeguard customer interests and promote development of a safe and ethical digital lending ecosystem19. The report has recommended a verification process for digital lending apps by a nodal agency and a Self-Regulatory Organisation (SRO) covering the participants in the system20. In its developmental and regulatory policies (December 8, 2021), the Bank has proposed to issue a discussion paper on payment charges, identifying issues and measures required to foster affordable digital payments. Furthermore, in order to enhance ease of transactions and promote wider digitalisation, the Bank has proposed to develop a UPI-based payment solution for feature phones; simplify the process flow for small-value UPI transactions through an “on-device” wallet; and increase the UPI transaction limit for the Retail Direct Scheme and initial public offering (IPO) applications from ₹2 lakh to ₹5 lakh. V. Conclusion The Indian economy continues to forge ahead, emerging out of shackles of pandemic. The ongoing revival is driven by a confluence of factors, viz., release of pent-up demand, government’s push for capital expenditure, robust external demand and normal monsoon. Faster resumption of contact-intensive services and speedy restoration of consumer confidence brightens near-term prospects. Going forward, the emergence of the Omicron strain has heightened the uncertainty in the global macroeconomic environment, accelerating risks to global trade with resumption of travel restrictions/quarantine rules at major ports and airports. The ongoing supply-side constraints are likely to keep input prices and freight rates at elevated levels and could act as a drag on overall exports. While the low domestic infection count and healthy pace of vaccinations augurs well for the economy, looming threat of Omicron calls for observing greater caution and readiness to respond swiftly. Box: How Technology can help in Achieving India’ Net Zero Emission (NZE) Target- A Case Study of the Indian Cement Industry India has committed to achieving net-zero emission targets by 2070. It aims to reach half of its energy requirements from renewables and reduce the economy’s carbon intensity by 45 per cent till 2030. This necessitates a policy relook across sectors, especially where carbon emission is high - cement industry is one of them. Globally, cement production contributes around 8 per cent of the world’s anthropogenic CO2 emissions. India is world’s second-largest cement producer and consumer, accounting for over 8 per cent of the global installed capacity in fiscal year 20. India’s cement production is expected to reach 381 million tonnes by 2021-22; whereas consumption may likely be around 379 million tonnes. In the last five years, except for 2018-19, the amount of India’s cement production has exceeded its cement consumption. It runs a trade deficit of more than US$ 2.0 billion in the cement sector (Chart 1a). India’s cement sector is highly competitive, with a large regional presence. Cement sector attracted around 1 per cent (US$5.2 billion) of the total FDI received by India (DPIIT21). With a renewed focus on big infrastructure projects like National Infrastructure Pipeline (with a financial outlay of more than one lakh crore), low-cost housing (Pradhan Mantri Awas Yojana), and the Government’s push for the SMART cities mission are likely to drive demand for cement in future. This commitment towards building high quality infrastructure also poses a risk to India’s commitment to NZE norms. Thus, there is a need to align India’s economic goal with its climate commitments by implementing emerging green tech solutions. A significant amount of CO2 emissions in cement making result from calcination, while the rest comes from burning coal and other fossil fuels (Chart 1b). Studies suggest that capturing the CO2 emissions before it enters the atmosphere and storing it away through reverse calcination is the most effective approach to decarbonise the cement industry (Fenell et al., 2021). Mckinsey (2020) estimates suggest that reverse calcination could sequester up to 5 per cent of cement’s emissions at present, which could be extended to 30 per cent with the improvement in technology. This process can be further enhanced by employing green energy instead of fossil fuels to perform the process of calcination. Biomass such as municipal and industrial waste can be used as an alternative to fossil fuels. India can also look at Fly Ash, Graphene, Natural and Synthetic Fibres as a substitute for cement. The domestic cement industry of India has made a remarkable progress of reducing CO2 emission levels by about 36 per cent from 1.12t/t to 0.719t/t of cement produced between 1996 and 2017. In order to achieve the target of 0.35t CO2/t of cement by 2050, the cement industry requires an investment of US$ 29 billion to US$ 50 billion. 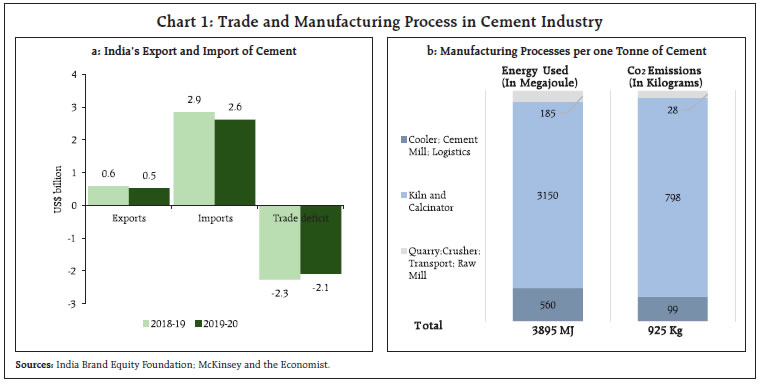 Policy Recommendations • Increase the financing towards green sustainable solutions through subsidised interest loans. • Proactively engage with the leading research institutes/countries involved with green tech-related innovation in the cement industry • Incentivising the cement industry to procure stubble from the northern states of Punjab, Haryana, Uttar Pradesh and Rajasthan as a biomass fuel to execute the process of reverse calcination and pure carbon capture. References: 1. Czigler T., Reiter S., Schulze P., Somers K., 2020. Laying the Foundation for Zero-Carbon Cement. McKinsey & Company Insights. 2. Fennell PS, Davis SJ, Mohammed A, 2021, Decarbonizing cement production, Vol: 5, Pages: 1305-1311, ISSN: 2542-4351. 3. “How cement may yet help slow global warming”, 2021, The Economist, November 6th, 2021 Edition. |
|