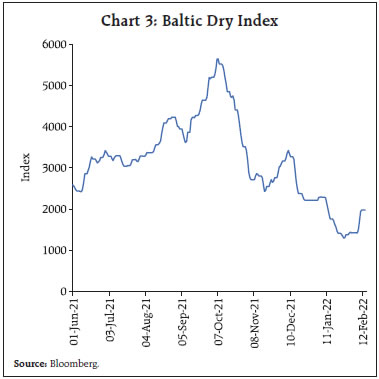
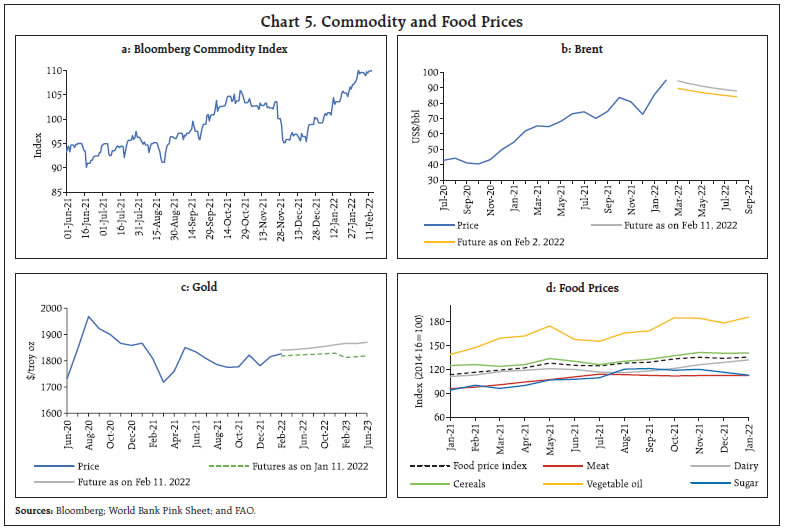
Domestic macroeconomic conditions are striking a path that is diverging from global developments. In India, the recovery in economic activity is gaining strength and traction as it emerges from the third wave. Both manufacturing and services remain in expansion with optimism on demand parameters and uptick in consumer and business confidence. As businesses return to a new normal, the job landscape is expected to improve. Farm sector conditions remain robust albeit with some signs of rural demand slackening. Even as monetary policy remains accommodative, global spillovers have led to a tightening of financial conditions. Introduction Economic activity in India is recouping from a brief spell of moderation in January in view of the less virulent effects of Omicron. Better planning and strategy, management of supply chain logistics and accelerated digitalisation helped firms mitigate pandemic risks. Unlike in the first two waves, overall consumer and business confidence stayed resilient on the back of the accelerated pace of vaccination, better prospects on the general economic situation, household incomes and spending. The vaccination programme that commenced on January 16, 2021 has progressed impressively, with around 95 per cent of the adult population inoculated with the first dose, while 77 per cent have received both the doses. Thus far, 5.24 crore people have been administered with the first dose in the 15-18 year age group. As on February 16, 2022 over 1.79 crore people in the 60 plus age group and frontline workers have been inoculated with precautionary dose. With daily infections and total number of infections on a waning trajectory, India seems to be well past the third wave. In February 2022, mobility indicators have recovered to pre-pandemic levels while unemployment dropped. As businesses return to new normal, hiring activities have gained traction – several Indian firms, global giants and startups have announced massive hiring plans for India1. Buoyant revenue collections under the goods and services tax (GST), robust toll collections and e-way bill generations are all reflective of the ongoing revival. The farm sector remains upbeat on the back of higher minimum support prices (MSPs) announced by the Government. The manufacturing activity remains in expansion with optimism on demand parameters such as production volumes, new orders and job landscape during Q4:2021-22. Firms expect further improvement in capacity utilisation and overall financial situation. Firms in the services sector remained optimistic on demand conditions, while their expectations on overall business situation, turnover and employment conditions have moderated marginally. Set against this backdrop, rest of the article is divided into five sections. The next section encapsulates the evolving global economic and financial market situation. Section III analyses the current developments unfolding in domestic economy. Section IV examines the evolving financial market conditions. The last section sums up the discussion. II. Global Setting The outlook for the global economy is beset with downside risks. Omicron continues to weigh on overall activity as mobility restrictions and containment measures resurface in several jurisdictions. Its mutations are imparting high uncertainty to the future evolution of the pandemic. As an increasing number of central banks watch with alarm ever higher levels of inflation and rush to tighten monetary policy across advanced and emerging market economies (EMEs), the pace of the global recovery is at risk. Financial conditions are tightening as markets brace up for shifts in liquidity and northwards movement in interest rates are triggering wide sell-offs in bond and equity markets as well as in currency markets in the emerging world. Hardening of food and energy prices, along with supply bottlenecks are keeping inflation entrenched and broad-based across economies. Accentuating geopolitical tensions provide another layer of uncertainty to the outlook. In its latest World Economic Outlook (WEO) update, released on January 25, 2022, the International Monetary Fund (IMF) has projected global growth to moderate from 5.9 per cent in 2021 to 4.4 per cent in 2022 – half a percentage point lower than in its October 2020 projection (Table 1). The IMF regards escalating energy prices and supply disruptions as purveyors of elevated inflation, with the prognosis that they would persist for longer than previously envisioned. The global composite purchasing managers’ index (PMI), though still in expansion zone, slipped to an 18-month low of 51.4 in January (Chart 1a). The global services PMI fell to an 18-month low of 51.3 in January from 54.7 in December on account of lower incoming new orders. The global manufacturing PMI also tumbled to a 15-month low of 53.2 in January – down from 54.3 in December – due to weak growth of new work orders, declining international trade volumes, supply chain disruptions and rising COVID-19 infections. Fortuitously, input price pressure and suppliers’ delivery time has eased in January relative to preceding months (Chart 1b). 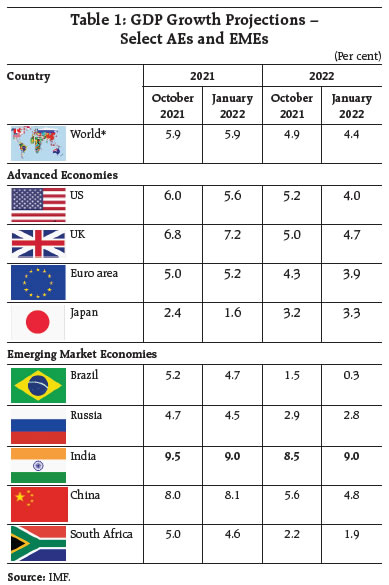 Reflecting the modest easing of supply chain and logistics pressures, the United Nations Conference on Trade and Development (UNCTAD) has nowcast global merchandise and service trade volume to have increased by 2.2 per cent (q-o-q) in Q4:2021, up from 0.2 per cent in the previous quarter. Accordingly, world merchandise trade volume would have grown by 9.1 per cent in 2021. This is also borne out by forecast from the IMF and the CPB Netherlands (Chart 2a and b). The Baltic Dry Index, a measure of shipping charges for dry bulk commodities, in January, plunged to its lowest level since December 2020 (Chart 3). Container freight rates across all major sea routes, however, still rule higher than their pre-pandemic levels (Chart 4a). Freight rates from China to the US west coast ports remained ten times higher than their pre-Covid levels, implying strong demand for goods in the US, supply chain bottlenecks causing higher turnaround time at US ports, and truck shortages (Chart 4b). The Bloomberg commodity price index, which had plummeted in November, began rising again to touch a 7- year high in the first week of February (Chart 5a). Prices rallied across most commodities and starkly so for crude oil, with Brent breaching the US$ 95 per barrel in the beginning of February — the first time since 2014. Geopolitical acrimony in the Middle East and in Central Asia are fueling speculations of supply disruptions, and lending support to crude oil prices (Chart 5b). Gold prices faced safe haven competition from a stronger US dollar although geopolitical tensions continue to provide support to bullion (Chart 5c). The FAO Food Price Index averaged 135.7 points in January 2022, 1.1 percent higher than in December 2021 and largely driven by vegetable oils and dairy sub-indices (Chart 5d). 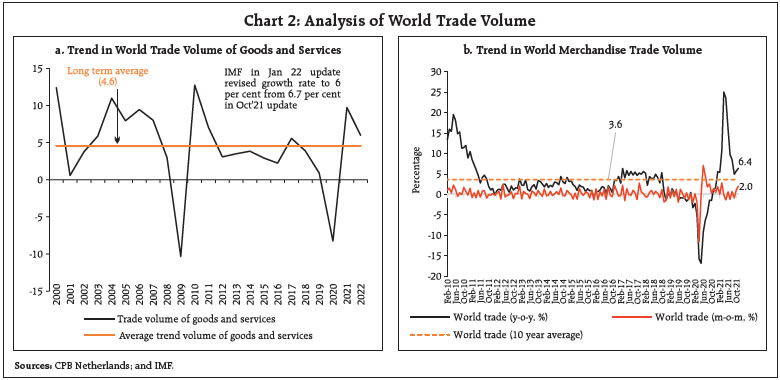
 Inflation has soared to multi-decadal highs in most AEs and a few EMEs (Chart 6). In the US, inflation measured by the y-o-y change in consumer price index (CPI) climbed to 7.5 per cent in January 2022 – its highest level since 1982. Fed’s preferred gauge of inflation measured by personal consumption expenditure (PCE) price index rocketed to 5.8 per cent in December. Concomitantly, core PCE inflation also accelerated to a near 40-year high of 4.9 per cent for the same month. CPI inflation in the UK also surged to 5.4 per cent in December – the highest in the data series, that began in January 1997. Euro area inflation touched a fresh peak of 5.1 per cent in January from 5 per cent in December. Among BRICS economies, CPI inflation in Brazil and Russia edged up further to 10.38 per cent and 8.7 percent, respectively, in January 2022 from 10.06 per cent and 8.4 per cent, respectively, in December 2021. 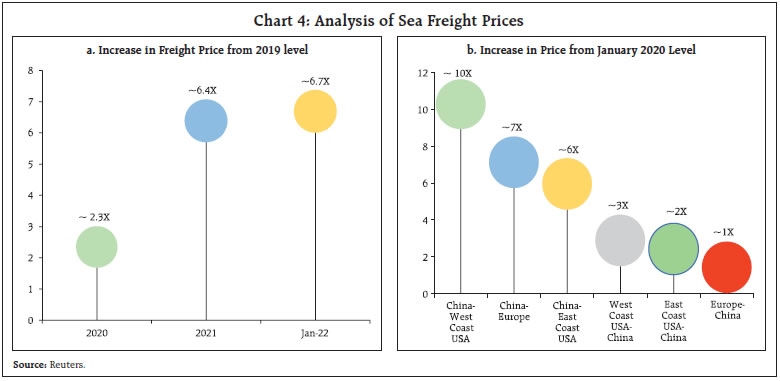
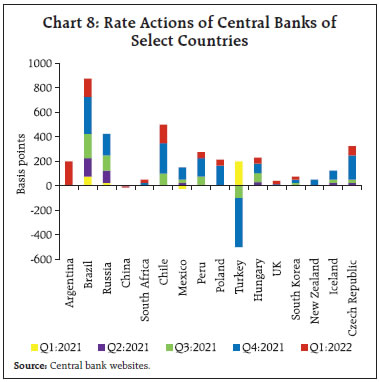
 Global financial markets were unsettled by sharp sell-offs since the beginning of January and investor sentiments have been shaken by the combination of policy pivots, geopolitical tensions and the slowing pace of global growth. In the last week of January, the Morgan Stanley Capital International (MSCI) World Equity Index fell to levels previously seen in October 2021, driven down by both AE and EME stock indices (Chart 7a). In the bond markets, the US 10-year Treasury yield hardened by more than 25 bps since the commencement of the year; these levels were last seen in February 2020. Bond market participants are pricing in more aggressive tightening by systemic central banks than previously anticipated. Furthermore, with short term rates rising even higher a flatter yield curve has emerged (Chart 7b). The US dollar strengthened in the second half of January amidst a flurry of strong economic data and the Fed’s more hawkish stance (Chart 7c). Concomitantly, most EME currencies depreciated, with net capital outflows exacerbating these downward movements (Chart 7d). 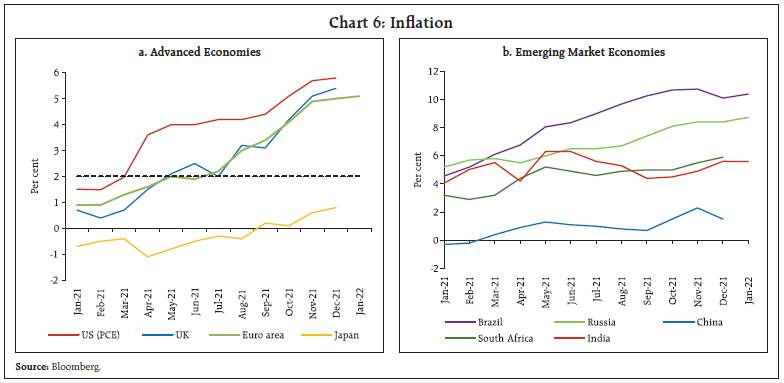 Monetary policy actions and stances continue to deviate across countries, with more AE central banks undertaking or giving forward guidance of rate hikes (Chart 8). In its January meeting, the US Fed announced that it would wind up quantitative easing by early March as scheduled, while also providing forward guidance that it would soon be appropriate to raise the target range for the federal funds rate. It also set out principles for balance sheet reduction. The Bank of England (BoE) effected its second consecutive rate hike in February as it increased its benchmark rate by 25 basis points (bps) to 0.5 per cent, a cumulative increase by 40 bps. The Reserve Bank of Australia maintained its policy rate but announced a halt to its bond purchase programme in early February. The Bank of Japan kept its benchmark rate unchanged while acknowledging a higher inflation forecast. Similarly, the Bank of Canada did not alter its policy rate, but it withdrew its exceptional forward guidance on its policy rate as economic slack got absorbed. The Monetary Authority of Singapore tightened its monetary policy settings for the second time in seven years in its first out-of-cycle move by raising the rate of appreciation for its S$NEER policy band. Among EME central banks, Chile and Brazil hiked their benchmark rates by 150 bps each in January and February, respectively. Bank of Russia raised its key rates for the eighth consecutive meeting by 100 bps to 10.5 per cent in February 2022. Similarly, Hungary, South Africa and Sri Lanka also increased their policy rates by 50 bps, 25 bps and 50 bps, respectively, last month. Indonesia has made a move towards liquidity normalisation by announcing an increase of 300 bps in domestic currency reserve requirement for commercial banks to be implemented in three steps from March to September 2022. Turkey took a pause in its January meeting after a cumulative 500 bps reduction in rates between September and December 2021. The People’s Bank of China cut its 1-year loan prime rate (LPR) for the second consecutive time by 10 bps to 3.7 per cent. It also lowered the 5-year LPR – the benchmark for pricing of mortgages – by 5 bps to 4.6 per cent, its first reduction since April 2020. China also lowered rates on 1-year medium term lending facility loans and 7-day reverse repurchase agreements by 10 bps each. 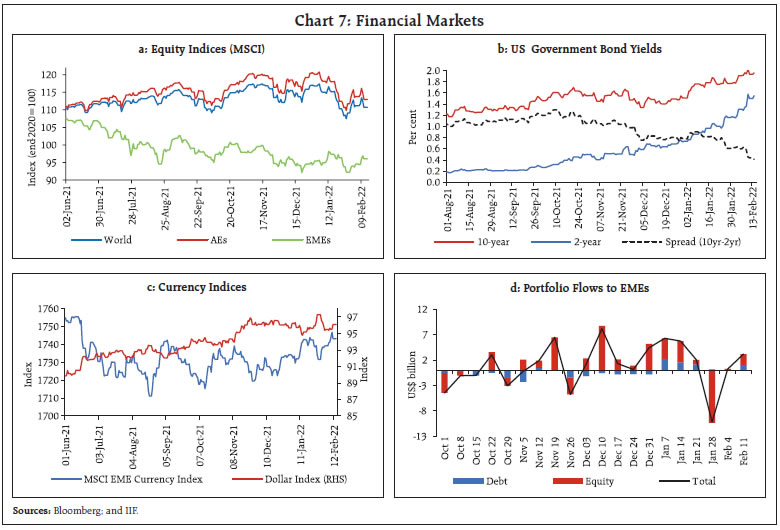
 To sum up, the global economic outlook continues to be held hostage by the pandemic, even as geopolitical face-offs and intensified volatility in financial markets impart uncertainty. Supply chain disruptions, strains in production lines, energy price volatility and wage pressures entail upside risks to inflation, sharpening the policy trade-offs. Risks to EMEs in the form of capital outflows, depreciating currencies, and deteriorating fiscal positions have heightened and darkened the outlook. III. Domestic Developments Domestic macroeconomic conditions are diverging from global configuration. A recovery in economic activity is gaining strength and traction after the slight moderation encountered in the face of the third wave. India’s total active case count surged past 22.36 lakh on January 24, 2022 from a low of 84,349 on December 28, 2021. Daily infections, however, plateaued since January 21, 2022 and declined to 27,409 on February 14, 2022 from a peak of 3.47 lakh on January 20, 2022 (Chart 9a). On the vaccination front, the daily vaccination rate increased to more than 90 lakhs in the first ten days of January but has slowed since then. Currently, while the daily vaccinations stand at around the 50-lakh mark, total vaccinations have crossed 173 crore doses (Chart 9b). In conjunction with the decline in new infections, mobility improved in February 2022, with Google and Apple mobility indices surpassing levels sequentially as well as over a year ago. The Google mobility index for mobility around retail and recreation activities, parks, transit stations and workplaces reached pre-pandemic levels, while the Apple mobility index moved upward across all major cities (Charts 10a and 10b). With the resumption of activity, electricity generation, picked up in the first fortnight of February, surpassing pre-pandemic levels (Chart 10c).
Aggregate Demand In spite of the third wave, e-way bills generation remained above pre-pandemic levels (Chart 11a), although there was a sequential dip in January due to mobility restrictions. Toll collections remained resilient in January 2022, even as the y-o-y growth moderated to 54.8 per cent owing to the waning of base effect (Chart 11b). Petroleum consumption moderated with re-invocation of mobility restrictions. The moderation was recorded across all major categories in January 2022. The consumption of diesel and aviation turbine fuel also declined (Chart 12a). Vehicle registrations continued to decline, led by a drag in the non-transport segment, though the transport segment registered a sequential increase (Chart 12c). Rural demand slumped, with domestic sales of tractors contracting by 32.6 per cent partially owing to an unfavourable base effect. The decline in tractor demand is reported to be attributed to delayed harvest of Kharif crops due to late monsoons. Sales of two wheelers, three wheelers and motorcycles tumbled on both y-o-y and over pre-pandemic levels, owing to a lackluster rural demand, coupled with rising fuel prices (Chart 12d). Within two wheelers, the electric segment continued to post robust growth by over 44 per cent sequentially in January 2022 as online retailers turned to electric two wheelers for logistical operations and last mile deliveries. As per the household survey of the Centre for Monitoring Indian Economy (CMIE), the labour participation rate fell from 40.9 in December 2021 to 39.9 in January 2022 as containment measures increased (Chart 13). As per the CMIE’s employment statistics, the labour market suffered marginally in January 2022 under the impact of the third wave. Though the number of workers employed declined sequentially, there was an expansion in the workforce over a year ago (Chart 14).
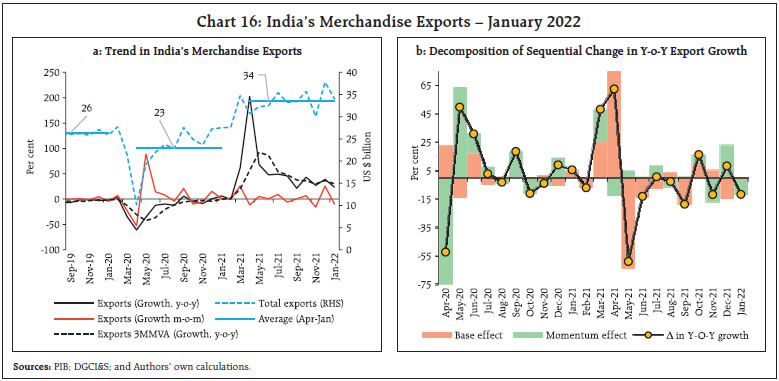
The PMIs show that employment under both manufacturing and services contracted for the second consecutive month after showing expansion in November 2021 (Chart 15). India’s merchandise exports at US$ 34.1 billion in January 2022 registered a robust expansion of 23.7 per cent y-o-y (31.8 per cent over the pre-pandemic level) (Chart 16a and b). During April 2021 – January 2022, the merchandise exports reached US$ 335.4 billion, covering 83.9 per cent of the target set for 2021-22. Export growth was broad-based, with ten major commodity groups accounting for more than 78 per cent of exports recording an expansion above their pre-pandemic level (Table 2). However, decline in export momentum was visible across major categories. The improvement in export performance stemmed from higher value of shipments of engineering goods, chemicals and petroleum products. Pharmaceuticals exports grew by 15.3 per cent over the pre-pandemic level supported by record exports of 309.3 lakh COVID-19 vaccine doses. The engineering goods exports stayed above US$ 9 billion mark for the second consecutive month in January 2022. The Engineering Exports Promotion Council (EEPC) expects exports of heating, ventilation, air-conditioning and refrigeration (HVAC) segment to grow exponentially. Rice, the largest constituent of the agricultural export basket, surged by 35.9 per cent over the pre-pandemic level. 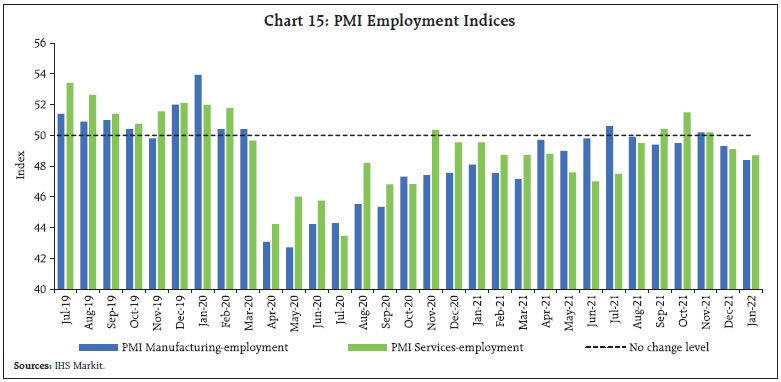
 During April 2021-January 2022, exports of electronic goods accelerated by 26.3 per cent over pre-pandemic levels. The recent policy measures announced in the Union Budget 2022-23 such as calibration of customs duty to promote domestic manufacturing of electronic goods would further bolster electronic export potential. The reduction of customs duty on diamonds and gemstones that was also announced in the Budget may lower the input costs and thus turn our gems and jewellery exports more competitive. The rationalisation of custom duties aims to empower Aatmanirbhar Bharat goals through increasing value-added manufacturing and thereby strengthening India’s participation in global value chains. 
 As per the provisional data released on services trade (February 1), India’s services exports surged rapidly to clock a double-digit growth for the third consecutive quarter in Q3:2021-22, boosted mainly by IT and business services. During April-December 2021, the y-o-y growth in services exports surged well beyond the average growth recorded during preceding 5 years (Chart 17). The latest forecasts of global IT spending by Gartner2 for 2022 and 2023 indicate a buoyant outlook (Chart 18). Furthermore, the OECD’s latest services trade restrictiveness index3 indicates accelerated pace of liberalisation in 2021 relative to 2020. Trade liberalisation in sectors such as computer services by India’s major trading partners, i.e., the US and the UK, may bolster India’s software exports going forward and aid in sustaining the higher growth (Chart 19). Merchandise imports at US$ 52.0 billion in January 2022 rose sharply even though import growth moderated sequentially. Nonetheless, imports remained above the US$ 50 billion mark for the fifth consecutive month (Chart 20a and 20b). Import growth was broad-based, with nine major commodity groups accounting for more than half of imports recording an expansion over their pre-pandemic levels (Table 3). Higher demand for imports of electronic goods, electrical and non-electrical machinery, chemicals and coal drove this expansion. Oil imports, on the other hand, slumped by 12.1 per cent in January 2022 over pre-pandemic levels as restrictions in the wake of Omicron impacted demand. Gold imports witnessed contraction on both y-o-y and sequential basis due to weak demand. The World Gold Council (WGC) expects India’s gold imports to reach 800-850 tonnes level in 2022.
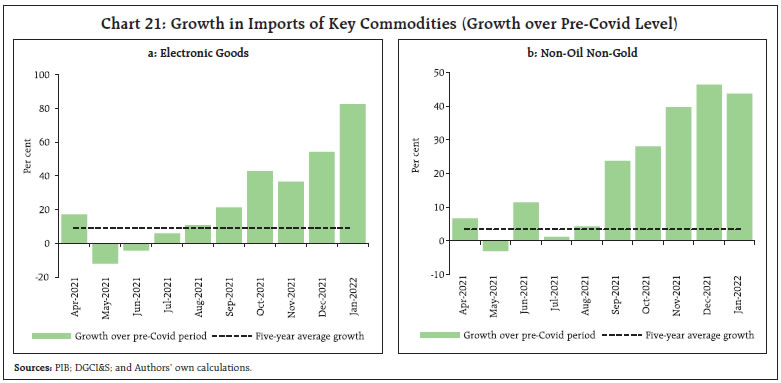
The imports of electronic goods remained at record levels in January 2022 and expanded by 82.6 per cent over pre- pandemic performance (Chart 21a). Overall non-oil non-gold imports maintained strong growth for the eighth consecutive month in January 2022 (Chart 21b). India’s merchandise trade deficit widened to US$ 17.9 billion in January 2022, up from US$ 14.5 billion a year ago and US$ 15.3 billion in January 2020. The Union Budget 2022-23 reiterated the commitment to growth revival through a focus on capital expenditure. Its emphasis on public investment through infrastructure development is expected to crowd-in private investment and strengthen job creation and demand in 2022-23 and beyond. 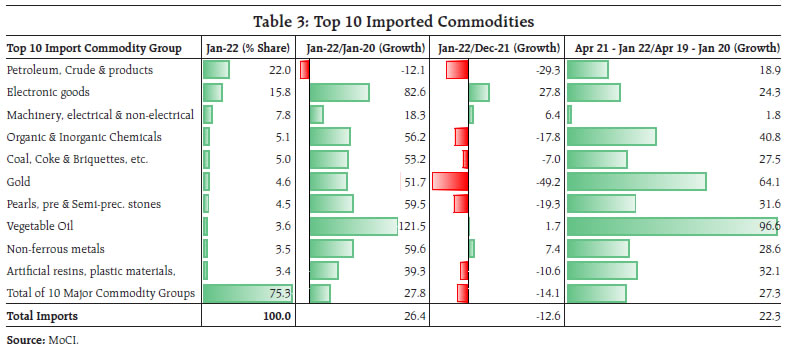
 The gross fiscal deficit (GFD) in 2021-22 (RE) is placed at 6.9 per cent of GDP as against budget estimates (BE) of 6.8 per cent of GDP. Underlying the modest deviation of 0.1 percentage points are sizeable deviations in revenue and expenditure from their budgeted levels. Specifically, net tax revenue of the Union government exceeded the budget estimates (BE) by 0.9 per cent of GDP. Non-tax revenue overshot the BE by 0.3 per cent of GDP, aided by higher than budgeted surplus transfer by the Reserve Bank. In the revised estimates (RE) disinvestment receipts have been brought down by 0.4 per cent of GDP. On the expenditure front, both revenue and capital expenditure have overshot the BE by 1.0 and 0.2 per cent of GDP, respectively. In 2022-23 (BE), the GFD is placed at 6.4 per cent of GDP, a consolidation of 42 basis points over 2021-22 (RE) in line with the medium-term target of bringing GFD below 4.5 per cent by 2024-25. Revenue projections for 2022-23 (BE) are based on realistic assumptions, viz., tax buoyancy of 0.9 and disinvestment receipts of ₹65,000 crore (as against the target of ₹1.75 lakh crore in 2021-22 (BE)). On the expenditure front, the government has placed a major thrust on infrastructure spending. Capital expenditure is budgeted to increase to 2.9 per cent from an average of 1.7 per cent during 2010-20. Effective capital expenditure, which includes capital expenditure of the centre plus grants-in-aid to states for creation of capital assets, is budgeted at 4.1 per cent in 2022-23(BE). The Budget proposals for 2022-23 entail gross market borrowings of ₹14.95 lakh crore, which somewhat exceeded the market expectations, and resulted in the hardening of 10-year G-sec benchmark (6.54 GS 2032) by 15 basis points, recording its largest jump in 12 months (Table 4). After contracting by around 9 per cent in 2020-21, tax devolution to states has recovered sharply in 2021-22 (RE), exceeding the budget estimates for 2021-22. Overall tax devolution grew by 25.2 per cent in 2021-22 (RE) over a year ago and has been budgeted to grow further by 9.6 per cent in 2022-23. In order to give impetus to states’ capital expenditure, the budget has stepped up the outlay for the ‘Scheme for Financial Assistance to States for Capital Investment’ from ₹15,000 crore in 2021-22 (RE) to ₹1 lakh crore in 2022-23 (BE). The y-o-y growth in states’ capital outlay for the period April-November, 2021 stands at a robust 55.2 per cent, with many states registering a growth of over 100 per cent y-o-y. | Table 4: Key Indicators (as per cent of GDP) | | | 2020-21 | 2021-22 | 2022-23 | | Actuals | BE | RE | BE | | 1 | 2 | 3 | 4 | 5 | | 1. Fiscal Deficit | 9.2 | 6.8 | 6.9 | 6.4 | | 2. Revenue Deficit | 7.3 | 5.1 | 4.7 | 3.8 | | 3. Primary Deficit | 5.7 | 3.1 | 3.3 | 2.8 | | 4. Gross Tax Revenue | 10.2 | 9.9 | 10.8 | 10.7 | | 5. Non-Tax Revenue | 1.0 | 1.1 | 1.4 | 1.0 | | 6. Revenue Expenditure | 15.6 | 13.1 | 13.6 | 12.4 | | 7. Capital Expenditure | 2.2 | 2.5 | 2.6 | 2.9 | | of which: | | | | | | Capital Outlay | 1.6 | 2.3 | 2.4 | 2.4 | Note: Capital outlay is capital expenditure less loans and advances.
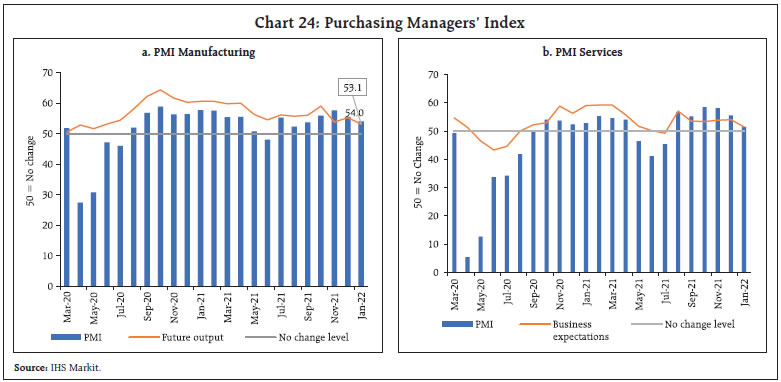
Source: Union Budget Documents. | Aggregate Supply As on February 04, 2022 the overall acreage under rabi crops touched a new record of 700.8 lakh hectares, which is 1.5 per cent above the previous year’s acreage and 8.2 per cent above the normal (5-year average) acreage (Chart 22a). The sowing was spurred by adequate reservoir levels (Chart 22b) and a spatially and temporally well-distributed Northeast (NE) monsoon rainfall. Wheat sowing has recorded a decline from last year mainly due to diversification towards oilseeds and pulses in Haryana, Maharashtra and Gujarat. The share of oilseeds, mainly rapeseed and mustard in total acreage has stepped up from 12.3 per cent (full season normal) to 14.7 per cent. The demand for work under the Mahatma Gandhi National Rural Employment Guarantee Scheme (MGNREGS) has been on decline (y-o-y basis) all through the season, partly reflecting the employment generated by the rabi sowing in the rural hinterlands (Chart 22c). 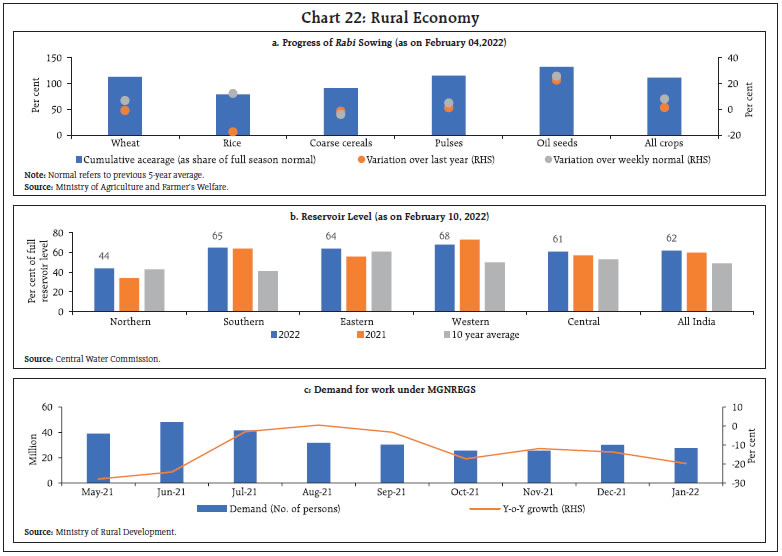 The Zaid crop season (March to May), that extends from the end of the rabi season to the beginning of kharif season, accounts for between 2.9 per cent to 5.1 per cent of net sown area. The increase in zaid acreage in the last couple of years has engaged the attention (Chart 23). As on February 14, 2022, procurement of rice touched 457.5 lakh tonnes (kharif marketing season 2021-22) which is 6.5 higher than a year ago. As per the quarterly buffer norms (January-March) stock levels for both rice and wheat stay comfortable (7.8 and 2.0 times respectively) as of end-January 2022. In the industrial sector, the headline manufacturing PMI remained in expansion at 54.0 in January 2022 even as it decreased from 55.5 a month ago. The sub-indices of new orders and production expanded at a slower pace and output prices picked up. PMI services too remained in expansion mode at 51.5, though it recorded the lowest expansion in the last six months. The business expectations index (BEI) for services expanded for the sixth successive month in January 2022 (Chart 24). 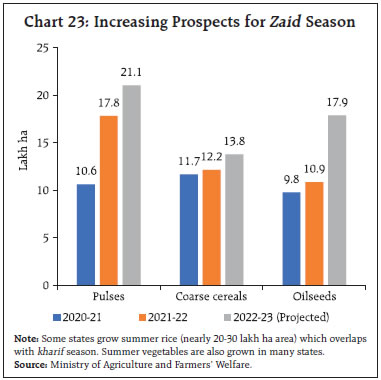
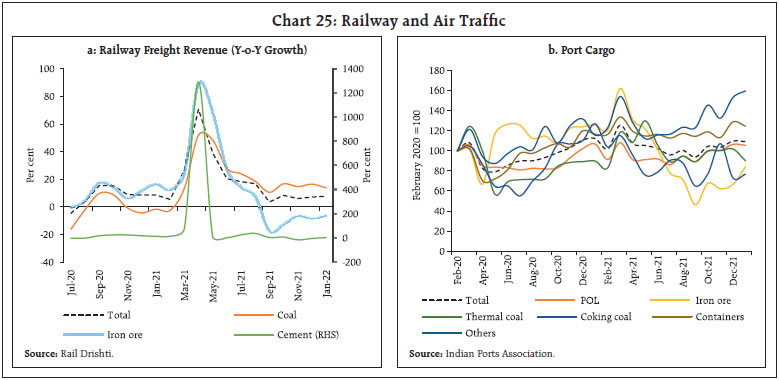 In the services sector, railways freight traffic clocked a growth of 7.7 per cent y-o-y in January 2022 vis-à-vis 8.7 per cent a year ago (Chart 25a). An increase in freight was recorded for coal and cement, even as iron ore registered a decline on a high base. Cumulatively, railway freight traffic improved by 17.1 per cent y-o-y in April-January 2021-22, after recording a contraction for two years. The ‘operating ratio4’ for the railways sector is expected to be above 95 in 2021-22, an improvement over previous years5. As shipping begins to overcome the constraints of container shortages globally, port traffic witnessed a marginal sequential recovery in January (Chart 25b). Both cement production and steel consumption recorded growth over pre-pandemic levels (Chart 26). An improved demand outlook in respect of construction is expected to be matched with capacity additions in the industry, with more than 84 million tonnes (MT) new capacity planned to be added over next two fiscal years. In the first fortnight of February 2022, daily domestic airport footfalls averaged 4.7 lakh per day – a contraction by 5.7 per cent from the corresponding period in January. International airport footfalls also declined by 7.1 per cent sequentially, while the cargo segment recorded a contraction by 1.8 per cent for domestic cargo and a growth of 4.6 per cent for international cargo.
Within the services sector, the contact intensive non-transport segment of the automobile sector and aviation sectors continue to experience a slowdown even as some improvement in trade and transport became evident (Table 5). Inflation Data released by the NSO on February 14, 2022 showed that headline CPI inflation (year-on-year) for the month of January 2022 edged up to 6.0 per cent from 5.7 per cent a month ago (Chart 27a). A month-on-month decline in CPI by around 30 bps was more than offset by a large unfavourable base effect (month-on-month change in prices a year ago) of around 65 bps, resulting in the increase in headline inflation by around 35 bps between December and January. Food group inflation was the main driver, rising 5.6 per cent in January from 4.5 per cent in December. The decline in food price momentum by around 1.1 percentage points was subdued by an unfavourable base effect of around 2.1 percentage points. Vegetables prices moved out of deflation in January. Price increased on a year-on-year basis in respect of cereals, meat and fish, eggs, milk, pulses and spices while inflation in oils and fats, fruits, sugar and confectionary, non-alcoholic beverages and prepared meals and snacks moderated. After remaining in double digits for eight consecutive months, fuel inflation moderated to 9.3 per cent in January from 11.0 per cent in December. LPG and kerosene inflation moderated, and electricity prices continued to remain in deflation in January. CPI fuel (weight of 6.84 per cent in the CPI basket) contributed around 10 per cent of headline inflation in January (Chart 27b). CPI inflation excluding food and fuel6 or core inflation remained elevated at 6.0 per cent in January, though it eased from 6.1 per cent in December (Chart 27a). While inflation in clothing and footwear, and household goods and services edged up, inflation in pan, tobacco and intoxicants, housing, health, transport and communication, recreation and amusement and personal care and effects moderated.
High frequency food price data from the Ministry of Consumer Affairs, Food and Public Distribution (Department of Consumer Affairs) for February so far (February 1-14, 2022) indicate some uptick in prices of cereals. Pulses prices remained largely steady. In the case of edible oils, refined edible oils like sunflower oil continued to experience price declines, on the other hand, prices of mustard oil and vanaspati edged up. Prices of tomatoes and potatoes witnessed further seasonal price correction, while onion prices have remained steady in February so far (Chart 28). In February so far (February 1-14, 2022), retail selling prices of petrol and diesel in the four major metros remained unchanged. While LPG prices remained steady, kerosene prices registered an increase in the first half of February (Table 6). Input costs rose further in January, across manufacturing and services, as reflected in the PMIs, with services seeing a more pronounced rate of increase. Selling price increases, however, remained muted across manufacturing and services in January. | Table 6: Petroleum Products Prices | | Item | Unit | Domestic Prices | Month-over-month (per cent) | | Feb-21 | Jan-22 | Feb-22^ | Jan-22 | Feb-22 | | Petrol | ₹/litre | 91.26 | 102.87 | 102.87 | -0.1 | 0.0 | | Diesel | ₹/litre | 82.99 | 90.51 | 90.51 | 0.0 | 0.0 | | Kerosene (subsidised) | ₹/litre | 27.36 | 36.56 | 42.17* | -5.5 | 15.4 | | LPG (non-subsidised) | ₹/cylinder | 771.29# | 910.13 | 910.13 | 0.0 | 0.0 | ^: For the period February 1-14, 2022. *: As on February 2, 2022.
#: Average price in February 2021.
Note: Other than kerosene, prices represent the average Indian Oil Corporation Limited (IOCL) prices in four major metros (Delhi, Kolkata, Mumbai and Chennai). For kerosene, prices denote the average of the subsidized prices in Kolkata, Mumbai and Chennai.
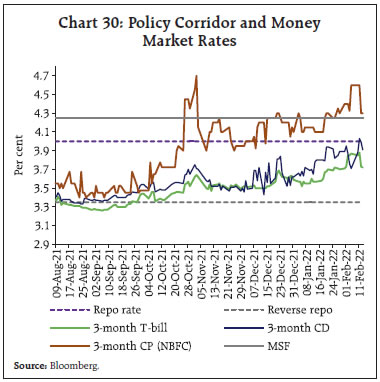
Sources: IOCL; Petroleum Planning and Analysis Cell (PPAC); and RBI staff estimates. | IV. Financial Conditions Domestic financial conditions remain benign although there has been some tightening more recently. In its monetary policy statement on February 10, 2022, the Reserve Bank announced four decisions to restore the revised liquidity management framework in order to make it more flexible and agile: (i) variable rate repo operations of varying tenors to be conducted as and when warranted by the evolving liquidity and financial conditions within the cash reserve ratio (CRR) maintenance cycle; (ii) variable rate repos (VRRs) and variable rate reverse repos (VRRRs) of 14-day tenor to operate as the main liquidity management tool and to be conducted to coincide with the CRR maintenance cycle; (iii) main operations to be supported by fine-tuning operations to tide over any unanticipated liquidity changes during the reserve maintenance period and auctions of longer maturity to be conducted as warranted; and (iv) with effect from March 1, 2022, the fixed rate reverse repo and the marginal standing facility (MSF) operations to be available only during 17.30-23.59 hours on all days and not during 09.00-23.59 hours, as instituted from March 30, 2020 to deal with the pandemic situation. In view of Omicron-related infections and disruption, on-tap liquidity facilities of ₹50,000 crore and ₹15,000 crore for emergency health services and contact-intensive sectors, respectively, were extended from March 31, 2022 to June 30, 2022. Surplus liquidity in the banking system moderated, with daily net liquidity absorption under the LAF averaging ₹6.4 lakh crore in the second half of January through February 14, 2022, lower than ₹7.0 lakh crore during December 2021 to mid-January 2022. Liquidity rebalancing continued, with surplus liquidity migrating from the overnight fixed rate reverse repo window to VRRR auctions of various maturities, including the main 14-day VRRR operation, in a seamless and non-disruptive manner. Consequently, the average daily absorption under the fixed rate reverse repo window moderated to ₹1.4 lakh crore during the second fortnight of January through February 14, 2022 from ₹1.5 lakh crore during mid-December 2021 to mid-January 2022. In view of transient tightness in systemic liquidity due to higher than anticipated GST collections, the Reserve Bank conducted three VRR operations – one auction of ₹50,000 crore on January 20, and two auctions of ₹75,000 crore each on January 21 and January 24, 2022, respectively. GST outflows in the latter part of January 2022 pulled the overnight money market rates above the policy repo rate. In the uncollateralised segment, the weighted average call rate (WACR) touched the policy repo rate while the collateralised rates – the tri-party repo and the market repo rate – reached the ceiling of the interest rate corridor (marginal standing facility rate) briefly. This transient tightness eased with liquidity injections through the variable rate repo operations and large government spending towards the end of January (Chart 29). The use of fine-tuning operations to tide over unanticipated liquidity mismatches demonstrated the inherent flexibility of the revised liquidity management framework in coping with evolving liquidity requirements. Interest rates rose across the outer term money market segment. The 3-month T-bill rate and certificates of deposit (CD) rate were pulled up towards the policy repo rate, notwithstanding softer overnight rates. At the same time, the 3-month commercial paper (CP)-NBFC rate traded above the policy repo rate, reflecting large issuances (Chart 30). The gradual enhancement in the size of absorption through the VRRR at higher cut offs has nudged short term rates upwards. Bond yields hardened, with the yield on the newly issued 10-year G-sec benchmark (6.54 GS 2032) closing at 6.67 per cent as on February 14, 2022 (Chart 31a). The yield curve remained steady, but with a sharp rise in 8-10 year maturities (Chart 31b). While the conduct of switch operations for government securities and oil bonds worth ₹1.2 lakh crore provided temporary respite, the yields hardened sharply with the announcements in the Union Budget 2022-23 translating into higher than expected central government market borrowing of ₹14.95 lakh crore which rattled market sentiment. The resultant sell-off pushed up the 10-year benchmark yield by almost 15 bps with the Budget day ending at 6.83 per cent. On the global front, the faster pace of policy normalisation signalled by the US Fed, elevated crude oil prices amidst rising geopolitical tensions and domestic bond market concerns on the size of the market borrowing programme ahead of the Union Budget 2022-23, contributed to the hardening of G-sec yields. Yields, however, softened thereafter following the announcement of monetary policy on February 10, 2022 and cancellation of the auction of securities scheduled to be held on February 11, 2022 and further on February 18, 2022. In the primary market, all weekly auctions conducted during January 2022 witnessed partial devolvement. Subsequently, the Reserve Bank did not accept any bids for 5 year and 14 year securities in the weekly auction conducted on February 4, 2022. 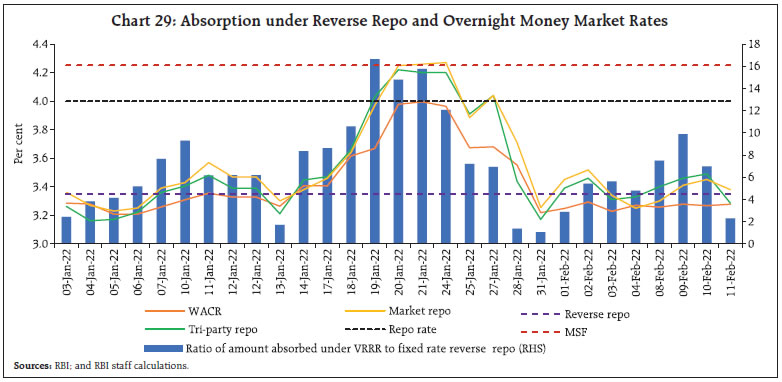
 In tandem with G-sec yields, yields on corporate bonds exhibited a hardening bias, albeit, to a lesser extent than the risk-free (G-sec) rate (Table 7). Consequently, the risk premia (corporate bond spreads over G-sec of comparable maturities) remained unchanged or rose at the margin during February 2022 (up to Feb 10) from a month ago. Lower issuance of corporate bonds during 2021-22 has capped the upward pressure on yields. 
| Table 7: Financial Markets - Rates and Spread | | Instrument | Interest Rates
(Per cent) | Spread (bps)
(Over corresponding risk-free rate) | | Jan 2022 | Feb 2022 (up to Feb 10) | Variation (in bps) | Jan 2022 | Feb 2022 (up to Feb 10) | Variation (in bps) | | 1 | 2 | 3 | (4 = 3-2) | 5 | 6 | (7 = 6-5) | | Corporate Bonds | | | | | | | | (i) AAA (1-year) | 4.65 | 4.82 | 17 | 14 | 12 | -2 | | (ii) AAA (3-year) | 5.61 | 5.82 | 21 | 12 | 18 | 6 | | (iii) AAA (5-year) | 6.07 | 6.23 | 16 | -17 | -16 | 1 | | (iv) AA (3-year) | 6.40 | 6.57 | 17 | 91 | 93 | 2 | | (v) BBB-minus (3-year) | 10.41 | 10.22 | 8 | 458 | 458 | 0 | | 10-year G-sec | 6.41 | 6.73 | 32 | | | | Note: Yields and spreads are computed as monthly averages.
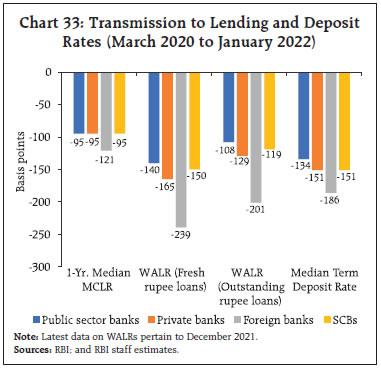
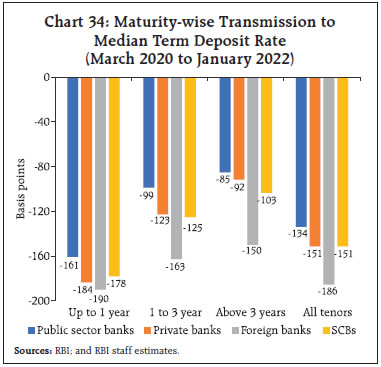
Sources: Fixed Income Money Market and Derivatives Association of India (FIMMDA); and Bloomberg. | Overall monetary and credit conditions evolved in sync with the Reserve Bank’s accommodative policy stance. Reserve money (RM), excluding the first-round impact of the cash reserve ratio (CRR) restoration, grew at 8.4 per cent y-o-y as on February 4, 2022 (18.9 per cent a year ago) with the currency in circulation, the largest constituent of RM, rising at a similar pace (8.2 per cent; 20.8 per cent a year ago). Money supply (M3) also expanded by 8.4 per cent as on January 28, 2022 (12.1 per cent a year ago), primarily reflecting growth in banks’ aggregate deposits at 8.3 per cent (10.5 per cent a year ago). The growth in scheduled commercial banks’ (SCBs’) credit to the commercial sector, which rose above the 7 per cent mark in November 2021 for the first time since April 2020, stood at 8.2 per cent as on January 28, 2022 (much above the 5.9 per cent level a year ago) [Chart 32]. SCBs continue to price new loans at historically low rates, mirroring improved transmission during the current easing phase. Testifying to the effectiveness of the Reserve Bank’s policy measures, SCBs have effected complete pass-through of the policy rate cuts of 115 bps to weighted average lending rate (WALR) on fresh rupee loans as well as outstanding loans since March 2020. During March 2020 through January 2022, the one-year median marginal cost of funds-based lending rate (MCLR) declined by 95 bps (Chart 33). The improved monetary transmission has resulted in lower cost of borrowings for many sectors, including for major non-banking financial companies (NBFCs) sector. The median term deposit rate (MTDR) moderated by 151 bps during March 2020 to January 2022 on account of surplus liquidity. The perceptible decline of 178 bps is particularly discernible for shorter tenor deposits of maturity of up to one year. Across domestic banks, private banks have effected higher pass-through to term deposit rates than public sector banks (PSBs) on account of robust deposit growth (Chart 34). However, SCBs have reached an inflection point. With an increase in credit demand and lower accretion in aggregate deposits, banks have started pricing in their deposits at higher rates in recent months. As a result, the MTDR rose marginally by 5 bps since October 2021. 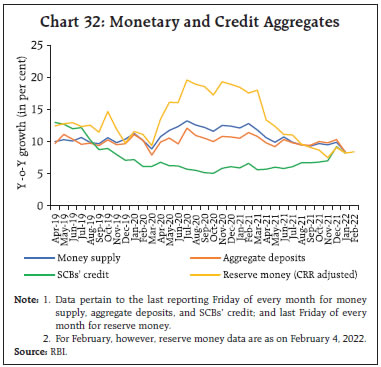
 Indian equity markets experienced high volatility in the month of January 2022 amidst risk-off sentiments sparked by the prospects of early tightening of monetary policy by the US Fed (Chart 35a). Equity markets in major economies, recorded larger declines, with investors turning cautious towards the technology sector (Chart 35b). After opening the month on a positive note, the BSE Sensex turned volatile on rising number of Omicron cases and the hawkish tone in the minutes of the latest US Federal Open Market Committee (FOMC) meeting. Thereafter, the market bounced back on expectations of robust Q3:2021-22 corporate earnings results and expectations of a limited economic impact of Omicron. The rally, however, proved transient as investors fretted over rising global inflation, US Treasury yields, and crude oil prices coupled with the geopolitical tensions between Russia and Ukraine. In early February, the equity markets rebounded on prospects of announcements in the Union Budget with positive global cues aiding the domestic sentiment. Sharp swings followed thereafter, mostly tracking global cues. The markets tumbled on February 14, 2022 on escalating geopolitical tensions but recovered almost entirely on the following day amid de-escalation of concerns. Overall, the BSE Sensex declined by 0.2 per cent during 2022 so far – a decline of 0.4 per cent during January 2022, and a gain of 0.2 per cent during February 2022 (up to February 15, 2022). The BSE IPO index, which tracks the performance of recently listed initial public offering (IPO) stocks, underperformed the market benchmark, declining by 13.8 per cent during 2022 so far (up to February 15, 2022). 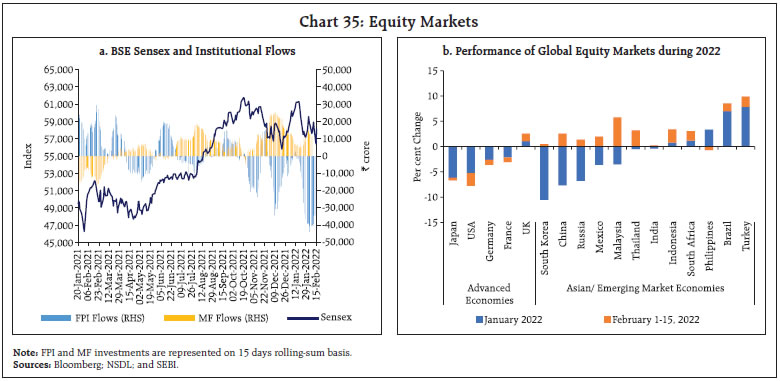 Corporate earnings results of 1,273 listed non-financial companies representing 80 per cent of market capitalisation of all listed non-financial companies, show double-digit y-o-y sales growth during Q3:2021-22 (Chart 36). High performance sectors in terms of sales growth were hotels and tourism, oil and gas, metals and mining, textiles, chemicals, machinery, consumer durables and information technology (IT). Input cost pressures impacted the profitability of a few sectors. During April-December 2021, gross inward foreign direct investment (FDI) moderated to US$ 60.3 billion from its level US$ 68.3 billion a year ago (Chart 37). Manufacturing, computer services, communication services, retail and wholesale trade and education, research and development are the sectors that attracted most of the investment. Net outward FDI from India turned out to be higher on a y-o-y basis. Foreign portfolio investors (FPIs) continued to pull their investment out of the domestic equity market during January 2022 amidst global geopolitical tensions, rising crude oil prices and concerns over aggressive policy normalisation in the US. The debt segment, however, recorded modest inflows during the month (Chart 38).
Net disbursements of external commercial borrowings (ECBs) to India, including inter-company borrowings, were to the tune of US$ 6.6 billion during April-December 2021 as compared with net outflows of US$ 2.6 billion a year ago, while net disbursements excluding repayments and inter-company borrowings were of the order of US$ 3.6 billion as against net repayments of US$ 5.9 billion a year ago. In December, a considerable amount of borrowing was channelised for on-lending/sub-lending, refinancing of earlier ECBs and refinancing of rupee loans. The foreign exchange reserves were at US$ 632.0 billion on February 4, 2022 equivalent to about 12.6 months of imports projected for 2021-22 (Chart 39). In the foreign exchange market, the Indian rupee (INR) appreciated against the US dollar in January 2022 by 1.3 per cent (m-o-m). In both nominal and real effective terms (40-currency basket), the INR appreciated by 1.1 and 0.1 per cent, respectively, over its level a month ago (Chart 40a and 40b).
Payment Systems The year 2022 has begun with a strong rally in digital payments in the first month, with wholesale and retail transactions exhibiting consistent growth (y-o-y) on the top of remarkable milestones achieved in the previous year. On the large value payments front, transaction volume through the Real Time Gross Settlement (RTGS) sustained double-digit growth in January 2022 (Table 8). In the retail segment, UPI transactions nearly doubled in terms of both volume and value relative to January 2021. The Bharat Bill Payment System (BBPS) - a one-stop ecosystem for recurring bill payments, mirrored this trend. With efforts to reach the hitherto unreached in the payments space bearing fruit, the Aadhar-enabled Payments System (AePS) achieved its highest number of transactions ever this month. Recent evidence suggests that the digital divide across geographies, sectors and businesses may have narrowed over the year gone by, with online transaction volumes from Tier 2 and 3 cities on a private payment gateway during 2021 demonstrating growth of 45.6 per cent and 54.3 per cent respectively.7 Overall, the highest growth stemmed from the food and beverages sector, followed closely by financial services. Games, utilities and e-commerce were also prominent drivers of digital payments growth. Furthermore, strong growth was recorded in the wholesale e-commerce segment over the year. 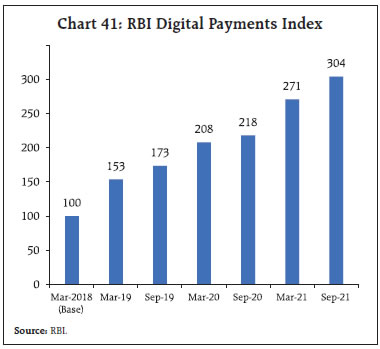 The Reserve Bank’s Digital Payments Index8 climbed to 304 in September 2021 (Chart 41), reflecting the rapid growth in digital payments. There has been rapid penetration of digital technology and smartphones since the outbreak of the pandemic, with the number of wireless internet subscribers reaching 77.7 crore9, and the average time spent on mobile per day per Indian user jumping from 3.7 hours in 2019 to 4.7 hours in 202110 (fifth highest among the countries analysed). The continuous expansion of the app economy is expected to lead to sustained growth in the digital payments ecosystem. According to NASSCOM, digital payments volume in India may surge by 16 times over the five years spanning up to 2025.11 In the Statement on Developmental and Regulatory Policies12, the Reserve Bank has announced the enhancement of the amount cap on e-RUPI vouchers issued by governments from ₹10,000 to ₹1,00,000, which will further facilitate digital delivery of government benefits and services. The cap on the National Automated Clearing House (NACH) mandate limit – a solution facilitating repetitive and periodic payments – for settlements on the Trade Receivables Discounting System (TReDS) is also proposed to be raised from ₹1 crore to ₹3 crore. This will help cater to the growing liquidity requirements of micro, small and medium enterprises (MSMEs). The Union Budget 2022-23 has proposed various measures to promote the digital and FinTech ecosystem, including the setting up of digital banking units, the continuation of financial support to incentivise digital modes of payment and relaxations in the tax incentive scheme for start-ups. Conclusion Today global economy stands at an inflection point. Inflation has become entrenched across economies owing to a spike in commodity prices and persistence of supply chain bottlenecks. The global macroeconomic situation remains embroiled in a heightened state of uncertainty, with risks tilted to the downside. The Goldman Sachs Financial Conditions Index - a composite index including interest rates, equity valuations, borrowing costs and currency data - shows significant tightening of financial conditions especially for the emerging market economies (Chart 42). Investor sentiment has been dampened by risk aversion, which could unsettle capital flows and impede the embryonic recovery going forward. Notwithstanding this unsettled global environment, the domestic economic situation continues to improve. The Union Budget 2022-23 and the monetary policy announcement of February 10, 2022 have set the tone for a durable and broad-based revival. The renewed emphasis on public investment through infrastructure development is expected to crowd-in private investment and strengthen job creation and demand in 2022-23. Fundamental to the infrastructure boost is the GatiShakti national master plan, which aims to achieve inclusive growth through multi-modal connectivity and logistics efficiency. With inflation projected to stay within the tolerance band in 2022-23, the Monetary Policy Committee (MPC) decided to pause and persevere with an accommodative policy stance. Governor Shri Shaktikanta Das emphasised that monetary policy would continue in its endeavour to achieve price stability, while ensuring a strong and sustained economic recovery13. Higher spending and ease of doing business have brightened the outlook. India has once again emerged as the fastest growing economy among the major economies of the world according to the IMF.
|