The Budget for 2022-23 calibrates a thrust to growth with feasible rectitude, reflected in a moderation in the cyclically adjusted fiscal deficit. Even so, a net fiscal impulse of 0.3 per cent of GDP will continue to operate till the end of 2022-23. The strategy of building in of sufficient buffers will help to secure the budgetary targets set for 2022-23 and create headroom for dealing with global spillovers. Going forward, debt reduction needs to assume prominence in the fiscal policy strategy. Introduction The Finance Minister’s budget speech and the presentation of the Union Budget in the Parliament is always a defining moment in the evolution of the Indian economy and provides a pivot for the macroeconomic and financial outlook. The Union Budget for 2022-23 is noteworthy in its drive to blend a thrust to growth with a renewal of fiscal consolidation. The overarching theme is to place the recovery from the pandemic on a solid footing. The Budget also sets out a long-term vision for the next 25 years when India reaches 100 years of independence. In 1981, a seminal paper presented some ‘unpleasant monetarist arithmetic’ (Sargent and Wallace, 1981) to argue that there is a loss of macro economic stability under fiscal dominance. By contrast, the Budget 2022-23 centre stages fiscal consolidation with some ‘pleasant’ fiscal arithmetic – growth in revenue expenditure is budgeted at 0.9 per cent in 2022-23 vis-à-vis an average growth of 12.0 per cent during 2000-01 to 2019-20 – while imparting a capex push to boost growth. With the dying down of the myopic reactions of financial markets, a more informed commentary on the budget is making its way into public debate. This commentary has been, in the net, appreciative of the budget, citing three main overarching factors: realism in assumptions and projections; transparency in budget accounting [elimination of extra-budgetary resource (EBR) route and discontinuation of National Small Savings Fund (NSSF) loans to the Food Corporation of India (FCI)]; and a growth orientation conditioned by prudence. This enhances the credibility of the Budget. To this informed discourse can be added the strategy of building in of buffers at various levels, equipping the fiscal authority to deal with future shocks and ensuring achievement of budgetary targets for 2022-23. The rest of the article is divided into six sections. The following section explores the underlying plumbing of the Budget. Sections III and IV discuss the analytics of the budgeted receipts and expenditure, respectively. Section V examines issues in financing and sustainability of the outstanding debt. Section VI sets out some concluding remarks. II. Fiscal Deficit – Underlying Dynamics The gross fiscal deficit (GFD), a summary measure of the fiscal stance, is projected to decline by 2.7 percentage points of GDP1 over a span of two years in a graduated rollback of the large fiscal stimulus provided to mitigate the impact of the pandemic. In 2021-22 (RE), net tax revenue of the Union government exceeded the budget estimates (BE) by ₹2.2 lakh crore and non-tax revenue was higher than the BE by ₹70,763 crore, the latter aided by higher than budgeted surplus transfers by the Reserve Bank. On the other hand, higher spending in the wake of the second wave of the pandemic (revenue and capital expenditure surpassed the BE by ₹2.38 lakh crore and ₹48,475 crore, respectively) and shortfalls in disinvestment receipts by ₹97,000 crore contributed to a slender slippage of 0.1 percentage points in the GFD-GDP ratio (Charts 1a and b). 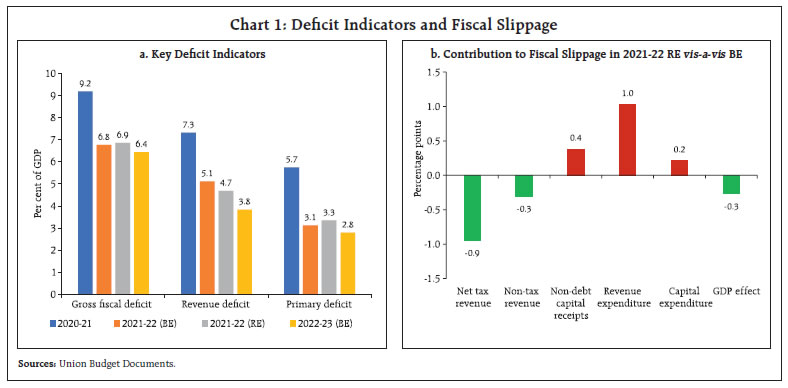 The headline fiscal deficit is typically determined on the one hand by the underlying economic cycle over which the budgeteer has little control, and on the other by discrete policy interventions to achieve broader macro objectives. Accordingly, the gross fiscal deficit can be decomposed into two parts: the cyclical component related to the business cycle (automatic stabilisers like tax revenue and unemployment benefits) and the structural component, reflecting the impact of discretionary changes in fiscal policy independent of the economic environment. The first difference of the cyclically adjusted primary deficit is termed as the fiscal impulse, a measure of the extent to which fiscal policy is adding to or withdrawing demand. The elasticity of revenue/ expenditure with respect to the output gap – the deviation of actual output from potential output2 – defines the strength of the cyclical effect3. In India, it is tax revenues that display cyclicality. Non-tax revenues and non-debt capital receipts (comprising recovery of loans/advances and disinvestment receipts) are impervious to the business cycle. Revenue elasticity is estimated at 1.5, implying that tax revenues respond more than proportionately to the output gap. In the absence of expenditure-related automatic stabilisers (unlike advanced countries where unemployment benefits are directly linked to the business cycle), expenditure elasticity can be assumed to be zero, i.e., all expenditure is viewed as discretionary. Using these elasticities, the cyclically adjusted GFD is estimated at 5.7 per cent in 2022-23 (BE), down from 5.8 per cent in 2021-22 (RE) and 7.8 per cent in 2020-214. Thus, there is a moderation in the cyclically adjusted fiscal deficit of the order of 2.2 percentage points in two years (more than three-fourths of the corresponding reduction in the unadjusted and widely known gross fiscal deficit), which indicates resolute strategic actions by the budgeteer to secure genuine consolidation. Even so, a net fiscal impulse of 0.3 per cent of GDP will continue to operate till the end of 2022-235 (Charts 2a and b). 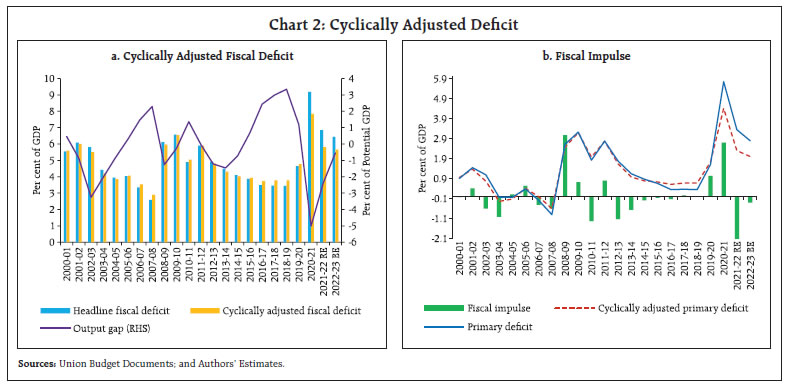 III. Receipts The revised estimates for 2021-22 place the growth of gross tax revenue at 24.1 per cent (Annex 1). During April-December 2021, however, a year-on-year (y-o-y) growth of 44.2 per cent has already been achieved, implying that gross tax revenue should decline by 14.8 per cent in Q4:2021-226 (Chart 3)! The historical record indicates that a significant proportion of tax revenue (33.2 per cent on average, with a y-o-y growth of 12.0 per cent) is received in the last quarter. This provides the confidence that the RE for 2021-22 is likely to be over-achieved. 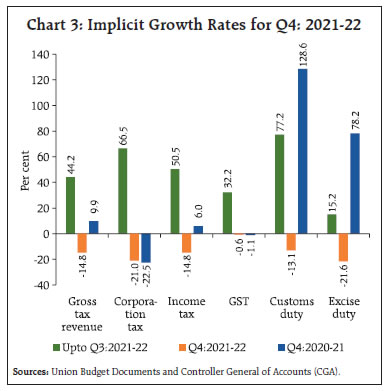
| Table 1: Tax Buoyancy | | | Average Tax Buoyancy
(2010-11 to 2018-19) | 2021-22 (BE) | 2021-22 (RE) | 2022-23 (BE) | | 1 | 2 | 3 | 4 | 5 | | 1. Gross Tax Revenue | 1.11 | 1.33 | 1.40 | 0.86 | | 2. Direct Taxes | 1.03 | 1.79 | 1.87 | 1.22 | | (i) Corporation Tax | 0.92 | 1.80 | 2.25 | 1.20 | | (ii) Income Tax | 1.27 | 1.81 | 1.54 | 1.28 | | 3. Indirect Taxes | 1.25 | 0.91 | 0.99 | 0.51 | | (i) GST | - | 1.78 | 1.33 | 1.40 | | (ii) Customs Duty | 0.31 | 1.71 | 2.34 | 1.14 | | (iii) Excise Duty | 0.91 | -0.57 | 0.03 | -1.34 | Note: Buoyancy for 2021-22 (BE) is calculated over 2020-21 (RE)
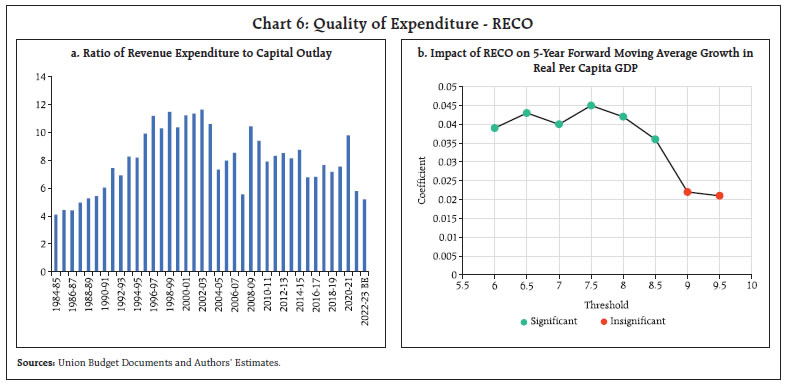
Source: Authors’ calculations based on Union Budget Documents for various years. | In 2022-23 (BE), the government has budgeted gross tax revenue buoyancy7 at 0.9 as against the average of 1.4 in the years of economic recovery8. Direct and indirect tax buoyancies have been budgeted at 1.2 and 0.5, as against the average of 1.7 and 1.3, respectively, in recovery years9. Moreover, buoyancies in 2022-23 are based on a nominal GDP growth assumption of 11.1 per cent, which will most likely be exceeded (Table 1). In 2021-22 (RE), disinvestment receipts are placed at ₹78,000 crore, 55.4 per cent short of the budgeted target of ₹1.75 lakh crore. Of this, only ₹12,068 crore have been realised until January 2022. In 2022-23 (BE), the disinvestment target has been pegged at ₹65,000 crore, against an average realisation of around ₹66,000 crore during 2016-17 to 2020-21 (Chart 4). IV. Expenditure Total expenditure is budgeted to increase by 4.6 per cent in 2022-23 as against 7.4 per cent a year ago. This fiscal brake is, however, not at the cost of the quality of expenditure. Revenue expenditure is budgeted to grow by only 0.9 per cent, while the growth in capital expenditure is budgeted at 24.5 per cent (Table 2). Under capital expenditure, an amount of ₹1 lakh crore has been earmarked to provide 50-year interest-free loans to States for carrying out PM Gati Shakti related capital investment, supplemental funding for priority segments of PM Gram Sadak Yojana, including support for the States’ share, digitisation of the economy and other productive capital investment10. Capital outlay (capital expenditure less loans and advances) is budgeted to increase by 11.5 per cent in 2022-23, on top of a growth of 73.3 per cent in 2021-22 (RE), led by robust growth in infrastructure spending, particularly roads and railways. | Table 2: Capital Expenditure | | | ₹ crore | Y-o-Y growth | | 2020-21 | 2021-22 (RE) | 2022-23 (BE) | 2021-22 (RE) | 2022-23 (BE) | | 1. Capital Expenditure (2+3) | 4,26,317 | 6,02,711 | 7,50,246 | 41.4 | 24.5 | | 2. Capital Outlay (of which): | 3,15,826 | 5,47,457 | 6,10,189 | 73.3 | 11.5 | | 2.1.1 Major Infrastructure (of which): | 1,30,496 | 3,02,504 | 3,73,440 | 131.8 | 23.4 | | Irrigation | 133 | 170 | 350 | 28.1 | 105.4 | | Indian Railways | 29,926 | 1,17,100 | 1,37,100 | 291.3 | 17.1 | | Roads & Bridges | 92,294 | 1,13,876 | 1,80,301 | 23.4 | 58.3 | | Communications | 4,929 | 5,525 | 53,651 | 12.1 | 871.0 | | 2.1.2 Industry and Minerals | 5,212 | 6,597 | 7,676 | 26.6 | 16.4 | | 2.1.3 Science, Technology and Environment | 6,029 | 9,421 | 10,535 | 56.3 | 11.8 | | 3. Loans and Advances (of which): | 1,10,491 | 55,255 | 1,40,057 | -50.0 | 153.5 | | 3.1 Loans to State Governments | 19,554 | 20,819 | 1,11,902 | 6.5 | 437.5 | | Source: Union Budget Documents. | The budgeted outlay for capital expenditure will release an additional investment of ₹1.48 lakh crore in 2022-23 (BE) vis-a-vis 2021-22 (RE). With a dynamic capital expenditure multiplier cumulating to 2.45 in 2023-24, 3.14 in 2024-25 and peaking in 2025-26 at 3.2511, GDP growth will be pushed up by an additional 1.4 - 1.9 percentage points from 2023-24 to 2025-26. In other words, the additional investment of ₹1.48 lakh crore will produce additional GDP of ₹2.8 lakh crore in real terms or in constant prices over the four-year period that it takes for the capital expenditure multiplier to peak. At current prices, the additional GDP produced will be ₹4.8 lakh crore over the next four years (Chart 5). The effects of revenue and capital expenditure on economic activity vary in magnitude and duration. While revenue expenditure plays an important role in supporting demand, its effect withers out in a year. On the other hand, capital expenditure produces stronger and longer-lasting macroeconomic impulses, peaking in three years. The ratio of revenue expenditure to capital outlay (RECO) serves as a good indicator of the growth impact of public expenditure. Empirical evidence indicates that there is a threshold for RECO of 7.5 beyond which its positive and statistically significant association with per capita GDP wears out12. In 2022-23 (BE), this ratio is placed at 5.2, well below the threshold and, therefore, releasing growth-boosting effects (Chart 6a and b). 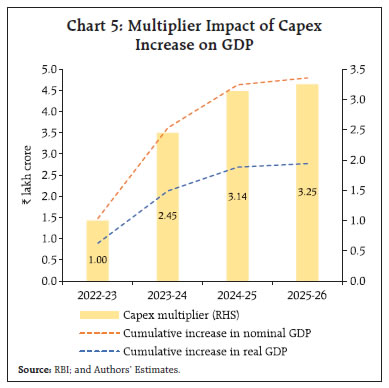
 The ratio of the revenue deficit to the gross fiscal deficit (RDGFD)13 – another indicator of the quality of expenditure is set to decline for the second consecutive year to 59.6 per cent in 2022-23 (BE), as against the average of 70.1 per cent during 2010-11 to 2019-2014 (Chart 7). Central finances are, thus, moving towards a growth promoting expenditure mix. V. Financing of GFD and Debt Dynamics In 2022-23, gross market borrowing through dated securities is budgeted at ₹14.95 lakh crore, which exceeded market expectations. However, adjusting for switch operations amounting to ₹63,648 crore undertaken on January 28, 2022 gross borrowing requirement may stand reduced at ₹14.31 lakh crore. Moreover, an amount of ₹65,000 crore will be borrowed by the Union government on behalf of the National Highways Authority of India (NHAI), instead of the usual practice of NHAI borrowing directly from the market. A reversion to the pre-pandemic pattern of financing is also envisaged with the increase in the share of net market borrowings to 67.3 per cent during 2022-23 (as against the average of 83.2 per cent during 2010-19 and 52.1 per cent during 2019-22); reduction in the reliance on T-bills and NSSF (financing through NSSF increased to 29.8 per cent during 2019-22, as against the average of 7.8 per cent during 2010-19); and reduction in the share of external assistance (Table 3). As a part of the government’s overall market borrowings in 2022-23, Sovereign Green Bonds will also be issued, the proceeds of which will be deployed in public sector projects for reducing the carbon intensity of the economy. Sovereign green bonds could be key to meet climate goals, facilitate better pricing or a green bond premium/greenium by broadening and diversifying the investor base and contribute in the development of the green finance market15. A successful sovereign green bond issuance will, however, depend on the robustness of the procedures and frameworks involved such as a detailed budget tagging exercise to classify expenditures according to green and social taxonomies (Climate Bonds Initiative, 2021). | Table 3: GFD Financing | | (Amount in ₹ crore) | | Item | 2020-21 | 2021-22 (BE) | 2021-22 (RE) | 2022-23 (BE) | | 1 | 2 | 3 | 4 | 5 | | Gross Fiscal Deficit | 18,18,291
| 15,06,812
| 15,91,089
| 16,61,196 | | | (100.0) | (100.0) | (100.0) | (100.0) | | Financed by | | | | | | Net Market Borrowings | 10,32,907
| 9,24,708
| 7,75,771
| 11,18,612 | | | (56.8) | (61.4) | (48.8) | (67.3) | | Net Treasury Bills | 2,83,205
| 50,000
| 1,00,000
| 50,000 | | | (15.6) | (3.3) | (6.3) | (3.0) | | Securities issued against Small Savings (net) | 4,83,733 | 3,91,927 | 5,91,524 | 4,25,449 | | | (26.6) | (26.0) | (37.2) | (25.6) | | External Assistance | 70,180 | 1,514 | 19,746 | 19,251 | | | (3.9) | (0.1) | (1.2) | (1.2) | | State Provident Fund | 18,514 | 20,000 | 20,000 | 20,000 | | | (1.0) | (1.3) | (1.3) | (1.2) | | Reserve Fund | 4,545 | 5,051 | -1,675 | 5,824 | | | (0.2) | (0.3) | -(0.1) | (0.4) | | Deposits and Advances | 25,682 | 28,868 | 32,945 | 34,029 | | | (1.4) | (1.9) | (2.1) | (2.0) | | Draw Down of Cash Balances | -7,188 | 71,383 | 1,74,187 | 752 | | | -(0.4) | (4.7) | (10.9) | (0.0) | | Others | -93,287 | 13,361 | -1,21,410 | -12,721 | | | -(5.1) | (0.9) | -(7.6) | -(0.8) | Notes: 1. Net market borrowings include borrowings through dated securities only.
2. Net treasury bills include borrowings through 91-day, 182-day, 364-day and all other treasury bills.
3. Others include buyback of securities, switching off of securities, saving bonds, relief bonds etc.
4. Figures in parentheses represent per cent of GFD.
Source: Union Budget Documents. | Debt, i.e., the temporal accumulation of fiscal deficit is considered to be unsafe if under existing conditions and likely future policies, there is a non-negligible risk that the debt-GDP ratio will steadily increase and lead to a default at some point (Blanchard, 2022). In the aftermath of the pandemic, Union government debt reached an all-time high of 63.1 per cent of GDP in 2020-21 and is budgeted at 60.4 per cent in 2022-23. To assess the ability of the government to service this debt out of current and regular sources of revenue, we examine three main indicators of debt sustainability. First, real interest rate (r) should be lower than the rate of growth of real GDP (g). Second, the primary balance should be positive. Third, the cost of debt servicing, proxied by the ratio of interest payments to revenue receipts, should be declining over time. An analysis of these indicators for the union government reveals that the real rate of interest has been lower than growth rate of real GDP in all phases but turned positive in 2019-20 due to growth slowdown, and in 2020-21 due to the impact of the pandemic. Primary balance has remained consistently negative through all the phases, however, it has mostly been outweighed by the negative r - g.16 The ratio of interest payments to revenue receipts stands high at over 42 per cent owing to the increased borrowing requirements of the Union government (Table 4). 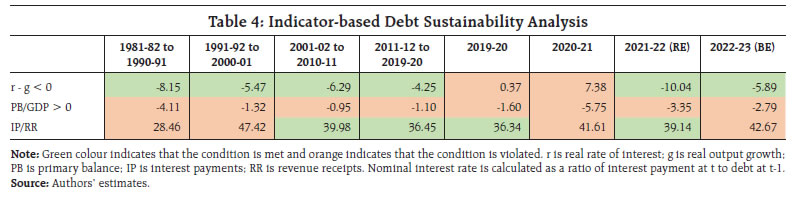 In addition to the backward-looking indicator-based approach, a forward-looking debt sustainability analysis has also been carried out, based on IMF’s Debt Dynamics Tool (DDT)17. The Union government’s debt path is projected for the period 2022-23 to 2025-26, the terminal year for achieving the gross fiscal deficit of below 4.5 per cent of GDP, based on initial conditions categorised by available projections of GDP growth, inflation, primary balance and effective interest rate (Table 5)18. In the baseline scenario, the union government’s debt is projected to contract to 56.7 per cent of GDP by 2025-26. | Table 5: Debt Dynamics Tool – Key Assumptions and Results | | | Historical | Projection (Baseline) | | 2017-18 | 2018-19 | 2019-20 | 2020-21 | 2021-22 | 2022-23 | 2023-24 | 2024-25 | 2025-26 | | Real GDP Growth | 6.8 | 6.5 | 3.7 | -6.6 | 8.8 | 7.8 | 6.6 | 6.3 | 6.2 | | GDP Deflator Inflation | 4.0 | 3.9 | 2.4 | 5.6 | 7.7 | 4.8 | 4.7 | 4.7 | 4.7 | | Gross Primary Balance | -0.4 | -0.4 | -1.6 | -5.7 | -3.3 | -2.7 | -2.1 | -1.5 | -0.9 | | Nominal Effective Interest Rate | 6.9 | 6.9 | 6.5 | 6.4 | 6.5 | 6.7 | 6.7 | 6.7 | 6.7 | | Debt | 49.7 | 49.8 | 53.0 | 63.1 | 60.2 | 59.6 | 59.1 | 58.1 | 56.7 | | Source: Authors’ estimates. |
The fan chart for union government debt, generated by creating shocks for the real GDP growth and primary balance, suggests that in 2025-26 the 50 per cent confidence interval is estimated at 52.3 - 61.9 per cent of GDP (Chart 8a). In the projection period, real GDP growth will remain the key to debt consolidation (Chart 8b). VI. Conclusion Fiscal policy exits from crisis modes are much more difficult than going in; in the case of pandemics, it is excruciatingly so. Exiting policy makers have to contend with the razor’s edge trade-off between cliffs and ramps. Too rapid and large a withdrawal of fiscal support risks pushing the economy over the cliff into a sharp downturn. On the other hand, the ramp effects of too gently sloped a withdrawal runs the risk of moral hazard, and the building up of pressure groups for delaying the withdrawal of policy stimulus. The Budget for 2022-23 commences this journey of conflicting pulls by seeking to calibrate a thrust to growth with feasible rectitude. Accordingly, it has chosen to go with a reduction in the gross fiscal deficit (GFD) by 0.4 per cent of GDP19 on its path to taking it down to 4.5 per cent by 2025-26. While this reduction may be seen as modest and back loading the bulk of consolidation on to later years, it needs to be evaluated against what the economy can bear now and the slack it can pull in when the recovery is stronger, rooted and self-sustaining. Getting there hinges around a strong investment drive and that is what the Budget has sought to prioritize, while holding down revenue expenditure growth relative to historical precedent. Our calculations show that the benefits of this infrastructure-first strategy will pay dividends for several years, peaking in 2025-26 – the year of the next milestone on the consolidation path. Estimates of the fiscal impulse presented here suggest that despite the consolidation, there will be some stimulus left in the economy till the end of 2022-23. It is now for private investment to respond and participate in the recovery. The Budget has adopted a risk-minimisation strategy of providing headroom at several levels – conservative revenue forecasts; realistic disinvestment target; economy in the recourse to NSSF and cash balances; and conservative nominal GDP projections. These buffers will help to secure the budgetary targets set for 2022-23. Key indicators of debt sustainability have started improving after taking a hit during 2019-21. Going forward, Union government debt is projected to stabilise below 60 per cent of GDP in the medium-term, but it is large at around 85 per cent when juxtaposed with sub-national debt. While the post-pandemic debt consolidation will rely primarily on GDP growth, it needs to be complemented by fiscal consolidation. In this context, the 0.4 percentage points reduction in the GFD of the Centre for 2022-23 is a valuable starting point and needs to be matched by the States. References Azhgaliyeva, D., Kapoor, A., & Liu, Y. (2020). Green bonds for financing renewable energy and energy efficiency in South-East Asia: a review of policies. Journal of Sustainable Finance & Investment, 10(2), 113-140. Blanchard, O. (2022). Deciding When Debt Becomes Unsafe. Finance and Development, International Monetary Fund, March. Dudine, M. P., & Jalles, J. T. (2017). How buoyant is the tax system? New evidence from a large heterogeneous panel. International Monetary Fund. Fedelino, A., Ivanova, A., & Horton, M. A. (2009). Computing cyclically-adjusted balances and automatic stabilizers. IMF Technical Notes and Manuals, 2009 (005). Rabanal, P. (2015). Q&A: Seven Questions on Potential Output. IMF Research Bulletin, 2015(001). Sargent, T.J. and Wallace, N (1981). Some unpleasant monetarist arithmetic. Quarterly Review, Federal Reserve Bank of Minneapolis, vol. 5. Sovereign Green, Social, and Sustainability Bond Survey: The Ultimate Power to Transform the Market (2021). Climate Bonds Initiative.
| Annex 1: Union Budget 2022-23: Key Fiscal Indicators | | | in ₹ thousand crore | Per cent of GDP | Growth Rate | | 2019-20 | 2020-21 | 2021-22 (BE) | 2021-22 (RE) | 2022-23 (BE) | 2021-22 (RE) | 2022-23 (BE) | 2021-22 (RE) | 2022-23 (BE) | | 1 | 2 | 3 | 4 | 5 | 6 | 7 | 8 | 9 | 10 | | 1. Direct Tax | 1,050 | 945 | 1,108 | 1,250 | 1,420 | 5.4 | 5.5 | 32.3 | 13.6 | | (i) Corporation | 557 | 458 | 547 | 635 | 720 | 2.7 | 2.8 | 38.7 | 13.4 | | (ii) Income | 480 | 470 | 549 | 595 | 680 | 2.6 | 2.6 | 26.5 | 14.3 | | 2. Indirect Tax | 961 | 1,082 | 1,109 | 1,266 | 1,338 | 5.5 | 5.2 | 17.0 | 5.7 | | (i) GST | 599 | 549 | 630 | 675 | 780 | 2.9 | 3.0 | 23.0 | 15.6 | | (ii) Customs | 109 | 135 | 136 | 189 | 213 | 0.8 | 0.8 | 40.3 | 12.7 | | (iii) Excise | 241 | 392 | 335 | 394 | 335 | 1.7 | 1.3 | 0.6 | -15.0 | | 3. Gross Tax Revenue (1+2) | 2,010 | 2,027 | 2,217 | 2,516 | 2,758 | 10.8 | 10.7 | 24.1 | 9.6 | | 4. Assignment to States | 651 | 595 | 666 | 745 | 817 | 3.2 | 3.2 | 25.2 | 9.6 | | 5. NCCD Transfers | 2 | 6 | 6 | 6 | 6 | 0.0 | 0.0 | 5.3 | 4.4 | | 6. Net Tax Revenue (3-4-5) | 1,357 | 1,426 | 1,545 | 1,765 | 1,935 | 7.6 | 7.5 | 23.8 | 9.6 | | 7. Non Tax Revenue | 327 | 208 | 243 | 314 | 270 | 1.4 | 1.0 | 51.1 | -14.1 | | (i) Dividends and Profits | 186 | 97 | 104 | 147 | 114 | 0.6 | 0.4 | 52.1 | -22.7 | | (ii) Interest Receipts | 12 | 17 | 12 | 21 | 18 | 0.1 | 0.1 | 22.1 | -13.9 | | 8. Revenue Receipts (6+7) | 1,684 | 1,634 | 1,788 | 2,079 | 2,204 | 9.0 | 8.5 | 27.2 | 6.0 | | 9. Non-debt Capital Receipts | 69 | 58 | 188 | 100 | 79 | 0.4 | 0.3 | 73.5 | -20.7 | | (i) Disinvestment Receipts | 50 | 38 | 175 | 78 | 65 | 0.3 | 0.3 | 105.8 | -16.7 | | (ii) Recovery of Loans | 18 | 20 | 13 | 22 | 14 | 0.1 | 0.1 | 11.4 | -35.0 | | 10. Total Receipts (ex. borrowings) (8+9) | 1,753 | 1,692 | 1,976 | 2,179 | 2,284 | 9.4 | 8.9 | 28.8 | 4.8 | | 11. Revenue Expenditure | 2,351 | 3,084 | 2,929 | 3,167 | 3,195 | 13.6 | 12.4 | 2.7 | 0.9 | | (i) Interest Payments | 612 | 680 | 810 | 814 | 941 | 3.5 | 3.6 | 19.7 | 15.6 | | (ii) Major Subsidies | 228 | 708 | 336 | 433 | 318 | 1.9 | 1.2 | -38.8 | -26.6 | | Food | 109 | 541 | 243 | 286 | 207 | 1.2 | 0.8 | -47.1 | -27.8 | | Fertilizer | 81 | 128 | 80 | 140 | 105 | 0.6 | 0.4 | 9.5 | -24.9 | | Petroleum | 39 | 38 | 14 | 7 | 6 | 0.0 | 0.0 | -83.1 | -10.8 | | 12. Capital Expenditure (i + ii) | 336 | 426 | 554 | 603 | 750 | 2.6 | 2.9 | 41.4 | 24.5 | | (i) Capital Outlay | 311 | 316 | 514 | 547 | 610 | 2.4 | 2.4 | 73.3 | 11.5 | | (ii) Loans & Advances | 24 | 110 | 40 | 55 | 140 | 0.2 | 0.5 | -50.0 | 153.5 | | 13. Total Expenditure (11+12) | 2,686 | 3,510 | 3,483 | 3,770 | 3,945 | 16.2 | 15.3 | 7.4 | 4.6 | | 14. Gross Fiscal Deficit (13-10) | 934 | 1,818 | 1,507 | 1,591 | 1,661 | 6.9 | 6.4 | -12.5 | 4.4 | | Source: Union Budget Documents. |
|