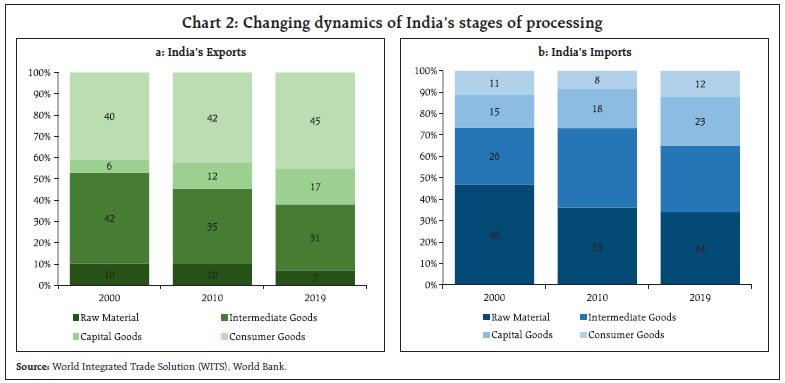
Supply chain disruptions have forced their way into policymakers’ radars in the wake of the pandemic. An index of supply chain pressures for India (ISPI), developed by extracting common factors latent in 19 domestic and global variables for the period March 2005 through March 2022, is found to track supply pressures on the Indian economy efficiently. It contemporaneously predicts industrial production, GDP and input costs and displays lead indicator properties in respect of export volumes and inflation. The most recent elevation in the ISPI warrants careful monitoring of supply chain pressures, highlighting the importance of the ISPI in a macroeconomic early warning system for the Indian economy. The COVID-19 pandemic has delivered the biggest and broadest shock to global value chains (GVCs) in living memory, putting at risk trade in intermediate goods that accounts for two-thirds of global exports. Ships stacked high with containers wait at ports around the world for their turn to unload, sometimes at anchor for months. Shipping costs have risen around six times. Delivery times have lengthened by more than two days during the second half of 2021 relative to the first half across key ports. Truck and air freight prices have also surged in double digits over pre-pandemic levels, exacerbated by labour shortages. High frequency indicators suggest that global growth and trade have lost pace in the first quarter of 2022, with anecdotal evidence of production pauses, order backlogs and build-ups of precautionary inventories, all sapping global demand. The elevation in prices has been such that central banks, their mandates and credibility challenged, have been stung into tightening monetary policy and normalising pandemic-response liquidity overhangs despite the weak recovery, with emerging markets ahead and advanced economies following. It is estimated that it may take a year or more for these snarls to unravel and return to normal functioning (Sea-Intelligence, 2021) 1. In the now burgeoning literature on the theme, the focus has been on idiosyncratic shocks to supply chains, as for instance, dependence on single type customers and suppliers (Wagner and Bode, 2006), the issue of integrating upstream suppliers (Antras and Choe, 2013; Alfaro, et al, 2019), and country-level and industry-level production impediments (Antras, 2020; Melitz, 2003). With the onset of the pandemic, this traditional approach is giving way to the view that aggregate macroeconomic shocks do matter and under their impact, shortages and inflationary pressures tend to acquire persistence (Jiang, Rogobon and Rigobon, 2021)2. As the revenge spending swing from services to goods collides with the pandemic-induced supply disruptions and bottlenecks, attention is accordingly focused on GVCs, their benefits and costs and particularly on their potential to increase risks and vulnerabilities to shocks. While GVCs are exposed to different types of shocks, depending on their geographical footprint, those with the highest production/export concentration in a few countries are more exposed than others, with the semiconductor value chain being a case in point,3 although labour-intensive value chains such as apparel have also been found to be highly prone to pandemic-related disruptions (McKinsey, 2020). Practices such as just-in-time production, sourcing from a single supplier and relying on customised products with few substitutes amplify disruptions. In fact, questions are being raised about the gains from deepening and expanding GVCs and whether GVCs may themselves adapt to become more localised production networks, providing greater security against the disruptions the world faces today. Some of these shifts are already underway – companies are chartering entire ships exclusively for their own cargo; new orders are going out for smaller container ships; passenger aircraft are being refitted for freight; carmakers and smartphone producers are being supplied chips ahead of computer servers; shipping is becoming prohibitively costly for bulky low-value goods, turning them away; investment plans are being tailored accordingly; governments are incentivising ‘reshoring’ of production; and global trade is on the cusp of becoming more regionalised. In the literature too, as alluded to earlier, there is a shift in interest to supply chain flexibility and resilience or the ability to adapt to aggregate shocks (Zhao and You, 2019; Antras and De Gortari, 2020). Currently, the received wisdom is that localised production could become associated with lower levels of activity than GVCs, fewer opportunities for trade diversification, and amplification of domestically originating disruptions (OECD, 2020; BIS, 2020). Nonetheless, it is estimated that 16-26 per cent of global merchandise could conceivably move to new locations in the light of the pandemic experience. Alternatively, strengthening risk management capacities in GVCs – building supply and transportation redundancies; holding more inventories; reducing product complexity; creating flexible production across the chain; financial resilience; and even centralised rules set by global consensus for supply chain management can limit the economic consequences of shifts to more localised production (McKinsey, 2020). In other words, the pandemic will move GVCs from a just-in-time strategy to a ‘just-in-case’ one (Jiang, et al., ibid). In view of the foregoing, it is important to monitor supply chain pressures to gauge their implications for macroeconomic conditions, globally and in India, as well as to assess their role in shaping the future of international manufacturing, trade and commerce with potential spillovers to national economies. Several measures are used to assess the pressures from supply disruptions. The common approach is to observe the evolution over time of a set of indicators of underlying logistics, shipping costs and delivery times, among others. They, however, tend to provide information on specific aspects of supply chains. A recent approach is the construction of a global supply chain pressure index by extracting common factors latent in a set of indicators of cross-border transportation costs, country-level purchasing managers’ indices of economies that are significantly interlinked through GVCs and sub-components of the PMIs, all purged of demand effects (Benigno et al., 2022). The objective is to create a parsimonious but comprehensive measure of supply disruptions that captures all factors impinging on GVCs, both globally and in the US. Another recent approach is to calculate foreign exposure for each industry by taking the ratio of foreign value added to exports and then multiplied it with a measure of supply chain disruptions such as backlogs or delivery time to obtain exposures to supply bottlenecks (Santacreu and LaBelle, 2022). Drawing from these recent strands of work, we attempt to develop an index of supply chain pressures specific to India (ISPI). Our ISPI appears to track supply pressures on the Indian economy quite well, as evident in the close co-movement with indicators such as inflation, the growth of industrial production, export volume and GDP, especially through the period of the pandemic. We also detect strong coincident indicator properties reflected in correlations, time-varying Granger causality and the capturing of turning points. The rest of the paper is organised into four sections. The next section deals with the specific indicators that go into the ISPI and the rationale for their choice. Section III lays out the methodology for the index, given the caveats listed above. Section IV evaluates the ISPI in terms of its co-movement with important macroeconomic variables such as GDP, inflation, industrial production and merchandise exports. The final section concludes the paper with some perspectives. II. Choice of Variables The index of supply chain pressure for India (ISPI) that is proposed in this paper takes into account select domestic and global variables that impinge upon supply and logistics pressures specific to India. These indicators are classified under two broad categories: (i) transportation and logistics; (ii) essential intermediates in manufacturing. Around 95 per cent of India’s merchandise trade in volume terms and 70 per cent in value terms is routed through sea transport (IBEF, 2021). 60 per cent of cross-border trade is with Eastern and West Asian countries, 17 per cent with the USA and EU countries, and 8 per cent with African countries. The top 10 countries from these regions account for more than 50 per cent of India’s total merchandise trade (Chart 1). Over the last two decades, India’s exports and imports comprise about 40 per cent and 65 per cent, respectively, of raw materials and intermediate goods that are susceptible to shocks emerging from supply chains (Chart 2). Under transportation and logistics indicators, the Freightos index, which measures global container freight rates for 40-foot containers on 12 global trade lanes, is widely regarded as a comprehensive indicator of freight rate movements with data inputs on real time. In view of limitations relating to data availability, however, shipping rates in our ISPI are proxied by the Baltic Dry Index, a composite index of three different sizes of dry carriers - Capesize, Panamax and Supramax4 - and the Harpex Index, which tracks container shipping rates on a weekly basis in eight classes of all-container ships only. During 2021, container shipping costs surged by six times their pre-pandemic levels and peaked around the middle of the year. In the first four months of 2022, rates have remained elevated, particularly for US-China trading routes, due to (i) strict containment measures in China; and (ii) container shortages at Asian ports owing to lockdown measures that piled up containers at wrong places - companies in Asia are reported to be paying premium rates to get containers back (Attinasi et al., 2021c). Ports congestions in the US and Europe also contributed to elevated wait times at ports, impacting the reliability of the schedules of global container services, which declined to the lowest levels on record (Sea-Intelligence, 2022)5. Rising shipping costs were compounded by limited air freight capacity. More recently, however, shipping and logistics pressure have started to ease (Chart 3). 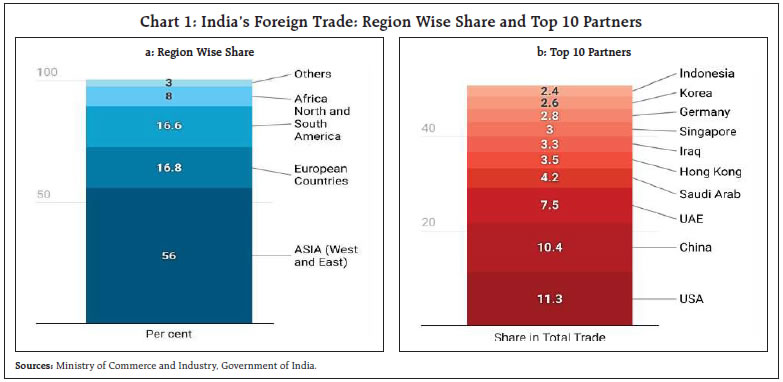
 International air freight rates are also included in the ISPI, proxied by US-Asia and Asia-US rates obtained from the US Bureau of Labor Statistics. Notably, Asia- US rates peaked ahead of US-Asia counterparts, but both have been easing through the second half of 2021 and into the early months of 2022 (Chart 4).
Domestic transportation costs are incorporated into the ISPI by considering inland truck freight rates as well as domestic railway and air freight traffic6. Port activity embodied in inbound and outbound shipments and turnaround time are also included to reflect port congestion. Domestic goods movements recorded the severest disruptions during the first wave of the pandemic, including truck freight (Chart 5). All these indicators have exhibited robust recoveries from the second half of 2021. Turning to indicators of supply of intermediates in manufacturing, a host of indicators have been used. Global indicators include (1) the delivery time sub-indices7 in the global manufacturing purchasing managers index (PMI) and in the global electronics equipment PMI as a measure of the extent to which supply chain delays impact production; (2) share prices of semiconductor manufacturers (de-trended) listed in the PHL X Semiconductor Sector Index8; and (3) delivery time and backlog sub-components of the US and China manufacturing PMIs to represent leading trade partner country conditions in terms of volume of orders received pending starting of work, and supply chain delays, respectively. 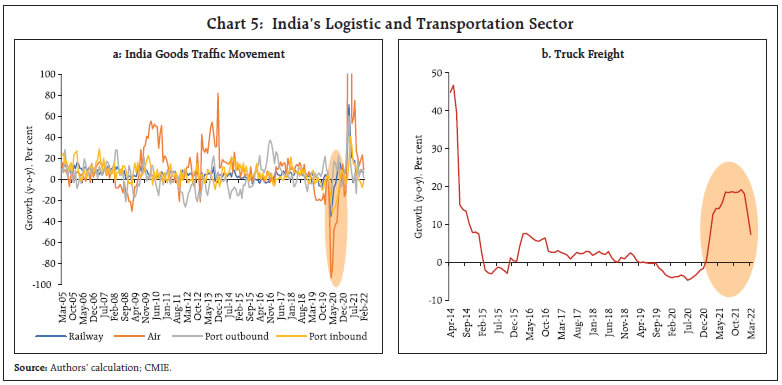 Movements in global PMIs for different manufacturing sub-sectors show how the sharp rebound in new orders for inputs of production from a trough in the second quarter of 2020 has been boosted by a strong rise in supplier delivery times and an increase in input price pressures - both lead time and share prices peaked in December 2021 (Chart 6a). The sectors experiencing the severest disruptions in supply chains are basic materials, machinery and equipment, and cars. US manufacturing output growth accelerated in the first quarter of 2021, reflecting pent up demand, despite shortages of inputs leading to rising backlogs in work. These backlogs started to moderate from the second half of 2021 as delivery time started to improve. China’s backlog peaked in February 2020, following stringent lockdown measures imposed to contain the spread of COVID-19 infections. Backlogs started to normalise in subsequent quarters with the relaxation of containment measures (Chart 6b). 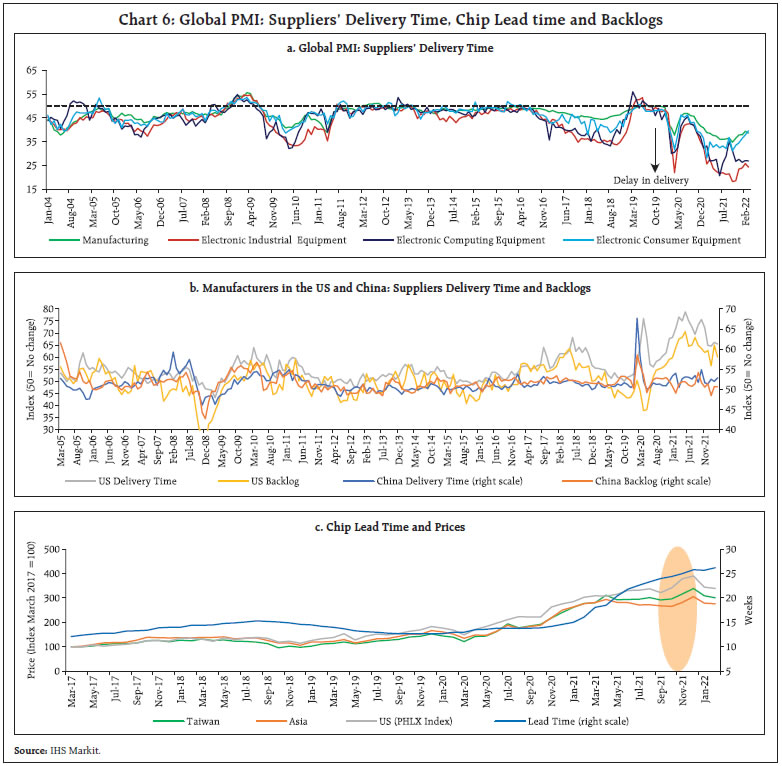 As lockdown measures gripped the world at the beginning of 2020, the sales of semiconductors to the motor vehicle industry collapsed. This was exacerbated by strong demand from computer and electronic equipment producers owing to the shift to remote working and distance learning (Attinasi et al., 2021a). Global chips sales have grown strongly over the last 24 months, resulting in an unprecedented increase in the ratio of new orders to suppliers’ delivery time in the global electronics PMI, particularly in industries such as auto and auto parts and technology equipment. China, Taiwan and Hong Kong continue to dominate the global exports and imports of semiconductors (Chart 6c). India’s domestic auto sales are yet to recover from chip shortages, although auto exports came out of a trough early and remained in positive territory as manufacturers preferred to maintain export market shares. Domestic indicators of supply disruptions in manufacturing include sub-components of the manufacturing PMI for India: (1) suppliers’ delivery time – a valuable indicator that captures supply chain delays, capacity constraints and price pressures; (2) backlog of work – a measure that gauges the volume of orders a company has received but has yet to either start work on or complete; and (3) stock purchases, – which provide insights into the level of inventories held by companies in anticipation of supply chain pressures. COVID-19 induced demand-supply disruptions pushed India’s manufacturing PMI to a record low in the second quarter of 2020, with delivery times peaking and inventories reaching their lowest levels since PMI data collection began in March 2005. This adversely impacted firms’ order books, resulting in a rise in backlogs. Manufacturing activity started gaining momentum in the second half of 2020 due to an acceleration in sales, supported by an upturn in production. As a result, companies scaled up input buying, leading to the second quickest accumulation in stock of purchases in the last 17 years. Delivery time pressure started to dissipate, and inventory management of firms and companies became more efficient in response a more calibrated approach towards containment, resulting in moderation in backlogs. 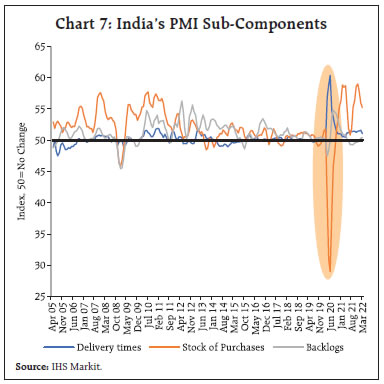 The suppliers’ delivery time sub-index in the PMI quantifies developments in the time required for the delivery of inputs to firms. One key advantage of this indicator is that it is able to capture capacity constraints of various types (e.g., intermediate goods shortages; transportation delays; labour supply shortages), making it an all-encompassing barometer of strains in production networks. Since suppliers’ delivery time can also be influenced by a rise in demand beyond existing capacity, it is necessary to segregate movements associated with cyclical fluctuations. A structural vector autoregression (SVAR) of the new orders component of the manufacturing PMI – proxying demand conditions - and the manufacturing PMI supply delivery time shows that more than half of the lengthening of suppliers’ deliver time was due to demand during the first wave of the pandemic. More recently, however, delays are mostly due to supply bottlenecks that have emerged in the wake of geopolitical hostilities (Chart 8). 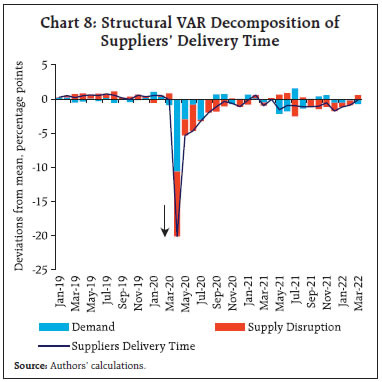 From the stylised analysis presented in this section, it is evident that supply chain pressures confronting India stem mainly from global spillovers reflected in supply delivery delays in various areas of manufacturing and acute in respect of electronics equipment. The global escalation in freight rates has also imposed supply constraints for India’s trade, with implications for inflation and economic activity. It is noteworthy, however, that air freight increases have little significance for supply chain dislocations relevant to India, presumably reflecting the low volume of trade carried by air freight relative to sea traffic. Domestic factors mainly operate in conjunction with global factors. Nevertheless, backlogs, railway freight cargo and domestic air freight impact supply delivery time within India quite significantly. By and large, domestic supply chains have normalised faster than global chains, but truck freight rates remain elevated, with associated lingering effects on domestic supply chains. These variables form the basis of our empirical investigation, which is discussed in the following section. III. Methodology Each of the variables identified in the preceding section reflects supply disruptions in a specific segment of the economy. Hence, a composite measure that captures all the information embedded in these indicators is necessary to gauge the economy wide dimensions of overall supply chain pressures and their persistence or transience. A popular method of dimension reduction is principal component analysis (PCA), which can extract common components out of the underlying variables. A limitation of PCA is that it can be employed only on a balanced panel. Moreover, the common factors identified through PCA are static in nature and fail to capture the time-varying characteristics of these variables which, as shown in the preceding section, evolve dynamically over time. Accordingly, our choice of methodology favours a dynamic factor model (DFM), which can extract unobserved underlying factors common to a large number of variables. This can be accomplished by employing a Kalman filter that is robust to misspecification errors, non-linearities and non-stationarity, thereby producing time-varying parameters. Additionally, a DFM allows for weak correlations in idiosyncratic errors and is preferred over a vector autoregression (VAR) model as it overcomes the limitations of restrictive assumptions on the structure of the economy as well as on the maximum number of variables that can be included and therefore, the number of shocks. The following DFM specification is used to extract the common factors9: where Ft is a vector of common factors that follows a VAR(p) process; λi is the factor loading of Ft, showing the relevance of each variable Χit in the ISPI and εit represents idiosyncratic shocks specific to the ith variable at time ‘t’. In order to avoid misspecification with respect to dynamic and cross-sectional properties, the common factors are estimated in two steps. First, preliminary parameter estimates are derived from PCA to set up the initial values. Second, the factors are re-estimated by mean squared error-optimal linear projection from a Kalman smoother while allowing for idiosyncratic cross-sectional heteroscedasticity and common factor dynamics as well as an unbalanced panel (Doze et al., 2011). IV. Empirical Results The DFM is estimated by using monthly data on 19 relevant variables referred to in Section II for the period March 2005 through March 2022 (Annex Table A1)10. As the variables embody both demand and supply influences, demand effects are stripped out by regressing the contemporaneous value as well as up to two lags of the PMI sub-component “new orders” of each country/sector on each of the other 18 variables11. The residuals from these regressions are then standardised and used as inputs in the ISPI (Benigno et al. 2022). The estimated factor loadings confirm our stylised assessment that global factors like supply delivery delays in various categories of manufacturing, especially in semiconductors, have a dominant influence on domestic supply chain pressures (Chart 9). As India imports a significant amount of intermediate inputs and raw materials from China, supply disruptions in that country impact the ISPI more than supply bottlenecks in advanced economies like the US. The calculated contribution of each variable to the ISPI shows that recent improvements in domestic supply conditions are mainly due to railways and air cargo traffic movements (Chart 10). On the other hand, problems in advanced countries as reflected in semiconductor production, inbound port traffic movements and delivery delays in the US are still imposing upward pressure on the ISPI. In terms of its performance, the ISPI closely tracks two major supply disruptions i.e., during the global financial crisis (GFC) and in the first wave of the pandemic (Chart 11). Thereafter, the ISPI eased to a trough in April 2021 as pandemic related containment measures were progressively eased. As mobility improved, pent-up demand was reflected in normalisation of the movements of manufactured goods and rebalancing of supply-demand mismatches. From May 2021, however, with the onset of the second wave, the ISPI started moving upward, though the index remained in negative territory up to March 2022. The most recent elevation in the ISPI warrants careful monitoring in view of the renewal of supply chain pressures on geopolitical developments. This highlights the importance of the ISPI in the macroeconomic early warning system. 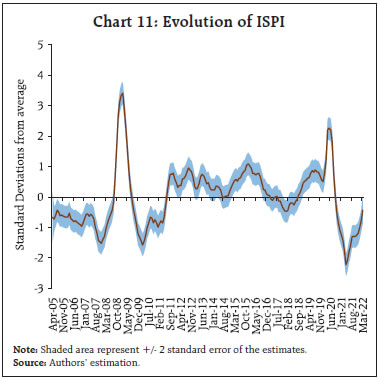 This is corroborated by the tracking power of the ISPI with regard to key macroeconomic variables in India either as a lead or coincident or lagged indicator. Dynamic correlations i.e., considering upto 12 leads/ lags show statistically strong contemporaneous correlation between the ISPI and export volume growth of emerging Asia excluding China, which is a close proxy for Indian export volumes.12 Dynamic correlation is highest between the ISPI and one period ahead export growth, implying lead indicator properties. Similarly, the ISPI tracks wholesale price non-food manufactured products (core) inflation with a lead of 3 months. The ISPI is contemporaneously correlated with IIP growth and with PMI input and output prices (Table 1 and Chart 12). The dynamic correlation between quarterly GDP growth (y-o-y) and the ISPI is the highest at (-)0.58 for the contemporaneous period; however, the correlation is greater for the ISPI as lead than as lag indicator. In order to formally assess how supply chain disruptions cause macroeconomic outcomes, time-varying causality is estimated through a rolling window algorithm with a window size of 72 months that utilises subsample tests of Granger causality within a lag-augmented VAR framework (Shi et al., 2020). The results provide evidence of Granger causality running from the ISPI to input prices, to output prices and WPI core inflation since the beginning of the pandemic, with no or weak evidence of reverse causation. Causality is also found to run from the ISPI to export volume changes and to change in industrial production (Chart 13 and Chart 14). | Table 1: Dynamic Correlations between ISPI and Select Macroeconomic Indicators | | Lag/ Lead | ISPI, Exports growth(t-i) | ISPI, Exports growth(t+i) | ISPI, IIP growth(t-i) | ISPI, IIP growth(t+i) | ISPI, WPI Core Inflation(t-i) | ISPI, WPI Core Inflation(t+i) | ISPI, Input price(t-i) | ISPI, Input price(t+i) | ISPI, Output price(t-i) | ISPI, Output price(t+i) | | 0 | -0.80 | -0.80 | -0.54 | -0.54 | 0.50 | 0.50 | 0.51 | 0.51 | 0.45 | 0.45 | | 1 | -0.75 | -0.81 | -0.51 | -0.50 | 0.42 | 0.56 | 0.49 | 0.47 | 0.40 | 0.42 | | 2 | -0.65 | -0.78 | -0.45 | -0.44 | 0.33 | 0.61 | 0.43 | 0.42 | 0.31 | 0.37 | | 3 | -0.54 | -0.74 | -0.37 | -0.40 | 0.24 | 0.64 | 0.33 | 0.35 | 0.18 | 0.31 | | 6 | -0.19 | -0.51 | -0.17 | -0.26 | 0.04 | 0.63 | 0.02 | 0.20 | -0.13 | 0.20 | | 9 | 0.04 | -0.09 | -0.01 | -0.01 | -0.06 | 0.44 | 0.11 | 0.08 | -0.22 | 0.12 | | 12 | 0.17 | 0.26 | 0.17 | 0.13 | -0.11 | 0.17 | 0.17 | -0.01 | -0.25 | 0.08 | | Source: Authors’ calculation. |
V. Conclusion Supply chain disruptions have forced their way into the radars of policy makers in the wake of the pandemic. It is estimated that these disruptions have lowered the growth of world trade by 2.7 per cent and world industrial production by 1.4 per cent (Attinasi et al., 2021b) while contributing 1.5 per cent of global inflation (OECD 2021). The escalation of geo-political hostilities since late February 2022 has exacerbated supply chain pressures. It is estimated that as a result, global GDP growth could reduce by over 1 percentage point in 2022 and push up global consumer price inflation by approximately 2.5 percentage points (OECD, 2022). The pandemic has starkly revealed that while GVCs were designed for efficiency, cost-saving and proximity to markets, they were not calibrated to risk exposure, especially of the overwhelming type that is being experienced today13. It is in this context that the index of supply chain pressures for India (ISPI) that is constructed in this paper and tested for signal properties assumes a timely significance. We find that exposure to global supply chain disruptions are quickly transmitted to domestic supply chains, especially from those countries from which India sources the large part of its requirements of raw materials and intermediates. While our ISPI contemporaneously traces industrial production, GDP and input costs, it displays lead indicator properties in respect of export volumes and inflation. This suggests that the prevailing upside risks to inflation and downward risks to export performance may persist. Looking ahead, co-ordinated actions are required to fast track consensus-based supply chain protocols, gaps in the physical and digital infrastructure, labour shortages and shortfall in investment in capacity creation. 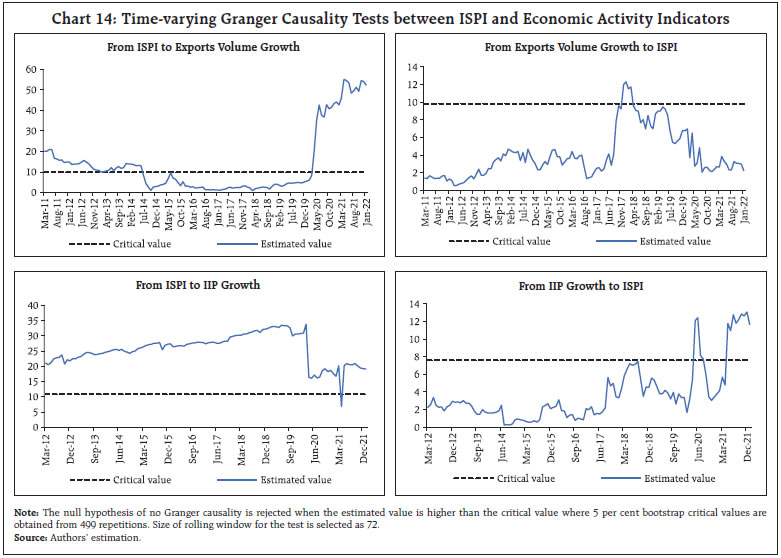 References Alfaro, L., Antràs, P., Chor, D. and Conconi, P. ( 2019). Internalizing Global Value Chains: A Firm-Level Analysis. Journal of Political Economy, 127 (2): 509- 559. Antràs, P. (2020). Conceptual Aspects of Global Value Chains. The World Bank Economic Review, 34(3), 551- 574. Antràs, P., and Chor, D. (2013). Organizing the Global Value Chain. Econometrica, 81(6), 2127-2204. Attinasi, M. G., De Stefani, R., Frohm, E., Gunnella, V., Koester, G., Tóth, M., and Melemenidis, A. (2021a). The Semiconductor Shortage and Its Implication for Euro Area Trade, Production and Prices. ECB Economic Bulletin, Issue 4, 78-82. Attinasi, M. G., Balatti, M., Mancini, M., & Metelli, L. (2021b). Supply Chain Disruptions and the Effects on the Global Economy. ECB Economic Bulletin, Issue 8, 51-57. Attinasi, M. G., Bobasu, A., and Gerinovics, R. (2021c). What is Driving the Recent Surge in Shipping Costs? ECB Economic Bulletin, Issue 3, 26-32. Antràs, P. and Gortari, A. D. (2020). On the Geography of Global Value Chains. Econometrica, 88 (4), 1553- 1598. Bank for International Settlements (2020). Annual Economic Report 2020. June. Benigno, G., Groen, J. J., Noble, A. I., & di Giovanni, J. (2022). A New Barometer of Global Supply Chain Pressures (No. 20220104). Federal Reserve Bank of New York Liberty Street Economics, January 4. Doz, C., Giannone, D., and Reichlin, L. (2011). A Two-step Estimator for Large Approximate Dynamic Factor Models based on Kalman Filtering. Journal of Econometrics, 164(1), 180–205. IBEF (2021). Ports. November, available at: https://www.ibef.org/download/Ports-November-2021.pdf Jiang, B., Rigobon, D. E., and Rigobon, R. (2021). From Just in Time, to Just in Case, to Just in Worst- Case: Simple models of a Global Supply Chain under Uncertain Aggregate Shocks, NBER Working Paper, No. w29345, National Bureau of Economic Research. Melitz, M. J. (2003). The Impact of Trade on Intra-industry Reallocations and Aggregate Industry Productivity. Econometrica, 71(6), 1695-1725. McKinsey (2020). Risk, Resilience, and Rebalancing in Global Value Chains, McKinsey Global Institute, August 6. OECD (2019). Measuring Distortions in International Markets: The Semiconductor Value Chain. OECD Trade Policy Papers, No. 234. OECD (2020). The Trade Policy Implications of Global Value Chains. Trade Policy Brief, February. OECD(2021). Economic Outlook. December. OECD(2022). Economic Outlook. Interim Report, March. LaBelle, J. and Santacreu, A. M. (2022). Global Supply Chain Disruptions and inflation During the COVID-19 Pandemic. Federal Reserve Bank of St. Louis Review. Forthcoming. Shi, S., Hurn, S., and Phillips, P. C. (2020). Causal change detection in possibly integrated systems: Revisiting the money–income relationship. Journal of Financial Econometrics, 18(1), 158-180. Stock, J. H. and Watson, M. W. (2002). Forecasting using principal Components from a Large Number of Predictors. Journal of the American Statistical Association, 97(460), 1167-1179. Wagner, S.M. and Bode, C. (2006). An Empirical Investigation into Supply Chain Vulnerability, Journal of Purchasing & Supply Management, 12(6), 301-312. Zhao, S. and You, F. (2019). Resilient Supply Chain Design and Operations with Decision-Dependent Uncertainty using a Data-driven Robust Optimization Approach. AIChE Journal, 65 (3), 1006-1021.
Annex Table A1: Variables used in ISPI
(Period: March 2005 March 2022) | | List of Variable | Item/Sub-item | Source | | Inbound Port Traffic | Unloaded, Cargo Traffic at Major Ports | Centre for Monitoring Indian Economy (CMIE) | | Outbound Port Traffic | Loaded, Cargo Traffic at Major Ports | Centre for Monitoring Indian Economy (CMIE) | | Rail Cargo | Railway Goods Traffic | Centre for Monitoring Indian Economy (CMIE) | | Truck Freight | Truck Freight Rates from Delhi to Various Cities in India | Centre for Monitoring Indian Economy (CMIE) | | Domestic Air Cargo | Cargo handled at India's Domestic Airport | Centre for Monitoring Indian Economy (CMIE) | | India SDT | Suppliers' Delivery Times, India Manufacturing PMI | IHS Markit | | India Stock Purchases | Stock of Purchases, India Manufacturing PMI | IHS Markit | | India Backlog | Backlogs of Work, India Manufacturing PMI | IHS Markit | | China SDT | Suppliers' Delivery Times, China Manufacturing PMI | IHS Markit | | China Backlog | Backlogs of Work, China Manufacturing PMI | IHS Markit | | Manufacturing SDT | Suppliers' Delivery Time, Global Manufacturing PMI | IHS Markit | | Electronics SDT | Suppliers' Delivery Time, Global Electronics PMI | IHS Markit | | US Backlog | Backlogs of Orders, US Manufacturing PMI | Institute for Supply Management (ISM) | | US SDT | Suppliers' Delivery, US Manufacturing PMI | Institute for Supply Management (ISM) | | Harpex | Harpex Index | Refinitiv | | Baltic Dry Index | Baltic Dry Index | Refinitiv | | Semiconductor | PHLX Semiconductor Sector Index | Refinitiv | | Asia to US Air Freight | Inbound Price Index (International Services): Air Freight for Asia | U.S. Bureau of Labor Statistics | | US to Asia Air Freight | Outbound Price Index (International Services): Air Freight for Asia | U.S. Bureau of Labor Statistics | Note: Truck freight rate used in the article is a distance-based weighted average of city level freights.
New Orders data used in the regression are from respective country/sector PMI. |
|