Loss of momentum in global economic activity may be taking the edge off inflation, which remains elevated. The Indian economy is poised to shrug off the modest tapering of growth momentum in the first quarter of 2022-23. Aggregate demand is firm and poised to expand further as the festival season sets in. Domestic financial conditions remain supportive of growth impulses. Inflation remains elevated and above the tolerance level, underscoring the need for monetary policy to keep second order effects contained and inflation expectations firmly anchored. Introduction We live in times of conflicting possibilities – elevated inflation and rising recession risks; economic stagnation and increasing debt; strengthening US dollar and weakening currencies in the rest of the world; easing supply chain pressures and reshoring; synchronization in policy actions and deglobalisation; balance sheet normalization and liquidity stress. As a result, policy makers the world over are confronted with the most daunting challenges, but this cognitive dissonance is “the test of a first-rate intelligence, the ability to hold two opposing ideas in the mind at the same time and still retain the ability to function.”1 In its latest statistics news release, the Organisation for Economic Cooperation and Development (OECD) points to gross domestic product (GDP) of the G202 falling quarter-on quarter (q-o-q) in the second quarter of 2022 after rising 0.5 per cent in the first quarter. Rather than a synchronized slowdown, however, this loss of momentum reflects country-specific factors. For India, the OECD attributes “decreases in government spending and net trade”.3 Be that as it may, the slowdown in activity is taking the edge off inflation – it has been estimated that global inflation eased in July 2022 to 0.3 per cent on a monthly basis from an average of 0.7 per cent a month in the first half of the year4, and going by data releases so far, this easing in inflation’s momentum has extended into August as well. Weakening global demand in the face of diminished purchasing power is driving disinflation through two main channels – by weighing on commodity prices and by easing global supply chain constraints. Prices of grains, cereals and oils, staples of diets around the world, are falling back to earth - to levels last seen before the war began. Suppliers’ delivery time is improving globally and transport costs are moderating. Retailers that had built inventories in response to supply chain pressures are cutting prices to shift stock. In India too, supply chain pressures are easing on the back of improvements in domestic supply delivery time, backlogs and decline in truck freights (Chart 1). As supply chains normalise and demand rotates back from goods to services and balances out, carrying large stocks of finished goods could turn out to be costly and unnecessary. An improvement in the balance between supply and demand as supply chain pressures fade could stabilise economic activity. This could regenerate on a more even keel the recovery that was underway before the outbreak of geopolitical hostilities. This positive outlook is, however, heavily contingent on the war and the course of the pandemic. The relief on imported inflation may flow through to consumer prices in the coming quarters, notwithstanding factors like labour market tightness and war-driven natural gas prices pushing the other way. It is expected that global inflation could ease to an annualized rate of 5 per cent in the second half of 2022 from 9.7 per cent in the second quarter. 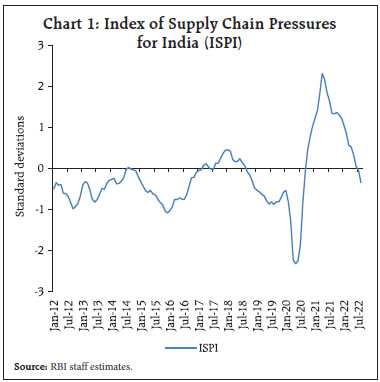 There are indications though that the road to a lower inflation regime will be one less travelled by. The biggest craters are those that global spillover explosions are creating on financial markets and financial conditions more generally. Even as Brent spot languishes in the 90s (US $ 93 per barrel on September 12, 2022), the energy crisis gets bigger by every passing day and a bleak winter looms. The global economy is being rattled by big realignments in exchange rates. As the US dollar tests 20-year highs, it humbles the other reserve currencies and throws emerging market economy (EME) currencies into disarray. Each country is on its own in matters of currency depreciation, imported inflation, wider current account imbalances, capital outflows, reserve losses and financial instability. The words of the US Treasury Secretary John Connally 50 years ago appear to be coming home to roost: “the dollar is our currency but it’s your problem”.5 Meanwhile, as the pace of runoff of the Fed’s treasury holdings doubles from this month, US dollar liquidity is getting sucked out of markets everywhere, gripping equities and bonds in a pincer. Spillovers unleashed by Fedspeak are perhaps the greatest risk to the global economy’s rendezvous with its interrupted recovery. Turning to India, the economy is priming for take-off and this is best epitomised by the INS Vikrant, India’s first indigenous aircraft carrier taking to the seas on September 2 and catapulting India into a select club of the world’s great maritime powers. During the month, India also took further steps towards becoming a manufacturing hub for semi-conductors and display fabs. Apart from ensuring self-sufficiency and immunity to future supply chain disruptions in these strategic intermediates, this will open up job opportunities and investment horizons. Reshoring has begun. Underlying these developments, there are indications that the economy is shrugging off the modest tapering of the momentum of GDP growth that is typical of the first quarter of the financial year. This is most evident in aggregate supply conditions. With the late revival and spread of the monsoon to the deficit regions and predictions of a delayed withdrawal, kharif sowing is set to exceed last year’s acreage. Even paddy and pulses are swiftly catching up. Reservoir levels will buffer up rabi prospects. Hence, the foodgrains production target of 328 million tonnes for 2022-23 – only 4 per cent above last year’s output – appears to be in striking range. The momentum of industrial production did turn negative in July 2022, but that was after 7 months of continuous increase. For August, the manufacturing purchasing managers’ index (PMI) has held up well, as the section on domestic developments will address. Services are on a roll and the business expectations index for services was at a 51-month high. Sales of passenger vehicles, fast moving consumer goods and property, and the movement of goods and people suggest that aggregate demand is firm and poised to expand further as the festival season sets in. Domestic financial conditions are engendering an environment in which the impulses of growth can be nurtured and strengthened. Equity markets are getting their groove back as foreign portfolio flows are coming back, with the trickle of July turning into a flood in August and September so far. Bond yields have softened, bucking the global trend and this is creating congenial borrowing cost conditions all around. Bank credit is accelerating every fortnight, even adjusting for base effects, to regain its place as the predominant source of finance in India. In response, banks are mobilising bulk deposits, drawing down balances held with the Reserve Bank of India (RBI) and their investments in non-SLR instruments. Mobilising of retail deposits is gaining pace with deposit rates being raised across the banking system. In the currency markets, the Indian rupee (INR) is holding its poise, with adequate supplies of dollar liquidity; in fact, the Indian forex market is considered among the most liquid in the region and is actively used by foreign investors to redomicile assets held in neighbouring countries. While on exchange rates, it is worthwhile noting in passing that India has the fifth largest reserves and is the fifth largest economy of the world – up from 6th – with a GDP of US $ 3.5 trillion in FY 2022. Hence, there can be no disagreement with the statement of the Managing Director, IMF that India continues to be a bright spot in the global economy, despite the global uncertainty and headwinds. Set against this backdrop, the remainder of the article is structured into four sections. Section II captures the rapidly evolving developments in the global economy. An assessment of domestic macroeconomic conditions is presented in Section III. Section IV reviews financial conditions in India, while the last Section concludes the article. II. Global Setting Global economic activity experienced a loss of momentum in Q2:2022, with most economies exhibiting contraction or deceleration as the outlook deteriorated. This was reflected in a sequential fall in the composite lead indicator (CLI) for OECD countries for 13 months in a row up to August 2022 (Chart 2). Synchronised and aggressive monetary tightening, lingering uncertainty from geopolitical tensions, continued supply chain disruptions and multi-decadal high inflation were the major drags on growth. Both business conditions and consumer confidence worsened with the decline in the latter being more pronounced. Our model based nowcast shows that global GDP contracted in Q2:2022, and this is likely to persist in Q3:2022 (Chart 3).6
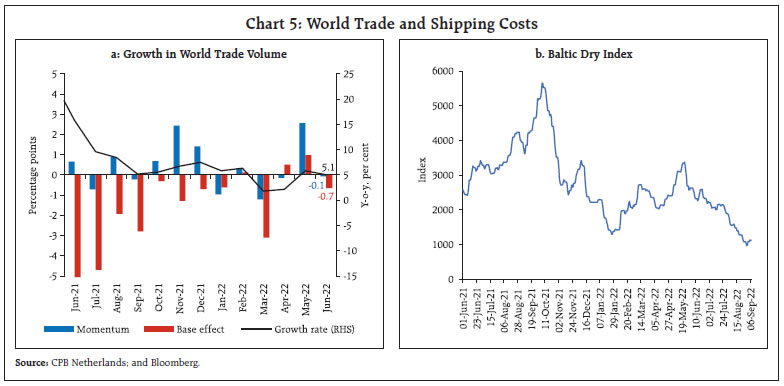
Among high frequency indicators, the global manufacturing PMI fell to a 26-month low of 50.3 in August from 51.1 in July as new orders and global manufacturing production contracted while stocks of finished goods rose. Output contracted across advanced economies (AEs) including the US, the euro area, Japan and the UK while slowing growth was observed for countries like China, Brazil, Spain and Australia. The global composite purchasing managers’ index (PMI) contracted for the first time since June 2020 from 50.8 in July to 49.3 in August, along with a contraction in services index (Chart 4). Sector wise, the PMI declined across consumer, intermediate and investment goods. In August release, the Goods Trade Barometer compiled by the World Trade Organization (WTO) indicated on-trend trade expansion, but against a weakening outlook for the remaining part of the year. World merchandise trade volume growth slowed down to 5.1 per cent (y-o-y) in June 2022 from 5.8 per cent in May on a combination of an unfavourable base effect and weak momentum (Chart 5a). Concomitantly, waning demand for vessels caused the Baltic Dry Index – a measure of shipping charges for dry bulk commodities – to slide by 49.1 per cent in August to its lowest level in over 2 years (Chart 5b). PMI subindices indicate a fall in the volume of new export business for the sixth consecutive month and receding international trade flows. Only India and Australia saw improvement in foreign demand in August. Global commodity prices remained volatile after their fall in June from historical highs. Prices edged up during late July - early August, before moderating towards the end of the month, largely driven by concerns over demand slowdown (Chart 6a). Crude oil prices traded below US$ 100 per barrel with heightened volatility due to expectations of an imminent slowdown in global demand. Brent crude prices broke below the key support of US$ 90 per barrel on September 7 – the first time since February. The decision of Organization of Petroleum Exporting Countries (OPEC) to cut output by 1,00,000 barrels per day reignited supply concerns. Crude oil prices have recorded a 21.5 per cent gain year to date (up to September 14, 2022) (Chart 6b). 
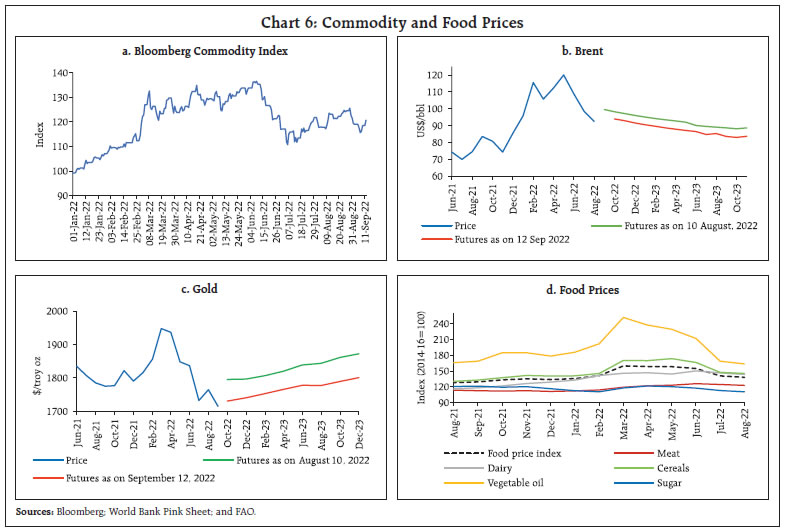 Gold prices lost the momentum gained in early August and fell by close to 4 per cent in the second half of August due to the stronger US dollar and rising US 10-year G-sec yields (Chart 6c). The FAO food price index registered its fifth consecutive monthly decline as it dropped by 1.9 per cent in August 2022, marked by fall in all its five sub-indices7 (Chart 6d). Inflation remained elevated much above targets/tolerance levels in both AEs and emerging market economies (EMEs), driven up by energy and food prices (Chart 7). The US headline CPI inflation (y-o-y) moderated to 8.3 per cent in August 2022 from 8.5 per cent in July while core CPI accelerated to 6.3 per cent in August. Inflation in the US measured by the y-o-y change in the personal consumption expenditure (PCE) price index moderated to 6.3 per cent in July 2022 from 6.8 per cent in June with a monthly momentum of -0.1 per cent as energy prices decreased 4.8 per cent (m-o-m) while food prices increased 1.3 per cent. Core PCE inflation also decelerated to 4.6 per cent in July 2022 from 4.8 per cent a month ago as the monthly momentum of 0.1 per cent was cloaked by a favourable base effect. On the other hand, Euro area annual inflation shot up to a record high of 9.1 per cent in August, primarily driven by high energy prices followed by those of food, alcohol and tobacco. CPI inflation in the UK eased to 9.9 per cent (y-o-y) in August 2022 from its double digit peak in July due to moderation in motor fuel prices. 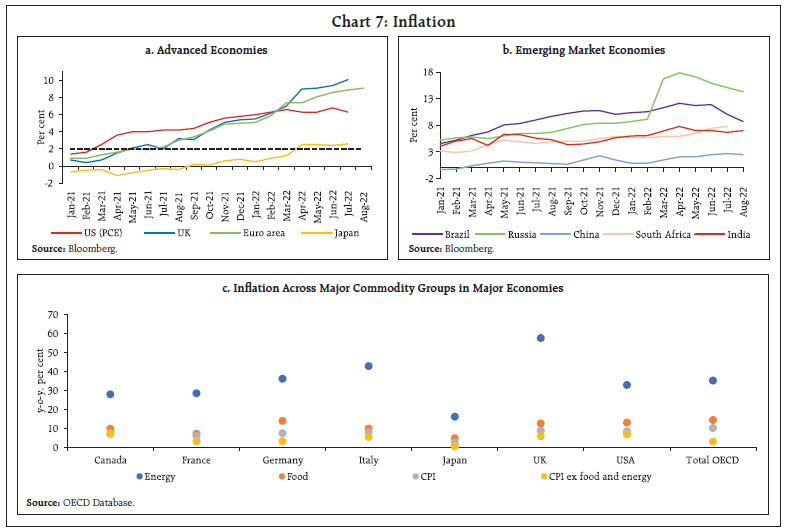 Among the BRICS economies, inflation in Brazil eased to 8.7 per cent in August from 10.1 per cent in July, while in China it eased to 2.5 per cent (Chart 7b). In Russia, inflation softened further to 14.3 per cent in August from 15.1 per cent in July. Global equity markets, which were on an uptrend from mid-June to early-August, started to edge down in the second half of August. The MSCI world equity index retracted its gains, ending the month 3.9 per cent lower than in July. The decline was primarily driven by the AEs sub-index while emerging market equities managed to hold on to the levels in the previous month (Chart 8a). In the bond market, 10-year G-sec yields hardened across major AEs reflecting central banks’ hawkish stance as inflation edged up. The 10-year US Treasury yield shot up by 54 basis points in August while the 2-year G-sec yield rose by 61 bps, thus widening the gap between the two and leading to a steeper inverted yield curve (Chart 8b). The US dollar continued its rally in August and early September on the Federal Reserve’s hawkish tone and on safe haven demand. Concomitantly, the MSCI currency index for EMEs declined in August and early September due to equity and debt outflows from EMEs (Chart 8c & 8d). Central banks of most AEs and EMEs have undertaken aggressive monetary tightening to bring down inflation. The European Central Bank (ECB) hiked its policy rate by a record 75 bps as a frontload measure and hinted at further rate increases to dampen demand and guard against the risk of persistent upward shift in inflation expectations. The Bank of England raised its policy rate in August by 50 bps and indicated commencement of gilt sales after its September meeting. The Bank of Canada also hiked by 75 bps in September on persistent inflation, especially core inflation. Reserve Bank of Australia increased its cash rate by 50 bps in September to contain rising inflation. Israel and Iceland raised its policy rate by 75 bps while New Zealand and Norway increased by 50 bps each in August. Japan, however, continued to buck the trend by maintaining an accommodative stance. 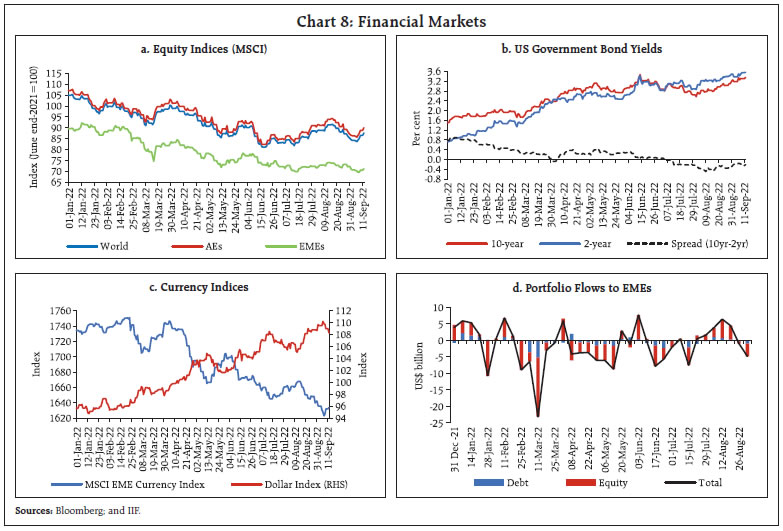
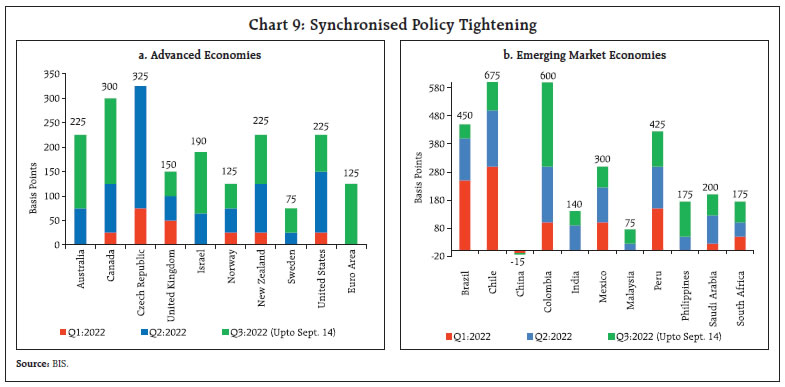 Most EME central banks have also continued with policy tightening (Chart 9). Indonesia embarked on the policy tightening route with a 25 bps increase, the first increase since 2018. Turkey remained an outlier by cutting its rate by 100 bps. China also continued with its monetary policy easing cycle by reducing the 1-year Loan Prime Rate (LPR) by 5 bps and the 5-year LPR benchmark for pricing of mortgages by 15 bps in August. III. Domestic Developments The Indian economy continued to tread a path of recovery in 2022-23 in spite of some loss of momentum due to global headwinds. Our economic activity index that employs a dynamic factor model (DFM) with 15 high frequency indicators indicates range bound performance during May to July (Chart 10). Under alternative model specifications, GDP growth for Q2:2022-23 is nowcast at 6.8 per cent (Chart 11). A fuller assessment of Q2 GDP with a wider set of information and indicators will be presented in MPC resolution of September 30, 2022.
Aggregate Demand The quarterly estimates released by the National Statistical Office (NSO) showed that the Indian economy clocked a growth of 13.5 per cent in Q1:2022-23, aided by a favourable base effect (Chart 12). By June 2022, GDP was 3.8 per cent higher than its pre-pandemic level (Q1:2019-20). Private consumption, which registered a growth of 25.9 per cent in Q1:2022-23, was the major driver. Buoyed by the government’s thrust on infrastructure, gross fixed capital formation (GFCF) recorded a growth of 20.1 per cent in Q1:2022-23. This was also reflected in a sharp acceleration in proximate coincident indicators – steel consumption; cement production; and imports of capital goods. With the growth of imports outpacing that of exports, net exports contributed negatively in Q1:2022-23. Indian companies, listed non-financial private and government companies’ sales growth (y-o-y) surged by 41.0 per cent and 73.6 per cent, respectively, in Q1:2022-23. Even adjusted for inflation, sales growth remained in high double digits. Operating profit margins of both government and private companies have come under some pressure in the face of an across-the-board rise in variable costs of production, including raw materials (Chart 13). With global commodity prices moderating and domestic inflationary pressures easing, operating margins are expected to go up going forward.
High frequency indicators of economic activity indicate continued recovery albeit at a slower pace in Q2:2022-23. Both inter and intra-state E-way bills generation picked up sequentially in August 2022 (Chart 14a). Toll collections increased in both volume and value terms over the previous month (Chart 14b). Fuel consumption increased in August, helped by an increase in off-take of petrol and aviation turbine fuel (ATF) consumption, even as high-speed diesel used in transport vehicles, recorded a marginal dip (Chart 15a). The automobile sector continued to gain momentum in August with supply bottlenecks coming to a near end. Within passenger vehicles, the entry level segment (in the range of under 3600 mm) picked up in August, reaching about 75 per cent of pre-pandemic sales domestically (Chart 15b). Retail sales of automobiles picked up in August as registration of both transport and non-transport vehicles recorded expansion on account of the beginning of the festive season, new product launches and easing supply constraints (Chart 15c). The rural sector also exhibited robust demand, with sales of two wheelers and three wheelers picking up sequentially, the latter recording the highest sales in 30 months. Other indicators, viz., domestic sales of two wheelers continued to cross pre-pandemic levels, even as tractor sales remained muted due to uneven spread of monsoon (Chart 15d). 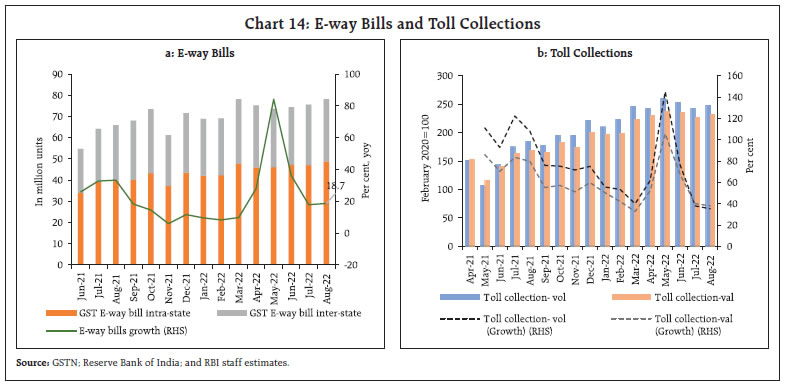 FMCG sales recovered in August 2022, with festive season bumping demand. Rural consumption recording an upturn, aided by good monsoon and cash earnings. Total FMCG sales recorded a value growth by 6.3 per cent in August on a m-o-m basis8. Demand is expected to sustain in the coming months, with the festival season, normal monsoon and cooling commodity prices expected to boost FMCG sales. GST collections (Centre plus states) stood at ₹1.44 lakh crore in August 2022, surpassing ₹1.4 lakh crore for the sixth consecutive month, with a y-o-y growth of 28.2 per cent (Chart 16).
As per the household survey of the Centre for Monitoring Indian Economy (CMIE), the labour participation rate improved to 39.2 per cent in August 2022 from 39.0 per cent a month ago while the employment rate fell by 0.3 percentage points. As a result of these developments, the unemployment rate rose from 6.8 per cent in July to 8.3 per cent (Chart 17). While the rise in unemployment in August has a strong seasonal component, it is equally spread across rural and urban areas (Annex). Demand for work under the Mahatma Gandhi National Rural Employment Guarantee Scheme (MGNREGS) continued to show a decline in August with a y-o-y reduction of 36.4 per cent indicating availability of gainful employment opportunities in agriculture and farm sectors (Chart 18).
In terms of the organised sector employment outlook, the Purchasing Managers’ Index (PMI) employment sub-index for manufacturing moderated while the services sector employment PMI recorded a 14-year high, led by improvement in the outlook for consumer services (Chart 19). The organised job market, as captured by the social security schemes such as Employees’ Provident Fund Organisation (EPFO), Employees’ State Insurance Corporation (ESIC) and National Pension System (NPS), however, shows a mixed picture in Q1:2022-23 (Chart 20).
The ripple effect of the global trade slowdown was also felt on India’s merchandise exports. Exports witnessed muted growth of 1.6 per cent on y-o-y basis, however, declined sequentially (11.8 per cent) and stood at US$ 33.9 billion in August 2022 (Chart 21). Disaggregated commodity-wise data reveal that export of engineering goods, textile, cotton and plastics, which account for one-third of the total export basket contracted on both sequential and y-o-y bases (Table 1). Petroleum exports at US$ 5.7 billion declined sequentially by more than one-fourth in August 2022. Non-oil exports (US$ 28.2 billion) witnessed a contraction of 1.8 per cent on y-o-y basis after 23 months of consecutive expansion.
Destination-wise, India’s exports to the UAE have increased by 28.5 per cent during April - July 2022 on a y-o-y basis reflecting the positive impact of India – UAE Comprehensive Economic Partnership Agreement (CEPA). India’s merchandise imports surpassed US$ 60 billion for the sixth consecutive month, although they lost momentum in August 2022 (Chart 22).
Disaggregated analysis reveals that barring gold, imports of all commodity groups grew on a y-o-y basis (Table 1). Moreover, major imported commodities such as electronic goods, coal, and machinery, accounting for around one-fifth of India’s total imports, are trending above their five-year average growth (Chart 23). Oil imports remained elevated during April-August 2022. In August 2022, India’s oil imports grew by 87.4 per cent on a y-o-y basis in value terms. Robust electronics import growth reflects inventory management aligned to cater to the growing upcoming demand in the festival season. Coal imports at US$ 4.5 billion declined on a sequential basis, partly due to the government’s decision to revoke mandatory blending requirements. Earlier in April 2022, the Ministry of Power had mandated that power plants should import 10 per cent coal for blending purposes in view of its domestic shortage. Gold import during July-August 2022 declined by around half to US$ 5.9 billion, reflecting a hike in the import duty. India’s trade deficit more than doubled to US$ 28.0 billion in August 2022 from US$ 11.7 billion in the corresponding period a year ago. Moreover, the trade deficit during the first five months of 2022-23 widened to US$ 124.5 billion from US$ 54 billion in the previous corresponding period (Chart 24). During April-July 2022-23, the Centre’s gross fiscal deficit (GFD) remained contained at 20.5 per cent of BE as against 21.3 per cent a year ago, on the back of robust tax collections and lower revenue spending. The expenditure thrust remained geared towards capital spending, with the y-o-y growth in capital outlay at 59.4 per cent (Chart 25).
On the receipts side, gross tax revenue continued to witness double digit growth, with direct and indirect taxes registering a y-o-y growth of 41.9 per cent and 11.0 per cent, respectively, despite contraction in customs and excise duties (Chart 26). According to the provisional figures of direct tax collections, 37.2 per cent of the budgeted estimates have been collected up to September 08, 2022. The key budgetary deficits of the States continued to decline during April-July.9 Further, the proportion of the consolidated budgeted gross fiscal deficit (GFD) of the states was lower than the corresponding period last year, thereby, improving their likelihood of staying within their consolidated budgeted GFD target of 3.3 per cent of GSDP10 for 2022-23 (Chart 27a). This improvement was primarily led by sustained and robust growth in the revenue receipts at 29.6 per cent in April-July spread across all sub-components - tax revenue and non-tax revenue as well as grants from the Centre. The y-o-y growth in revenue expenditure was slightly higher in April-July 2022-23. However, the capital outlay by the States suffered a downturn and moved into negative territory (Chart 27b). In August 2022, the Centre released two instalments of tax devolution amounting to ₹1.16 lakh crore to the States, which is likely to support States in accelerating their capital outlay. Aggregate Supply Aggregate supply, measured by the gross value added (GVA) at basic prices, expanded by 12.7 per cent in Q1:2022-23 (Chart 28). While agriculture and services sectors remained robust, industrial growth moderated due to escalation of input cost pressures and disruptions in global supply chains. Agriculture continues to show resilience against uncertainties around rainfall distribution (Chart 29). The south-west monsoon, which trailed its long period average (LPA)11 by 8.0 per cent in June, recovered subsequently to 5.0 per cent above LPA as on September 9, 2022. The spatial distribution of rainfall has, however, been uneven this year so far and the production weighted rainfall index (PRN)12 has remained below the Indian Meteorological Department’s aggregate rainfall index (Charts 30a & b). Specifically, rainfall in major States cultivating water intensive crops like rice and sugarcane remained below their respective long period average (Chart 30c). 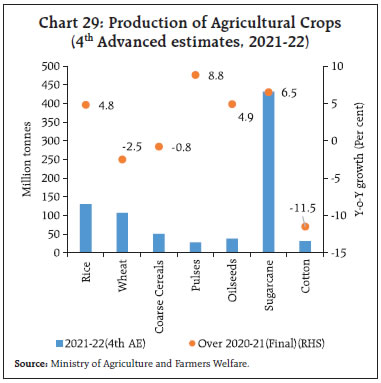
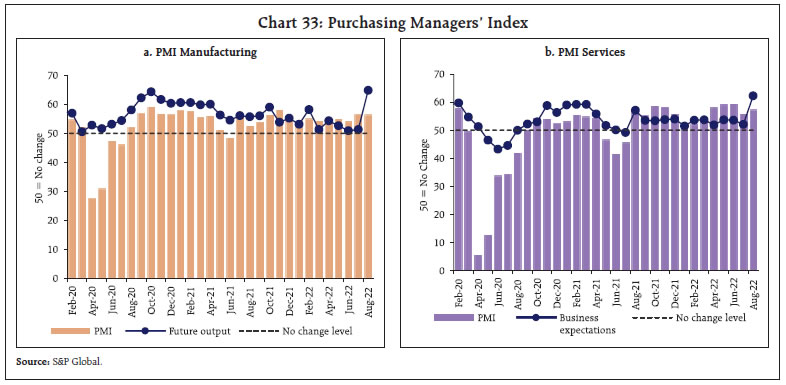
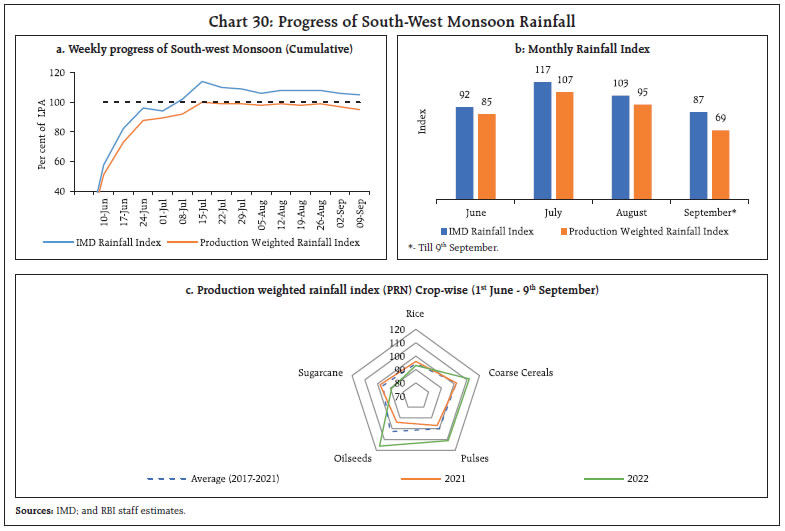 Four major States, namely, Uttar Pradesh, Bihar, Jharkhand and West Bengal, which together produce nearly a third of the country’s total foodgrains, recorded significantly lower rainfall this year so far (18-46 per cent below normal). The current reservoir levels in these States also remained lower vis-à-vis their 10-year average levels, which may impact rabi crops going forward. State governments have been proactive in implementing risk mitigating strategies such as West Bengal’s announcement to restore defunct irrigation installations and Bihar’s provision of diesel subsidy to step up irrigation efforts. Nevertheless, overall kharif acreage stood marginally lower than last year (as on September 09, 2022). While sown area under coarse cereals, cotton and sugarcane recorded positive growth, it declined in the case of rice, pulses, and oilseeds (Chart 31). Wheat procurement for the current rabi marketing season (2022-23) ended at 18.8 million tonnes, which is 43.4 per cent of the amount procured last year. The cumulative procurement of rice at 59.2 million tonnes is marginally higher than last year. As on August 31, 2022, the stock of rice in the central pool is 2.6 times the quarterly (July-September) buffer norm while in the case of wheat, it has fallen below the buffer norm (Chart 32). In the wake of the expected fall in domestic production, the Government imposed a duty of 20 per cent on export of most varieties of rice and restricted the exports of broken rice with effect from September 9, 2022. 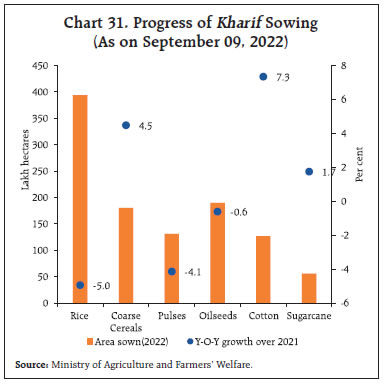 In the industrial sector, the headline manufacturing PMI at 56.2 in August remained in expansionary zone, albeit decelerating over the previous month. Consolidation of demand along with cooling of input prices boosted sentiments, pushing the future output sub-index to a six-year high of 64.8 in August 2022 (Chart 33a). The PMI services, on the other hand, recorded strong expansion at 57.2 in August 2022 from a four-month low of 55.5 in July. The upturn was attributed to robust demand, stronger gains in new businesses and job creation (Chart 33b). 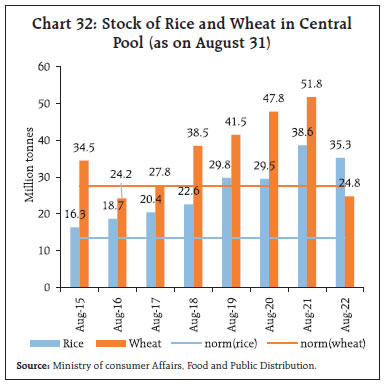
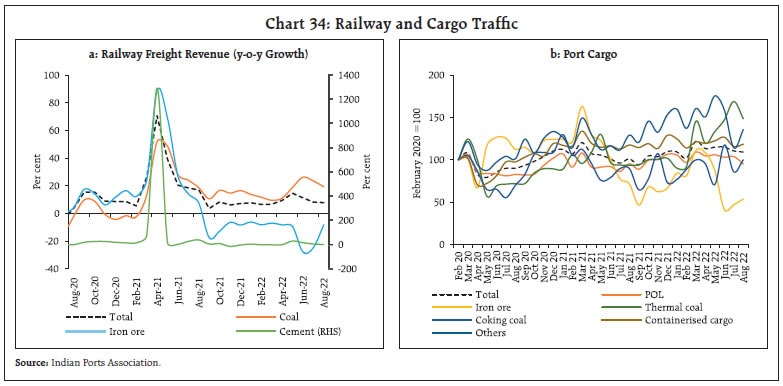 In the services sector, transport indicators remained in expansionary zone as railway freight traffic earnings grew by 7.8 per cent (y-o-y) in August 2022 (Chart 34a). While coal and fertilisers recorded sharp expansion, iron ore and food grains continued to show contraction. Cargo traffic at major ports recorded slight moderation in August owing to a decrease in iron ore and raw fertilisers, which together account for around 21 per cent of total cargo (Chart 34b). In the construction sector, activity maintained its expansion path during July – August 2022, with cement production and steel consumption recording growth over pre-pandemic levels for eight and eleven straight months respectively (Chart 35). Cement production recorded moderation in July as construction activity slowed down due to monsoon rains. Within the aviation sector, domestic passenger footfalls recorded expansion by 0.7 per cent in August, after contraction in July. All other segments, viz., international passenger traffic, and domestic and international cargo exhibited contraction in August over July. Housing remained robust on the back of sustained demand. The number of residential property registrations in ten major cities reached a new high during Q1:2022-23 and surpassed the pre-pandemic peak by over 50 per cent (Chart 36). The all-India House Price Index (HPI)13 recorded 3.5 per cent annual (y-o-y) growth and 2.2 per cent sequential (q-o-q) growth in Q1:2022-23 (Chart 37).
High frequency indicators witnessed moderation in economic activities in July amidst slowing global economy and inflationary pressures (Table 2). Overall sustained recovery in services sector may cushion a moderation in manufacturing sector.
Inflation As per the provisional data released by the National Statistical Office (NSO) on September 12, 2022, inflation edged up to 7.0 per cent in August from 6.7 per cent in the previous month (Chart 38a). A momentum (month-on-month change in index) of around 50 bps was partially offset by a favourable base effect (month-on-month change in prices a year ago) of around 20 bps, leading to an increase in headline inflation by around 30 bps between July and August. Among the major groups, m-o-m increases in prices were of the highest order for food and beverages (0.7 per cent), followed by core CPI (0.4 per cent). The fuel and light category, on the other hand, registered a decline by 0.4 per cent (Chart 38b). At the disaggregated level, cereals, pulses, spices and vegetables exhibited significant price pressures during the month whereas fruits, edible oils, eggs, meat and fish recorded m-o-m decline in prices (Chart 39). The sharp increase in CPI food inflation (y-o-y) to 7.6 per cent in August from 6.7 per cent a month ago was driven by higher inflation in cereals, milk, fruits, pulses, vegetables, spices and prepared meals (Chart 40). On the other hand, inflation softened in meat and fish, edible oils, sugar and non-alcoholic beverages. Deflation in eggs deepened in August vis-à-vis July.
After increasing for three consecutive months, inflation in the fuel and light category moderated to 10.8 per cent in August from 11.8 per cent in July. This was led by a sharp decline in kerosene (PDS) inflation even as Liquified Petroleum Gas (LPG) inflation remained elevated. Electricity prices remained in deflation. Despite the moderation in inflation, the fuel group contributed 10.4 per cent of headline inflation in August due to its weight of 6.8 per cent in the CPI basket. Core inflation softened marginally to 5.9 per cent from 6.0 per cent during the previous two months. While sub-groups such as housing, household goods and services, education, and personal care and effects registered an increase in inflation, pan, tobacco and intoxicants, transport and communication, and recreation and amusement witnessed moderation. Inflation in clothing and footwear, and health sub-groups remained range-bound. Within the core category, inflation in goods continued to remain higher than services (Chart 41). In terms of geographical distribution, rural inflation (7.2 per cent) was higher than urban inflation (6.7 per cent) in August. Across the States, there has been wide variation in rates of inflation with Goa and Manipur recording below 4 per cent inflation while Gujarat, Telangana and West Bengal exhibited inflation in excess of 8 per cent (Chart 42). High frequency food price data for September so far (September 1-12) from the Department of Consumer Affairs (DCA) point to an increase in prices of cereals, primarily on account of a surge in wheat prices. Price of pulses registered a broad-based increase while edible oil prices registered a decline in tandem with decline in international edible oil prices. Among key vegetables, potato and onion prices continued to harden. Tomato prices exhibited a sharp reversal after the fall witnessed during July-August due to heavy rains in key tomato producing areas (Chart 43). Retail selling prices of petrol and diesel in the four major metros remained the same in September so far. While kerosene prices moderated vis-à-vis August, LPG prices were steady in the first half of September (Table 3).
| Table 4: Petroleum Product Prices | | Item | Unit | Domestic Prices | Month-over-month (per cent) | | Sep-21 | Aug-22 | Sep-22^ | Aug-22 | Sep-22 | | Petrol | ₹/litre | 102.30 | 102.92 | 102.92 | -0.5 | 0.0 | | Diesel | ₹/litre | 92.62 | 92.72 | 92.72 | -0.4 | 0.0 | | Kerosene (subsidised) | ₹/litre | 33.18 | 62.73 | 60.13 | -12.2 | -4.2 | | LPG (non-subsidised) | ₹/cylinder | 895.13 | 1063.25 | 1063.25 | 0.8 | 0.0 | ^: For the period September 1-12, 2022.
Note: Other than kerosene, prices represent the average Indian Oil Corporation Limited (IOCL) prices in four major metros (Delhi, Kolkata, Mumbai and Chennai). For kerosene, prices denote the average of the subsidised prices in Kolkata, Mumbai and Chennai.
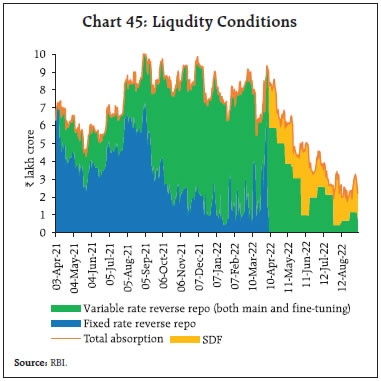
Sources: Indian oil corporation limited (IOCL); Petroleum Planning and Analysis Cell (PPAC); and RBI staff estimates. | Input cost pressures increased in August 2022 across manufacturing and services, albeit at a slower pace, as reflected in the PMIs. Selling prices also edged up across manufacturing and services (Chart 44). IV. Financial Conditions Absorptions under the liquidity adjustment facility (LAF) moderated to ₹2.6 lakh crore during August 16 to September 14, 2022 from ₹2.7 lakh crore during July 16 to August 15, 2022 (Chart 45). Of the daily average surplus liquidity during this period, nearly ₹1.6 lakh crore was absorbed through the overnight standing deposit facility (SDF), while the remaining was mopped up through variable rate reverse repo (VRRR) auctions (both main and fine-tuning) of longer tenor at an average effective absorption rate14 of 5.24 per cent. In view of anticipated liquidity tightness, a reduction in banks’ appetite to park funds under fortnightly auctions is evident in lower bid-cover ratios. The 14-day VRRR operations conducted on August 26 and September 9 saw lukewarm response: both the auctions elicited ₹70,331 crore and ₹33,392 crore, respectively, as against the notified amount of ₹2.0 lakh crore each, at a weighted average rate of 5.39 per cent each. 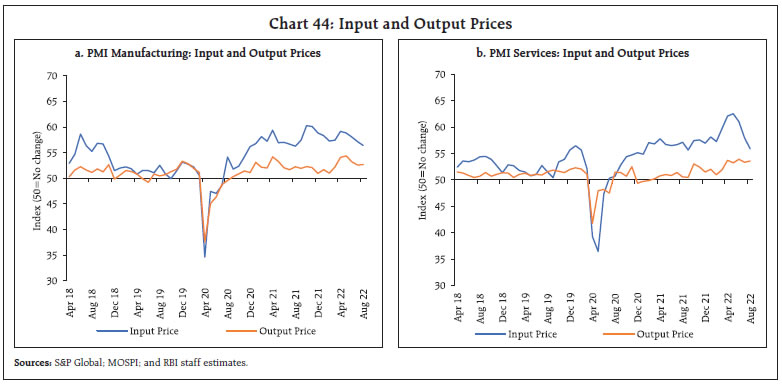
 The weighted average call rate (WACR) traded on average 28 bps below the policy repo rate and 3 bps below the SDF rate during the second half of August through September 14, 2022 as against 13 bps below the policy repo rate and 12 bps above SDF in the previous fortnight (Chart 46a). In the collateralised segment, tri-party rate and market repo rate traded within the LAF corridor – on average, 22 bps and 19 bps, respectively, below the policy repo rate – during the same period (Chart 46b). The 3-month treasury bill (T-bill) rate traded closer to the marginal standing facility (MSF) rate while yields on 3-month certificates of deposit (CDs) and 3-month commercial paper (CPs) traded on average 29 bps and 62 bps, respectively, above the MSF rate (Chart 39b). In the primary market, fund mobilisation through CP issuances increased to ₹1.51 lakh crore during August 2022 as compared with ₹94,599 crore in the preceding month, though it remained lower than in the corresponding period a year ago (₹2.21 lakh crore). The bulk of the primary issuances was in the 31-90 days maturity segment. 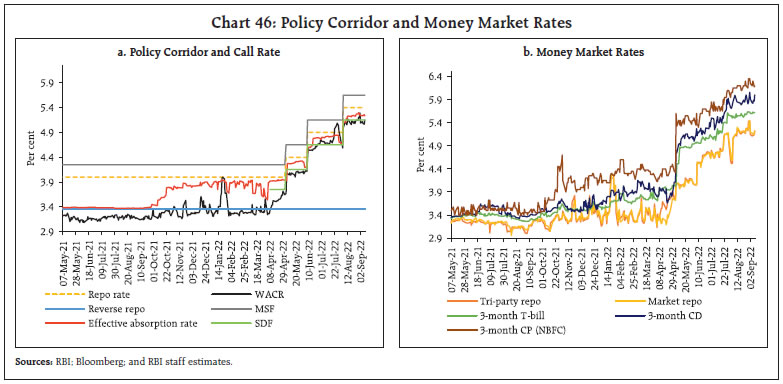
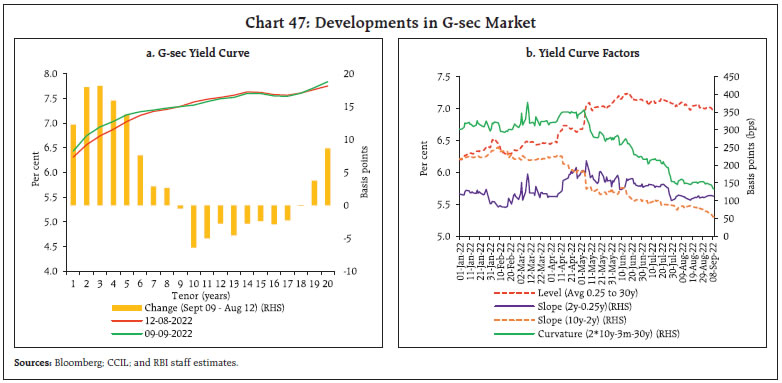 In the fixed income market, bond yields at the long end of the curve generally softened, with the yield on new 10-year benchmark G-sec (7.26 GS 2032) closing at 7.12 per cent on September 14, 2022. During the period August 16 to September 9, 2022, yields increased intermittently on the back of hawkish commentary by Fed officials on US monetary policy. The pressure from hardening of US bond yields was, however, offset by easing crude oil prices. Rising expectations over likely inclusion of India’s bond in global bond indices also kept sentiment upbeat. At the same time, the short end of the curve steepened, with rates hardening for tenors up to 8 years (Chart 47a). Consequently, the slope – as measured by the spread between the 10-year and 2-year G-sec yields – further flattened, reflecting the impact of monetary tightening (Chart 47b). While the upward shift in the level of the yield curve is consistent with a declining slope (as measured by the 10-year minus 2-year spread) since April, a perceptible decline in the curvature15 is evident since the May policy meeting, indicating subdued expectations of further policy tightening. Overall, the yield curve suggests an improvement in long-term growth prospects and moderation in ex ante inflation expectations.16 Corporate bond yields generally softened or changed marginally in tandem with G-sec yields across tenors and the rating spectrum (Table 4). Credit risk premium also softened marginally during the same period. Corporate bond issuances jumped to ₹69,166 crore during July 2022 (the highest so far in 2022-23), more than doubling from ₹31,889 crore a year ago. Over the last couple of months, the decline in corporate bond yields suggests stable risk premia, which has attracted large corporates to mobilise funds from the bond market. | Table 4: Financial Markets - Rates and Spread | | Instrument | Interest Rates
(per cent) | Spread (bps)
(Over Corresponding Risk-free Rate) | | Jul 16 - Aug 15 2022 | Aug 16 - Sept 09 2022 | Variation (in bps) | Jul 16 - Aug 15 2022 | Aug 16 - Sept 09 2022 | Variation (in bps) | | 1 | 2 | 3 | (4 = 3-2) | 5 | 6 | (7 = 6-5) | | Corporate Bonds | | (i) AAA (1-year) | 6.63 | 6.90 | 27 | 28 | 46 | 18 | | (ii) AAA (3-year) | 7.32 | 7.32 | 0 | 41 | 41 | 0 | | (iii) AAA (5-year) | 7.51 | 7.43 | -8 | 30 | 29 | -1 | | (iv) AA (3-year) | 8.04 | 8.06 | 2 | 113 | 115 | 2 | | (v) BBB- (3-year) | 11.72 | 11.73 | 1 | 481 | 482 | 1 | | 10-year G-sec | 7.33 | 7.22 | -11 | | | | Note: Yields and spreads are computed as monthly averages.
Source: FIMMDA; and Bloomberg. | Reserve money (RM) excluding the first-round impact of change in cash reserve ratio (CRR) rose by 8.4 per cent on a y-o-y basis as on September 2, 2022 (9.3 per cent a year ago) [Chart 48]. Currency in circulation (CiC), the largest component of RM, grew at 8.3 per cent (9.4 per cent a year ago). Money supply (M3) – the liabilities of the banking sector – registered growth of 8.9 per cent as on August 26, 2022 (9.5 per cent a year ago). Scheduled commercial banks’ (SCBs’) credit growth surged to 15.5 per cent as on August 26, 2022 (6.7 per cent a year ago). Metropolitan branches of banks, which account for over 60 per cent of bank credit and over half of bank deposits, have been the major drivers of growth of banking business. During April to July 2022, when the policy repo rate was increased by 90 bps, the weighted average lending rates (WALRs) on fresh and outstanding rupee loans of SCBs increased by 55 bps and 27 bps respectively (Table 5). Besides, major banks have fully adjusted their external benchmark-based lending rates (EBLRs) upwards by a total of 140 bps at end-August. During April to August 2022, the 1-year median marginal cost of funds-based lending rate (MCLR) of SCBs increased by 55 bps. | Table 5: Transmission from the Repo Rate to Banks’ Deposit and Lending Rates | | (Variation in Basis Points) | | Period | Repo Rate | Deposit Rates | Lending Rates | | Median TDR (Fresh Retail Deposits) | WADTDR (Outstanding Deposits) | 1–Year MCLR (Median) | WALR (Fresh Rupee Loans) | WALR (Outstanding Rupee Loans) | | April to August 2022* | 140 | 24 | 19 | 55 | 55 | 27 | | Memo | | | | | | | | April 2022 | 0 | 0 | 0 | 0 | -12 | -2 | | May to August 2022* | 140 | 24 | 19 | 55 | 67 | 29 | * Latest data on WALRs and WADTDR pertain to July 2022 and hence 50 bps hike in repo rate in August is not captured in pass-through to WALRs and WADTDR.
WALR: Weighted average lending rate; WADTDR: Weighted average domestic term deposit rate.
MCLR: Marginal cost of funds-based lending rate; TDR: Term deposit rate.
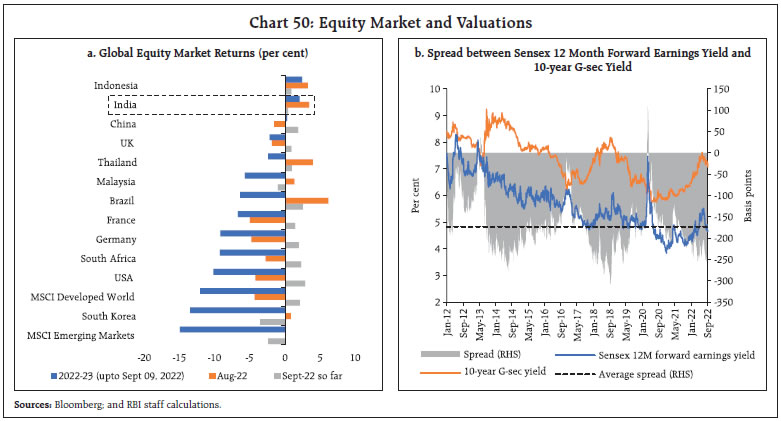
Source: RBI staff estimates. | The moderation in systemic liquidity, coupled with increase in credit demand, has prompted banks to increase their deposit rates to mobilise stable funding. Median term deposit rates – card rates on fresh retail deposits – has increased by 24 bps during April to August 2022. The increase in interest rates on bulk deposits is even higher. Available information indicates that major banks have increased their bulk deposit rates (1 to 2 year tenor) by up to 200 bps since April 2022. At the bank group level, transmission to lending and deposit rates was the maximum in the case of foreign banks, reflecting a higher share of low cost and lower duration wholesale deposits in their total liabilities (Chart 49). Across domestic banks, public sector banks were relatively quicker in passing the repo rate hikes to lending rates for new borrowers as compared with private banks. The Indian equity market bagged positive returns for the second consecutive month in August 2022, with the BSE Sensex gaining by 3.4 per cent. The markets commenced the month on a bullish note in response to strong GST collections and higher than expected domestic manufacturing PMI data for July. Shrugging off weak global cues following US-China tensions, domestic equities continued to trade in the green amidst foreign portfolio investors (FPI) buying, softening domestic inflation and buoyant retail sales. The market felt jitters toward the end of the month in lockstep with Asian peers following hawkish statements on future rate hikes from the US Fed and the European Central Bank (ECB). After a rough start, domestic equities rebounded in September, with the BSE Sensex gaining by 0.4 per cent to close at 59,793 on September 9, 2022 amidst easing commodity prices. In 2022-23 so far, Indian equities have shown resilience relative to most of advanced and EME peers (Chart 50a). Consequently, valuations continued to remain elevated, with the Sensex 12-month forward price to earnings ratio increasing to 21.6x, driving the bond yields-earnings yield gap17 to 2.5 per cent, which is 75 bps more than its long-term average of 1.7 per cent (Chart 50b). 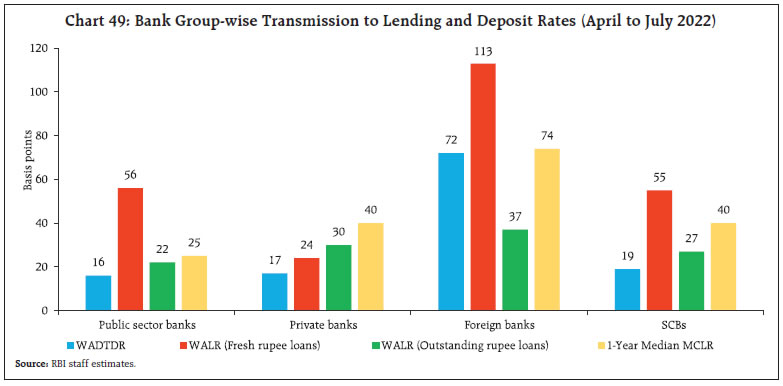
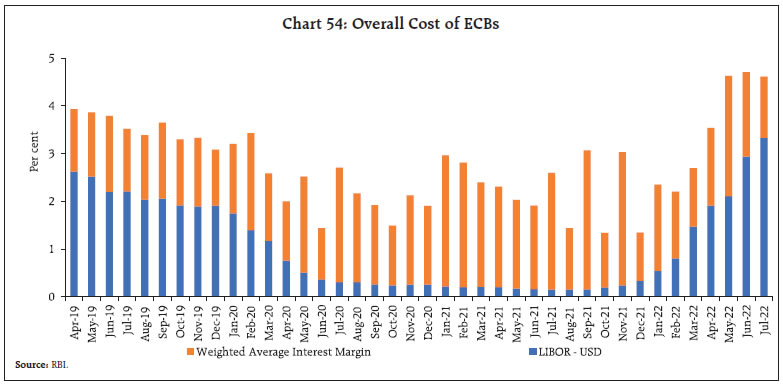
 FPIs continued to be aggressive buyers of Indian equities and pumped ₹53,994 crore in August. On the other hand, domestic institutional investors (DIIs) turned net sellers in August 2022 to the tune of ₹7,069 crore after making heavy purchases in the equity market for 17 consecutive months which largely absorbed the selling pressure by FPIs (Chart 51a). Furthermore, FII investment in the Indian capital market through participatory notes dipped to ₹75,725 crore at end-July 2022, the lowest level in 2 years (since October 2020) after the third consecutive month of decline (Chart 51b). However, retail investors continued to enter the domestic equity market with the number of demat accounts hitting the 100 million milestone in August 2022. 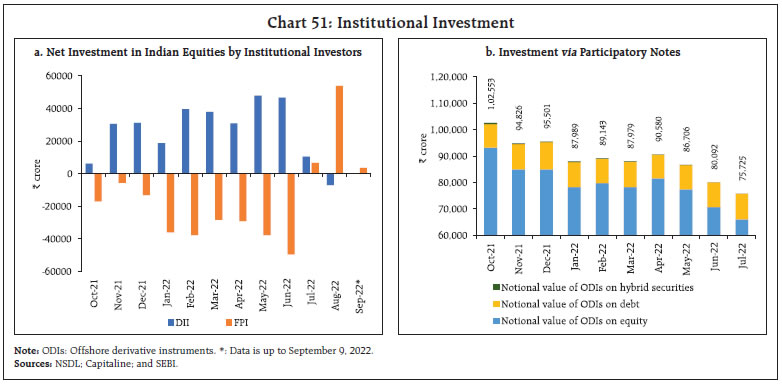 Gross inward foreign direct investment (FDI) at US$ 29.2 billion during April-July 2022 was higher than its level a year ago (Chart 52). Similarly, net FDI increased to US$ 18.9 billion during this period from US$ 13.1 billion a year ago mainly on account of an increase in fresh equity inflows and a decline in outward FDI from India. Manufacturing, services, and retail and wholesale trade sectors received the major share of the FDI equity inflows during April-July 2022. Net purchases of US$ 6.8 billion in equities by FPIs in August 2022 were the highest since December 2020, higher than emerging market peers (Chart 53). The renewed portfolio interest in Indian equities may be attributed to strong corporate earnings and improvement in macro fundamentals. Financial services, power, and oil, gas and consumable fuels sectors were the biggest recipients of FPI equity inflows. FPIs also turned net buyers in the Indian debt market in August. 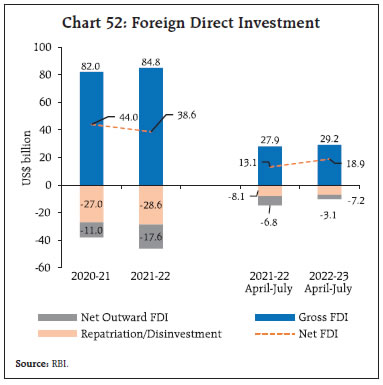 Gross external commercial borrowings (ECBs) to India moderated to US$ 5.6 billion during April-July 2022 from US$ 6.7 billion a year ago. ECBs, excluding inter-company borrowings, recorded net repayments of US$ 2.5 billion during this period as against net disbursements of US$ 1.6 billion a year ago. In July 2022, the major share of ECBs was raised for the purpose of on-lending/sub-lending, refinancing of earlier ECBs and working capital. Benchmark global rates have been rising in the recent period, with the London interbank offer rate (LIBOR) and the secured overnight financing rate (SOFR) increasing by 280 bps and 220 bps, respectively, between January 2022 to July 2022. The rise in overall cost of ECB loans has, however, been relatively moderate as the weighted average interest rate spread of ECBs (over benchmark interest rate) has been declining (Chart 54). 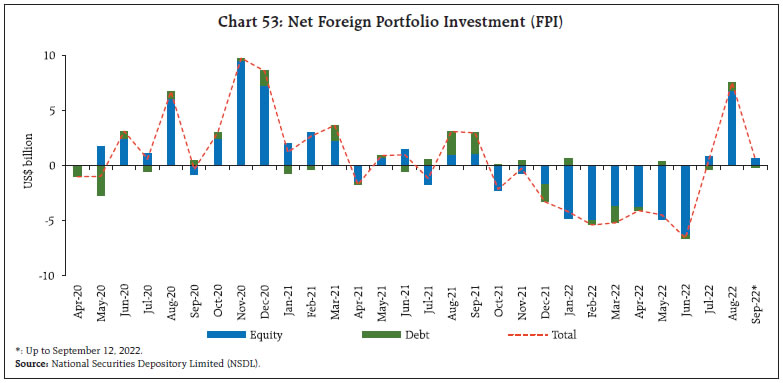
 Foreign exchange reserves at US$ 553.1 billion on September 2, 2022 were equivalent to 9 months of imports projected for 2022-23 (Chart 55).
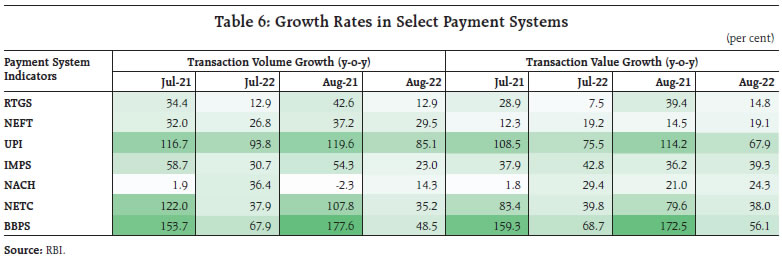
In the foreign exchange market, the Indian rupee (INR) appreciated by 0.1 per cent vis-à-vis the US dollar (m-o-m) in August 2022, despite strengthening of the US dollar (Chart 56). The INR appreciated in terms of the 40-currency real effective exchange rate (REER) in the month as it appreciated in nominal effective terms (Chart 57). Payment Systems In August 2022, the digital payment ecosystem, spanning large-value and retail segments, continued to gain stride in volume and value terms (y-o-y, Table 6). The Unified Payments Interface (UPI) sustained its run of record highs, with 658 crore transactions worth ₹10.73 lakh crore. Efforts toward expanding integration of the UPI beyond Indian borders are expected to turbocharge this growth momentum.18 The lowering of average monthly transaction values of the UPI and the Prepaid Payment Instruments (PPI-mobile wallets) suggest a growing shift towards retail digital modes for serving small-value transactional needs.19 Interestingly, the ticket size of cash withdrawals through the National Financial Switch (NFS) also waned, suggesting tapering of the pandemic-induced precautionary balances. Other retail payment modes such as the Immediate Payment Service (IMPS), the National Electronic Toll Collection (NETC), and the Bharat Bill Payment System (BBPS) exhibited strong growth (y-o-y), notwithstanding the high base a year ago. 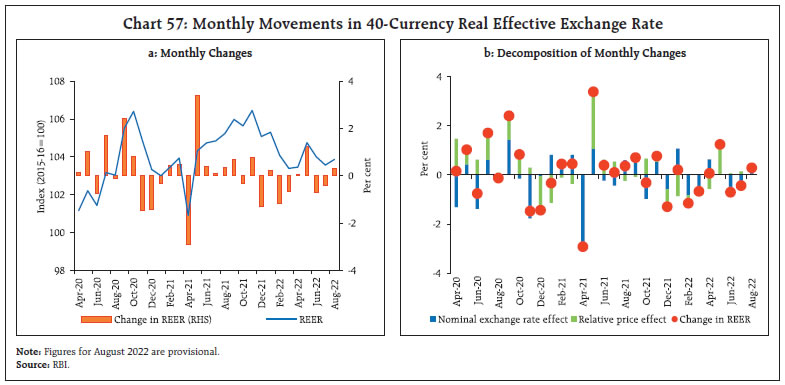
 Propelled by robust policy support, widespread technology adoption, and growing financial awareness, the Indian Fintech market is poised to clock US$ 1 trillion in assets under management (AUM) and US$ 200 billion in revenues by 2030, i.e., nearly a 10-fold jump from 2021 (US$ 100 billion and US$ 20 billion, respectively).20 A key FinTech component – digital lending – is expected to reach US$ 515 billion by 2030.21 In August, the Reserve Bank released three key initiatives aimed at altering the contours of the payments industry through a collaborative and calibrated approach. First, the ‘Discussion Paper on Charges in Payment Systems’ solicits review of feedback on various charges for payment services. Next, the Bank launched a pilot project for end-to-end digitalisation of Kisan Credit Card (KCC) lending to transform the rural credit delivery system. Finally, the Bank issued Regulatory framework on Digital Lending, based on the recommendations of a Working Group (Chairman: Shri. J. K. Dash).22 These measures include, inter alia, direct pass-through of loans from regulated entities to customers; adequate disclosures of the terms of loan arrangements; prohibition on automatic increase in credit limit without explicit consent; and need-based data collection with clear audit trails. Conclusion In the August edition of this article, we hypothesized that inflation peaked in April 2022 and thereafter there would be a grudging and uneven easing of the momentum of price changes. The August 2022 reading was largely in line with this prognosis – in fact, the momentum of headline inflation was unchanged from its June/July level of 0.5 per cent, but the fading away of base effects pushed up the headline by 30 basis points relative to July. There is, however, a resurgence of food price pressures, mainly stemming from cereals even as fuel and core components provided a modest measure of respite. Spatial unevenness in rainfall in September has set off an upsurge in prices of key vegetables, in particular, tomatoes. On the food front, furthermore, we need to brace up for the impact of the predicted delayed withdrawal of the monsoon. Barring these pressure points and the huge uncertainty surrounding energy prices in spite of the recent softening, we maintain our view that inflation momentum should ease in Q3 and turn mildly negative in Q4. With base effects being favourable in the second half of 2022-23, inflation should moderate, although upside risks are in the air. On the downside, imported inflation pressures are letting up, helped by the stability in the exchange rate, and input costs have eased, which could temper the pass through to selling prices. The less austere inflation outlook is also associated with an improvement in India’s net terms of trade, which should have favourable implications for the external current account balance. Most importantly, future prices for crude oil contracts over the next few months have softened. International prices of vegetable oils and fertilisers are also looking more benign than before. There are other bright spots too. In August, exports of petroleum products have rebounded y-o-y. New markets are opening up with free trade agreements. Overall, the export target of US$ 750 billion for goods and services for 2022-23 is appearing within reach. In addition, India is cementing its position as the top remittances’ receiver in the world, with inflows touching US$ 90 billion last year and set to create a new record. Overall, the current account deficit is expected to be within 3.0 per cent of GDP. With portfolio flows returning and foreign direct investment remaining strong, this order of deficit is eminently financeable. At this critical juncture, monetary policy has to perform the role of nominal anchor for the economy as it charts a new growth trajectory. The focus should be on being time consistent in aligning inflation with the target. In this context, front-loading of monetary policy actions can keep inflation expectations firmly anchored and reduce the medium-term growth sacrifice.
Annex Labour Market Data: Diverging Trends? The Ministry of Statistics and Programme Implementation (MoS&PI) on August 31, 2022 released the Quarterly Bulletin of the Periodic Labour Force Survey (PLFS)23 for urban areas pertaining to April-June 2022. The report shows an improvement in all the key labour market indicators viz., Labour Force Participation Rate (LFPR), Worker Population Ratio (WPR) and Unemployment Rate (UR) in the quarter ending June 2022 both sequentially and over the last year. The labour force participation rate increased from 47.3 per cent in January-March 2022 to 47.5 per cent in April-June 2022, while the worker population ratio strengthened from 43.4 per cent to 43.9 per cent in the same period. The unemployment rate, on the other hand, declined from 8.2 per cent in January-March 2022 to 7.6 per cent in April-June 2022. It also fell significantly below the levels recorded a year ago at 12.6 per cent. Since the official estimates of the labour market in India are usually available with a lag, information from various private sources of employment data is used to gauge trends in the labour market. Comparing the labour market data across PFLS and CPHS for urban areas at a quarterly frequency, it is found that while the labour participation rate has not recovered to its pre-pandemic level (January-March 2020) in both the datasets, the worker population ratio has crossed the pre-pandemic level only under the PLFS. While the worker population ratio for April-June 2022 under PLFS is 0.2 percentage points above the pre-pandemic level, it still lags by 2.6 percentage points under CPHS (Chart A1a). The perverse impact of the COVID-19 pandemic on the unemployment rate is similar across both the survey datasets. On the other hand, data from the PLFS shows a consistent decline in the quarterly unemployment rate in urban areas since April-June 2021 whereas the CPHS data shows that the unemployment rate, after falling initially in July-September 2021 quarter from the highs of the second wave of the pandemic, has remained stagnant around 7.5 per cent (Chart A1b). 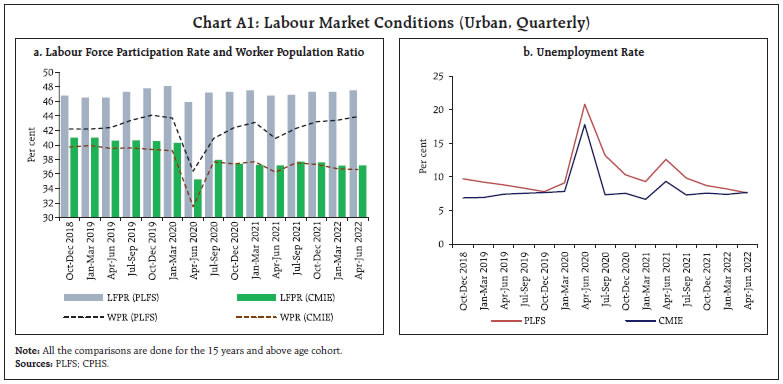 These discrepancies pose questions on the accuracy of employment data from various private sources. The PLFS adopts an internationally accepted methodology24 in assigning employment status to the survey participants. In the quarterly report for urban areas, PLFS follows the Current Weekly Status (CWS) methodology. Under this methodology, a person is considered employed if the individual engages in an income-generating activity for at least one hour of the past week. CPHS, on the other hand, considers a person employed only if the individual is engaged in any economic activity either on the day of the survey or on the day preceding the survey or is generally regularly engaged in an economic activity but did not work on any of these days only temporarily.25 This brings about differences in the labour market indicators. It is important to keep these issues in mind when using these datasets for understanding the labour market trends and formulating policies.
|