by Geetha Giddi^, Shweta Kumari^ and
Sasanka Sekhar Maiti^ This article attempts to extract economic signals from online print media, building on natural language processing techniques and fine-grained aspect-based sentiment analysis. The findings suggest that news sentiment is able to capture the changing patterns in various sectors of the economy and high degree of co-movement is seen with key macroeconomic indicators. The informative value contained in the news sentiment is examined through logistic and tree based modelling, and is found to predict the directional change in the corresponding target economic indicator, well in advance. Covid pandemic was echoed in downward tilt of sentiments and higher uncertainty. With gradual reopening and resumption of economic activities, sentiment trajectory reflected signs of recovery and a return towards normalcy. Introduction Official statistics are essential feed to the formulation of fiscal and monetary policy and their measurement is a meticulous task following a rigorous approach with data disseminated at deferred time stamps. In recent times, indicators drawn from non-traditional data sources have been extensively employed for gauging the current state of the economy. Such indicators have proven to have potential and capability in divulging robust signals on economic activities. They offer advantages in terms of near real time data availability and high frequency (and possibly economical in terms of cost) (Elgendy and Elragal 2014). With the increasing focus on analysing role of expectations channel in deciphering economic fluctuations and business cycles, sentiments derived from business tendency surveys and news media has gained traction in academic literature. News articles published in online print and electronic media deliberate on contemporary topics or specific topics of interest, and are one of the primary channels for expectations formation. Even during times when compilation of official statistics and conducting business and household surveys becomes challenging (e.g. Covid pandemic), news is available providing crucial information for assessment of economic situation (Buckman et al. 2020). Narrative content in news offers explanation for optimism or pessimism in sentiment formation, which is an added advantage. Growing literature on sentiment analysis has opened avenues for potential research in exploring interlinkages between sentiment and economic variables. Sentiment analysis is a well-researched subject in computational text analysis, with innovative Machine Learning (ML) and Natural Language Processing (NLP) capabilities. The broader aim is to extract emotions embedded in text and create a quantitative indicator measuring the intensity of sentiment. This article attempts to extract economic signals from online print media, building on natural language processing techniques and fine-grained aspect-based sentiment analysis. The natural design of news articles - unstructured, noisy, complex and influenced by a variety of factors - presents challenges and requires utmost effort in order to achieve efficiency. Insights present in the news text, available at high frequency, are assessed to capture the tangible effects for macroeconomic and business cycle indicators relevant from central banking perspective. Through this deep dive exercise, an effort is made to collate the scattered information contained in news, which can reflect media sentiment about economy on an ongoing basis and present the same in a systematic manner. As Covid has affected various segments of economy, a focussed evaluation is performed to examine the impact of Covid related disruptions on media sentiments. The study contributes to the growing literature by (i) exploring unstructured news as a potential source for sentiment on economic variables, (ii) utilising an array of big data tools and techniques for extracting sentiment and deriving sentiment indices, (iii) analysing the inter-dynamics of news sentiment and economic indicators using traditional statistical methods and ML model. To the best of authors’ knowledge, this study is one of its kind in terms of data, techniques and range of macro-economic variables (real, external and financial sector) in the Indian context. The rest of the article is structured as follows. Section II provides a review of relevant literature. The data and sentiment index construction are discussed in Section III. Methodology for examining interlinkages between sentiment and economic variables is discussed in Section IV. Empirical results and major findings are presented in Section V, and Section VI covers evolution of sentiments during Covid pandemic period. Section VII deliberates on plausible future research and concludes. II. Literature Survey and Cross Country Experience Sentiment can be measured in various forms and from varied sources. It can be in the form of perception about the current state of the economy, anticipated changes in near future and uncertainty. Sentiment may be adaptive or rational, backward or contemporary or future looking in nature. While acknowledging that there could be various indicators of sentiment, viz. forward-looking survey based indicators, financial market-based uncertainty indicators, newspaper-based economic policy uncertainty, we restrict the discussion to the main theme of study i.e. use of news-based sentiment in economic and financial domain. Literature studies suggest that confidence and sentiment measures are related to economic activity and establish causal link empirically. The theoretical perspective on “how” and “why” of such inter-dynamics is generally explained in terms of information aspect, which emphasizes the role of news in shaping up agents’ beliefs and their influence on economic activity subsequently. Effect of news-based sentiment indicators on economic activity, either alone or in combination with other economic data and survey based indicators, has been examined on a range of variables, including economic growth, industrial production, inflation, interest rate, consumption and financial conditions (Shapiro et al., 2017; Ardia et al. 20191; Kalamara et al., 2020; Aguilar et al., 2021). As the range of economic variables to which sentiment indicators are related vary, so are the nature of empirical designs used in literature studies. In addition to econometric methods such as linear regression, vector auto-regression, ARIMA, dynamic factor models (Shapiro et al. 2017, Ardia et al. 2019, Auguilar et al., 2021), usage of ML techniques has also been explored in literature for analysing linkages between sentiment and economic variables (Kalamara et al., 2020). One major finding common among these studies is, sentiments are strongly related with economic variables, in contemporous and near future horizon, and provide early signals about health of economy. In this sense, sentiments are considered to possess valuable information and therefore used as complementary high-frequency indicators by researchers and policymakers. Another interesting result that has emerged is, sentiments matter more when economy is going through a phase of stress or uncertainty (Nyman et al., 2018; Kalamara et al., 2020; Buckman et al., 2020), mostly because sentiment may be able to capture the fluctuations instantaneously, which may be reflected in traditional indicators after a lag. III. Data and Construction of Media Sentiment Index III.1 Data Daily news is dynamically culled out from media source2 for the target variables covering all major news dailies and financial papers. The target economic variables are so chosen to capture the health of the economy on a wide range of spectrum, as set out in Table 1. The target variables are available at mixed frequency and the data is published with varying lag. The study period covers April 2015 to December 2021. Hints of coronavirus sensed in the fag end of 2019 in some countries although the actual realization struck in March 2020 with the World Health Organisation (WHO) declaring Covid as pandemic. In light of this, the study period is suitably demarked to decipher the shift in sentiments. Period-I refers to April 2015 to December 2019, a phase untouched by Covid, period-II is April 2015 to December 2020 includes Covid period and recovery phase with relaxations in lockdown restrictions and resumption in economic activities and lastly, period-III is the full study period April 2015 to December 2021. | Table 1: Economic Variables Considered in Study | | Target Variable (X) | Frequency | | Real Sector | | Retail Inflation (Combined and Urban) | Monthly | | IIP growth (General) | Monthly | | Economic growth (real GDP and GVA) | Quarterly | | Consumption growth (PFCE) | Quarterly | | Business Assessment and Business Expectations Index* | Quarterly | | External Sector | | Exports growth | Monthly | | Imports growth | Monthly | | Financial Sector | | Bank Credit growth | Monthly | *source: Industrial Outlook Survey (IOS) conducted by the Reserve Bank of India
News is collected on daily basis and aggregated suitably to align with the frequency of corresponding target variable. | III.2 Construction of Media Sentiment Index General approaches for quantifying sentiment in a text are lexical methods/ dictionary approach, semantic orientation and ML techniques. Dictionary approach is widely used for sentiment classification wherein standard dictionary consists of pre-defined words with associated polarity scores. However, the word list and associated polarities in static dictionaries are more generic in nature, and may not be appropriate to capture the complexities in the context of specific economic variables. Growing literature now leverages on building ML based predictive models, well trained on large textual datasets. Aspect based sentiment analysis (ASBA) is an upcoming approach which can be customized to suit precise domains and map contextual characteristics and expressions to specific sentiment (Godbole et al., 2007). We customised and created context-specific dictionaries for sentiment classification in the current study. In the first step, relevant portion of the news is extracted deliberating on particular context (economic growth, inflation etc.), and accordingly, features are created based on the presence of positive/negative/ neutral words (which is customized for particular contexts). This custom-made fine-grained sentiment model offers advantages in terms of flexibility and scalability, as it can be applied to a wide range of variables with minimum adjustments. Hence, our approach is more focused as it considers only the text related to a token of interest differing from generic approach of evaluating the whole news article. 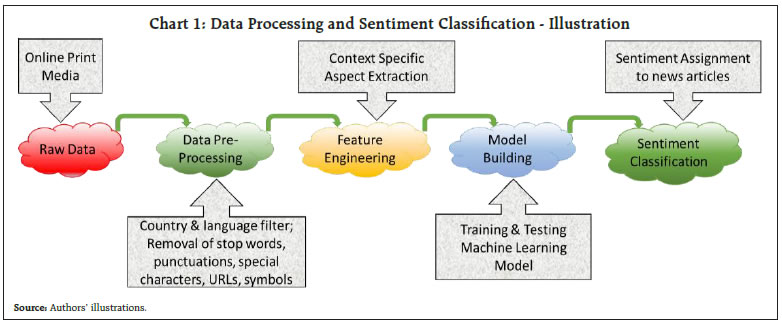 Given the inherent design of news articles, they contain unstructured text and are voluminous, making it challenging for manual reading and processing. Following the literature studies, data is pre-processed suitably prior to the sentiment extraction, as outlined in Chart 1. Each news item is classified into one of three sentiment classes, viz., positive, negative and neutral; care is taken to discard news items with no sentiments and/or those that are unrelated. In next phase, the sentiment index on ith topic (economic variable) at time t, is derived as below - Though news articles are available on high-frequency basis (daily), sentiments are aggregated on monthly or quarterly basis, depending on frequency of underlying economic variable. Sentiment index (S) taking a positive (negative) value indicates optimism (pessimism), while zero value indicates neutral sentiment. In general parlance, “increase” in target variable is considered optimistic, though for specific variables viz. inflation rate, and imports growth, “decrease” is considered optimistic. In this study, a positive value of S represents optimism and a negative value represents pessimism. While analysing the inter-relationship between sentiment and the target variable, it is prudent to look at the sign of sentiment index, as its connotation is specific to the variable under consideration, in order to make accurate interpretation. The sentiment indices are compared with year-on-year growth in corresponding economic indicators. The relationship is expected to be positive in general, as better sentiment should be corroborated with higher growth in economic indicator. Though for inflation, the linkages with sentiment are expected to be negative, as decline in inflation rate is considered as optimistic scenario. Similar negative association is expected for imports growth. IV. Methodology Reliability and validity of news sentiment provides assurance and its early availability enhances its utility. The capability and explanatory power of sentiment is examined on multiple dimensions viz. correlation, directional association and predictive ability of sentiment indices. IV.1 Directional Association In addition to correlation, directional movement in target variable and sentiment index is also examined. This aspect assumes significance as the magnitude of change in target variable may or may not be proportional to the change in sentiment from one period to another in absolute quantitative terms, though the change may be in similar direction. As described earlier, “increase” in target variable is considered optimistic for most of the variables under study, though for specific variables viz. inflation rate, and imports growth, “decrease” is considered optimistic. Accordingly, for inflation rate and imports growth, one-period change is defined as: For all other variables, one-period change is defined as below: Directional change in sentiment is defined as follows: Accordingly, a 2x2 contingency table is constructed as below: | Table 2: Contingency Table | | Number of periods (month/ quarter) | Yt | | 0 | 1 | | DSt | 0 | A | B | | 1 | C | D |
Further, using the contingency table, Fisher’s Exact (FE) test is performed, where the null hypothesis – the direction of change in sentiment index and direction of change in target variable under consideration are independent – is tested. Rejection of null hypothesis implies sentiment is able to capture the directional change in the underlying target variable. The significance level of FE test is defined as below: IV.2 Predictive Ability of Sentiment Index The information value contained in the news sentiment is examined in nowcasting/ forecasting framework. We experiment with different model specification, considering different explanatory variables, viz. taking first-order lag of target variable, sentiment index, change in sentiment index, and their combinations, as indicated below: For estimation of aforesaid model, we use logistic regression, a widely used method in statistical domain for classification problems. We also deploy extreme gradient boosting (XGBoost) tree based model from ML domain, which is a popular technique applied for classification models (Chakraborty and Joseph 2017). The data is partitioned into in-sample and out-of-sample segments (75:25 ratio) for training and testing respectively. Predicted class (PC) is derived on the basis of estimated probability (with threshold value as 0.5) from logistic regression model whereas XGBoost model directly gives predicted class as the output. Model performance is tested in terms of accuracy, which is the ratio of number of times the model predicted correct class over total number of time period under consideration. A model with higher accuracy (out-of-sample) is considered as better model. Mathematically, it is defined as follows – | Table 3: Predicted v/s Actual Class | | Number of periods (month/ quarter) | Actual class Yt | | 0 | 1 | | Predicted Class Pt | 0 | A | B | | 1 | C | D |
Table 3 is constructed for all variables, for both nowcast and one-period ahead forecast. V. Empirical Results As outlined in Section IV, the tracking capability and predictive ability of news sentiment is evaluated apropos correlation, directional association and nowcast/ forecast using logistic and tree based regression models. A look at the graphical depiction of movement of sentiments vis-à-vis the corresponding macro variable (Chart 2 to Chart 6) divulges interesting patterns. Trend in sentiments mirrored the changing patterns in economic variables to a great extent (as we would also see in correlation and directional accuracy results later). During first wave of Covid period, the sentiments dropped quickly and became highly pessimistic, mirroring the lockdown and pause in economic activities. The effect was evident in negative values of hard data released later. During the second wave, though the values of economic variables became positive, mostly on account of base effect, the uncertainties continued to loom and the sentiments took some time to recover for some variables. A good tracking ability of sentiment indices coupled with the fact that news sentiment is available in near real time, prior to the release of the actual hard data, makes the sentiment more useful.
V.1 Correlation Strong and significant correlation is observed for all variables throughout the study period, implying robustness of sentiment in tracking the economic indicators in general. Sentiment appears to have weathered-off slightly, only for some variables, owing to the uncertainty induced due to Covid, as evident in moderate drift in correlation during full period (April 2015 – December 2021) compared to the period unaffected by Covid (April 2015 – December 2019) (Table 4). This is more apparent for variables which saw a high positive growth during 2021 owing to base effect (e.g. IIP growth); a period marked by second wave of Covid impacting the sentiment negatively, though some activities resumed after the restrictions were lifted off in incremental manner. | Table 4: Correlation | | # | Variable | Apr 15 - Dec 19 | Apr 15 - Dec 20 | Apr 15 - Dec 21 | | Monthly | | 1 | Combined Inflation | -0.40*** | -0.37*** | -0.37*** | | 2 | Urban Inflation | -0.57*** | -0.45*** | -0.43*** | | 3 | IIP growth | 0.70*** | 0.69*** | 0.17 | | 4 | Exports growth | 0.77*** | 0.72*** | 0.65*** | | 5 | Imports growth | -0.75*** | -0.73*** | -0.72*** | | 6 | Bank Credit growth | 0.78*** | 0.59*** | 0.61*** | | Quarterly | | 7 | GDP growth | 0.68*** | 0.38* | 0.33 | | 8 | GVA growth | 0.74*** | 0.39* | 0.34* | | 9 | PFCE growth | 0.62*** | 0.43** | 0.38* | | 10 | Business Assessment Index | 0.54** | 0.53*** | 0.56*** | | 11 | Business Expectations Index | 0.67*** | 0.68*** | 0.63*** | Note: '***', '**', and '*' denote significance at 1%, 5% and 10% levels, respectively.
Source: Authors’ calculations. | V.2 Directional Accuracy Directional accuracy adds another layer to the efficacy of sentiment, as the magnitude of change in target variable and sentiment index may be different, though the change may be in similar direction. During normal times, there are a host of indicators gauging the health of the economy, however in a rapidly evolving situation, an indicator which can capture the possible deviation in hard data early and timely manner makes the indicator well intentioned. The direction provided by sentiment index is aligned with directional change in economic indicators and is able to capture the turning points, as evident from high degree of accuracy. The accuracy is substantially high, ranging between 70-90 per cent, for all variables except GDP/ GVA growth. Further, Fisher’s Exact (FE) Test suggests that results are statistically significant implying sentiment and economic indicators are inter-dependent and fairly aligned. Tracking ability of sentiment index, measured in terms of accuracy, appears to be minimally impacted by Covid, which is a very significant result (Table 5). | Table 5: Directional Accuracy | | # | Variable | Apr 15 - Dec 19 | Apr 15 - Dec 20 | Apr 15 - Dec 21 | | Monthly | | 1 | Combined Inflation | 70*** | 68*** | 70*** | | 2 | Urban Inflation | 73*** | 71*** | 71*** | | 3 | IIP growth | 80*** | 76*** | 72*** | | 4 | Exports growth | 91*** | 87*** | 83*** | | 5 | Imports growth | 82*** | 74*** | 76*** | | 6 | Bank Credit growth | 75*** | 74*** | 70*** | | Quarterly | | 7 | GDP growth | 50 | 50 | 48 | | 8 | GVA growth | 50 | 55 | 52 | | 9 | PFCE growth | 78** | 82*** | 76** | | 10 | Business Assessment Index | 56 | 55 | 60 | | 11 | Business Expectations Index | 89*** | 82*** | 81*** | Note: '***', '**', and '*' denote significance at 1%, 5% and 10% levels, respectively.
Source: Authors’ calculations. | V.3 Predictive Ability - Nowcast and Forecast - Logistic Regression Encouraged by the high degree of co-movement, as established in the correlation and directional accuracy results, we further evaluate the efficacy of news sentiment by assessing its predictive power. Predictive ability of sentiment, either solitary or jointly with autoregressive lags of corresponding target variable, has been analysed using models outlined in Section IV. In this context, a model which has higher accuracy compared to the benchmark model (Model 1 which includes only autoregressive lag and not sentiment), implies that the sentiment index has significant explanatory power for predicting the transformed target variable. Out-of-sample accuracy has been taken into account for model evaluation for monthly variables, while in-sample accuracy is provided for quarterly variables due to data limitation. Many interesting results are observed. First, inclusion of sentiment index in model enhances the degree of accuracy for most of the variables, and the models are at par with the benchmark model for few variables. Second, both the level of sentiment index and change in sentiment, appear to be useful indicators in capturing the direction of change in target variable. Third, the sentiment index or change in sentiment index alone, even without inclusion of Xt-1 appear to have higher accuracy as compared to the benchmark model for some variables, which is a significant result. Fourth, the sentiment indices have predictive power for both nowcast and forecast periods (Table 6 and 7). | Table 6: Accuracy of Directional Prediction - Nowcast - Logistic Regression | | Variable (X) | Model 1:
Yt ~ f
(Xt-1) | Model 2:
Yt ~ f
(St) | Model 3:
Yt ~ f
(ΔSt) | Model 4:
Yt ~ f
(Xt-1, St) | Model 5:
Yt ~ f
(Xt-1, ΔSt) | | Monthly | | Combined Inflation | 0.67 | 0.63 | 0.73 | 0.57 | 0.67 | | Urban Inflation | 0.63 | 0.57 | 0.70 | 0.73 | 0.63 | | IIP growth | 0.70 | 0.37 | 0.60 | 0.63 | 0.70 | | Exports growth | 0.63 | 0.50 | 0.63 | 0.67 | 0.63 | | Imports growth | 0.67 | 0.47 | 0.63 | 0.60 | 0.67 | | Bank Credit growth | 0.63 | 0.43 | 0.57 | 0.60 | 0.63 | | Quarterly | | GDP growth | 0.75 | 0.63 | 0.71 | 0.88 | 0.75 | | GVA growth | 0.63 | 0.58 | 0.54 | 0.71 | 0.63 | | PFCE growth | 0.67 | 0.71 | 0.79 | 0.92 | 0.71 | | Business Assessment Index | 0.58 | 0.54 | 0.58 | 0.71 | 0.63 | | Business Expectations Index | 0.67 | 0.67 | 0.79 | 0.83 | 0.88 | Note: For monthly variables, out-of-sample accuracy is provided; for quarterly variables, in-sample accuracy due to data limitation.
Best models have been highlighted in bold.
Source: Authors’ Calculations. |
| Table 7: Accuracy of Directional Prediction - Forecast - Logistic Regression | | Variable (X) | Model 1:
Yt+1~f
(Xt-1) | Model 2:
Yt+1~f
(St) | Model 3:
Yt+1~f
(ΔSt) | Model 4:
Yt+1~f
(Xt-1, St) | Model 5:
Yt+1~f
(Xt-1, ΔSt) | | Monthly | | Combined Inflation | 0.41 | 0.55 | 0.45 | 0.41 | 0.41 | | Urban Inflation | 0.69 | 0.59 | 0.45 | 0.69 | 0.66 | | IIP growth | 0.52 | 0.62 | 0.52 | 0.55 | 0.72 | | Exports growth | 0.59 | 0.62 | 0.52 | 0.59 | 0.59 | | Imports growth | 0.69 | 0.66 | 0.45 | 0.69 | 0.62 | | Bank Credit growth | 0.69 | 0.69 | 0.34 | 0.69 | 0.52 | | Quarterly | | GDP growth | 0.75 | 0.67 | 0.67 | 0.79 | 0.83 | | GVA growth | 0.63 | 0.46 | 0.63 | 0.67 | 0.67 | | PFCE growth | 0.58 | 0.54 | 0.54 | 0.63 | 0.75 | | Business Assessment Index | 0.58 | 0.54 | 0.58 | 0.58 | 0.58 | | Business Expectations Index | 0.63 | 0.71 | 0.63 | 0.71 | 0.67 | Note: For monthly variables, out-of-sample accuracy is provided; for quarterly variables, in-sample accuracy due to data limitation.
Best models have been highlighted in bold.
Source: Authors’ Calculations. | The analysis reveals that the sentiment index contains valuable information and is found to predict the directional change in the corresponding target economic indicator, well in advance and its predictive performance is precise. V.4 Predictive Ability - Nowcast and Forecast - Tree Model The empirical results based on tree based model are similar to logistic regression models. Both the level and change in sentiment index appear to be good indicators for capturing the direction of change in the target variable (Table 8 and 9). A comparative analysis of logistic regression and XGBoost model results including all variables revealed that while accuracy levels of logistic regression model and tree model are similar for nowcasts, tree models outperform logistic regression model in case of forecasts. | Table 8: Accuracy of Directional Prediction – Nowcast – Tree Model | | Variable (X) | Model 1:
Yt ~ f
(Xt-1) | Model 2:
Yt ~ f
(St) | Model 3:
Yt ~ f
(ΔSt) | Model 4:
Yt ~ f
(Xt-1, St) | Model 5:
Yt ~ f
(Xt-1, ΔSt) | | Monthly | | Combined Inflation | 0.47 | 0.60 | 0.63 | 0.60 | 0.63 | | Urban Inflation | 0.37 | 0.60 | 0.60 | 0.60 | 0.60 | | IIP Growth | 0.67 | 0.40 | 0.57 | 0.67 | 0.70 | | Exports growth | 0.60 | 0.43 | 0.60 | 0.60 | 0.60 | | Imports growth | 0.70 | 0.57 | 0.67 | 0.60 | 0.67 | | Bank Credit growth | 0.63 | 0.40 | 0.60 | 0.60 | 0.60 | | Quarterly | | GDP growth | 0.63 | 0.63 | 0.63 | 0.63 | 0.63 | | GVA growth | 0.67 | 0.63 | 0.67 | 0.75 | 0.67 | | PFCE growth | 0.75 | 0.79 | 0.79 | 0.83 | 0.79 | | Business Assessment Index | 0.67 | 0.54 | 0.54 | 0.63 | 0.67 | | Business Expectations Index | 0.75 | 0.79 | 0.83 | 0.79 | 0.83 | Note: For monthly variables, out-of-sample accuracy is provided; for quarterly variables, in-sample accuracy due to data limitation.
Best models have been highlighted in bold.
Source: Authors’ Calculations. |
| Table 9: Accuracy of Directional Prediction - Forecast – Tree Model | | Variable (X) | Model 1:
Yt+1~f
(Xt-1) | Model 2:
Yt+1~f
(St) | Model 3:
Yt+1~f
(ΔSt) | Model 4:
Yt+1~f
(Xt-1, St) | Model 5:
Yt+1~f
(Xt-1, ΔSt) | | Monthly | | Combined Inflation | 0.59 | 0.52 | 0.45 | 0.52 | 0.55 | | Urban Inflation | 0.69 | 0.62 | 0.52 | 0.72 | 0.52 | | IIP growth | 0.52 | 0.62 | 0.55 | 0.62 | 0.55 | | Exports growth | 0.55 | 0.38 | 0.59 | 0.48 | 0.59 | | Imports growth | 0.66 | 0.62 | 0.48 | 0.66 | 0.72 | | Bank Credit growth | 0.62 | 0.38 | 0.52 | 0.62 | 0.52 | | Quarterly | | GDP growth | 0.67 | 0.67 | 0.67 | 0.75 | 0.75 | | GVA growth | 0.71 | 0.54 | 0.71 | 0.71 | 0.71 | | PFCE growth | 0.75 | 0.58 | 0.63 | 0.58 | 0.63 | | Business Assessment Index | 0.58 | 0.67 | 0.58 | 0.58 | 0.58 | | Business Expectations Index | 0.63 | 0.71 | 0.63 | 0.71 | 0.75 | Note: For monthly variables, out-of-sample accuracy is provided; for quarterly variables, in-sample accuracy due to data limitation.
Best models have been highlighted in bold.
Source: Authors’ Calculations. | VI. Sentiment during Covid and Beyond In India, later half of March 2020 witnessed complete shutdown which continued for few months before gradual and careful reopening subsequently. The Oxford Covid-19 Stringency Index corroborates the same (Chart 7), with stringency attaining high values during March 2020 continued upto September 2020, slightly improving thereafter and again becoming higher around June 2021. With pandemic engulfing the country, various industrial, business and service activities came to standstill and tangible effects of coronavirus outbreak started coming to the fore. Corporates and markets altered and aligned their strategies with changing times, while deferring their long-term plans in the wake of low demand and uncertain economic situation. With limited activities, especially in contact intensive sectors and dwindling incomes, the consumers and households began to re-evaluate discretionary and non-discretionary expenditure. In light of this, a focussed analysis is carried out by segregating the study period into smaller time periods representing different phases, as illustrated in Chart 8. Within a span of few days of start of pandemic, sentiments nosedived to the lowest level. Sentiments which were mostly range bound with minor fluctuations in pre-Covid period shifted downwards in Covid period, distinctly visible in the lower median value. Additionally, uncertainty in sentiment, reflected in terms of dispersion around median value, seems to have increased during Covid times (Chart 9).
The news sentiments aptly captured the pessimism prevailing in various sectors of the economy, much before the impact was recorded in hard data of key macro variables, whose values significantly deviated from historical trends, especially during the first phase of Covid. During second phase of Covid as well, similar negativity in sentiments was observed, although with varying degree. Industrial production bore the brunt of restrictions and lockdown the most, with complete shutdown of domestic activities. Firms faced substantial business and operational disruptions and hurdles in meeting contractual obligations to their stakeholders. Although, sentiments were dispersed in the second phase of Covid, they remained at elevated levels compared to first phase. Shift of sentiments in the positive terrain in later periods provides assurance of normalcy with better prospects. Global trade also faced disruptions limited by supply-chain disruptions, lower demand and various restrictions, both at domestic and global levels. Upbeat and positive sentiments in exports during pre-Covid period moderated in subsequent months and turned negative at the peak of pandemic and exhibited uncertainty. During post-Covid1 and the subsequent periods, a steady build-up of positive sentiments with more coherence signifies pickup in trade activities. Second wave of Covid did not have any significant impact on the sentiments, exuberating confidence and suggesting normalcy in economic activities. Similar trends were reflected in imports as well, with reopening of trade activities and pick up in domestic demand leading to higher imports growth, which was echoed in negative sentiments (increase in imports is taken as negative sentiment in this study). Credit needs also changed during the Covid period, with falling demand and increased uncertainty coupled with income troubles faced by individuals and corporates, and mirrored in worsening of sentiments. With gradual unlocking of the economy and various policy measures, sentiments started reflecting optimism and remained in positive territory. During the second phase of Covid, sentiments continued to bounce back and forth before showing signs of recovery in later period. Inflation sentiments exhibited weakening trend in 2019 as reflected in negative values during pre-Covid period. Although sentiment on inflation remained in positive terrain during Covid1 period (though with higher dispersion), they started showing signs of worsening quickly, attributing to disruptions in the supply chains and elevated price pressures. In later periods, sentiments reflected less pessimism and moved to optimistic zone and uncertainty also got reduced. Overall downward trajectory of sentiment was seen in other economic variables as well, with varying degree of uncertainty, during the peak of Covid crisis. VII. Conclusion and Way Forward Tapping large amount of unstructured information contained in online print media and leveraging upon big data techniques, this article focuses on sentiment extraction from qualitative text. News media offers perspective on concurrent topics encompassing multiple sectors of the economy. Globally, literature studies suggest that news-based sentiments possess valuable economic signals and are increasingly being utilised in nowcasting and forecasting framework. The study adds to the growing literature and constructs individual sentiment index for a range of key macroeconomic variables. The broad objective of the study is to collate the scattered information contained in news, construct numerical sentiment indices which can be used as complementary indicators for assessment of state of the economy and capture the developments on a near real-time basis in a systematic manner. Efficacy and value content of sentiment indices has been examined through various metrics. Empirical analysis reveals that media sentiment indices have a high degree of co-movement with economic indicators and optimistic sentiment periods coincide with higher growth phases and vice versa. Further, the sentiment indices possess predictive ability in terms of providing directional change in underlying economic variable in nowcasting and short-term forecasting. Covid pandemic, which brought in unprecedented crisis changing the economic conditions drastically, was echoed in downward tilt of sentiments and high uncertainty, more evident in industrial production and external trade activities. A deep-dive analysis reveals heterogeneity and shifts in sentiments during periods of first and second waves, with sights of recovery in between. With gradual reopening and resumption of economic activities, sentiment trajectory reflected signs of recovery and a return towards normalcy. As the sentiment indicators can be constructed on high frequency basis, prior to the release of official statistics and traditional indicators, it is worthwhile to track them regularly for early signals on economic conditions. Further extensions can be carried out by incorporating other commonly used measures of confidence, sentiment and expectations of market agents as available through business tendency surveys, and estimating wholesome empirical models aiming at higher prediction accuracy. References Aguilar, P., Ghirelli, C., Pacce, M. and Urtasun, A. (2021). Can News Help Measure Economic Sentiment? An Application in COVID-19 Times. Economic Letters, Volume 199. Ardia, D., Bluteau, K. and Boudt, K. (2019). Questioning the News about Economic Growth: Sparse Forecasting using Thousands of News-Based Sentiment Values. International Journal of Forecasting, Volume 35, pp. 1370-1386. Blanchard, O. J., L’Huillier, J.-P. and Lorenzoni, G. (2013). News, Noise, and Fluctuations: An Empirical Exploration. American Economic Review, Volume 103(7), p. 3045–3070. Buckman, S. R., Shapiro, A. H., Sudhof, M. and Wilson, D. J. (2020). News Sentiment in the Time of COVID-19. FRBSF Economic Letter, Issue 08. Chakraborty, C., and Joseph, A. (2017). Machine Learning at Central Banks. Bank of England Staff Working Paper No. 674 Elgendy, N. and Elragal, A. (2014). Big Data Analytics: A Literature Review Paper. Conference Paper in Lecture Notes in Computer Science. Godbole, N., Srinivasaiah, M. and Skiena, S. (2007). Large-Scale Sentiment Analysis for News and Blogs. International Conference on Weblogs and Social Media (ICWSM) Hale, T., Angrist, N., Goldszmidt, R., Kira, B., Petherick, A., Phillips, T., Webster, S., Cameron-Blake, E., Hallas, L., Majumdar, S. and Tatlow, H. (2021). A Global Panel Database of Pandemic Policies (Oxford COVID-19 Government Response Tracker). Nature Human Behaviour, Vol. 5, pp.529-538. Kalamara, E., Turrell, A., Redl, C., Kapetanios, G. and Kapadia, S. (2020). Making text count: economic forecasting using newspaper text. Bank of England Staff Working Paper No. 865. Nyman, R., Kapadia, S., Tuckett, D., Gregory, D., Ormerod, P. and Smith, R. (2018). News and Narratives in Financial Systems: Exploiting Big Data for Systemic Risk Assessment. Bank of England Staff Working Paper No. 704. Shapiro, A. H., Sudhof, M. and Wilson, D. (2017). Measuring News Sentiment. Federal Reserve Bank of San Francisco Working Paper 2017-01. Shiller, R. J. (2017). Narrative Economics. American Economic Review, Volume 107(4), p. 967–1004.
|