by Amit Kumar^, Shivam Nigam# and
Sandhya Kuruganti^ This study attempts to nowcast growth in Gross Value Added (GVA) using high frequency payment system data for India. The study adopts a hybrid machine learning approach using Mixed Data Sampling Regression Model (MIDAS) in combination with Support Vector Machine (SVM). Both volume and value channels for each payment indicator are explored. The nowcasts from MIDAS-SVM hybrid models are derived by employing two weighting techniques viz., E-W (equal weighting) and RMSFE (Root Mean Squared Forecast Error) respectively. The empirical results demonstrate the substantial increase in predictive accuracy for the nowcasts generated by the hybrid approach and the RMSFE weighting strategy. Introduction The payments process is a vital aspect of financial intermediation. It enables the creation and transfer of liquidity among different economic agents. A well-structured payment framework facilitates elimination of barriers to trade in goods and services, reduces transaction costs, enhances customer confidence and thus augments the competence of the financial market (BIS, 2003; ECB, 2010). The momentum for economic growth is created by efficient functioning of payments and settlement system, which speeds up the liquidity flow in the economy (RBI Occasional Publications, 1998). In fact, many researchers have empirically shown the direct or indirect relation between payment systems and real economic activity. Humphrey et al. (2006) and Hasan et al. (2012) find a notable increase in banking efficiency with wider use of retail electronic payment instruments. By analysing retail payments data across 27 European Union member countries, Zhang et al. (2019) document the importance and the impact of a well-designed retail payment system on trade, consumption and the economy. Moreover, safer and more efficient payment systems enable the real economy to reap wider benefits (Bancad’ Italia, 1999). Over the past few years, the techno-policy developments in India have paved the path from paper based to digital led payments systems. National electronic funds transfer (NEFT) and real time gross settlement (RTGS) are two systemically important payment and settlements systems which are operated and owned by the Reserve Bank. The establishment of other innovative payment systems like immediate payment service (IMPS), unified payments interface (UPI), prepaid payment instruments (PPIs), Bharat Bill Payment System (BBPS) etc. are also driving competition and thus contributing significantly to the changing payment landscape in India. The impressive growth performance, particularly in UPI, points to the wider acceptance of digital electronic payment instruments by both business and consumers likewise (Chart 1a). In addition, card-based payment instruments also witnessed similar performance across the last five years (Chart 1b). This significant growth signals the growing maturity of the payment industry in India and the impact that it can have on the total economic output of the country. A significant and traditional metric of economic progress is reflected and measured in its gross value added (GVA) and the effective tracking of GVA growth is of importance to policymakers. However, GVA data is released with a lag of two months in many economies including India. Hence, it becomes necessary to estimate the quarterly nowcasts of GVA growth. This paper is an attempt to nowcast low frequency quarterly GVA growth (year-on-year) using high frequency monthly payment data.
Through this study, the authors attempt to build a hybrid model which derives its translations from both econometric and machine learning paradigms. The hybrid framework allows us to capitalize on the niche strength of mixed frequency data modeling and the superior generalization accuracy of machine learning for non-linear relationships. The hybrid framework introduced in the article may be considered as novel work done in the Indian context. Mixed data sampling regression (MIDAS) allows the independent and dependent variable(s) to be sampled at different frequencies while the distributed lag polynomial is useful for evaluating parsimonious specifications. Autoregressive Distributed Lag MIDAS (ADL-MIDAS) model specification is considered for this purpose. This is further integrated with support vector machine (SVM) method to derive nowcasts of quarterly GVA growth from monthly payments data. Amongst machine learning algorithms, SVM algorithm displays a unique strength as an optimal method for small sample regression and classification (Meng and Zhao, 2015). A similar finding is that SVM exhibits greater generalization accuracy in a limited sample size scenario (Shao and Lunetta, 2012). In macroeconomics application research, generally small samples are available for modelling, and thus SVM may be an appropriate algorithm. In this study, we extensively use payment factors in either value or volume terms, thereby widening the information set to improve nowcast accuracy. The rest of the study is organized into five sections. Section II is a brief survey of the relevant literature. Section III presents the data used in the study. Section IV discusses the hybrid nowcasting methodology. The empirical results are presented in section V and conclusion in Section VI. II. Survey of Literature In the absence of timely availability of specific policy oriented macroeconomic series, there has been an increasing trend of using high-frequency time series data to monitor economic indicators. Among the high frequency data available, payments and settlement data may be counted as a dependable source of information. The review of literature sheds light on the efficacy of using real time electronic payment system data for nowcasting/forecasting from a multi-fold perspective. A few questions that are addressed by these studies are – whether payment systems data delivers better forecasts as compared to alternate high frequency sources; if machine learning algorithms provide more precise estimates than traditional techniques; and can payments data prove to be reliable for nowcasting in uncertain non-tranquil periods. In a recent study, Bentsen and Gorea (2021) of Denmark’s National Bank employ mixed‑data sampling (MIDAS) regression to nowcast quarterly macroeconomic variables using payment systems data for the Danish economy. The authors note the superior performance of payments relative to a set of frequently used predictors of economic activity for nowcasting one quarter ahead GDP. However, the extra edge on forecasting declines during the first phase of Covid. On a similar note, Aprigliano et al. (2019) deploy mixed frequency factor model for predicting Italian GDP and its main components using Italy’s retail settlement system. Using machine learning techniques, Chapman and Desai (2021) from Bank of Canada address the challenges relating to economic prediction and unreliability of traditional methods during the global financial and Covid-19 crises. Further, they observe that in the presence of payments data, machine learning models can reduce nowcasting RMSE by approximately 15-45 per cent for the period covering the global financial crisis, while model predictions are closer to official estimates for the first Covid-19 shock. Leon and Ortega (2018) employ a non-linear autoregressive exogenous neural network model (NARX) to nowcast a short-term economic activity indicator in Colombia using electronic payment data. In the Indian context, research publications on leveraging payment flows for nowcasting have been rather limited. Rooj and Sengupta (2021) of Asian Development Bank forecast private consumption using electronic payment system. Based on MIDAS, they conclude that digital payment system data has improved prediction power in forecasting private consumption. Raju and Balakrishnan (2019) use RTGS data for nowcasting GDP using auto-regressive integrated moving average (ARIMA) model. The review of literature discerns that electronic payments system data is widely used to extract reliable signals of economic activity. The findings relate to the successful implementation of an econometric specification for mixed frequency data, and the improved generalization power of machine learning algorithms, albeit on a stand-alone basis. Hybrid machine learning models combine strengths of both model types; each method exploits a different element of the specification, and their combination or integration is expected to yield better performance than using a single method (Wang et al., 2021). The authors introduce a hybrid model by combining MIDAS with machine learning based SVM regression in a sequential manner to develop a nowcasting framework for economic growth based on payment flows. Additionally, the existing literature only reflects the use of value or volume components of payments data for nowcasting purposes. The authors undertake a more comprehensive approach by employing both value and volume components of payment data in their current work. III. Data In India, the data on GVA is available on quarterly basis with a lag of two months, wherein the data on payments and settlement system is available on daily frequency and is one of the few high frequency series available publicly. The data on payment system is released by the Reserve Bank on daily, monthly and annual frequency. The data has been downloaded from Database on Indian Economy (DBIE) platform. Due to the surge in payment system infrastructure and policy changes related to payment systems between 2001 to 2010, the data on payment systems has witnessed sudden growth at several instances (Raj et al., 2020). Therefore, the monthly payment system data for the current study has been taken from April 2011 to March 2022 in line with other research studies for India. The quarterly data on GVA is published by Ministry of Statistics and Programme Implementation (MoSPI). The same data is also disseminated by Reserve Bank of India through DBIE. The quarterly data for GVA has been taken from April 2011 to March 2022. The train (in sample) data is taken as year-on-year growth from April 2012 to June 2020 (33 quarters) and test (out of sample) data is July 2020 to June 2021 (4 quarters). The nowcasting of GVA growth has been performed on financial year basis for three quarters i.e., Q2:2021-22 to Q4:2021-22. The predictive power of the model gets an additional boost when the first Covid period (Q1:2020-21) is included in train. The independent variables considered for this study include monthly data on credit cards (CC), debit cards (DC), credit transfers through retail (Credit Transfers- Retail), credit transfers through real time gross settlement (Credit Transfers-RTGS), card transactions at point-of-sale machines (Cards_POS) (Appendix I). IV. Hybrid Nowcasting Methodology The study adopts a four-step hybrid methodology involving MIDAS, SVM regression and error correction strategy (MIDAS-SVM hybrid models). Finally, two weighting strategies are used to nowcast GVA growth using payment indicators (Chart 2). IV.1 The MIDAS model In recent years, the MIDAS modelling approach as proposed by Ghysels et al. (2016) has been extensively explored across different domains, including forecasting growth of GVA using agricultural exports1, predicting annual disaggregated set of fiscal series2 and for research related to financial markets3. The section on literature review (Section II) also presents numerous applications of MIDAS for economic forecasting using payment indicators. In our study, the data exhibits mixed frequencies, that is, payments data is in months and GVA data is at quarterly level. Thus, we employ MIDAS to reflect the dynamic relationship among variables at different frequencies representing distributed lag polynomials as functional constraints. Individual MIDAS models using lags of dependent variable and each payment indicator have been estimated. Since, the low frequency GVA growth rate plausibly exhibits autocorrelation, we also consider the autoregressive effect of GVA growth rate into the model. The ADL-MIDAS (m,k,l) model with one-step ahead forecast is estimated as follows: K describes the maximum lag order of the high frequency monthly payment indicators growth rate, δ is the hyper-parametric vector that determines the shape of the polynomial weight function, L is a polynomial lag operator, Intercept, αj and β are the parameters to be estimated by the model, εt represents the stochastic error term. It may be noted that k = 0 denotes the latest month growth rate of the payment indicator in the current quarter “t”. For instance, if we are nowcasting GVA growth rate for Q3:2021-22, k = 0 denotes the growth rate of monthly payment indicator for December 2021. Similarly, k = 1 refers to growth rate of monthly payment indicator for November 2021 and so on. The polynomial weighting function ω(k; δ), which reflects the dynamic relationship among variables with different frequency has several functional forms, and its objective is to maintain parsimony4. Therefore, to realize accurate forecasts of GVA growth, two different specifications of polynomial weight functions have been used in this study. These include Normalized Exponential Almon lag polynomial (ExpAlmon) and Almon lag polynomial (Almon) (Appendix II). IV.2 Support Vector Machine Regression SVM regression is a non-parametric method first proposed by Vapnik (1995). The success of the SVM algorithm is evident from the fact that it has been widely used in regression and classification problems in various domains, particularly in macroeconomics research. For example, Richardson et al. (2019) from the Reserve Bank of New Zealand use a suite of different ML methods to obtain real time nowcast of real GVA growth rate for New Zealand and SVM stands out as the best technique. Support Vector Regression has been proven to be an effective tool in real-valued function estimation. Analogous to classification, support vector machine regression is marked by different kernel functions and the number of support vectors.5 The use of ‘structural risk minimising’ principle by SVM allows it to significantly increase the generalizable performance, as it balances model complexity against fitting the model on train data (Vapnik and Chervonenkis, 1974). Further, the computational complexity of the model also reduces as the final decision function mainly depends only on support vectors, which is a fraction of the total sample. In our study, we utilize SVM regression to model the quarterly level residuals of the fitted best single MIDAS model of each payment indicator. We regress it against the quarterly growth rates (y-o-y) of each payment indicator. Further, we extensively employ different kernel functions (polynomial, radial, sigmoid, linear) and tune other hyper parameters such as cost and epsilon to select the best model for each payment indicator variable. IV.3 Error Correction Strategy: MIDAS-SVM Hybrid Model To improve the predictions, we construct the MIDAS-SVM hybrid model, wherein the predicted values of the residuals from SVM algorithm are added to the fitted values of quarterly GVA growth rate for each individual best MIDAS model. This step is expected to improve the forecast accuracy of the best individual MIDAS model for each payment factor. IV.4 Weighting Schema for Nowcasting To avoid misspecification and to extract the different information sets (individual payment indicators) provided by each individual best MIDAS-SVM models, we combine them using two weighting techniques, i.e., E-W (equal weighting) and RMSFE (Root Mean Squared Forecast Error). RMSFE weighting technique penalizes the factors with high root mean squared forecast error in the test/ out of sample data, by giving less weight to them. This model enables more accurate nowcasts of low frequency quarterly GVA growth rate for three quarters (Q2:2021-22 to Q4:2021-22). The nowcasts are generated on one-step ahead basis, each time. In general, the nowcasts are constructed as follows:6 The weights Wm,T for mth MIDAS-SVM hybrid model correlating to each payment indicator are updated and recalculated for each successive nowcast by adding the real value observed for the previous nowcast back to the test/ out of sample data (Appendix-II). V. Results The selection of the best individual MIDAS model for each payment indicator (either volume and value channels) serves as the foundation for the individual MIDAS-SVM hybrid model and is discussed in Sections V.1 and V.2 respectively. Section V.3 discusses the nowcasting framework and results. V.1 Best Individual MIDAS Models As the selection of the optimal model significantly affects the forecast of quarterly GVA growth, we run a suite of different MIDAS specifications with varying lags specified for both quarterly GVA and monthly payment indicators. Further, various polynomial weights are also considered, to select the best individual MIDAS model with the highest predictive capacity (i.e., smallest RMSE in the out of sample / test data). The final selection also depends on the significance of the non-linear least square (NLS) estimates of hyper-parameters of polynomial weights and the empirical adequacy of the polynomial weight function. The empirical adequacy is tested using hAh test (Kvedaras et al., 2012). Table 2 demonstrates the forecasting performance (RMSE on the out of sample / test data) of the best individual MIDAS model with each payment factor in both value and volume terms, when considering the condition of one step ahead forecast with fixed window. The bold values highlight the best MIDAS model for the individual payment indicator after considering the several selection checks as mentioned earlier, i.e., lowest RMSE on test/out of sample data, polynomial weight NLS hyper-parameters significance and empirical adequacy of polynomial restrictions. | Table 2: Best Individual MIDAS model for Each Payment Indicator | | a: Value | | Indicators | The best individual MIDAS model | RMSE | | Credit Cards (CC) | AR (3)-Almon-MIDAS (1,3) | 2.1 | | Debit Cards (DC) | AR (0)-Almon-MIDAS (0,2) | 3.4 | | Credit Transfers-Retail | AR (1)-Almon-MIDAS (2,6) | 3.3 | | Credit Transfers-RTGS | AR (0)-Almon-MIDAS (1,3) | 3.2 | | Cards_POS | AR (1)-Almon-MIDAS (2,3) | 3.7 | | b: Volume | | Indicators | The best individual MIDAS model | RMSE | | Credit Cards (CC) | AR (1)-Almon-MIDAS (1,5) | 2.8 | | Debit Cards (DC) | AR (2)-Almon-MIDAS (1,3) | 2.7 | | Credit Transfers-Retail | AR (1)-Almon-MIDAS (2,9) | 4.8 | | Credit Transfers-RTGS | AR (0)-Almon-MIDAS (0,3) | 5.1 | | Cards_POS | AR (0)-Almon-MIDAS (1,3) | 5.1 | Note: The equation for ADL-MIDAS model is a combination of 3 terms - AR(s) where ‘s’ is lag position for the quarterly GVA growth (y-o-y), ‘Almon’ represents the best polynomial weight function in capturing the relationship between quarterly GVA growth(y-o-y) and monthly payment indicators growth(y-o-y) and MIDAS(r,q)’ where ‘r’ is starting lag month and ‘q’ is ending lag month of monthly payment indicator growth.
Source: Authors’ estimates. | V.2 Best Individual MIDAS-SVM Hybrid Models Table 3 demonstrates the forecasting performance (RMSE on the out of sample/test data) of the best individual MIDAS-SVM hybrid model with the payment factors selected in the preceding step after considering the error correction mechanism (Step 3 in Chart 2). 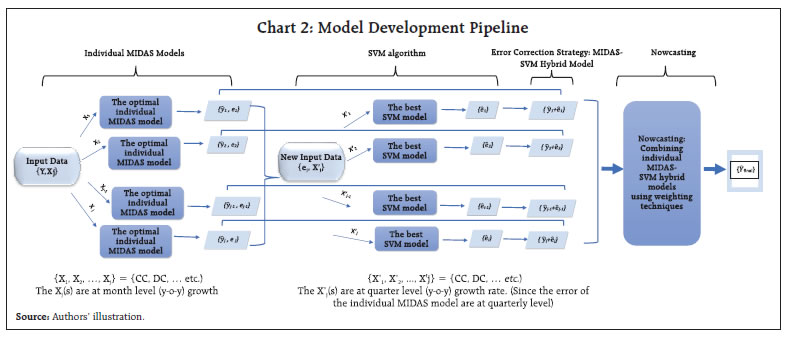
| Table 3: Best Individual MIDAS-SVM Hybrid Model for Selected Payment Indicators in either Volume or Value Channel | | Indicators | The best individual MIDAS-SVM model | RMSE | Improvement (in per cent) | | Credit Cards (CC) Volume | AR (1)-Almon-MIDAS (1,5)-SVM | 0.58 | 79.6 | | Debit Cards (DC) Volume | AR (2)-Almon-MIDAS (1,3)-SVM | 2.05 | 24.4 | | Credit Transfers-Retail Value | AR (1)-Almon-MIDAS (2,6)-SVM | 1.80 | 45.3 | | Credit Transfers-RTGS Value | AR (0)-Almon-MIDAS (1,3)-SVM | 3.13 | 3.00 | | Cards - POS Value | AR (1)-Almon-MIDAS (2,3)-SVM | 2.14 | 41.7 | Note: The equation for ADL-MIDAS-SVM model is a combination of 4 terms - AR(s) where ‘s’ is lag position for the quarterly GVA growth (y-o-y), ‘Almon’ represents the best polynomial weight function in capturing the relationship between quarterly GVA growth(y-o-y) and monthly payment indicators growth(y-o-y); ‘MIDAS(r,q)’ where ‘r’ is starting lag month and ‘q’ is ending lag month of monthly payment indicator growth. SVM is the support vector regression applied on the residuals of the best individual MIDAS model.
Source: Authors’ estimates. | The ‘improvement’ column shows the percentage amount by which the out of sample/test data forecasting accuracy of the MIDAS-SVM hybrid model exceeds the best individual MIDAS model. The results ratify our hypothesis that applying SVM algorithm over the residuals of the MIDAS model is leading to a significant reduction in forecast error for majority of the payment indicators. This may be attributable to the fact that machine learning is able to capture the non-linearities in GVA growth that were not captured by MIDAS. V.3 Nowcast Evaluation To generate the nowcasts of GVA growth for three quarters i.e., Q2:2021-22 to Q4:2021-22, we combine the one step ahead nowcast results of each best MIDAS-SVM hybrid model using two weighting techniques that is equal-weighing (E-W) and Root Mean Squared Forecast Error (RMSFE). V.3.1 Weighting Strategy V.3.2 Nowcasting Performance Chart 3 illustrates the nowcasts for three quarters from Q2:2021-22 to Q4:2021-22 with both weighting techniques. Actual GVA growth experienced a deceleration from 8.0 per cent (Q2:2021-22) to 4.6 per cent (Q3:2021-22) and 3.8 per cent (Q4:2021-22) respectively. For Chart 3a, the selected payment indicators are Credit Cards (CC) Volume, Debit Cards (DC) Volume, Credit Transfers-Retail Value, Credit Transfers-RTGS Value, Cards - POS Value. It is observed that nowcasts from the hybrid model are clearly tracing the trajectory of actual GVA growth. The empirical results also clearly demonstrate that the RMSFE weighting scheme takes the lead in terms of precision. For the RTGS (value) series, some data aberrations7 were noted and we experimented with nowcasting without taking this payment factor into consideration. Chart 3b illustrates the nowcast performance without Credit Transfers- RTGS (value) and the nowcasts generated exhibits substantial improvement in accuracy. In this case as well, the most precise results are achieved based on RMSFE weighting scheme. VI. Conclusion The purpose of this study is to nowcast GVA growth using high frequency data on payments flows based on both value and volume components. The analytical approach is based on a hybrid machine learning model framework involving mixed frequency econometric models and machine learning algorithms. The individual payment indicators based MIDAS models are selected based on multiple runs of a suite of different MIDAS specifications with varying lags. This is followed by individual MIDAS-SVM models which involves the application of SVM algorithm over the residuals of the individual MIDAS models. This step allows us to capture non-linearities that are not captured by MIDAS and thus improves forecast accuracy. Lastly, the best individual MIDAS-SVM models are chosen and further combined to derive nowcasts using two weighting techniques – E-W and RMSFE. The empirical results demonstrate that the nowcasts derived from weighting schemes of RMSFE outperforms E-W in terms of precision. The flexibility of this analytical approach easily lends itself for nowcasting other macroeconomic aggregates. References Aprigliano, V., G. Ardizzi, and L. Monteforte, (2019), “Using payment system data to forecast economic activity”, International Journal of Central Banking, 15 (4). Bancad’Italia (1999), “White Paper on Payment System Oversight, Objectives, Methods, Areas of Interest”. Benchmarking India’s Payment System, July 2022, Reserve Bank of India. Bentsen, K.N., and D. Gorea, (2021), “Nowcasting and forecasting economic activity in Denmark using payment system data”, Denmarks National Bank, Working Paper no. 17. Chapman, J.T.E., and A. Desai, (2021), “Using payments data to nowcast macroeconomic variables during the onset of COVID-19”, Staff Working Paper 2021-2, Bank of Canada. Cortes, C., and V. Vapnik, (1995), “Support-vector networks.” Mach Learn 20: 273– 297. Ghysels, E., V. Kvedaras, and V. Zemlys, (2016), “Mixed Frequency Data Sampling Regression Models: The R Package midasr”, Journal of Statistical Software, 72(4):1–35. Hasan, I., H. Schmiedel, and L. Song, (2012), “Retail payment and bank performance”. Journal of Financial Services Research, 41 (3): 163-195. Humphrey, D.B., M. Willesson, G. Bergendahl, and T. Lindblom, (2006), “Benefits from a changing payment technology in European banking”. Journal of Banking and Finance,. 30(6): 1631-1652. Kvedaras, V., and V. Zemlys, (2012), “Testing the functional constraints on parameters in regressions with variables of different frequency”, Economics Letters, 116: 250-254. León, C., and F. Ortega, (2018), “Nowcasting economic activity with electronic payments data: A predictive modeling approach”, Borraderas de Economia No. 1037, Banco de la Republica. Meng, M.H., and C.F. Zhao, (2015), “Application of support vector machines to a small-sample prediction”, Advances in Petroleum Exploration and Development, 10(2):72-75. Payment Systems in India, RBI Occasional Publications, 1998. Payments Vision 2025, June 2022, Reserve Bank of India. Raj. J., I. Bhattacharya, S.R. Behra, J. John, and B.A. Talwar, (2020), “Modelling and forecasting currency demand in India: A heterodox approach”, RBI Occasional Papers, 41(1) Raju, S., and M. Balakrishnan, (2019), “Nowcasting economic activity in India using payment systems data”, Journal of Payments Strategy and Systems,13 (1) Richardson, A., T.V.F. Mulder, and T. Vehbi, (2019), “Nowcasting New Zealand GDP using machine learning algorithms”, IFC Bulletin Chapters, 50, Bank for International Settlements. Rooj, D., and R. Sengupta, (2021), “Forecasting private consumption with digital payment data: A mixed frequency analysis”, ADBI Working Paper series no. 1249. Seventh SEPA Progress Report, European Central Bank, 2010. Shao, Y., and R.S. Lunetta, (2012), “Comparison of support vector machine, neural network, and CART algorithms for the land-cover classification using limited training data points”, ISPRS Journal of Photogrammetry and Remote Sensing, 70: 78-87. The Payment Systems, European Central Bank, 2010. The role of Central Bank Money in Payment Systems, Committee on Payment and Settlement Systems, Bank for International Settlement, 2003. Vapnik, V., and A. Chervonenkis, (1974) “Pattern Recognition Theory, Statistical Learning Problems, Nauka, Moskva”. Wang, C., and W. Kang, (2021), “Forecasting China’s Steam Coal Prices Using Dynamic Factors and Mixed- Frequency Data”, Polish Journal of Environmental Studies, 30(5):4241-4254. Zhang, Y., G. Zhang, L. Liu, T.D. Renzis, and H. Schmiedel, (2019), “Retail payments and the real economy”, Journal of Financial Stability, 44, ISSN 1572-3089.
Appendix - I
Variable description | Sr. No. | Name of the Variable | Variable description | | 1 | Credit Cards (CC) | It is the transactions done through credit cards. The major components of CC are:
a. Card payments using credit cards
b. Cash withdrawal at ATMs using credit cards | | 2 | Debit Cards (DC) | It is the transactions done through debit cards. The major components of DC are:
a. Card payments using debit cards
b. Cash withdrawal at ATMs using debit cards | | 3 | Credit Transfers-Retail | It is the transactions taking place through retail payment system. It comprises of the transactions taking place through below systems:
a. Aadhaar Enabled Payment System (AePS)
b. Aadhaar Payment Bridge System (APBS)
c. Electronic Clearing Services (ECS)
d. Immediate Payment Service (IMPS)
e. Interbank transactions
f. National Automated Clearing Houses (NACH)
g. National Electronic Fund Transfers (NEFT)
h. Unified Payment Interface (UPI) | | 4 | Credit Transfers-RTGS | It is the large value transactions taking place through RTGS system. It is further subdivided into:
a. Customer transactions
b. Interbank transactions | | 5 | Cards_POS | Cards transactions at Point-of-Sale machines:
a. Credit Card usage at point of sale
b. Debit Card usage at point of sale |
Appendix - II A. Polynomial weight functions: • Exponential Almon lag polynomial: The exponential Almon lag polynomial of order p (ExpAlmon) is defined as: • Almon lag polynomial: The Almon lag polynomial of order p (Almon) is defined as: B. RMSFE weighting: RMSFE refers to the root mean squared forecast error, which is used to combine the individual approach. The weight is given as: C. Equal weighting: The equal-weighted type refers to the average weight, as is simply given: wm,T = 1/M
7 A sharp decline was observed for Credit Transfers-RTGS (values) in Q4:2012-13 and again in Q4:2019-20. This sharp drop was not observed for other payment indicators used in the study for the same quarters. |