The pace of global growth may slow further in 2024 while disinflation at varying pace in different geographies may pave the way for interest rate reductions. In India, the broad-based strengthening of economic activity that is under way will likely be sustained by easing input costs and corporate profitability. CPI inflation rose to 5.6 per cent in November as the recurrence of food price spikes punctured a brief respite in September and October, but it is expected to ease to 4.6 per cent in the first three quarters of 2024-25. Domestic financial markets have been lifted by the abiding strength of the real economy. The month of December heralds the beginning of the end of 2023. It has been a tumultuous year by any standards, replete with wars, political turbulence, price and interest rate surges, extraordinary volatility in financial markets and apocalyptic visions of economies biting the dust. It has also been a year of remarkable resilience, triumphal financial markets and of many economies round the world defying the inexorability of recession and financial distress. Now that 2023 is almost behind us, it is the time when tea leaves are read again and crystal balls are gazed into – what will 2024 be like? At this stage, there seems to be a loose consensus that the pace of global growth may slow but contraction will be avoided. Disinflation at varying paces in different geographies may pave the way of interest rate reductions and dissipation of monetary policy hawkishness. In some countries, economic activity could even be supported by policy stimulus. Geopolitical strife may persist, but the global economy may take it in its stride. Fiscal risks will dominate the outlook, with implications for borrowing costs and the wall of debt that faces both corporates and governments in 2024 and 2025. Markets may be sporadically destabilized by credit, liquidity and equity events, remaining vulnerable to dramatic swings in sentiments. Underlying these possible developments, climate risks may rise and the fragmentation of the global economy and international relations may continue to polarize. That said, the recent descent of inflation, mainly due to easing of external price pressures, has brought relief and this may continue. In the latest demonstration of this inexorable tendency, crude prices fell despite OPEC+ members agreeing in December 2023 to make additional voluntary production cuts in 2024. Besides reflecting signs of strains within the grouping, the weakening global economy imparted uncertainty and bearishness. Yet, inflation will likely remain elevated relative to targets unless recessions set in and take their toll. Hence many central banks will not declare victory prematurely – this is already evident in their reluctance to commit to time stamping future interest rate cuts, although it is more certain now that they may not raise rates further. More recently, systemic central banks have expressed willingness ‘to adjust the stance of monetary policy as appropriate’.1 It is in this context that they lament the travails of the ‘last mile’. They know it involves the vanquishing of home-grown price pressures, including from tight labour markets in advanced economies (AEs), that are feeding into prices of services. At this time, however, this narrative and its credibility is being front-run by exuberant financial markets that are already pricing in rate cuts in early 2024 and loosening financial conditions. Equity markets are posting relief rallies and futures markets are pricing in a near 100 per cent probability of rate cuts as early as May 2024. Rejuvenated risk appetite is being mirrored in corporate debt markets which are experiencing a flood of issuances, a boost to bond valuations and a driving down of borrowing costs and spreads for even the riskiest entities. The fear gauge – VIX – is hovering around its lowest levels since the pandemic, signaling overall investor optimism. In fact, central banks are being pilloried for their conservative USP – their ‘navigating by the stars under cloudy skies’2 - which could be rendering them slow-footed in realizing that the inflation crisis may be ebbing just as they delayed in seeing inflation rising two years ago. Hence, they are being warned of the costly policy error of keeping borrowing costs higher for longer, thereby undermining economic activity, denting earnings and pulling down stock valuations. The sense is that the European Central Bank (ECB) will lead the rate cutting cycle as stagnation and recessionary forces broaden across the euro area, and the US Fed and the Bank of England will follow. The Bank of Japan has effectively given up its yield control policy but cannot communicate it due to upside inflation fears. It is widely believed that when central banks get going, rate cuts will be speedy. Over the next two years, the global economy is expected to slow moderately before returning to near-trend rates. Global growth is projected to weaken to its lowest annual rate in 2024 since the global financial crisis other than the first year of the pandemic3. With inflation expected to converge to targets only by 2025, monetary policy may grudgingly give up its disinflationary stance although the effects of past tightening will linger. Wages may recover as inflation eases and the increase in labour costs may be absorbed by a decline in profit shares. Fiscal policy may remain modestly restrictive and government final consumption is expected to remain subdued. Business investment is projected to stagnate before picking up towards the latter part of 2025 while household saving may remain broadly stable. For most AEs, real gross domestic product (GDP) growth is projected in a 0.7-1.7 per cent range for 2024, and around 4 per cent for emerging economies (OECD Economic Outlook). Global trade may recover gradually, aided by the cyclical improvement in demand. 2023 is likely to end as the hottest year on record – the United Nations Environment Programme estimates that the world is on track for temperature of up to 2.9 degrees Celsius above pre-industrial levels as greenhouse gas emissions keep rising. There is only a 14 per cent chance of limiting warming to the 1.5 degrees Celsius goal even if countries honour all current pledges. A greater recognition is gaining ground that if have to save our planet and ourselves, climate action has to intensify, and climate pledges must be stepped up. At the 28th Conference of Parties (COP28) in Dubai from November 30 to December 12, therefore, more than US$ 420 million was secured to seed a loss and damage fund to be hosted by the World Bank to help developing nations deal with climate change. In another successful initiative on the sidelines, 118 countries pledged to triple global renewable energy capacity by 2030 from around 3400 GW today to over 11000 GW. This represents the most accessible and cost-effective solution in addressing climate urgency. It emanated in the New Delhi G20 Summit declaration in September 2023. The countries that signed on in Dubai also agreed to double the global annual rate of energy efficiency. Fifty companies representing over 40 per cent of global oil production committed themselves to zero carbon emissions by 2050. Also, 60 countries committed to reducing global cooling emissions - that account for nearly 7 per cent of global emissions – by 68 per cent by 2050. COP28 also saw 22 countries sign a declaration to triple nuclear energy capacity. In a latest show of strength and poise, India left sceptics gasping and woefully behind the curve as real GDP clocked a growth of 7.7 per cent in the first half of 2023-24. The key value of these numbers lies in what they tell about the future. There is a distinct shift in the momentum of the economy from a contraction in the first quarter to not just positive territory but also to well above trend in the second quarter. High frequency indicators suggest that this build-up in momentum will sustain over the rest of the year. A silver lining is that hitherto tepid rural demand is on the mend. The recent release of ₹10,000 crore to meet enhanced expenditure under the rural job guarantee scheme and the provision of free foodgrains to about 81 crore beneficiaries under the Pradhan Mantri Garib Kalyan Anna Yojana (PMGKAY) for a period of five years with effect from January 1, 2024 would cushion rural consumption and preserve the stimulus from government final consumption expenditure. A major driver of growth has been the public policy thrust on infrastructure which has propelled gross fixed capital formation into double digit growth. This boost is also likely to be sustained as the quality of public spending improves on an ongoing basis. Merchandise exports recorded a positive momentum and incoming data will indicate if this is a turnaround from a long contraction. Meanwhile, services exports go from strength to strength, especially with global IT spending expected to surge in 2024 after remaining lukewarm in the preceding three years. Indian global capability centres (GCCs) are increasingly emerging as a hub for leaders with global roles. India is currently home to 1580 GCCs employing close to 2 million people, a testimony to talent, growing capital markets and maturity of services competencies. Indian GCCs are evolving into a sandbox for global organisations driving large-scale transformation in skills like artificial intelligence, generative technologies, internet of things, quantum computing and blockchain. Increasingly, they are taking end-to-end product ownership, building niche competencies and challenging untapped frontiers. On the supply side, agriculture is flattening after seven consecutive years of record foodgrain production, but prospects remain bright for allied activities such as livestock, forestry and fishing. The biggest upside surprise is stemming from the broad-based strengthening of industrial value added, especially manufacturing. The surge in profitability, aided by easing input costs, is expected to sustain this dynamism. As inflation eases, a revival of topline growth will support the manufacturing expansion. Among services, construction activity remains robust, boosted by housing demand. Other categories of services are normalizing from the post-pandemic revenge spending, but underlying momentum remains resilient. The main risk to the outlook stems from the evolution of inflation in the months ahead. The recurrence of food price spikes in November has punctured a brief respite in September and October. It is expected that these pressures will linger on into December before the usual winter softening sets in and dispels these adversities. The repetitive nature of food imbalances impinging on prices reinforces our view that for India, it is the food category that is the true ‘core’ of inflation, with second order effects that delay the policy goal of aligning headline inflation with the target. Consequently, a lasting solution to these sporadic flares is the only panacea. Supply augmenting measures and adjustments have the lead role here, but monetary policy shall have to respond if food inflation as a whole becomes lastingly elevated and sends secondary impulses across other prices. On the other hand, core inflation has been steadily disinflating, attesting to the efficacy of monetary policy actions and stance. Domestic financial markets have been lifted by the abiding strength of the real economy. The primary segment of the equity markets has been set afire by a blitz of oversubscribed – some of them massively-initial public offerings (IPOs) by more than 40 companies and more than 60 having filed for more. It coincides with an ebullient bullish sentiment, the ongoing rally in mid-cap and small-cap stocks in the secondary market and the strength of the underlying macro-fundamentals. It has been a broad-based rebound spanning diverse sectors ranging across small finance banks, jewellery, supply chain management, infrastructure, hospitality and biotechnology. The reduction in the timeline for listing shares on the stock exchanges after closure of IPOs from T+6 to T+3 in August 2023 has also given investors the opportunity to participate in more IPOs, obtain faster access to capital and do business better. Another important indicator of the innate strength of the economy is the stability of the Indian rupee (INR). On a trade-weighted basis, the nominal value of the INR has undergone an appreciation by 1.6 per cent during 2023-24 (April-December 8, 2023). Adjusted for inflation differentials, the INR’s appreciation is even higher at 4.5 per cent. Over this period, the US dollar has appreciated by 1.5 per cent against a broad index of currencies. The strength of the INR reflects no less to the active hands-on management by the RBI in allowing the currency to find its level in a market-determined manner but in eschewing volatility in a time of formidable global spillovers and an extremely uncertain international environment. Corporate bond issuances have rebounded in November, with fund-raising assessed to be the third highest in any month in the current financial year. Issuances in December are widely expected to surpass these levels in a clear reflection of positive market sentiment and the sense of stability that has followed in the wake of expectations that interest rates have peaked and are slated to ease. Set against this backdrop, the remainder of the article is structured into four sections. Section II covers the rapidly evolving developments in the global economy. An assessment of domestic macroeconomic conditions is set out in Section III. Section IV encapsulates financial conditions in India, while the last Section sets out concluding remarks. II. Global Setting For most of 2023, global growth was weighed by a host of factors, including ongoing geo-political tensions, adverse weather conditions and tight financial conditions, although incoming data point toward the global economy avoiding a hard landing. In Q3:2023, growth accelerated in the US, buoyed by households’ spending; and in China, it was propelled by a slew of policy stimuli, whereas GDP contracted in the Euro area and Japan, and stagnated in the UK. The Organization for Economic Cooperation and Development (OECD) in its Economic Outlook of November 2023 projected the global economy to grow by 2.9 per cent in 2023 and by 2.7 per cent in 2024 as much of the headwinds for global growth are expected to continue in the next year as well (Table II.1). Our nowcast for global GDP using the latest high-frequency data points to global growth momentum losing steam in Q4:2023 (Chart II.1)
Looking ahead, the global growth divergence is expected to continue in 2024 and 2025 as well, but with India remaining the fastest growing major economy (Chart II.2). The global supply chain pressures index (GSCPI) rose to 0.11 in November 2023, marking its first above historical average reading since January 2023 (Chart II.3a). This was largely engendered by an increase in geopolitical risk, with the global geo-political risk indicator rising to a fifteen-month high in November (Chart II.3b). Consumer sentiments remained pessimistic across countries, although some sequential improvement was witnessed in the UK (Chart II.4a). Financial conditions, on the other hand, recorded some easing as the expectations of an earlier than expected end of policy tightening cycle gained traction (Chart II.4b).
The global composite purchasing managers’ index (PMI) returned to the expansionary zone at 50.4 in November as stabilisation of new orders supported an uptick in output (Chart II.5). The global manufacturing PMI rose to a six-month high of 49.3 in November 2023, although declines in production, new orders and slowdown in export business kept it in the contractionary zone. The services PMI remained in expansion, buoyed by a sequential improvement in new businesses. At a sectoral level, output increases were recorded in the services sector, notably in software and related services, pharmaceuticals and biotechnology, and insurance.
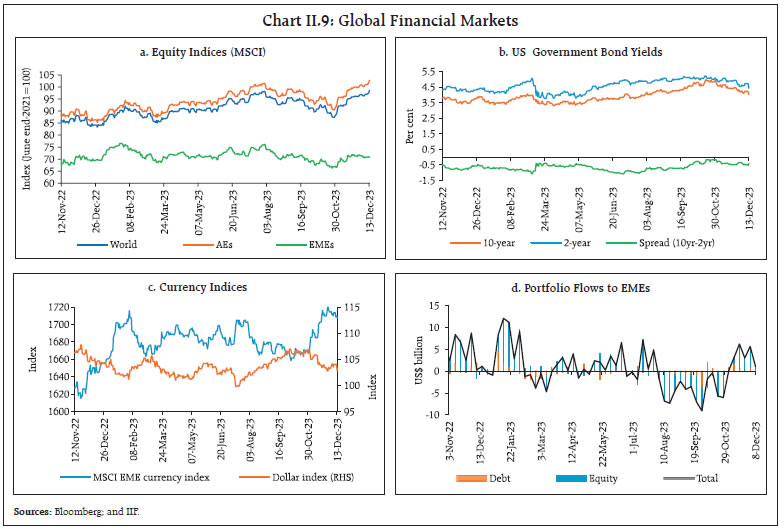
Global trade continues to face significant headwinds and PMIs for new export orders remained in the contractionary zone in November. Export orders for manufacturing recorded a sequential improvement, while they moderated for services (Chart II.6). In November, global commodity prices eased, primarily driven by energy prices, with the Bloomberg Commodity Price Index falling by 1.6 per cent (m-o-m) with the downward trend persisting into December so far [Chart II.7a]. Crude oil prices4 softened from US$ 91.1 per barrel in October to US$ 83.2 per barrel in November due to easing supply concerns, a build-up in US and Brazil crude inventories and concerns over slowing global demand. Oil prices continued to decline in December so far, despite OPEC+ members’ additional voluntary supply cut commitments, as discussed in the introduction (Chart II.7b). Prices of most base metals, however, increased amidst continuing positive sentiment around stimulus measures in China. The Food and Agriculture Organization’s (FAO’s) food price index remained unchanged in November as increases in the price indices for vegetable oils, dairy products and sugar were offset by declines in those for meat and cereals (Chart II.7c). Gold prices edged up further in November and December as the US dollar weakened and lower treasury yields reduced the opportunity cost of holding non-interest-bearing bullion (Chart II.7d). 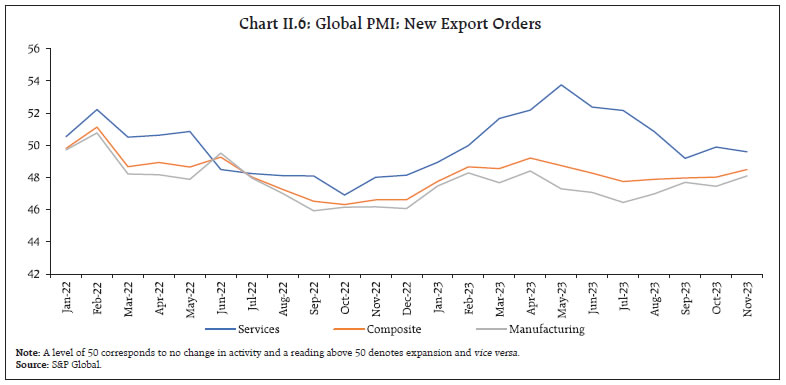 Headline inflation has been on a downward trajectory, even though it is still above the target in most AEs.5 In the US, the headline personal consumption expenditure (PCE) inflation moderated to 3.0 per cent (y-o-y) in October after remaining steady for the past three consecutive months at 3.4 per cent. CPI inflation in the US also declined to 3.1 per cent in November from 3.2 per cent in October. As per the flash estimates, euro area inflation fell to 2.4 per cent in November from 2.9 per cent in October, reaching its lowest level since July 2021 (Chart II.8a). In the UK, CPI inflation edged down to 4.6 per cent in October, reaching its lowest level since October 2021, while Japan’s inflation (CPI excluding fresh food) picked up marginally to 2.9 per cent in October. Among EMEs, inflation moderated in South Africa and Brazil in November. Inflation in Russia accelerated for the seventh month in a row, reaching 7.5 per cent in November. China recorded deflation of 0.5 per cent in November (Chart II.8b). Core inflation has also moderated in AEs, albeit at a much slower pace than the headline (Chart II.8c and II.8d). 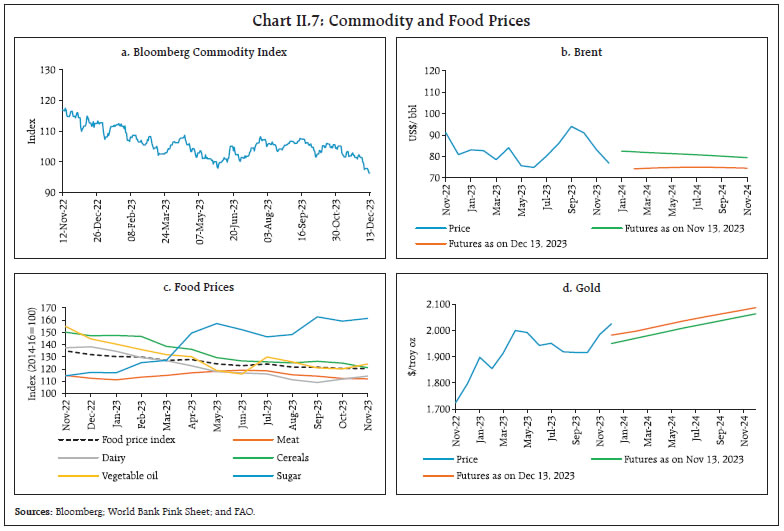 Global equity markets registered gains in November, tracking the fall in US Treasury yields from their October 2023 highs after the announcement of a slower pace of debt issuance in the US. Equity markets have remained buoyant in December so far and recorded robust momentum after the US Federal Reserve (Fed) signalled end of its rate hiking cycle and possible rate cuts next year. Treasury yields experienced fluctuations, initially rising after stronger-than-anticipated US jobs data but subsequently declined with the 10-year US treasury yields breaking below 4 per cent for the first time since August, post the Fed announcement (Chart II.9a and II.9b). These developments were also reflected in the currency markets. The dollar index depreciated by 1.7 per cent (m-o-m) in November and continued to decline in December. Concomitantly, the Morgan Stanley Capital International (MSCI) currency index for EMEs gained by 1.9 per cent in November as capital inflows, mostly in the equity segment, remained buoyant (Chart II.9c and II.9d). 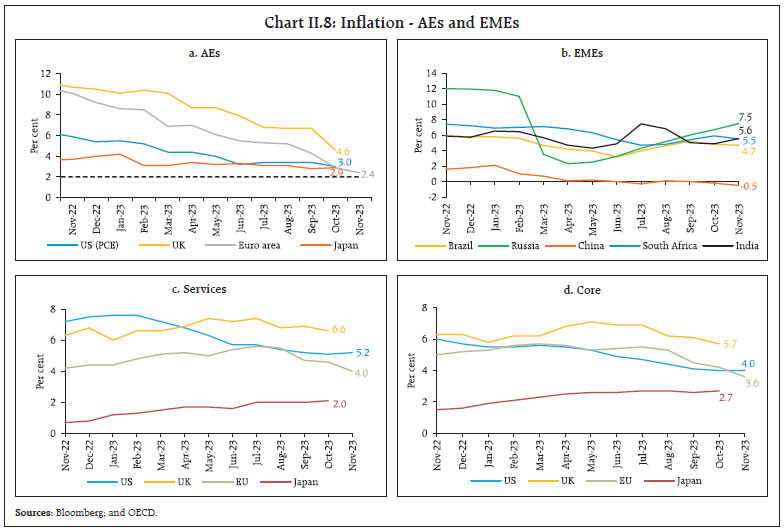
 AE central banks, in general, kept their policy rates unchanged while EMEs resorted to divergent policy paths. In their December policy meetings, the US Fed, European Central Bank (ECB), the Bank of England kept their key rates unchanged while the Norges Bank hiked its policy rate by 25 bps (Chart II.10a). Among EMEs, Brazil reduced its benchmark rate by 50 bps each in its November and December meeting (Chart II.10b). The People’s Bank of China (PBoC) injected net liquidity of 600 billion yuan ($82.9 billion) into the financial system through its one-year medium-term lending facility (MLF) at an unchanged interest rate of 2.5 per cent. Turkey, in contrast, hiked its policy rates by 500 bps in November while Russia raised its policy rate by 100 bps in December. III. Domestic Developments Despite significant global headwinds, the Indian economy remained the fastest growing major economy in 2023. The outlook is one of cautious optimism as consumer confidence remains positive and perceptions about current income turned up in the RBI’s latest survey of households in November 2023 (Chart III.1a). Supply chain pressures in India remain below historical average levels, although they have edged up in recent months (Chart III.1b). Our economic activity index (EAI) nowcasts GDP growth for Q3:2023-24 at 6.7 per cent (Chart III.1c and III.1d). Looking ahead, projections from our Dynamic Stochastic General Equilibrium (DSGE) model for the Indian economy, which captures the dynamic interactions between various agents in the economy as well as their response to shocks, show that the growth is likely to be sustained in H2:2023-24 and 2024-25 despite some moderation (Box 1). 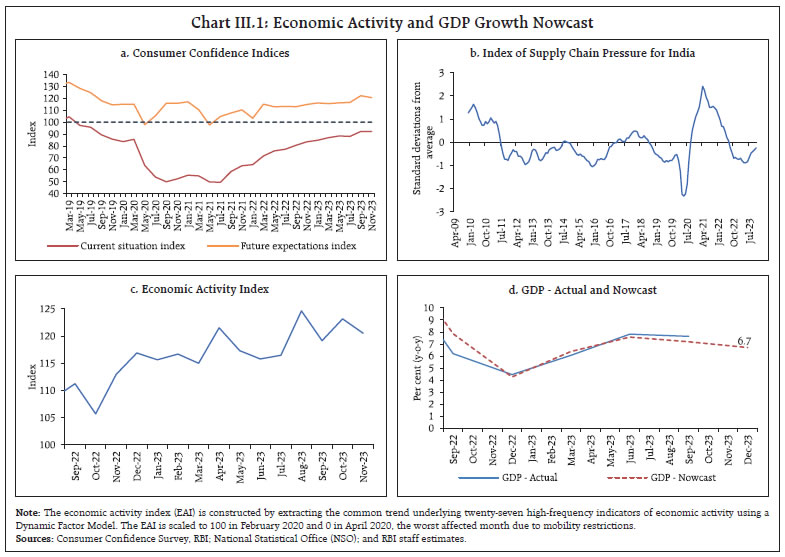
Box 1: Medium-term Outlook for GDP Growth and Headline CPI Inflation As part of the suite of models for informing monetary policy formulation, the RBI has developed a dynamic stochastic general equilibrium (DSGE) model that is based on microeconomic foundations and rational expectations characterising the choices of agents such as the representative consumer, producer and the central bank. In order to understand their collective interplay in economic fluctuations and the role of policy interventions, the model involves shocks, i.e., surprises in the form of mismatches between expectations and outcomes, and subsequent demand-supply adjustments.6 The model’s estimation includes the following variables: GDP growth (y-o-y), CPI inflation seasonally adjusted annual rate (saar), the policy repo rate, global GDP growth (y-o-y), global CPI inflation (y-o-y), the nominal INR/USD exchange rate (annualised q-o-q), and the US Fed funds rate. Under the assumptions of (i) global GDP growth of 2.6 per cent and 2.1 per cent for 2023-24 and 2024-25, respectively; (ii) global CPI inflation of 5.5 per cent and 4.0 per cent for 2023-24 and 2024-25, respectively; (iii) unchanged policy repo rate and US Fed funds rate at 6.5 per cent and 5.5 per cent for the current and next financial year, respectively, the baseline forecast suggests that after a phase of high growth in the first half of 2023-24, the Indian economy is likely to undergo some moderation in subsequent quarters. Growth for 2023-24 is projected at 7.1 per cent, followed by a relatively slower and uneven expansion of 6.0 per cent during 2024-25. The trajectory of CPI inflation indicates a moderation after Q3:2023-24, with annual CPI inflation averaging 5.3 per cent in 2023-24 and moderating further to reach 4.8 per cent in 2024-25 (Table 1 and Chart 1). There are both favourable demand side drivers and easing of supply side constraints at work. GDP is expected to sustain momentum alongside moderation in inflation, despite global headwinds. Upside idiosyncratic risks to the inflation forecast cannot, however, be ruled out.
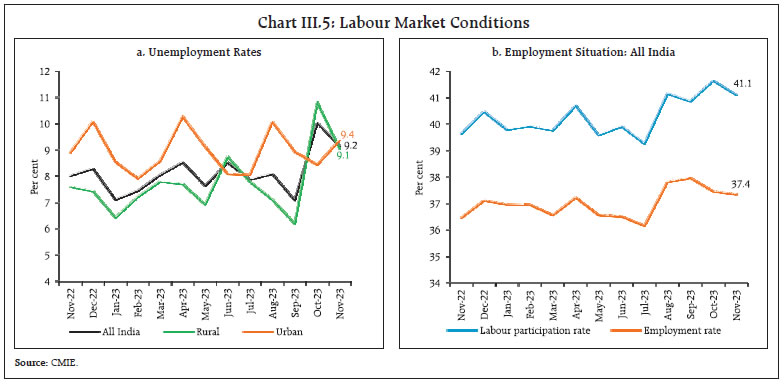
| Aggregate Demand Real GDP registered a growth of 7.6 per cent in Q2:2023-24, up from 6.2 per cent in Q2:2022-23 (7.8 per cent in Q1:2023-24) and exceeding market expectations. The robust expansion of activity in Q2:2023-24 was primarily led by domestic drivers – government consumption and fixed investment (Chart III.2). Among the components of real GDP, private final consumption expenditure (PFCE) recorded a moderate growth of 3.1 per cent in Q2, primarily due to tepid rural demand conditions following lower kharif production. The growth in government final consumption expenditure, however, surged to 12.4 per cent, primarily led by the Union government’s spending while that of the State governments remained steady. Buoyed by the government’s thrust on infrastructure, gross fixed capital formation (GFCF) recorded a double-digit growth of 11.0 per cent. Consequently, the share of GFCF in real GDP surged to 35.3 per cent. This was also reflected in a sharp acceleration in its proximate coincident indicators – steel consumption; cement production; and production and imports of capital goods. With import growth exceeding that of exports, net exports contributed negatively to GDP growth in Q2:2023-24. 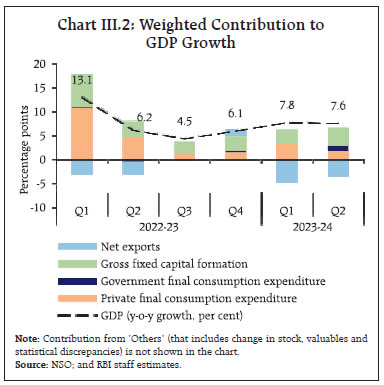 Evidence from high frequency indicators point towards sustained strength in demand conditions. E-way bills posted a growth of 8.5 per cent in November 2023, albeit moderating sequentially from an all-time high recorded in October due to overstocking induced by the festival demand (Chart III.3a). Toll collection receipts expanded by 14.1 per cent (y-o-y) in November (Chart III.3b). Automobile sales registered an expansion of 26.5 per cent (y-o-y) in November on the back of festival demand (Chart III.4a and III.4b). Both two and three-wheeler sales recorded y-o-y growth of 30 per cent in November. Tractor sales expanded by 6.4 per cent in November after contracting for the past two months. Vehicle registrations also recorded strong y-o-y growth in November (Chart III.4c). The consumption of petroleum grew by 9.4 per cent y-o-y in November (Chart III.4d). As per the data available from the Centre for Monitoring of Indian Economy (CMIE), the all-India unemployment rate (UR) fell to 9.2 per cent in November, driven by lower UR in rural areas even as urban UR recorded an increase (Chart III.5a). The labour force participation rate (LFPR) recorded a fall in both urban and rural areas (Chart III.5b). The employment rate (ER) increased in rural areas whereas it decreased in urban areas. Results from the recently released Periodic Labour Force Survey (PLFS) conducted by National Sample Survey Office (NSSO) point towards increasing trend in Labour Force Participation Rate (LFPR) and Worker Population Ratio (WPR) as well as a general decrease in Unemployment Rate (UR) (Box 2). The employment outlook in the organised sector, as polled by the PMIs for manufacturing and services, remained in the expansionary zone (Chart III.6). For manufacturing, it recorded a sequential pick-up in November whereas for services it recorded a m-o-m moderation. 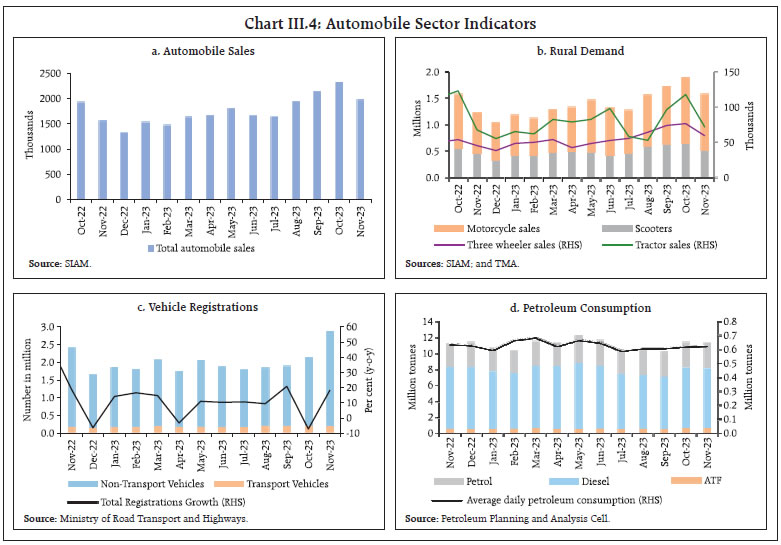
Box 2: Emerging Labour Market Trends- Evidence from PLFS Surveys As brought out in the September 2022 issue of the State of the Economy, the National Sample Survey Office (NSSO) launched the Periodic Labour Force Survey (PLFS) in April 2017 which provides data on key labour market indicators on an annual frequency at the all-India level and on a quarterly basis for urban areas.7 In its latest release (for July-September 2023) the labour force participation rate (LFPR) for persons aged 15 years and above in urban areas at 49.3 per cent was the highest since the inception of the survey (Chart 1), largely driven by women. The Worker Population Ratio (WPR), which indicates the proportion of the population engaged in gainful employment, increased to 46.0 per cent in July-September 2023 from 45.5 a quarter ago, both male and female WPR showing an improvement. The unemployment rate (UR) among females declined from 9.1 per cent in April-June 2023 to 8.6 per cent in July-September 2023. 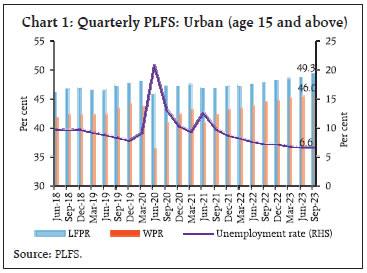 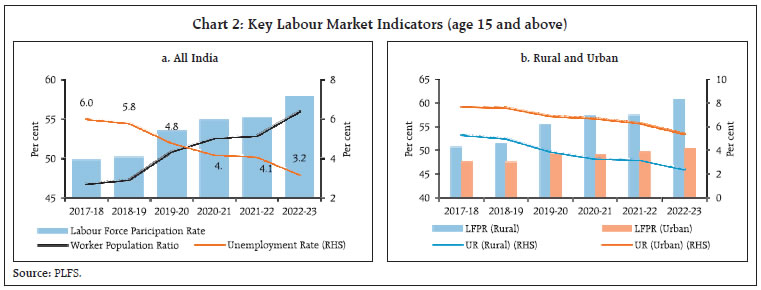 Annual data covering both urban and rural areas indicate LFPR and WPR at 57.9 per cent and 56.0 per cent respectively in 2022-23. The all-India unemployment rate (UR) fell to a series low of 3.2 per cent, with both rural and urban unemployment on a decline (Chart 2a & 2b). The LFPR was driven up by an increase in female participation, especially in rural areas (Chart 3). The labour market points towards an improvement in the pace of economic activity. |
 With the advancement in the North-east monsoon and rabi sowing, the number of households demanding work under the Mahatma Gandhi National Rural Employment Guarantee Scheme (MGNREGS) registered its first y-o-y decline since March 2023 (Chart III.7). India’s merchandise exports at US$ 33.9 billion in November 2023 registered a contraction of 2.8 per cent (y-o-y), but this essentially reflected an unfavourable base effect (Chart III.8). In terms of m-o-m momentum, however, it grew by 1.0 per cent. Out of 30 major commodities, 15 commodities, including petroleum products, organic and inorganic chemicals, engineering goods and rice registered contraction on a y-o-y basis. On the other hand, iron ore, gems and jewellery, drugs and pharmaceuticals, fruits and vegetables and meat, dairy and poultry registered expansion and supported overall export growth (Chart III.9).
India is the third largest exporter of onions, with a share of 12 per cent in total exports in 2022. In view of the spike in domestic prices, customs duty of 40 per cent was levied on onion exports in August 2023. This led to a 35.7 per cent (m-o-m) decline in onion exports (in quantity terms) in September, but recorded a partial rebound in October (Chart III.10a). During episodes of high onion price increases in recent years, the Government has embargoed onion exports. In recent months, inflation in terms of domestic prices of onions is much higher than export prices (Chart III.10b). A minimum export price (MEP) of US$ 800 per metric ton on all varieties of onions was made applicable effective November 23, 2023. Furthermore, on December 8, 2023 onion exports were prohibited till end-March 2024 to arrest the domestic price rise.
Merchandise imports at US$ 54.5 billion swung back into contraction in November. The y-o-y decline of 4.3 per cent was due to a negative momentum of 14.1 per cent which offset a positive base effect (Chart III.11). Among 30 major commodities, 15 commodities accounting for 61.8 per cent of the import basket (share in 2022-23) recorded a y-o-y decline. Petroleum, oil, and lubricants (POL), pearls, precious and semi-precious stones, fertilisers, vegetable oil and transport equipment were the main items that dragged import growth down, while electronic goods, silver, iron and steel, metalliferous ores and other minerals; and non-ferrous metals supported import growth in November (Chart III.12).
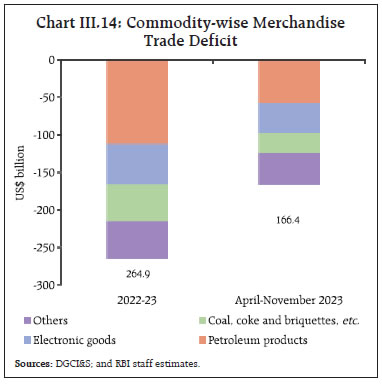
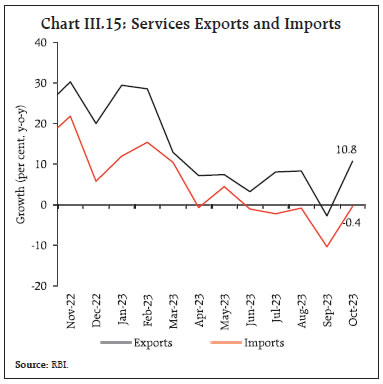
With decline in imports and increase in exports on a sequential basis the merchandise trade deficit in November 2023 narrowed to US$ 20.6 billion from the high of US$ 29.9 billion a month ago. The share of oil in the total merchandise trade balance increased in November (Chart III.13). During April-November 2023, India’s merchandise exports at US$ 298.2 billion contracted by 6.5 per cent (y-o-y). Merchandise imports at US$ 487.4 billion declined by 8.7 per cent (y-o-y). Consequently, the merchandise trade deficit narrowed to US$ 166.4 billion from US$ 189.2 billion during the corresponding period a year ago. Petroleum products were the major source of the trade deficit, followed by electronic goods (Chart III.14). In October 2023, services exports increased by 10.8 per cent on a y-o-y basis to US$ 28.0 billion, led by growth in software services, business services and travel services. On the other hand, services imports declined by 0.4 per cent y-o-y to US$ 13.5 billion, mainly due to a fall in transportation services (Chart III.15). As a result, net services earnings improved by 23.6 per cent (y-o-y) to US$ 14.6 billion in October 2023. During April-October 2023-24, the gross fiscal deficit (GFD) of the Central government stood at 45.0 per cent of the budget estimates (BE), marginally lower than 45.6 per cent of BE during the corresponding period of the previous year. On the expenditure side, capital spending recorded an increase of 33.7 per cent (y-o-y) while revenue expenditure registered a growth of 6.5 per cent (y-o-y) (Chart III.16a). Capital outlay (i.e., capital expenditure excluding loans and advances) recorded an increase of 28.6 per cent, resulting in a marked improvement in the quality of spending of the Central government as depicted by a declining revenue deficit to gross fiscal deficit ratio (RD-GFD) and revenue expenditure to capital outlay ratio (RECO) [Chart III.16b]. 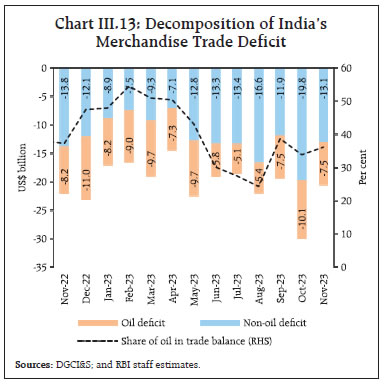
 On the receipts side, direct tax collections recorded a growth of 23.9 per cent (y-o-y) during April-October 2023, with income tax and corporate tax collections growing at 31.1 per cent and 17.4 per cent, respectively. On the other hand, indirect tax collections rose by 3.6 per cent (y-o-y), driven by growth in goods and services tax (GST) collections. Overall, gross tax revenue recorded a growth of 14.0 per cent over the previous year, led by the robust improvement in direct tax collections (Chart III.17). Non-tax revenues recorded a y-o-y growth of 48.7 per cent during April-October 2023 on the back of higher than budgeted surplus transfer from the Reserve Bank8 while non-debt capital receipts contracted by 35.6 per cent9 (Chart III.18). Total receipts of the Central government recorded a y-o-y expansion of 14.8 per cent. GST collection (Centre plus States) grew by 15.1 per cent (y-o-y) to ₹1.68 lakh crore in November 2023, which is the highest monthly y-o-y growth in 2023-24 so far (Chart III.19). Gross GST collection during April-November 2023-24 (₹13.3 lakh crore) was 11.9 per cent higher than ₹11.9 lakh crore during the corresponding period of 2022-23.
During H1:2023-24, the GFD of the states10 stood at 39.8 per cent of BE (Chart III.20a). A slower growth in revenue receipts vis-à-vis revenue expenditure resulted in a higher revenue deficit (Chart III.20b). Tax and non-tax revenues recorded a lower growth on a high base. Grants from the Centre witnessed a contraction due to cessation of GST compensation to states and tapering of finance commission grants.
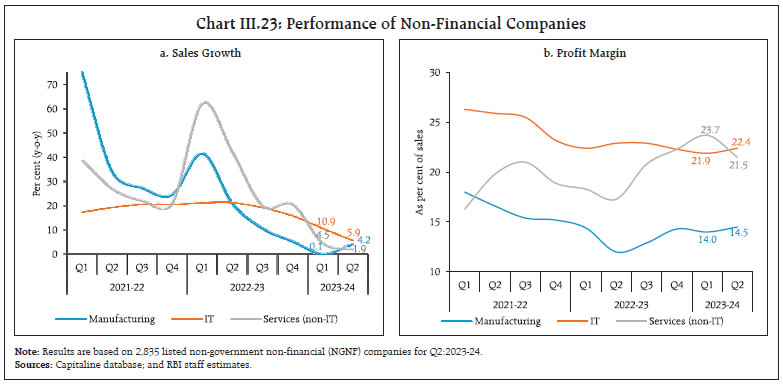
States’ thrust on capital spending has continued with a 47.3 per cent growth in capital expenditure, aided by the Union government’s ‘Scheme for Special Assistance to States for Capital Investment’. As at end-October 2023, the Union government has approved outgoes under this head amounting to ₹96,206 crore (accounting for 74 per cent of the ₹1.3 lakh crore budgeted for 2023-24), out of which ₹58,494 crore has already been disbursed to the states, improving the quality of their expenditure (Chart III.21). Aggregate Supply Aggregate supply – measured by gross value added (GVA) at basic prices – expanded by 7.4 per cent in Q2:2023-24, up from a growth of 5.4 per cent a year ago (7.8 per cent in Q1:2023-24). This was propelled by industrial and services sectors, while agriculture recorded a marginal expansion (Chart III.22). The growth in agriculture, forestry and fishing moderated to 1.2 per cent in Q2:2023-24 from 2.5 per cent a year ago. This was largely on account of a 4.6 per cent contraction in kharif foodgrains production in 2023-24, reflecting the impact of the uneven temporal and spatial distribution of the south-west monsoon rainfall. Manufacturing – the dominant component of the industrial sector – registered a strong growth of 13.9 per cent, boosted by a sharp increase in profit margins of corporates as input cost pressures declined. This is also reflected in the deflation in the wholesale price index (WPI) for manufacturing products during Q2. Services sector growth at 6.7 per cent witnessed some moderation as compared with double-digit growth in the preceding quarter. The continued expansion of construction activity in Q2 was reflected in robust growth recorded by both steel consumption and cement production. Trade, hotels, transport, communication and services related to broadcasting and financial, real estate and professional services – the two major services sub-sectors – recorded moderation in Q2. Public administration, defence, and other services (PADO) expanded on a y-o-y basis by 7.6 per cent in Q2 on account of acceleration in the Central government’s revenue expenditure. Sales of listed non-financial private manufacturing companies grew by 4.2 per cent (y-o-y) during Q2:2023-24 (Chart III.23). Their operating profits surged by 30.1 per cent and margins improved, both annual as well as sequential. Sales growth of information technology (IT) firms moderated to 5.9 per cent (y-o-y) after recording double digit growth in the previous nine consecutive quarters, whereas non-IT service companies recorded a modest growth of 1.9 per cent. The debt-to-equity ratio for listed private manufacturing firms fell to 30.5 per cent during H1:2023-24 from 33.7 per cent a year ago on the back of fresh capital infusion and higher profits. Improving demand conditions have encouraged firms to increase financial allocations towards capital investment; fixed assets increased by 10.5 per cent (y-o-y) and the share of fixed assets in total assets has improved over the last one year (Chart III.24). 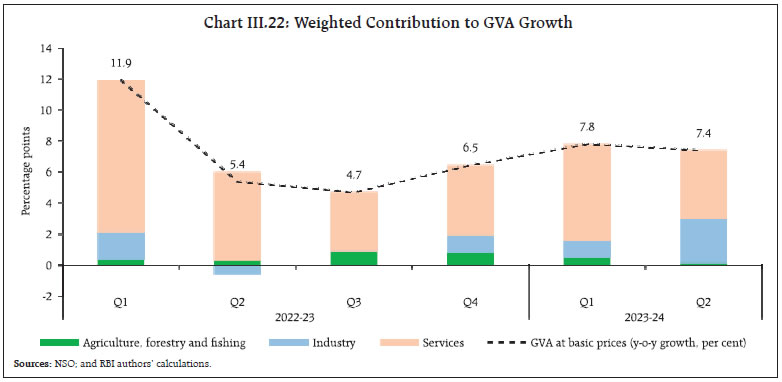
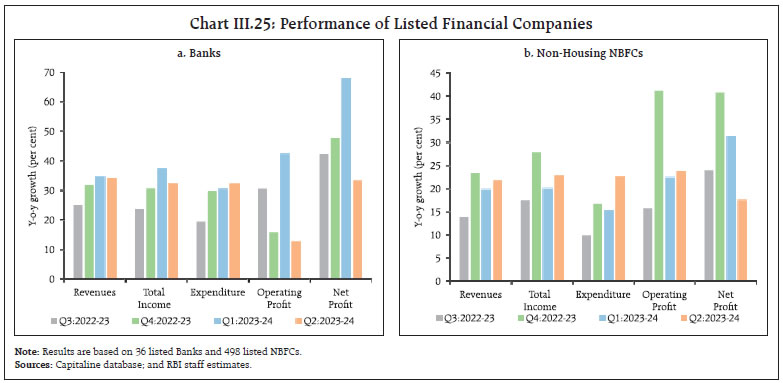
 Amidst pick-up in credit demand and rising interest rates, revenue of listed banks, grew strongly at more than 30 per cent (y-o-y). However, with stronger rise in expenditure coupled with slower total income growth, the growth in profits moderated in Q2:2023-24 (Chart III.25a). Income and operating profits of listed non-banking financial companies (NBFCs), excluding housing finance companies, rose by 22.9 per cent and 23.7 per cent on an annual (y-o-y) basis in Q2:2023-24. Their net profits rose by 17.6 per cent, aided by decline in the expenses to income ratio to 63.9 per cent from 69.0 per cent in the previous quarter (Chart III.25b). 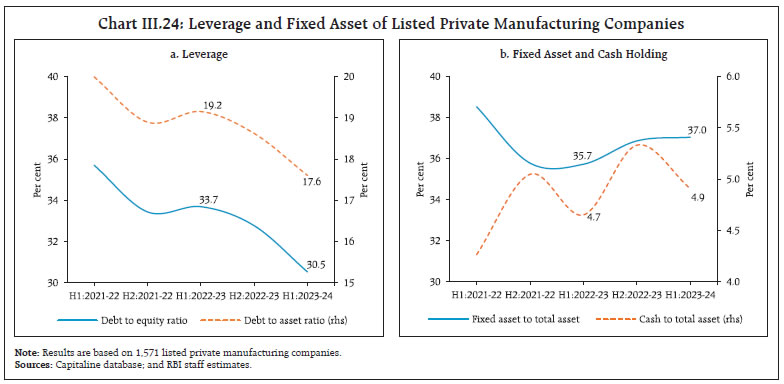
 Turning to Q3, the north-east monsoon remains deficient (with a cumulative deviation of -4.0 per cent during Oct.01- Dec.18, 2023), driven down by below normal rainfall in Central India (-21.0 per cent) and Southern peninsula (-12.0 per cent) (Chart III.26a). The reservoir position has also remained below that of previous years as well as decade average levels (Chart III.26b). Additionally, localised unseasonal rains in many parts of the country have also impeded rabi sowing. As on December 15, rabi sowing declined in all the major crop groups, except oilseeds and coarse cereals, from levels recorded a year ago (Chart III.26c). Nonetheless, the acreage under major crops is expected to improve in the coming weeks as weather conditions normalise. 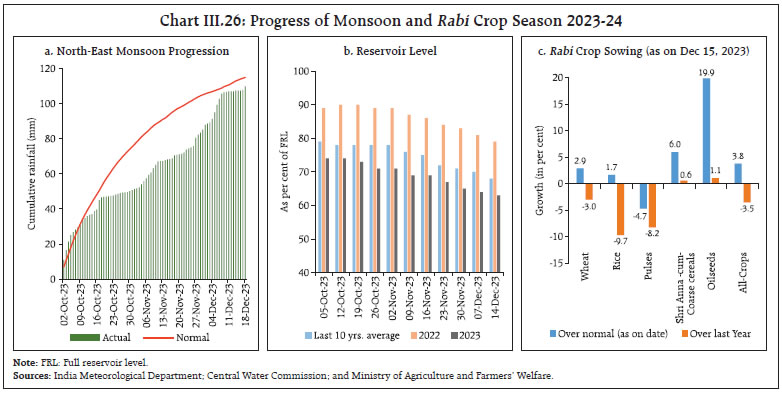 Along with the prediction of moderate to strong El Niño conditions, the Indian Meteorological Department (IMD) has also indicated the likely occurrence of above-normal maximum and minimum temperatures over most parts of the country in the winter season (Chart III.27a and III.27b). The cumulative procurement of rice in Kharif Marketing Season 2023-24 (KMS 2023-24) at 245 lakh tonnes as on December 17 was 15 per cent lower than a year ago, reflecting the lower production of kharif paddy (as per first advance estimates) in most of the rice producing states. Mandi arrivals have, however, shown a significant improvement in response to the higher prices than the minimum support price (MSP) for paddy. On the other hand, cumulative wheat procurement in Rabi Marketing Season (RMS) 2023-24 rose by 39.4 per cent (y-o-y). The combined cereal stock stood at 2.0 times the combined buffer norm in end-November, 13.2 per cent higher y-o-y. As part of measures to tame domestic inflation, the Government started weekly e-auctions under the open market sale scheme (OMSS) in June 2023. So far, twenty-five e-auctions have been completed up to December 13, 2023. The headline PMI for the manufacturing sector expanded to 56.0 in November 2023 from 55.5 a month ago on the back of an increase in new orders, output and employment (Chart III.28a). The PMI for services remained strong at 56.9 in November, albeit undergoing a sequential moderation (Chart III.28b). Various indicators of transport activity point towards a gathering pace. Cargo traffic at major ports recorded a growth of 17 per cent (y-o-y) in November 2023, driven by increased freight traffic of coal, iron ore and petroleum, oil and lubricants (POL) [Chart III.29a]. A pick-up in freight movement of coal and containerised cargo also resulted in railway freight revenue maintaining growth albeit with a dip in momentum (Chart III.29b).
The construction sector continued its momentum as steel consumption grew by 16.2 per cent (y-o-y) in November and cement production expanded by 17.1 per cent in October (Chart III.30). High frequency indicators for the services sector remained robust in October/November 2023, led by festival demand (Table III.1). In terms of regional policy initiatives, West Bengal launched a series of new policies − West Bengal Logistics Policy; West Bengal New and Renewable Energy Manufacturing Promotion Policy; West Bengal Export Promotion Policy; and Industrial and Economic Corridor Policy − that aim to raise exports, meet energy demand through renewable sources, improve logistics, and become the top industrial destination. Arunachal Pradesh launched a logistics policy to augment and integrate multimodal connectivity infrastructure. Tamil Nadu launched India’s first AI-focused technology business incubator “AI Venture Factory” to provide AI entrepreneurs a nurturing environment through technological, business, and financial support.11
Inflation Headline inflation, as measured by y-o-y changes in the all-India consumer price index (CPI)12, increased to 5.6 per cent in November 2023 from 4.9 per cent in October (Chart III.31). This pick-up was driven by a positive momentum of around 55 bps on top of an unfavourable base effect of around 10 bps. All the three major groups recorded positive momentum with a m-o-m increase of around 90 bps in food prices, 5 bps in fuel prices, and 25 bps in the core group (i.e., excluding food and fuel). Food inflation (y-o-y) registered an increase of 1.7 percentage points, rising to 8.0 per cent in November from 6.3 per cent during September-October. This was on account of a sharp price momentum of 90 bps reinforced by an unfavourable base effect of 70 bps. In terms of sub-groups, inflation in vegetables picked up sharply due to a steep rise in onion and tomato prices. Inflation in pulses, fruits, sugar and non-alcoholic beverages also registered an increase while it moderated in respect of cereals, meat and fish, eggs, milk, spices and prepared meals. The rate of deflation in edible oils and fats deepened in November (Chart III.32). The fuel and light group moved further into deflation to (-) 0.8 per cent in November from (-) 0.4 per cent in October, mainly due to softening of inflation in firewood and other cooking fuel. The deflation in kerosene prices deepened in November. While LPG prices remained in double digit deflation, electricity price inflation continued to be in double digit (y-o-y). Core inflation moderated to 4.1 per cent in November from 4.2 per cent in October, softening across sub-groups such as clothing and footwear, housing, household goods and services, recreation and amusement, pan tobacco and intoxicants, and education. Inflation in personal care and effects remained steady while that of transport and communication edged up (Chart III.33).
In terms of regional distribution, rural inflation stood at 5.85 per cent, higher than urban inflation at 5.26 per cent in November 2023. Majority of the states recorded inflation less than 6 per cent (Chart III.34). High frequency food price data for December so far (up to 18th) show that while cereal and pulses prices rose further, edible oil prices continued on a broad-based decline (Chart III.35). Amongst key vegetables, onion prices, though elevated, are showing signs of correction in December. Potato prices declined while tomato prices registered an uptick. Retail selling prices of petrol and diesel in the four major metros have remained stable in December so far (up to 18th). While kerosene prices softened further, LPG prices remained unchanged in December so far (Table III.2).
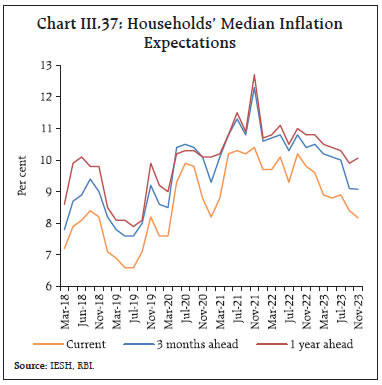
The PMIs for November 2023 indicated a moderation in input as well as output costs across manufacturing and service sectors (Chart III.36). Household’s inflation perceptions of current inflation continued to decline in November 2023 (Chart III.37).13 Three month ahead inflation expectations remained unchanged in single digits, while the one year ahead expectations exhibited a pick-up by 20bps in November. | Table III.2: Petroleum Products Prices | | Item | Unit | Domestic Prices | Month-over-month (per cent) | | Dec-22 | Nov-23 | Dec-23^ | Nov-23 | Dec-23^ | | Petrol | ₹/litre | 102.92 | 102.92 | 102.92 | 0.0 | 0.0 | | Diesel | ₹/litre | 92.72 | 92.72 | 92.72 | 0.0 | 0.0 | | Kerosene (subsidised) | ₹/litre | 59.00 | 55.21 | 52.09 | -4.7 | -5.7 | | LPG (non-subsidised) | ₹/cylinder | 1063.25 | 913.25 | 913.25 | 0.0 | 0.0 | ^: For the period December 1-18, 2023.
Note: Other than kerosene, prices represent the average Indian Oil Corporation Limited (IOCL) prices in four major metros (Delhi, Kolkata, Mumbai and Chennai). For kerosene, prices denote the average of the subsidised prices in Kolkata, Mumbai and Chennai.
Sources: IOCL; Petroleum Planning and Analysis Cell (PPAC); and RBI staff estimates. |
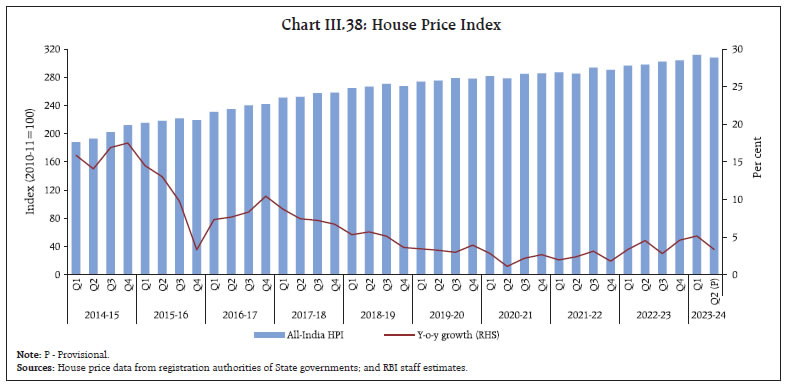 The all-India house price index (HPI)14 increased by 3.4 per cent (y-o-y) during Q2:2023-24 as against 5.1 per cent in the previous quarter and 4.5 per cent a year ago. On a sequential basis (q-o-q), however, the HPI declined by 1.2 per cent, despite seven out of the ten cities covered in the index exhibiting sequential increases (Chart III.38). IV. Financial Conditions Elevated government cash balances on account of robust tax collections resulted in withdrawal of liquidity from the banking system despite the return of currency during the second half of November 2023. The usual month-end government spending alleviated the stress to some extent. Banks took larger recourse to the marginal standing facility (MSF) during November 16–December 15, 2023 than during October 16–November 15, 2023 (Chart IV.1). At the same time, deployment of funds by the banks under the standing deposit facility (SDF) also averaged higher than during October 16–November 15, 2023. In view of the likely outflows from the banking system on account of advance tax and GST payments in December, the Reserve Bank injected liquidity amounting to ₹1.0 lakh crore on December 15 by conducting a 7-day VRR auction (in lieu of the main operation). Overall, injection of liquidity on a net basis under the liquidity adjustment facility (LAF) averaged ₹0.5 lakh crore during November 16–December 15, 2023. As noted in the Governor’s policy statement of October 2023, the simultaneous placement of large funds under the SDF and large recourse to the MSF is somewhat paradoxical. In order to enable better fund management by the banks, it was decided in December to allow reversal of liquidity facilities under both the SDF and the MSF even during weekends and holidays with effect from December 30, 2023. This is expected to alleviate the tightness in liquidity conditions during the weekends, provide banks with flexibility in operations and impart greater efficiency to liquidity management.15 Reflecting these developments, overnight money market rates – the weighted average call rate (WACR); the triparty repo rate; and the market repo rate hovered around the ceiling of the LAF corridor. The average spread over the policy repo rate at 23 bps, 28 bps and 29 bps, respectively, during November 16 - 30 (including Saturday/ holidays), eased to 19 bps, 23 bps and 22 bps, respectively, during December 1 - 15, 2023. In the term money segment, yields firmed up across 3-month treasury bills (T-bills), 3-month certificates of deposit (CDs) and 3-month commercial papers (CPs) for non-banking financial companies (NBFCs) [Chart IV.2b]. In particular, the regulatory measures on consumer credit and bank credit to NBFCs announced by the Reserve Bank on November 16, 2023 had a significant hardening impact on CP rates for NBFCs.16 Accordingly, the money market risk premium (3 month CP for NBFCs minus 91 days T-bill rate) hardened to 95 bps during November 16–December 15 from 82 bps during October 16–November 15, 2023. 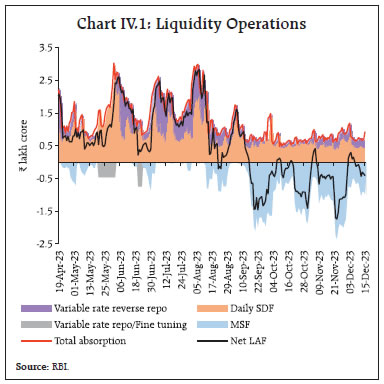 In the primary market, fund mobilisation through issuances of CDs remained robust at ₹4.6 lakh crore during 2023-24 (up to December 1), higher than ₹4.2 lakh crore a year ago. Banks’ issuance of CDs increased to bridge the gap between credit offtake and deposit growth (Chart IV.3). CP issuances at ₹8.9 lakh crore (up to November 30) were lower than ₹9.3 lakh crore during the same period a year ago. Softening US treasury yields and buying support from foreign portfolio investors (FPIs) kept G-sec yields largely range bound. The yield on the 10-year G-sec benchmark was at 7.16 per cent on December 15 as compared with 7.22 per cent on November 15 (Chart IV.4a and IV.4b). The average term spread in the G-sec market (10-year minus 91-day treasury Bills) during November 16 to December 15 at 30 bps remained moderate, reflecting stable domestic financial conditions.
Three-year corporate bond yields and associated risk premia declined sharply, reflecting healthy investor appetite in this segment while it firmed up in the 5-year segment during November 16 - December 15, 2023 (Table IV.1). Overall, corporate bond issuances during 2023-24 (up to November) were higher at ₹5.0 lakh crore than ₹3.9 lakh crore a year ago.
| Table IV.1: Corporate Bonds - Rates and Spread | | Instrument | Interest Rates (per cent) | Spread (basis points) (Over Corresponding Risk-free Rate) | | Oct 16, 2023 – Nov 15, 2023 | Nov 16, 2023 – Dec 15, 2023 | Variation | Oct 16, 2023 – Nov 15, 2023 | Nov 16, 2023 – Dec 15, 2023 | Variation | | 1 | 2 | 3 | (4 = 3-2) | 5 | 6 | (7 = 6-5) | | Corporate Bonds | | | | | | | | (i) AAA (1-year) | 7.80 | 7.90 | 10 | 54 | 64 | 10 | | (ii) AAA (3-year) | 8.00 | 7.75 | -25 | 55 | 40 | -15 | | (iii) AAA (5-year) | 7.82 | 7.92 | 10 | 36 | 55 | 19 | | (iv) AA (3-year) | 8.61 | 8.40 | -21 | 117 | 105 | -12 | | (v) BBB-(3-year) | 12.26 | 12.03 | -23 | 482 | 468 | -14 | Note: Yields and spreads are computed as monthly averages.
Sources: FIMMDA; and Bloomberg. | Macroeconomic uncertainty, as measured from responses of professional forecasters (SPF)17 survey suggested that uncertainty induced by the COVID-19 pandemic in 2020 ebbed from 2022 and has continued to remain benign since then (Chart IV.5). Reserve money (RM), excluding the first-round impact of change in the cash reserve ratio (CRR), recorded a growth of 6.2 per cent (y-o-y) as on December 8, 2023 (8.2 per cent a year ago) [Chart IV.6]. Currency in circulation (CiC), the largest component of RM, decelerated to 4 per cent from 8 per cent a year ago, reflecting the withdrawal of ₹2,000 banknotes.18 Money supply (M3), excluding the impact of the merger of a non-bank with a bank (with effect from July 1, 2023), rose by 11.2 per cent (y-o-y) as on December 1, 2023 (9.1 per cent a year ago). Aggregate deposits with banks, the largest component of M3, increased by 12.2 per cent (9.3 per cent a year ago). SCBs’ credit growth (excluding the impact of the merger) moderated from 17.5 per cent a year ago to 16.4 per cent as on December 1, 2023 (Chart IV.7).
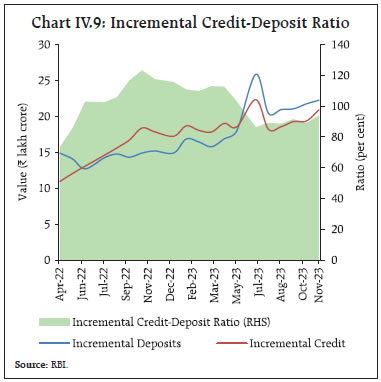
Deposit growth (excluding the impact of the merger), which had spurted in the wake of withdrawal of ₹2000 banknotes, has now stabilised (Chart IV.8). During June 2022-May 2023, the incremental credit-deposit ratio rose above 100 per cent, but has been declining thereafter reflecting the surge in deposits mobilisation. In November 2023, the incremental credit-deposit ratio stood at 94.0 per cent, above its decadal average of 76.8 per cent (Chart IV.9). 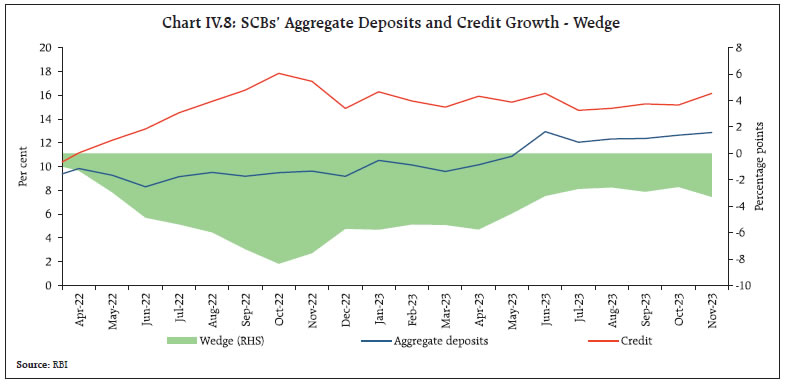
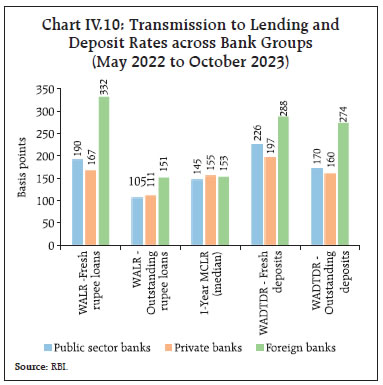
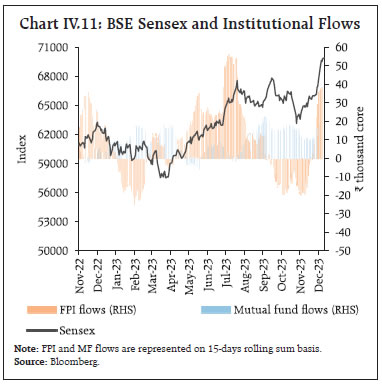
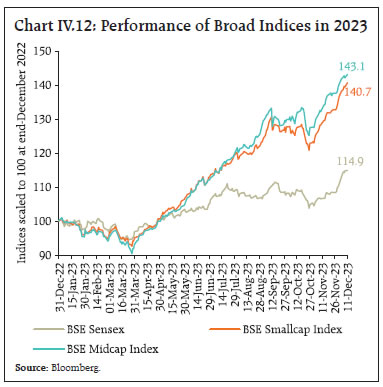
 Monetary policy transmission is still working its way through the credit market.19 During May 202220 to October 2023, the weighted average lending rate (WALR) on fresh rupee loans increased by 199 bps, including an increase of 18 bps since April 2023. The WALR on outstanding rupee loans increased by 112 bps during May 2022 to October 2023. On the deposit side, the weighted average domestic term deposit rates (WADTDRs) on fresh and outstanding deposits increased by 228 bps and 172 bps, respectively, during the same period. While the WADTDR on fresh deposits has declined in recent months, rates on outstanding term deposits continue to increase with the repricing of term deposits (Table IV.2). The pass-through to WALR on fresh rupee loans and to WADTDR on fresh deposits was higher for public sector banks than for private banks, while the transmission to WALR on outstanding loans was higher for private banks (Chart IV.10). In November 2023, domestic equity indices recorded gains, propelled by positive global cues and favourable corporate earnings for Q2:2023-24. In December so far, the momentum has been reinforced, with the BSE Sensex recording a significant increase from the end of October and closing at a new all-time high of 71,315 as of December 18, 2023 (Chart IV.11). During the same period, the broader market indices, as measured by the BSE midcap and BSE smallcap index, gained by 16.2 per cent and 14.5 per cent, respectively, extending their recent outperformance vis-à-vis the benchmark Sensex (Chart IV.12). The total market capitalisation of BSE listed firms crossed the historic US$ 4 trillion mark on November 29, making the Indian market the fifth largest in the world. | Table IV.2: Transmission from the Repo Rate to Banks’ Deposit and Lending Rates | | (Variation in basis points) | | Period | Repo Rate | Term Deposit Rates | Lending Rates | | WADTDR (Fresh Deposits) | WADTDR (Outstanding Deposits) | EBLR | 1 - Year MCLR (Median) | WALR (Fresh Rupee Loans) | WALR (Outstanding Rupee Loans) | | Feb 2019 to Mar 2022 | -250 | -259 | -188 | -250 | -155 | -232 | -150 | | May 2022 to Oct 2023 | 250 | 228 | 172 | 250 | 156* | 199 | 112 | | Of which: | | | | | | | | | Apr to Oct 2023 | 0 | -17 | 59 | 0 | 20* | 18 | 12 | *: Latest data on MCLR are up to November 2023.
Notes: 1. WALR: Weighted average lending rate; WADTDR: Weighted average domestic term deposit rate; EBLR: External benchmark-based lending rate; and MCLR: Marginal cost of funds-based lending rate.
2. Data on EBLR pertain to 32 domestic banks.
Source: RBI. |
 Low secondary market volatility and attractive valuations aided primary market fund raising through initial public offerings (IPOs). In November, primary market fund raising through IPOs stood at ₹13,431 crore which was the highest single month tally since May 2022 (Chart IV.13).
Five mainboard IPOs were listed in the last week of November21 with an average oversubscription22 of 32.2 times. The total IPO subscription from these issues amounted to ₹2.6 lakh crore as against a total issue size of ₹7,379 crore. New issuances have witnessed heavy oversubscription in 2023-24 so far. (Chart IV.14). Net foreign direct investment (FDI) at US$ 5.9 billion rose to a 21-month high in October 2023, primarily due to strong gross inflows and lower repatriation (Chart IV.15). Around four-fifths of the gross inward FDI equity flows were received in manufacturing, retail and wholesale trade, electricity and other energy sector, and financial services sector. The major source countries were Mauritius, Singapore, Cyprus and Japan, contributing more than four-fifths of the total FDI inflows in October 2023. During 2023-24 so far (April-October), net FDI moderated to US$ 10.4 billion from US$ 20.8 billion a year ago. Amidst global de-risking efforts, emerging economies like India remain attractive investment destinations. 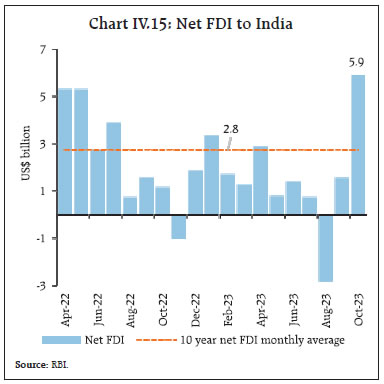 FPIs turned net buyers in Indian capital markets in November 2023 after two months. Net FPI inflows were to the tune of US$ 3.9 billion in November (Chart IV.16a). Net inflows in the equity segment stood at US$ 2.3 billion in November, comparable to other emerging market peers (Chart IV.16b). Sovereign bond, consumer services and capital goods attracted the highest investments during the month. The debt segment has attracted inflows throughout the current financial year, reaching the highest monthly level in November 2023 since September 2021. This is supported by the announcement of the inclusion of Indian government bonds in the Global Bond Index-Emerging Markets (GBI-EM) index next year. FPIs invested US$ 6.7 billion in domestic markets in December 2023 (up to December 15). During the current financial year (up to December 15), net FPI inflows to India remained strong at US$ 29.0 billion, reversing net outflows of US$ 15.3 billion and US$ 5.9 billion in 2021-22 and 2022-23, respectively. During April-October 2023, net accretions to non-resident deposits rose to US$ 6.1 billion from US$ 3.1 billion a year ago, primarily led by a rise in net accretions to Foreign Currency Non-Resident [FCNR(B)] accounts. ECB registrations and disbursements were higher at US$ 29.8 billion and US$ 21.8 billion, respectively, during April-October 2023 than in the corresponding period last year. Adjusting for principal repayments, net ECB inflows stood at US$ 6.9 billion this year so far as against a net outflow of US$ 2.4 billion a year ago (Chart IV.17). Nearly three-fourths of the new ECBs registrations during April-October 2023 were earmarked for capital expenditure (viz., development, whereas the rest was raised for refinancing of earlier ECBs/ rupee loans, working capital and other purposes (Chart IV.18).
The cost of ECBs continues to rise in step with the global monetary policy tightening cycle, viz., the secured overnight financing rate (SOFR) rose by 48 bps during March-October 2023. Combined with the movement in the weighted average interest margin (WAIM), it resulted in a rise in the overall cost of ECBs to 7.3 per cent in October 2023 from 6.7 per cent in March 2023. Over the last one year, the average cost of ECB loans rose by 314 bps even as WAIM came down to 154 bps from 170 bps a year ago (Chart IV.19). The foreign exchange reserves stood at US$ 606.9 billion on December 8, 2023 covering 10.4 months of imports projected for 2023-24 and 96 per cent of total external debt outstanding at end-June 2023 (Chart IV.20a). India’s foreign exchange reserves were the fourth highest among major foreign exchange reserves holding countries, having increased by US$ 28.4 billion during 2023-24 so far (Chart IV.20b)
The INR exhibited the least volatility among major currencies depreciating modestly by 0.1 per cent (m-o-m) vis-à-vis the US dollar in November 2023 (Chart IV.21). The INR depreciated (m-o-m) in terms of 40-currency real effective exchange rate (REER) in November 2023 as depreciation of the INR in nominal effective terms more than offset positive relative price/cost differentials (Chart IV.22).
Payment Systems Digital transactions posted robust growth in November 2023 across major payment systems (Table IV.3). E-commerce order volumes surged by 37 per cent (y-o-y) due to festival sales and more than 50 per cent of the total sales in the year occurred through online platforms.23 On the retail front, the Unified Payments Interface (UPI) achieved a record transaction value of ₹17.4 lakh crore, despite a marginal dip in volumes. Merchant transactions on the UPI platform, however, recorded a 74 per cent jump (y-o-y), totalling over 6.5 billion transactions. Credit card spending also reached a high of ₹1.8 lakh crore in October, reflecting a 38 per cent rise (y-o-y). Transactions under the National Automated Clearing House (NACH) also point to a boost in demand from rural and semi-urban centres, attributed to fund disbursals and loan repayments. 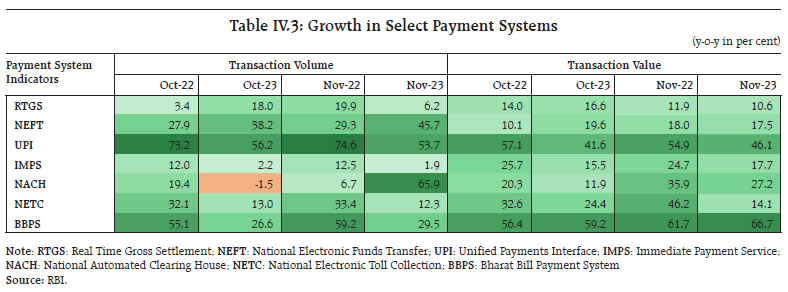 In a move towards enhanced cross-border cooperation in international clearing, the Reserve Bank and the Bank of England (BoE) signed a Memorandum of Understanding (MoU) for exchange of information in relation to the Clearing Corporation of India Limited (CCIL). On the payments front, the National Payments Corporation of India (NPCI) issued guidelines for merchant onboarding under the peer-to-peer-merchant (P2PM) category, aimed at integrating small merchants with low-value transaction sizes into the digital framework and aligning category-specific guidelines within the UPI ecosystem.24 In the Statement on Developmental and Regulatory Policies announced on December 08, 202325, the Reserve Bank announced a slew of measures to bolster the ongoing digital drive, including the enhancement of the UPI transaction limit for payments to hospitals and educational institutions from ₹1 lakh to ₹5 lakh per transaction; enhancement of the limits for e-mandates for recurring online payments without any additional factor of authentication (AFA) from ₹15,000 to ₹1 lakh for mutual fund subscriptions, insurance premiums and credit card payments; establishment of a cloud facility for the Indian financial sector; and the setting up of a FinTech repository to gather information about FinTechs for designing appropriate policy approaches. Conclusion In this challenging milieu, the monetary policy committee (MPC) revised upwards the real GDP forecast for 2023-24 to 7 per cent, maintained its inflation forecast for the year at 5.4 per cent and voted in its fifth bi-monthly meeting for the year 2023-24 to maintain status quo with regard to the policy interest rate. It also persevered with its stance of withdrawal of accommodation, stressing that the course of disinflation needs to be sustained. While it drew comfort from the steady easing of core inflation in response to the restrictiveness of monetary policy, the MPC expressed concerns that ‘recurring food price shocks are impeding the ongoing disinflation’ and rendering headline inflation volatile. This runs the risk of un-anchoring inflation expectations. The MPC also took note of the strong momentum in investment demand that is driving growth but remained ‘resolute in its commitment to aligning inflation to the target’.26 The softer inflation prints for September and October 2023 and the prolonged pause in the stance of monetary policy has engendered a certain hypermetropia among some stakeholders – an irrational long-sightedness whereby inflation forecasts gravitating towards the 4 per cent target sometime in the distant future are sighted clearly whereas high near-term risks of spikes in inflation outcomes on the back of food volatility are blurred. Under these conditions, a clamour rises for rate cuts or at least that the central bank commits to a path of moderation in the level of the policy rate. Such views imperil the conduct of monetary policy in the pursuit of its goal of durably aligning inflation with the target. These views also undermine the foundations of growth. Projections indicate that inflation will go up further from the September-October 2023 average of 4.9 per cent before it can come down – the projection for Q3: 2023-24 is 5.6 per cent; for the year 2023-24 it is 5.4 per cent; and for the first three quarters of 2024-25 it is 4.6 per cent. The objective of aligning inflation with the target on a durable basis is far from assured. In earlier editions of this article, we have pointed out that households’ inflation expectations are still not settled; business and consumer confidence in the inflation outlook is yet to turn optimistic. On a real-time basis, inflation is hurting discretionary consumer spending and this, in turn, is holding back topline growth of manufacturing companies as well as their capex. If inflation is not brought back to the target and tethered there, there is a strong likelihood that growth may falter. On this note, we conclude with a befitting reference to the words of Shri Shaktikanta Das, Governor:27 “Policy makers have to be mindful of the risk of being carried away by a few months of good data or by the fact that CPI inflation has come within the target range…..they have to be watchful of the risks from new shocks that could hit the economy from anywhere anytime. We have now reached a stage when every action has to be thought through even more carefully to ensure overall macroeconomic and financial stability; more so, because the conditions ahead could be fickle. We have to remain vigilant and ready to act, as per the evolving outlook.”
|