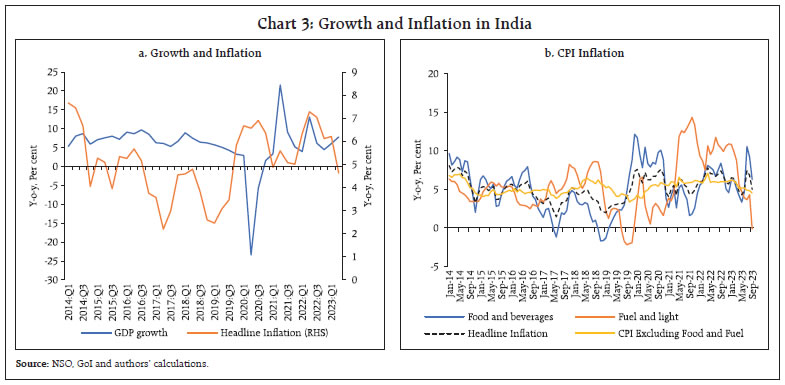
by Himani Shekhar, Vimal Kishore and Binod B. Bhoi^ This study disentangles the role of demand and supply in driving inflation in India by using consumer price index (CPI) subgroups as indicators of prices and deflated consumption expenditure data from the Centre for Monitoring Indian Economy (CMIE) as proxy for quantity in a vector auto regression (VAR) framework. The estimated residuals from one-period ahead forecasts of price and quantity with the same signs are interpreted as reflective of demand factors, and with the opposite signs as indicative of supply factors. The results show that the inflation surge during the first wave of COVID-19 was mainly supply driven, while it was increasingly demand driven post the Russia-Ukraine conflict. I. Introduction The post-pandemic surge in inflation across economies posed a major challenge for monetary policy makers around the world. Amidst repeated waves of COVID-19 infections and associated lockdowns and restrictions, the Russia-Ukraine conflict with the consequent supply disruptions and commodity price boom, and the large-scale fiscal and monetary policy stimuli since the onset of the pandemic, it became challenging for central banks to assess the relative role of demand and supply factors in the evolving inflation dynamics. In the early phase of the pandemic, lockdowns and restrictions across advanced economies (AEs) and emerging market and developing economies (EMDEs) led to contraction in economic activities. The vaccine rollout and adaptation to the pandemic life opened scope for gradual easing of pandemic time restrictions and shift in demand towards goods away from contact intensive services, creating sectoral supply-demand imbalances and price pressures. Subsequently, the release of pent-up demand supported by fiscal and monetary impetus led to rebound in commodity prices, a stronger than expected economic recovery across regions and marked increase in consumer price inflation in many AEs and EMDEs. In this regard, the IMF noted that, “while monetary policy can generally look through transitory increases in inflation, central banks should be prepared to act quickly if the risks of rising inflation expectations become more material in this uncharted recovery” (IMF, 2021). In the highly uncertain environment, accommodative policies continued in most economies during 2021. The outbreak of Russia-Ukraine conflict in February 2022, however, led to renewed supply disruptions and global shortages in key food, energy and other commodities, causing a sharp increase in their prices. Consequently, a number of economies experienced a rapid rise in inflation, which in an environment of tighter labour market conditions, especially in AEs, raised the risks of destabilisation of inflation expectations and inflation becoming generalised. As a result, many central banks, both AEs and EMDEs, resorted to aggressive tightening of monetary policy to keep inflation expectations anchored and bring inflation back to the target. EMDEs had to additionally contend with heightened financial market volatility and depreciation pressures on their currencies. The globalisation of inflation, and an assessment that the price pressures are not transitory led to a synchronised monetary policy tightening (RBI, 2023). It has also been argued that central banks erred on the side of interpreting the initial inflation surge as temporary and fell behind the curve in their inflation fight (Walsh, 2022; Kronick and Ambler, 2023) which led inflation to reach multi-decade highs in many AEs. A pertinent question that arises is what could have helped central banks to react to the inflation surge in a timely manner? Post-pandemic literature emphasised on the role of both adverse supply shocks such as supply bottlenecks and higher energy prices (Budianto et al., 2021) as well as excess demand caused by catch-up effects and large-scale monetary and fiscal stimulus due to the COVID-19 pandemic (Summers, 2021; Furman, 2022). Amidst both demand-and supply-side factors at play, it is crucial to understand to what extent the post-COVID surge in inflation is led by demand or supply, as while the former would suggest for monetary and fiscal policy tightening, the later would lead to tricky policy trade-offs (Eickmeier and Hofmann, 2022). In this context, assessing disaggregated personal consumption expenditure (PCE) inflation by spending category in the US, Shapiro (2022a) provided a novel approach to quantify and track the evolving impact of supply-driven versus demand-driven factors on inflation on a monthly basis to guide policy. India has experienced episodes of short inflation spikes even before the pandemic (for example, December 2019-February 2020) due to weather induced food price shocks, but its frequency has increased since the pandemic with overlapping global shocks – Russia-Ukraine conflict and synchronised monetary policy tightening - disrupting supply, pushing up commodity prices and inducing financial market volatility. Notably, food and fuel occupy more than 50 per cent of India’s CPI basket suggesting that the role of supply side shocks in driving inflation may be higher compared to AEs. Despite India being a food surplus country, recent experiences show that supply issues from not only weather disturbances but also trade channel1 could be significant in influencing domestic food inflation dynamics, while volatility in international crude oil prices could impinge on inflation both directly and indirectly in view of large import dependence. Moreover, CPI food basket contains protein rich items which could exhibit demand driven price pressures associated with increase in income levels (Gokarn, 2011). Thus, while certain supply shocks in food items such as vegetables could be temporary, some others related to global supply concerns and consumption shifts induced by rising incomes could be persistent. On the other hand, most of the items in core (i.e., excluding food and fuel) could be largely driven by demand, but could also reflect the pass-through of sustained input costs pressures. Thus, with both demand and supply factors affecting prices of different CPI items/sub-groups to varying degrees during different episodes, it may be pertinent not only to analyse the drivers of inflation but also quantify the impact of demand-and supply-factors driven inflation regularly to guide policy making. With RBI being entrusted with the primary objective of maintaining price stability2 and the impact of shocks varying from temporary to persistent, a constant monitoring of the demand-supply dynamics assumes greater importance for designing appropriate policy response. Against this backdrop, following the methodology used by Shapiro (2022a) this study runs a bi-variate vector auto regressive (VAR) model on a rolling window on price and quantity equations and analyses their one-period ahead forecast residuals (i.e., actual minus predicted value) to determine the direction of price and volume shocks for various CPI groups. The unexpected change in price and quantity in the same direction would suggest a dominance of demand factors, while opposite direction movements would suggest supply factors at work. The study finds that supply-driven factors remained the key driver of inflation during COVID-19. In contrast, demand driven inflation attained importance post the Russia-Ukraine conflict. Furthermore, a 9-month rolling window analysis on the contributions of demand and supply to inflation shows that demand drivers of inflation not only increased but also remained consistently elevated post-April 2022 in contrast with the first wave of COVID-19 when it gradually tapered off. On the other hand, supply driven inflation which rose sharply after the first wave of COVID-19, tapered off significantly thereafter, until the Russia-Ukraine conflict again pushed up its contribution to some extent. In view of these inflation dynamics and drivers, the commencement of monetary tightening in April-May 2022 in India was timely. The policy repo rate was increased by 250 basis points (bps) during May 2022-February 2023 to keep inflation expectations anchored and to ensure that inflation progressively aligns to the target. The remainder of this article is organised along the following lines. The associated literature and global perspectives are discussed in Section II. The historical and structural aspects of India’s CPI inflation are provided in Section III, while the methodology associated with disentangling demand- and supply-factors driving inflation is discussed in Section IV. Using the methodology outlined in the previous section, Section V provides the empirical estimates and presents the key findings. Section VI concludes the article. II. Literature Both supply and demand factors have been identified by researchers and policymakers as the proximate causes for the post-pandemic surges in inflation across AEs. Barnichon and Shapiro (2022) illustrated the effects of supply-side elements such as labour shortages, whereas Barnichon, et al., (2021) and Jordà et al., (2023) highlighted the significance of increased demand resulting from pandemic-related tax relief. Using a structural factor model and applying principal component analysis to identify aggregate demand and supply indicators for the US, the increase in inflation since the middle of 2021 was found to be driven by a mix of expansionary demand and tight supply (Eickmeier and Hoffman, 2022). Estimates using structural VAR models indicated that demand shocks in the US explained about 75 per cent of the observed inflation during January 1997 to December 2022, while in the case of Euro area the shocks were balanced (Dreger, 2023). Using a multi-sector, open-economy New Keynesian framework, binding constraints either due to increased demand or reductions in capacity for domestic and foreign producers were found to shift domestic and import price Phillips curves up, which explained around 50 per cent of the increase in inflation during 2021 and 2022 in the US (Comin, et al., 2023). Supply-driven price increases accounted for a major part of the increase in inflation particularly for energy-intensive and trade-intensive items (Chen and Tombe, 2023). Demand-led economic recovery explained around 1.4 percentage point of the 5.6 percentage point rise in US inflation during March 2021 to September 2022 (Cerrato and Gitti, 2022). Around 60 per cent of US inflation over the period 2019-2021 was due to the increase in demand for goods, while 40 per cent was due to supply-related issues that amplified the impact of higher demand (Di Giovanni, 2022). This study claims that fiscal stimulus and other demand related factors would not have increased US inflation to such a high without the supply constraints associated with the pandemic. A decomposition analysis of headline inflation into core inflation and deviations of headline from core finds that shocks to headline inflation are mainly explained by energy price increases and supply chain problems (Ball et al., 2022). Supply factors reflecting continued labour shortages and global supply disruptions linked to the pandemic and the war in Ukraine accounted for more than half of the elevated PCE inflation in the US, while demand-side factors were responsible for about a third (Shapiro, 2022b). Although central banks typically react to increases in demand pressures for price stability, they cannot ignore supply side issues that can lead to second-round impact, particularly if the stabilisation of long-term inflation expectations is in jeopardy (Global Economic Outlook, 2022). The persistence of supply shocks could also increase the risks of high inflation with supressed economic growth (Shapiro, 2022a). For India, the role of supply side shocks may be higher compared to AEs due to the high weight of food in the CPI basket, which is more prone to supply shocks caused by unseasonal rains, rainfall deficiency, excess rains, cyclones, and other extreme weather events. In the absence of a stronger response of food supply, food inflation could be higher than non-food inflation on an average by 2.5–3.0 percentage points per annum (Anand et al., 2016). The study suggests that high weight of food in household expenditure along with the increase in income led to significant demand-side pressures. However, due to lower growth in agricultural supply relative to the growth in real personal consumption expenditure during the period of study, food prices increased relative to non-food prices. Demand factors such as money supply growth and output gap explained a large part of the variation in headline and food inflation, while supply side factors like global crude oil and food prices also played an important role (Dua and Goel, 2021). An augmented Phillips curve indicated that supply shocks only had a temporary effect on both headline and core inflation (Srinivasan et al., 2006). The study argues that supply shocks per se are not the key determinants of inflation rather how monetary policy responds to these supply shocks are. Another study found that inflation dynamics in India have altered over time with different determinants displaying noteworthy time variation, especially after the global financial crisis (Mohanty and John, 2014). Higher uncertainty is associated with both a fall in output and an increase in inflationary pressures, and therefore a clear understanding of inflation dynamics is important to avoid costly policy errors (Patra et al., 2023). However, while the existing studies have analysed a number of aspects relating to the inflation process in India, an assessment of the relative contributions of evolving demand and supply on a monthly basis to CPI headline inflation in the post-pandemic period has not been attempted so far. This study is an attempt to fill this gap. III. Stylised Facts The halt in production and slump in demand due to lockdowns at the onset of COVID-19 pandemic led to a sharp fall in economic growth across countries (Chart 1a). Due to the consequent weakness in overall demand conditions, commodity prices fell initially. Gradually, with the opening of the economy on vaccine rollout and release of pent-up demand, overall demand recovered faster than supply, thereby putting pressures on commodity prices (Chart 1b). Prices rose across all major categories, i.e., food, fuel and metals reflecting supply constraints amid demand recovery. COVID-related restrictions also heightened supply chain disruptions during 2021 and led to increases in freight costs, labour shortages and delays in delivery. The Russia-Ukraine conflict in early 2022 further amplified supply chain disruptions and commodity price pressures. In the early phase of the pandemic, AEs experienced a sharp fall in inflation in 2020 alongside contraction in economic activities due to the lockdowns and restrictions. In the EMDEs, however, inflation did not fall uniformly in 2020 even as economic activities contracted. Post the Ukraine conflict, inflation rose to multi-year highs across AEs and EMDEs in 2022 amid rising food and energy prices, renewed supply disruptions, stimulus-led faster economic recovery, tighter labour market conditions in AEs, and currency depreciation in EMDEs (Chart 2a). Compared to what was anticipated initially, inflation turned out to be more stubborn and persistent. This, in turn, prompted synchronised aggressive tightening of monetary policy across economies in 2022 (Chart 2b). 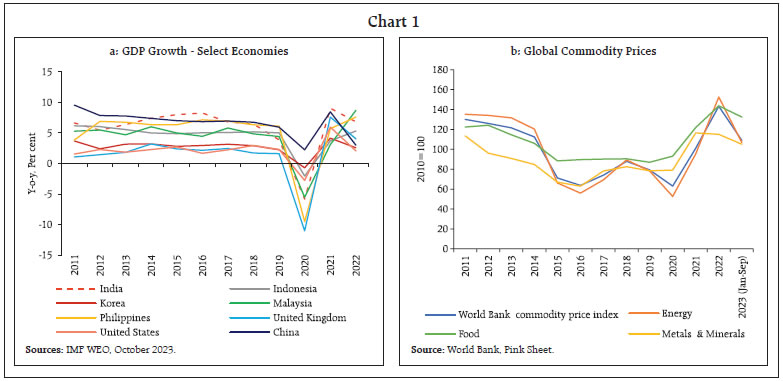 India also witnessed contraction in economic activity in 2020-21 due to the pandemic. However, in contrast with the experience of AEs, inflation rose in India reflecting the impact of weather induced food price shock and lockdown related supply disruptions and remained generally elevated during the various COVID-19 waves (Chart 3a). Amid pandemic uncertainties, the outbreak of Russia-Ukraine conflict further pushed up global commodity prices and aggravated supply disruptions leading to sharp increase in input cost pressures. This was gradually passed-on to output prices in line with economic recovery, which resulted in elevated core (i.e., CPI excluding food and fuel) inflation (Chart 3b). Consequently, headline inflation peaked at 7.8 per cent in April 2022. 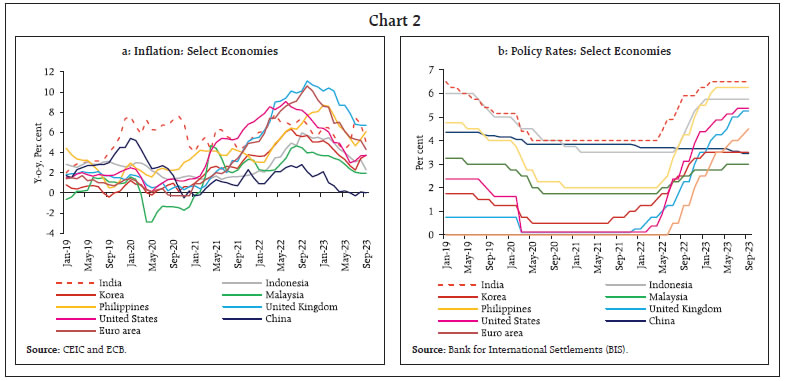
 It is difficult to gauge whether the inflation surges are temporary or persistent on a real time basis. These challenges are accentuated during periods of heightened macroeconomic uncertainty, and aggregative measures such as output gap and labour market conditions often fail to provide a clear signal about the entire economy due to shock induced distortions as well as lags in data availability. In this environment, an ongoing assessment of relative importance of demand and supply in driving inflation could be a useful guide for policy making. A decomposition of drivers of CPI inflation covering all the sub-groups can provide information on relative contributions to inflation (Chart 4). Such an exercise cannot, however, identify the inherent demand-supply mismatches in each category. This is notwithstanding the fact that inflation in food and fuel groups is generally assumed to be supply driven, while core inflation components are largely demand driven. To overcome this limitation and to provide a clear distinction between demand and supply drivers of inflation on a real time basis, Shapiro (2022a) provided a novel approach of using Personal Consumption Expenditures (PCE) based matching price and quantity data and the direction of their unexpected movements to disentangle the role of demand and supply. In the absence of matching price and quantity data, Organisation for Economic Co-operation and Development (OECD, 2022) extended the same approach to CPI as proxy for prices and national accounts data on household consumption expenditure as proxy for quantity. In the case of India, matching price and quantity (consumption by purpose) data are not available from the national accounts. CPI-Combined series (base year 2012) provide indices for 23 sub-groups which could be used as proxy for prices. National accounts provide household consumption expenditure data by purpose, but they are not available at higher frequency and required disaggregation3 making it difficult to map with the CPI sub-groups. However, the Centre for Monitoring Indian Economy (CMIE) releases survey-based consumer expenditure data for households (called Consumer Pyramid Household Survey – CPHS-data)4 on a monthly basis under 153 distinct expense heads (groups/items), which could be mapped to CPI sub-groups. A comparison of the expenditure shares in CPI and mapped CPHS expenditure categories shows that they are broadly similar, except mainly for housing, and therefore the two sources can be mapped and used as price and quantity for assessing the role of demand and supply (Table 1). 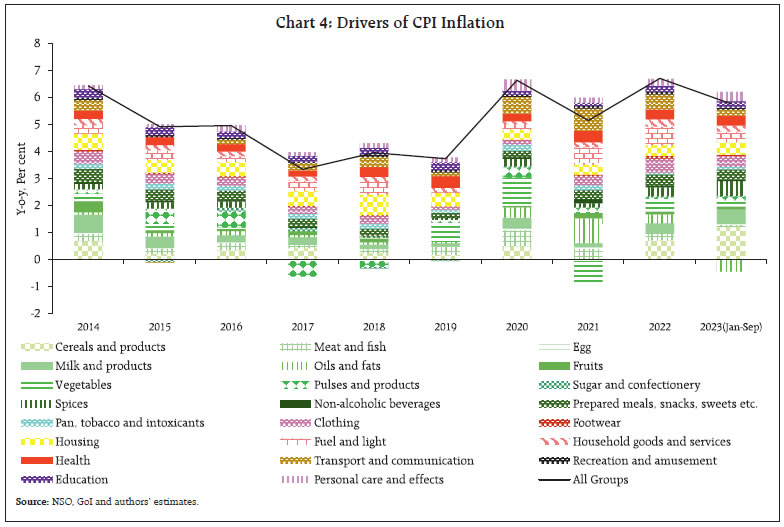
| Table 1: CPI-C Weights and Share of Expenditure in Mapped CMIE CPHS Categories | | CPI Subgroups (Base 2012=100) | Weight in CPI-C (per cent)
(Base: 2012=100) | Expenditure Shares (per cent) | | 2014 | 2015 | 2016 | 2017 | 2018 | 2019 | 2020 | 2021 | 2022 | | Cereals and products | 9.7 | 5.7 | 7.4 | 7.3 | 7.0 | 6.4 | 6.3 | 6.7 | 6.0 | 5.7 | | Meat and fish | 3.6 | 3.5 | 4.0 | 3.9 | 4.0 | 3.9 | 4.1 | 3.9 | 4.3 | 5.2 | | Egg | 0.4 | 0.7 | 0.9 | 1.0 | 0.9 | 0.7 | 0.7 | 0.8 | 0.8 | 0.9 | | Milk and products | 6.6 | 10.1 | 9.3 | 8.5 | 8.4 | 8.5 | 8.5 | 11.0 | 10.1 | 9.1 | | Oils and fats | 3.6 | 4.3 | 4.5 | 4.3 | 4.2 | 4.0 | 4.0 | 4.9 | 5.4 | 5.4 | | Fruits | 2.9 | 1.9 | 1.6 | 1.4 | 1.3 | 1.2 | 1.3 | 1.4 | 1.5 | 1.5 | | Vegetables | 6.0 | 7.1 | 6.7 | 6.5 | 6.4 | 6.3 | 6.3 | 7.2 | 6.9 | 6.3 | | Pulses and products | 2.4 | 2.9 | 2.9 | 2.9 | 2.6 | 2.2 | 2.2 | 2.5 | 2.4 | 2.2 | | Sugar and confectionery | 1.4 | 2.2 | 2.0 | 1.9 | 1.8 | 1.7 | 1.7 | 2.0 | 1.7 | 1.4 | | Spices | 2.5 | 1.7 | 1.8 | 1.7 | 1.6 | 1.4 | 1.3 | 1.5 | 1.4 | 1.3 | | Non-alcoholic beverages | 1.3 | 0.5 | 0.4 | 0.4 | 0.5 | 0.6 | 0.7 | 0.5 | 0.6 | 0.7 | | Prepared meals, snacks, sweets etc. | 5.6 | 5.8 | 5.3 | 5.1 | 5.3 | 5.1 | 5.3 | 5.3 | 5.4 | 5.5 | | Food and beverages | 45.9 | 46.5 | 46.7 | 44.9 | 44.1 | 42.1 | 42.4 | 47.7 | 46.3 | 45.2 | | Pan, tobacco and intoxicants | 2.4 | 3.1 | 3.4 | 3.3 | 3.4 | 3.5 | 3.8 | 3.8 | 4.1 | 3.8 | | Clothing | 5.6 | 3.4 | 3.7 | 4.1 | 4.0 | 4.2 | 4.2 | 3.0 | 2.9 | 2.9 | | Footwear | 1.0 | 1.0 | 1.0 | 1.1 | 1.0 | 1.0 | 1.0 | 0.8 | 0.8 | 0.9 | | Housing | 10.1 | 1.5 | 1.2 | 1.4 | 1.2 | 1.1 | 0.9 | 0.8 | 0.7 | 0.6 | | Fuel and light | 6.8 | 9.8 | 9.7 | 9.7 | 9.8 | 9.7 | 9.2 | 10.0 | 9.9 | 9.6 | | Household goods and services | 3.8 | 3.1 | 3.1 | 3.3 | 3.6 | 4.3 | 4.1 | 3.5 | 3.0 | 3.0 | | Health | 5.9 | 2.1 | 2.2 | 2.8 | 3.1 | 3.6 | 3.6 | 3.0 | 3.2 | 3.1 | | Transport and communication | 8.6 | 16.9 | 15.6 | 14.6 | 15.5 | 16.2 | 17.1 | 16.8 | 18.8 | 19.5 | | Recreation and amusement | 1.7 | 0.5 | 0.5 | 0.6 | 0.7 | 0.7 | 0.7 | 0.2 | 0.2 | 0.4 | | Education | 4.5 | 4.4 | 4.2 | 5.2 | 4.5 | 4.8 | 4.5 | 1.8 | 2.0 | 2.8 | | Personal care and effects | 3.9 | 7.7 | 8.6 | 9.0 | 9.0 | 8.8 | 8.6 | 8.7 | 8.2 | 8.1 | | Total (CMIE CPHS)5 | 100 | 100 | 100 | 100 | 100 | 100 | 100 | 100 | 100 | 100 | Note: The expenditure shares are worked out based on only the mapped items/sub-groups and not the total 153 expenditure categories covered in CMIE CPHS and therefore are not strictly comparable; they are presented for indicative purpose.
Source: NSO, GoI; CMIE CPHS; and authors’ estimates. | IV. Methodology The literature uses matching price and volume data for different components of PCE/CPI to distinguish between the roles of demand and supply shocks (Shapiro, 2022a; OECD, 2022). If unexpected change in prices and quantities in a month move in the same direction, this method classifies inflation in that month as demand driven - higher demand increases both prices and quantities (volumes) and; lower demand reduces both prices and quantities. It is classified as supply driven, on the other hand, if unexpected change in prices and quantities move in the opposite direction – lower supply means a decrease in volume with an increase in price and vice versa. Such a classification is done by running bi-variate vector auto regressive (VAR) model for prices and quantities for different components of CPI on a rolling window basis and analysing the one period ahead forecast residuals to determine the direction of price and volume shocks for different items. In the case of India, as noted earlier, the CMIE CPHS consumption expenditure data at the all-India level available for 153 items falling under different groups/sub-groups are mapped with the 23 CPI subgroup price indices6. To get a homogeneous base for both the series, they are rebased to January 2014=100 as CMIE data are available from January 2014 and then de-seasonalised. The mapped CMIE CPHS expenditure categories are then deflated by the corresponding CPI sub-groups to derive a proxy for volume. Using the CPI sub-group level price indices as a proxy for prices and deflated CMIE CPHS mapped expenditure categories as a proxy for volume (quantity) for the period January 2014 to May 2023 (as CMIE CPHS data are available from 2014), following OECD (2022), a two-equation VAR model for prices and quantities is run on a five-year rolling window basis as follows: 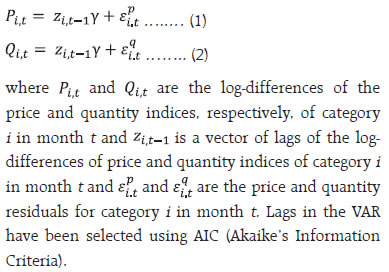 The one-period ahead forecasts of both price and quantity are produced for each of the 23-mapped categories and contrasted with their actual values and then are classified into demand, supply and ambiguous components every month during January 2019-May 20237. Same signs of the residuals for forecasted price and quantity are classified as demand driven price movement, while residuals of opposite signs are interpreted as indicative of supply driven. Furthermore, when either of the actual values is found to be close enough to its forecasted value8 (i.e., the residual is statistically indistinguishable from zero), the category is classified as ambiguous. After categorisation, the sub-group level CPI weights are used to combine the individual contributions to get an overall picture of demand driven and supply driven inflation in a month along with the contributions of ambiguous component to inflation. V. Results Based on the methodology described in the previous section, the estimates for the period January 2019-May 2023 indicate that sub-groups like vegetables, oils and fat, milk, egg, pulses and sugar witness recurrent supply-side pressures, while non-alcoholic beverages, personal care and effects, and health are mainly impacted by demand side factors (Chart 5). Apart from food, groups like fuel, and transport and communication (which contains transport fuels such as petrol and diesel) are also susceptible to supply shocks. The sub-group level demand and supply factors are combined using the CPI weights to provide a gauge on headline inflation. The results show that inflation was mostly supply driven during October 2019-January 2020 (on excess rain induced supply shocks) as well as during different waves of COVID-19 (on restrictions and supply chain disruptions) and at the start of the Russia-Ukraine conflict (on supply shortages and surges in global commodity prices). The supply side factors, on an average, contributed around 55 per cent to CPI headline inflation during the period January 2019-May 2023 (Chart 6). In contrast, the contribution of demand side factors to headline inflation fell during the COVID-19 shock to 27.1 per cent in 2020, from 41.5 per cent in 2019. Subsequently, however, the importance of demand-side factors in driving inflation increased intermittently with the easing of COVID time restrictions after the first and second waves, and post the Russia-Ukraine conflict, and its contributions dominated the headline inflation peak of April 2022. The overall contribution of demand drivers to inflation during the full sample period (January 2019 to May 2023) was 31 per cent. 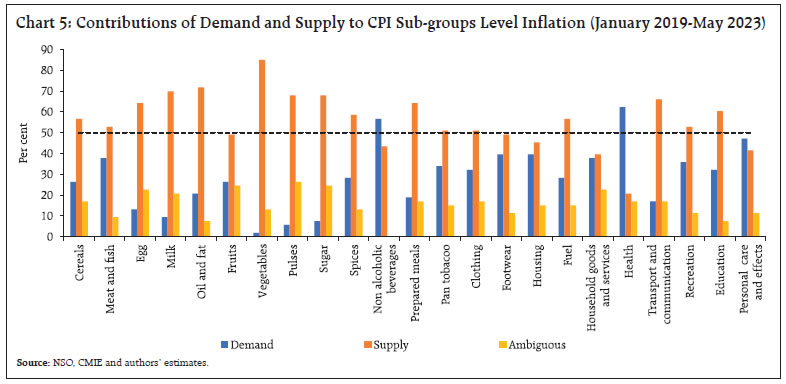 As housing component in the CMIE-CPHS basket does not appear to be properly mapped with the CPI, the above exercise is also carried out by excluding housing for robustness. The results confirm a similar behaviour of demand and supply drivers of inflation even after excluding housing (Chart 7).
In view of volatility in monthly CPI inflation, an analysis of the average contributions of demand and supply on a 9-month moving average basis shows that the contributions of demand increased since February 2022 and remained elevated during April-December 2022 in contrast with the post-first wave of COVID-19 when it gradually tapered off (Chart 8a). On the other hand, the share of supply driven inflation which rose sharply in the aftermath of first phase of COVID-19, tapered off significantly thereafter until the Russia-Ukraine conflict. While it increased post the conflict, it remained lower than the COVID time peak (Chart 8b). VI. Conclusion An evaluation of the relative importance of supply and demand factors driving inflation on a real time basis is a useful guide for the conduct of forward-looking monetary policy. However, it has become challenging in the presence of overlapping shocks since the pandemic and the pandemic-time fiscal and monetary policy stimulus. Nonetheless, a real time assessment of the relative importance of demand and supply is needed for timely policy actions to manage policy trade-offs between growth and inflation. Following the post-COVID literature, this study attempts to disentangle demand and supply drivers of inflation in India by running bi-variate VAR models on prices (proxied by 23-sub-groups of monthly CPI), and quantities (proxied by CMIE-CPHS consumption expenditure data deflated by mapped CPIs). The results indicate that, on an average, supply side factors are dominant in driving inflation in India, but demand factors also assume importance on occasions. Inflation was largely driven by supply shocks during both the COVID-19 waves. On the other hand, demand factors became the dominant drivers in the aftermath of the Russia-Ukraine conflict. These developments prompted a reversal in monetary policy stance in April 2022 to ‘withdrawal of accommodation’ and hike in the policy rate beginning May 2022 to control inflation. Monetary measures and targeted supply side interventions by the government helped to moderate headline inflation during 2023-24, barring the July-August 2023 spike driven by the vegetable price shock. References Anand, R., Kumar, N. and Tulin V. (2016). Understanding India’s Food Inflation: The Role of Demand and Supply Factors. IMF Working Paper No. 2016/002. Ball, L., Leigh, D., and Mishra, P. (2022). Understanding US Inflation During the COVID Era. NBER Working Paper 30613, October, DOI 10.3386/w30613. Barnichon, R., Oliveira, L. E., and Shapiro, A.H. (2021). Is the American Rescue Plan Taking Us Back to the ’60s? FRBSF Economic Letter, 2021-27, October. Barnichon, R. and Shapiro, A.H. (2022). What’s the Best Measure of Economic Slack? FRBSF Economic Letter, 2022-04, February. Budianto, F., Lombardo, G., Mojon, B. and Rees, D. (2021). Global Reflation? BIS Bulletin, No. 43. Cerrato, A. and Gitti, G. (2022). Inflation Since COVID: Demand or Supply. http://dx.doi.org/10.2139/ssrn.4193594 Chen, Y. and Tombe, T. (2023). The Rise (And Fall?) of Inflation in Canada: A Detailed Analysis of Its Post-Pandemic Experience. Canadian Public Policy, Forthcoming. Comin, D.A., Johnson, R.C. and Jones, C.J. (2023). Supply Chain Constraints and Inflation. NBER Working Paper 31179, April, DOI 10.3386/w31179 Di Giovanni, Julian (2022). How Much Did Supply Constraints Boost US Inflation? Federal Reserve Bank of New York Liberty Street Economics, August. Dreger, C. (2023). The Impact of Demand and Supply Shocks on Inflation: Evidence for the US and the Euro Area. MPRA Paper No. 116316, http://dx.doi.org/10.2139/ssrn.4356576. Dua, P. and Goel, D. (2021). Determinants of Inflation in India. The Journal of Developing Areas, Volume 55, No. 2, Spring. Eickmeier, S. and Hofmann, B. (2022). What Drives Inflation? Disentangling Demand and Supply Factors. BIS Working Papers No. 1047, November. Furman, J. (2022). America’s Wage-Price Persistence Must Be Stopped. Project Syndicate, August. Global Economic Outlook (2022). Global Economic Outlook, November 2022, Czech National Bank. Gokarn, S. (2011). The Price of Protein. Macroeconomics and Finance in Emerging Market Economies, 4(2), 327-335. Jorda, O., and Nechio, F. (2023). Inflation and Wage Growth since the Pandemic. European Economic Review, 156, 104474. IMF (2021). World Economic Outlook, October. Kronick, J. and Ambler, S. (2023). Slaying the Beast: The Bank of Canada’s Ongoing Battle with Inflation. C.D. Howe Institute e-Brief 340, April. Mohanty, D. and John, J. (2014). Determinants of Inflation in India. Journal of Asian Economics, 36 (2015) 86–96 OECD (2022). Supply-and Demand-driven Inflation in OECD Economies. Economic Outlook, Vol. 2022, Issue 2. Patra, M. D., Mohan, R., John, J. and Bhattacharya, I. (2023). Measuring Uncertainty: An Indian Perspective. RBI Bulletin, October. RBI (2023). Annual Report 2022-23. Shapiro, A. H. (2022a). A Simple Framework to Monitor Inflation. Federal Reserve Bank of San Francisco, June. Shapiro, A. H. (2022b). How Much do Supply and Demand Drive Inflation? FRBSF Economic Letter, 15. Srinivasan, N., Mahambare, V. and Ramachandran, M. (2006). Modelling Inflation in India: A Critique of the Structuralist Approach. Journal of Quantitative Economics No. 4, 45–58. https://doi.org/10.1007/BF03546447 Summers, L. H. (2021). Opinion: The Biden Stimulus is Admirably Ambitious. But it Brings Some Big Risks, Too. Washington Post, February. Walsh, C. E. (2022). Inflation Surges and Monetary Policy. Institute for Monetary and Economic Studies (No. 22-E-12), Bank of Japan.
Annex
|