The likelihood of the global economy exhibiting stronger than expected growth in 2024 has brightened in recent months, with risks broadly balanced. The Indian economy continues to sustain the momentum achieved in the first half of 2023-24, going by high frequency indicators. Ex-pectations of a fresh round of capex by the corporate sector is likely to fuel the next leg of growth. Consumer price inflation came off its November-December spikes in its January 2024 reading, while core inflation is at its lowest since October 2019. Introduction The jury is still out, but the global economy is staunchly weathering the aggressive restraint of monetary policy. As central banks guide inflation towards target touchdown, they are confronted with some factors that may render this prolonged: the dissipation of improvements in supply chains and falling commodity prices; extreme weather events, including the current el nino; and escalations of geopolitical hostilities. Hence, they are increasingly focusing on a goldilocks policy performance in 2024: not declaring premature victory and also not snuffing out the resilience of growth. Increasingly, the focus will turn to putting the fiscal house in order in the context of overburdened debt levels but here too, it may have to be consolidation with a human face, blended with support for new drivers of growth as borrowing costs ease and job creation brings with it some real wage gains. Unlocking productivity is the challenge that lies ahead; new technologies offer exciting possibilities. Another daunting challenge is managing climate change if future stress and misery has to be avoided. A third challenge is to reinvent globalisation from a labyrinth of fragmentation, reshoring and the weaponisation of trade and finance. If these challenges are successfully navigated, it may be possible to disprove the consensus of slow for longer projections that cast a shadow right up to 2025. These issues are discussed in greater detail in the following section. Macroeconomic outlooks in the emerging and developing world are diverging widely, ranging from implosive property sector contraction and deflation, to steady expansion on the back of investment thrusts. Barring idiosyncratic factors, the prospects for 2024 are supported by favourable financial conditions and external demand starting to look up. Among all the regions, it is the emerging and developing Asia ex China that appears to be on a rising growth profile. Financial markets remain heady with expectations that monetary policy easing is round the corner; but the gap between central banks and investors persists. Swap markets are leading this optimism. Global financial conditions are becoming easier, mainly driven by equity market exuberance that is stretching valuations and compression in corporate bond spreads. In fact, corporate bond investors are snapping up new issues worldwide, locking in elevated yields ahead of what they believe as imminent interest rate cuts. Investor preference is tilted in favour of investment-grade issuances, with a predominant portion picked up by banks and financial companies. Sovereign bond yields are falling, especially at longer maturities, although more recently, investors are paring back expectations of monetary policy easing and this is also reflected in liquidity shortages as central bank balance sheet reduction progresses. Emerging market assets are beginning to see reversals of past outflows and the correlations with developed market yields are firming up. In currency markets, the unexpected resilience of the US economy has sparked a rebound of the US dollar. In response, hedge funds positioned for a depreciation are rushing to close out short positions, with reports that these positions have been completely neutralised. Analysts believe, however, that the fall in the US dollar has merely been delayed to later in the year. It is the time of the year when The Economist updates its Big Mac index. Started in 1986 as a light-hearted guide to the fair value of currencies, it provides an informal measure of purchasing power parity (PPP) between two currencies by comparing the relative price worldwide of a Big Mac hamburger sold at McDonald’s restaurants. As The Economist points out, “it seeks to make exchange-rate theory a bit more digestible." Now globally recognised and even featuring in academic textbooks and reports, it gave rise to the word burgernomics. In order to calculate the Big Mac index, the price of a Big Mac in a country denominated in local currency is divided by the price of Big Mac in the US on the notion that in the long run, exchange rates should move towards the rate that would equalise the prices of an identical basket of goods and services (in this case, a burger) in any two countries. The January 2024 Big Mac update shows that although the US dollar has weakened against the pound sterling and the Canadian dollar, it has strengthened against almost all others. The Japanese yen is undervalued by 43 per cent, the Indonesian rupiah by 47 per cent, the Hong Kong dollar by 51 per cent and the Taiwanese dollar by 58 per cent. Looking at affordability or how many burgers can a currency buy relative to the US dollar, a country’s GDP is valued in purchasing power or Big Mac terms. This shows that although India is positioned as the fifth largest economy in terms of market exchange rates, it is the third largest in the world in purchasing power terms, after China and the US. This broadly conforms to the latest update of the IMF as of October 2023. The Indian rupee is undervalued by 42 per cent in Big Mac terms, but this has to be taken with more than a pinch of salt – in India, beef burgers are not available at any McDonald’s outlets and the chicken Maharaja Mac serves as a substitute. In terms of iPad minis1 which is a more standardised product, the INR is estimated to be overvalued by 2.1 per cent, according to the Council of Foreign Relations’ (CFR)2 Mini Mac index3 (It is unambiguously stated that these exchange rate details of the INR do not reflect the view of the Reserve Bank. The exchange rate of the INR is market determined). The average global temperature has for the first time breached the benchmark of 1.5 degrees Celsius above pre-industrial levels over February 2023-January 2024, resulting in the hottest January on record. The average surface air temperature was 13.14 degrees Celsius, 0.12 degrees above the temperature of the previous warmest January in 2020. The global sea surface temperature also reached a record of 20.97 degrees, the second hottest for any month ever barring August 2023. There is a rising apprehension that the Paris agreement limit may be breached sooner than expected, which can jeopardise the goals set. Cities across the world – where over 80 per cent of world GDP is created and where the majority of the planet’s population live – are under significant threat. Major ports may become swamped in coming years – Indonesia plans to move away from its capital Jakarta, 40 per cent of which now lies below sea level, for a new capital city over 1000 kilometres away. Many riverside cities may be at risk of flooding. The number of cities exposed to extreme heat in the hinterland is also expected to triple by 2030. The human and economic costs could be enormous. Amidst a flurry of upgrades for 2023-24 and 2024-25 by multilateral agencies, the Indian economy continues to sustain the momentum achieved in the first half of the year, going by high frequency indicators presented in section 3. By the end of February 2024, the National Statistical Office will provide its second advance estimates of national income for 2023-24 and for the third quarter for the first time. Our nowcast presented in last month’s edition had placed real GDP growth at 7 per cent for the third quarter. Implicitly, real GDP would have to expand by 7 per cent in the fourth quarter for the annual estimate of 7.3 per cent to be realised. While agriculture may see some moderation if the rabi output does not offset the kharif shortfall, value added in manufacturing is holding up well. As section 3 points out, the results for listed non-financial companies show sustained profitability in the third quarter in line with the higher growth in value of production while revenue growth remains modest. The contribution to overall profit growth was led by oil and gas sector companies, which were supported by an increase in their marketing margins. Foreign portfolio investors have begun 2024 with big buys in oil and gas stocks, followed by financial services and power. Auto sector companies registered an uptick in volume during the quarter, with passenger vehicle and three-wheeler segments posting their highest third quarter sales ever and two-wheelers also registering strong volume growth during the quarter. Fast moving consumer goods (FMCG) companies reported moderate sales growth during the quarter, with deflation in prices causing value growth to be lower than volume growth. The gap between rural and urban volume narrowed for the first time in four quarters. Construction, real estate and allied sectors such as cement continued to post upbeat results as reflected in a surge in profitability on the back of residential housing demand and the government’s thrust on infrastructure development. Pharmaceutical sector companies reported a sharp turnaround in profitability on favourable demand. Chemical companies, however, faced headwinds amidst sluggish demand conditions and price declines in some cases. Management commentaries by various companies acknowledged the increase in delivery schedules and rates due to disruptions in the Red Sea. In the services sector, fortunes were mixed. The performance of the information technology (IT) sector companies was subdued; several leading companies recorded a reduction in employee headcount, resulting in a slowing growth in salary expenses for the sector. Nonetheless, optimistic commentary about demand conditions led to general improvement in market sentiment for IT companies, which was also reflected in their stock prices. In the non-IT sector, profitability improved for hotels and tourism industries. Banking and financial sector companies maintained strong growth in profitability on the back of the still burgeoning credit demand in the economy and lower provisioning costs. In fact, banks’ unsecured loans grew in spite of the hit on capital due to increase in risk weights. The lagged effect of pass through of policy rate increases into deposit and certificates of deposit rates exerted pressure on net interest margins. Expectations for a fresh round of capex by the corporate sector to take the baton from the government and fuel the next leg of growth are mounting. Balance sheets are healthy on the back of high profits, with leverage remaining constant or improving and the return ratio at a multi-year high. Fixed asset growth is already evident in the oil and gas sector and in chemicals. In sectors such as steel and automobiles for which stock returns have exceeded index returns, fixed asset additions have, however, been underwhelming. Capex plans of the power sector are the most ambitious, but leverage is high among distribution companies. Even so, India has made big strides in the green energy sector over the last decade, with renewable power constituting 43 per cent of the total installed power capacity. The corporate must seize this lever to expand capex, especially with the target of tripling renewable energy capacity to 500 gigawatts by 2030. Overall, the corporate sector must get its act together ready to relieve the government of capex heavy lifting and take advantage of the space ceded in financial markets by a lower budgeted borrowing programme and the easing of borrowing costs that has already begun in response to the Interim Budget for 2024-25, driven as it is by capex and consolidation. Overall inflation developments are also turning favourable, providing a stable environment for corporates to plan expansion strategies in anticipation of a pick-up in demand. With consumer price inflation coming off its November-December spikes in its January 2024 reading, inflation expectations may stabilise and edge down, although renewed pressures from cereals and proteins cannot be ruled out. Core inflation is at its lowest since October 2019 and non-food wholesale price inflation remains in deflation. This should augur well for the input cost outlook and selling prices of manufacturing firms. Circling back to agriculture, evolving conditions for 2024-25 are turning favourable. Although the positive Indian ocean dipole event is weakening steadily, the India Meteorological Department (IMD) expects El Niña to turn neutral prior to the start of the monsoon season in June, and favourable La Niña may set in by August. In its preliminary monsoon forecast guidance for 2024, the private weather forecaster Skymet has predicted a normal south west monsoon. Set against this backdrop, the remainder of the article is structured into four sections. Section II covers the rapidly evolving developments in the global economy. An assessment of domestic macroeconomic conditions is set out in Section III. Section IV encapsulates financial conditions in India, while the last Section sets out concluding remarks. II. Global Setting The likelihood of the global economy exhibiting stronger than expected growth in 2024 has brightened in recent months, with risks broadly balanced. Faster disinflation, continued fiscal support and improvements in productivity are expected to buffer against geopolitical tensions and supply disruptions. Accordingly, the International Monetary Fund (IMF) upgraded its global growth forecast to 3.1 per cent in 2024 (up by 0.2 percentage point from October 2023) and 3.2 per cent in 2025 in its January 2024 World Economic Outlook (WEO) [Table II.1]. In its Interim Economic Outlook of February 2024, the Organization for Economic Cooperation and Development (OECD), projected the global economy to grow by 2.9 per cent in 2024, higher by 0.2 percentage points from the November 2023 forecast, before recovering to 3.0 per cent in 2025. The OECD expects growth trajectories to continue to diverge across member countries. 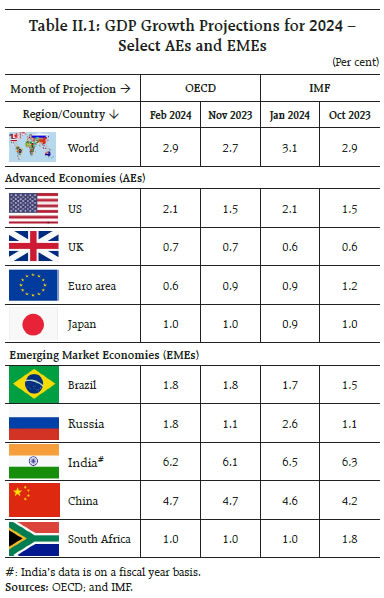
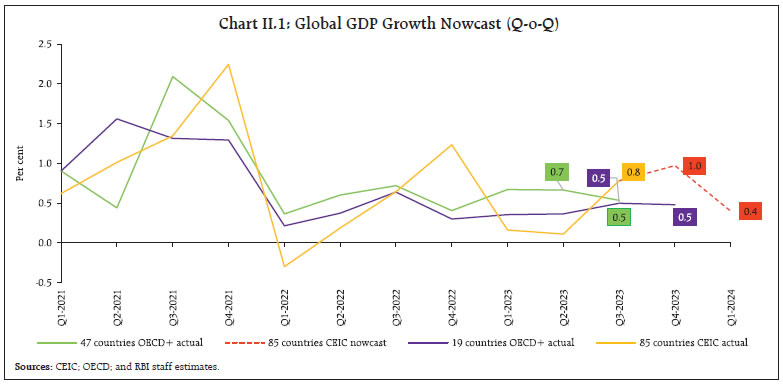 Validating these developments, our nowcast points towards global growth momentum being maintained during Q1:2024 (Chart II.1). The global supply chain pressures index (GSCPI) increased in January 2024 from its December 2023 level, though it remained lower than its historical average (Chart II.2a). Geopolitical risks remain high and container shipping costs soared due to the ongoing hostilities in the Red Sea and disruptions in other key global trade routes (Chart II.2b and II.2c).
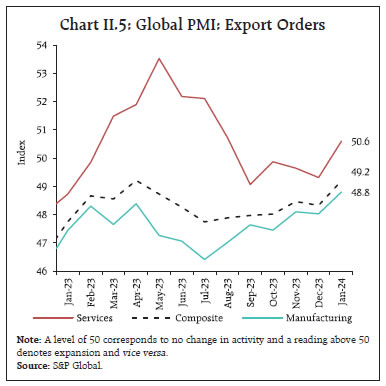
An optimistic outlook for inflation and household incomes brightened consumer sentiments in most economies in January 2024 (Chart II.3a). Financial conditions eased in the US, driven by ebullient equity markets notwithstanding a pushback of expectations for rate cuts, while conditions tightened in China (Chart II.3b). The global composite purchasing managers index (PMI) increased to 51.8 in January 2024 - its highest reading since June 2023 - from 51.0 in December, supported by increases in both services business activity and manufacturing output. Global manufacturing rose to the neutral mark of 50.0 in January 2024, halting 16 consecutive months of contraction as production volumes edged higher - especially in the consumer goods category (Chart II.4). The services PMI expanded at its quickest pace since July 2023. The PMI for export orders increased sequentially in January 2024 for both manufacturing and services. For manufacturing, it recorded a 17-month high, while the services export orders index transitioned into expansion territory after four months of contraction (Chart II.5). In January, global commodity prices witnessed diverging movements. The Bloomberg Commodity Price Index recorded a marginal decline of 0.1 per cent (m-o-m) as rising oil prices were more than offset by a fall in metal and grain prices (Chart II.6a). The downward trend in non-oil commodity prices has persisted in February so far. Crude oil prices firmed up throughout January and mid February 2024, ending January at 5.9 per cent higher over their December 2023 level, as tensions in the Middle East caused disruptions in the Red Sea vessel traffic (Chart II.6b). In its short-term energy outlook for February 2024, the US Energy Information Administration, indicated that ongoing risks of supply disruptions in the Middle East create the potential for crude oil prices to rise even higher, although a potential increase in oil inventories may tamper down prices beginning Q2:2024. 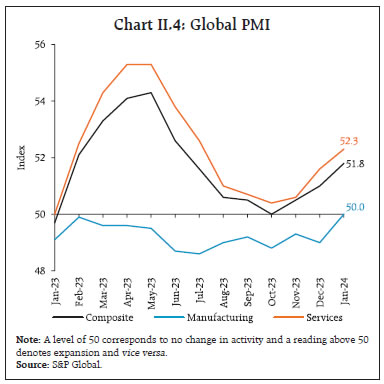
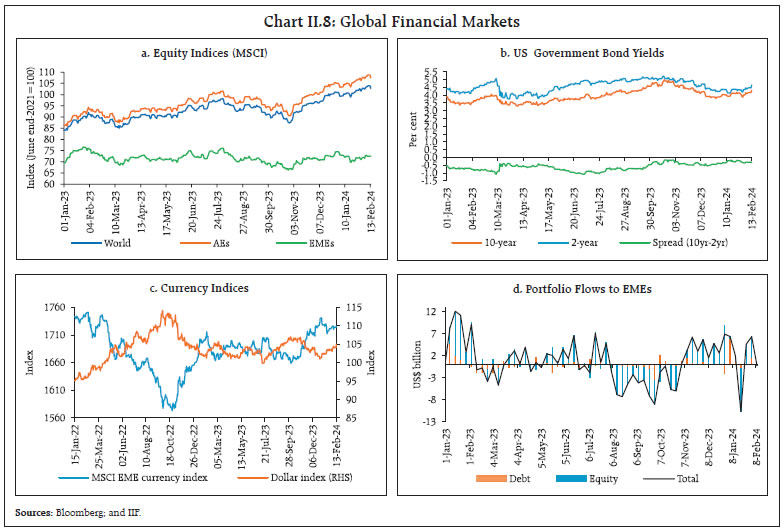
 The Food and Agriculture Organization’s (FAO’s) food price index declined by 1.0 per cent (m-o-m) in January 2024, primarily driven by a reduction in the prices of cereals (-2.2 per cent) and meat (-1.4 per cent) [Chart II.6c]. Gold prices declined unevenly in January and in the first half of February, with intermittent spurts (Chart II.6d). Headline inflation remained above the target in major economies, despite moderation during the course of 2023. In the US, CPI inflation moderated to 3.1 per cent in January 2024 from 3.4 per cent in December 2023, while the headline personal consumption expenditure (PCE) index inflation remained steady at 2.6 per cent (y-o-y) in December 2023. As per flash estimates, Euro area inflation moderated to 2.8 per cent in January 2024 from 2.9 per cent in December 2023 (Chart II.7a). In the UK, CPI inflation remained steady at 4.0 per cent in January, while Japan’s inflation (CPI excluding fresh food) moderated to 2.3 per cent in December – its lowest reading since June 2022. Among EMEs, inflation moderated in South Africa in December 2023 and Brazil in January 2024. Inflation in Russia remained steady at 7.4 per cent in January 2024. China recorded deflation of 0.8 per cent in January (Chart II.7b). Core and services inflation fell across major AEs but remained higher than headline inflation. (Chart II.7c and II.7d). 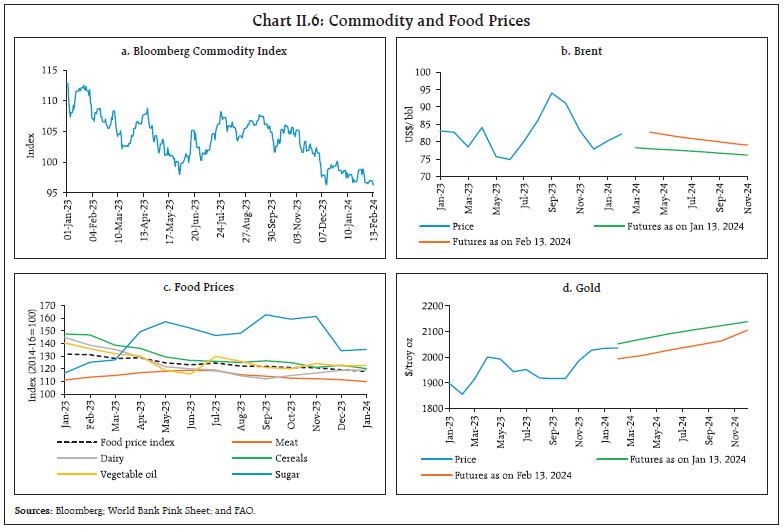 Global equity markets registered gains in January and mid February, barring a few episodes of sentiment ebbs as the market priced in tapering expectations of a rate cut by the Fed. The Morgan Stanley Capital International (MSCI) world index rose 0.5 per cent in January, reflecting gains in AEs (by 1.1 per cent) while EMEs recorded losses (-4.7 per cent m-o-m) [Chart II.8a]. The US 10-year G-sec yield rose marginally by 3 basis points (bps) while the 2-year G-sec yield fell by 4 bps in January, thus widening the spread by 8 bps (Chart II.8b). In the currency markets, the US dollar strengthened by 1.9 per cent (m-o-m) in January as the reduced probability of rate cuts shored up demand. The US dollar continued to gain strength mid February. On the flip side, the MSCI currency index for EMEs declined by 0.9 per cent in January, exacerbated by capital outflows, mainly in the equity segment (Chart II.8c and II.8d). 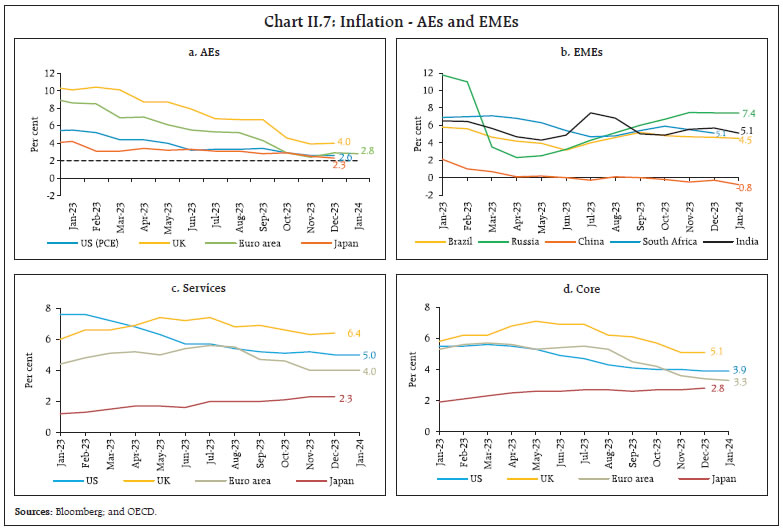
 As inflationary pressures waned, most central banks halted policy rate increases while a few moved ahead with rate cuts. In February 2024, most AE central banks kept their policy rates on hold, while the Czech Republic cut its benchmark rates by 50 bps (Chart II.9a). Among EMEs, Peru continued to reduce its policy rate by 25 bps in February while Turkey bucked the trend with a 250 bps hike in January (Chart II.9b). III. Domestic Developments Consumer confidence strengthened further in January 2024, driven especially by optimism about the general economic situation and employment conditions, as per the RBI’s latest survey of households (Chart III.1a). Various enterprise surveys also point towards strong business optimism (Annex I). The disruption in global trade flows and higher transportation costs due to the ongoing Red Sea conflict has led to the build-up of supply chain pressures in recent months (Chart III.1b). Our economic activity index (EAI) nowcasts GDP growth for Q4:202324 at 7 per cent (Chart III.1c and III.1d). Aggregate Demand High frequency indicators point towards sustained strength in demand conditions in January 2024. E-way bills grew by 13.2 per cent in December 2023 (Chart III.2a). Toll collections expanded by 15.5 per cent y-o-y in January 2024, although they sequentially moderated from a record in the previous month (Chart III.2b). Automobile sales had registered an expansion of 23.3 per cent (y-o-y) in January with two wheeler sales recording double digit growth (Chart III.3a and III.3b). Retail tractor sales recorded a seven-month high growth at 21.2 per cent (y-o-y) in January 2024. Vehicle registrations recorded strong y-o-y growth in January 2024 (Chart III.3c). The consumption of petroleum products also rebounded, growing at 8.3 per cent y-o-y, driven by strong industrial activity4 (Chart III.3d).
According to NielsenIQ, during Q3:2023:24, the FMCG industry recorded 6.4 per cent volume growth and 6.1 per cent value growth y-o-y.5 Rural demand growth (in volume terms) picked up steadily to 5.8 per cent, while urban markets experienced a higher growth of 6.8 per cent (y-o-y). As per the latest Periodic Labour Force Survey (PLFS), labour market conditions continued to improve during October-December 2023. The labour force participation rate (LFPR) in urban areas for persons aged 15 years and above increased to 49.9 per cent in October-December 2023 from 49.3 per cent in July-September 2023, the highest since the survey’s inception, largely driven by female LFPR [Chart III.4a]. The worker population ratio (WPR) also increased for both males and females. Consequently, the unemployment rate (UR) fell to its lowest in the PLFS series to 6.5 per cent from 6.6 per cent in the last quarter. The rise in employment was driven by regular salaried and self-employed categories, as the share of casual labour decreased sequentially and in relation to the same quarter last year (Chart III.4b). Employment in the services sector, which contributed to 62 per cent of the total employment, continued to increase during Q3:2023-24, while in the secondary sector and in agriculture it recorded a decline. As per the data available from the Centre for Monitoring of Indian Economy (CMIE), the all-India UR fell to a 16-month low of 6.8 per cent in January (Chart III.5a). The LFPR and employment rate (ER) decreased marginally in the same month (Chart III.5b). The employment outlook in the organised sector, as polled by the PMIs for manufacturing and services, showed a mixed picture. While manufacturing employment recorded a marginal contraction, services recorded a sequential pick-up in January (Chart III.6). Households’ demand for work under the Mahatma Gandhi National Rural Employment Guarantee Act (MGNREGA) fell by 1.7 per cent (m-o-m) in January, leading to a decline of 5.3 per cent on a y-o-y basis, reflecting farm labour demand during the rabi season and improved prospects of employment in the rural sector as a whole (Chart III.7).
India’s merchandise exports at US$ 36.9 billion registered a growth of 3.1 per cent (y-o-y) for the second consecutive month in January 2024, as a favourable base effect more than offset negative momentum (Chart III.8). Out of 30 major commodities, 18 commodities accounting for 72.3 per cent of the export basket registered expansion on a y-o-y basis. Petroleum products, engineering goods, iron ore, electronic goods, drugs and pharmaceuticals supported export growth whereas other cereals, marine products, readymade garments of all textiles, gems and jewellery and rice dragged down growth in January (Chart III.9).
Merchandise imports at US$ 54.4 billion in January 2024 registered expansion after contracting for two consecutive months. A favourable base effect offset the negative momentum as in the case of exports, leading to y-o-y growth of 3.1 per cent (Chart III.10). Among the 30 major commodities, 13 commodities accounting for 58.2 per cent of the import basket registered growth. Electronic goods, gold, petroleum, oil and lubricants (POL), coal and silver supported import growth whereas fertilisers, vegetable oil, transport equipment, chemicals and machinery were offsetting components (Chart III.11).
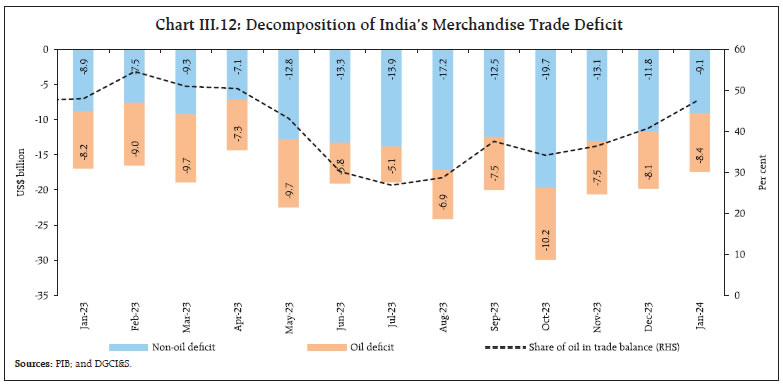
The merchandise trade deficit narrowed to a 9-month low of US$ 17.5 billion in January 2024 as imports declined faster than exports sequentially. The share of POL in the total merchandise trade balance increased to 47.8 per cent in January 2024 from 40.7 per cent in December 2023 reflecting the sequential increase in value of POL imports exceeding that of petroleum exports (Chart III.12). During April-January, 2023-24, India’s merchandise exports at US$ 353.9 billion contracted by 4.9 per cent (y-o-y). Merchandise imports at US$ 561.1 billion declined by 6.7 per cent (y-o-y). Consequently, the merchandise trade deficit narrowed to US$ 207.2 billion during this period from US$ 229.4 billion during the corresponding period a year ago. Petroleum products were the largest source of the deficit, followed by electronic goods (Chart III.13). 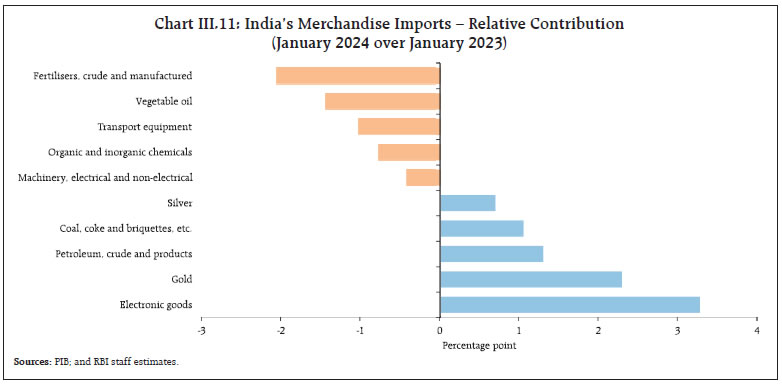
 The disruptions in trade transiting though the Red Sea have necessitated re-routing of seaborne merchandise trade between Asia and Europe/north Africa via the Cape of Good Hope. The volume of goods passing through the Bab el-Mandeb Strait and the Suez Canal in January 2024 was less than half the average (Chart III.14). The increased transit time is pushing up shipping costs, while insurance premiums are also rising. About 48.7 per cent of India’s merchandise exports and 30.4 per cent of imports are estimated to be exposed to this sea route6.
In December 2023, services exports rose by 1.3 per cent (y-o-y) to US$ 31.6 billion, driven by robust software, business, and travel services exports. Services imports declined by 1.2 per cent (y-o-y) to US$ 15.6 billion, mainly due to a decrease in transportation services (Chart III.15). As a result, net services exports earnings expanded by 3.9 per cent (y-o-y) to a record high of US$ 16.0 billion in December 2023. The Interim Union Budget for 2024-25 adopted a balanced approach towards ensuring inclusive growth and sustainable development through fiscal consolidation as well as continued thrust on capital expenditure. During 2023-24 revised estimates (RE), capital expenditure of the Union government recorded an increase of 28.4 per cent (y-o-y) while revenue expenditure growth remained contained at 2.5 per cent (y-o-y) [Chart III.16a]. Capital outlay (i.e., capital expenditure excluding loans and advances) recorded an increase of 29.2 per cent, resulting in a marked improvement in the quality of spending of the Union government (Chart III.16b). On the receipts side, direct tax collections grew by 17.2 per cent while indirect taxes increased by 7.0 per cent (y-o-y) in 2023-24(RE) [Chart III.16c]. Non-tax revenue recorded an increase of 31.7 per cent (y-o-y) on back of higher than budgeted surplus transfer by the Reserve Bank and public sector enterprises (Chart III.16d). During 2023-24, the government continued with its fiscal consolidation efforts, with the GFD to GDP ratio placed at 5.8 per cent (RE), marginally below the budgeted 5.9 per cent, despite lower-than-expected nominal GDP growth. This is attributable to higher-than-expected non-tax revenue and lower capital expenditure in 2023-24. Revenue expenditure surpassed budget estimates (BE) by ₹38,103 crore while capital expenditure fell short by ₹50,715 crore7, resulting in a reduction in total expenditure by ₹12,611 crore. On the receipts side, non-tax revenue exceeded the BE by ₹74,145 crore while non-debt capital receipts witnessed a shortfall of ₹28,000 crore in 2023-24 (RE). Further, while gross tax revenue exceeded BE, net tax revenue fell short by ₹6,713 crore due to higher than budgeted devolution to States. 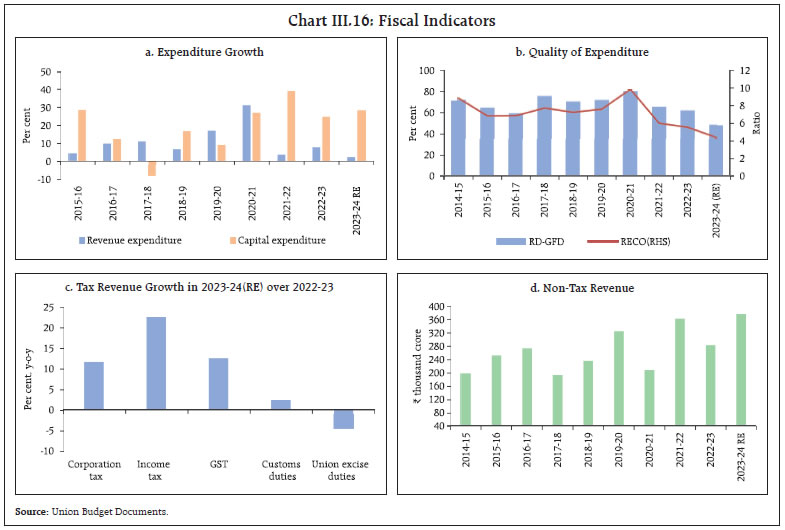 For 2024-25, the Union Budget has aimed for a sizeable consolidation with GFD/GDP pegged at 5.1 per cent8, 71 bps less than 2023-24 (RE). This reduction is sought to be achieved through containment of revenue expenditure to 11.2 per cent of GDP even as capital expenditure is budgeted to rise to 3.4 per cent of GDP (Table III.1). Further, in the Union Budget, the government has reiterated its commitment to attain the medium-term GFD target of 4.5 per cent of GDP by 2025-26. | Table III.1: Key Fiscal Indicators (as per cent of GDP) | | Item | 2022-23 | 2023-24 | 2024-25 | | Actuals | BE | RE | BE | | 1 | 2 | 3 | 4 | 5 | | 1. Fiscal Deficit | 6.4 | 5.9 | 5.8 | 5.1 | | 2. Primary Deficit | 3.0 | 2.3 | 2.3 | 1.5 | | 3. Revenue Deficit | 3.9 | 2.9 | 2.8 | 2.0 | | 4. Effective Revenue Deficit | 2.8 | 1.7 | 1.8 | 0.8 | | 5. Gross Tax Revenue | 11.2 | 11.1 | 11.6 | 11.7 | | 6. Non-Tax Revenue | 1.0 | 1.0 | 1.3 | 1.2 | | 7. Revenue Expenditure | 12.7 | 11.6 | 11.9 | 11.2 | | 8. Capital Expenditure | 2.7 | 3.3 | 3.2 | 3.4 | | (i) Capital Outlay | 2.3 | 2.8 | 2.7 | 2.9 | | Source: Union Budget Documents. | The pronouncements in the Interim Union Budget 2024-25 are in line with the vision of ‘Viksit Bharat’ i.e., ‘Prosperous Bharat in harmony with nature, with modern infrastructure, and provision of opportunities for all citizens and all regions to reach their potential’. To sustain the momentum of economic growth, the capex thrust especially on roads and railways has been continued. This would improve the quality of infrastructure in the country, enhance productivity and competitiveness of the Indian economy, and catalyze private investment and job creation. As of Q3:2023-24, states’ GFD reached 57.3 per cent of their BEs (Chart III.17a).9 States’ tax and non-tax revenues recorded growth of 14.6 per cent and 19.5 per cent, respectively. Grants from the Union government, however, contracted following the cessation of GST compensation to states and the tapering of finance commission grants. States’ total revenue receipts witnessed a y-o-y growth of 8.2 per cent (Chart III.17b and Chart III.18a). On the expenditure front, capital spending of states grew by 35.8 per cent (y-o-y), reflecting the continued thrust by the Union government. This was aided by the Scheme for Special Assistance to States for Capital Investment. By December 2023, the Union government had sanctioned ₹1.01 lakh crore (of the ₹1.3 lakh crore allocated for 2023-24), of which ₹61,499 crore has already been disbursed to the states. The scheme, introduced initially in 2021-22, has been extended till 2024-25 by the Interim Union Budget, with a budgeted growth of 23.2 per cent over 2023-24 (RE). The sustained capex push has improved the quality of expenditure of the states (Chart III.18b). The Interim Union Budget has estimated an increase of 8.4 per cent for gross transfers to the states during 2024-25 (BE), largely due to enhanced tax devolution and an increase in allocation for special assistance (as loans) to the states.
Aggregate Supply The Interim Budget for 2024-25 has focused on improving the productivity of agriculture and encouraging exports of allied activities, viz., dairy sector, marine products, promoting the use of nano fertilizers and bio-agri-inputs while reducing import dependency in oilseeds and arresting the post-harvest losses. On the food security front, rice procurement by the central agencies progressed steadily. The Union government has also announced a host of measures to address high food inflation.10 The buffer stock, as on February 01, 2024, stood at 7.6 times and 1.0 time of rice and wheat buffer norm, respectively.11 Rabi crop acreage during 2023-24 stood at 709.3 lakh hectares12, a tad higher than the sown area last year and 5.2 per cent higher than the normal acreage. Area under all major crops, except rice and pulses, remained higher on a y-o-y basis (Chart III.19). Area sown under wheat, which accounted for 47 per cent of rabi full season normal area, increased by 0.7 per cent y-o-y. For February 2024, the IMD’s prediction of above normal rainfall bodes well for the standing rabi wheat crop. However, the forecast for above normal maximum temperatures over many parts of the northwest and west central India poses a concern for wheat crops in these regions. Strong El Nino conditions over the Equatorial Pacific are likely to weaken steadily and turn to El Nino Southern Oscillation (ENSO) neutral conditions by the end of the spring season of 2024 which is a positive sign for upcoming monsoon season in 2024. The water reservoir position at all India level (as of February 08, 2024) at 49 per cent of total reservoir capacity was lower than last year and the decadal average by 18.8 per cent and 5.8 per cent, respectively. All regions, except the eastern region, recorded lower storage levels than last year. Water storage was lower than the decadal average in the northern, eastern and southern regions (Chart III.20). The headline PMI for the manufacturing sector expanded to a four-month high of 56.5 in January 2024, supported by new orders and output (Chart III.21a). The PMI for services expanded to a six-month high of 61.8 in January, led by expansion of new business (Chart III.21b). Sales of listed private manufacturing companies recorded 3.8 per cent growth (y-o-y) during Q3:2023-2413. Real sales growth (a proxy for volume growth), outpaced nominal sales growth for the third successive quarter (Chart III.22a). Higher income supported improvement in operating profits on both sequential and annual basis. While revenue growth of information technology (IT) firms decelerated further, that of non-IT services sector remained in double digits (Chart III.22b and III.22c).
Major ports experienced an increase of 3.2 per cent in cargo traffic, marked by a rise in carriage of petroleum, oil and lubricants (POL), iron ore and coal (Chart III.23a). A pick-up in freight movement of iron ore and coal also resulted in higher railway freight revenues (Chart III.23b). Construction sector indicators give a mixed picture, with steel consumption growing at a healthy rate of 7.8 per cent in January, while cement production recorded a much lower growth of 1.3 per cent in December 2023 (Chart III.24).
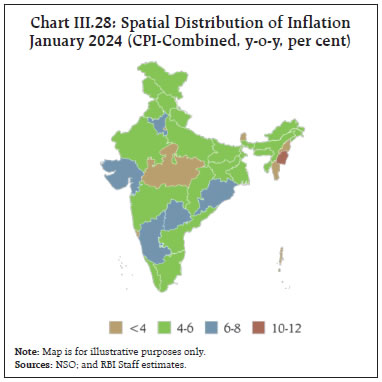
Various high frequency indicators for the services sector remained robust in January 2024 (Table III.2). Inflation Headline inflation, as measured by y-o-y changes in the all-India consumer price index (CPI)14, moderated to 5.1 per cent in January 2024 from 5.7 per cent in December 2023 (Chart III.25). The 60 bps softening in inflation came from a negative momentum of around 10 bps further supported by a favourable base effect of around 50 bps. The negative momentum in overall CPI was on account of a m-o-m decline in food prices by around 60 bps, while fuel and core group (i.e., excluding food and fuel) witnessed a positive momentum of around 40 bps and 30 bps, respectively. Food inflation (y-o-y) fell to 7.6 per cent in January 2024 from 8.7 per cent in December 2023. In terms of sub-groups, the correction occurred in cereals, milk, fruits, vegetables, pulses, spices and prepared meals. Prices of eggs, meat, fish and sugar registered an increase in inflation. Edible oils remained in deflation, and inflation in non-alcoholic beverages prices remained steady (Chart III.26). The fuel and light group continued to record deflation at (-) 0.6 per cent in January 2024, as against (-) 1.0 per cent in December 2023 mainly on account of a slowdown in the rate of deflation of kerosene prices. Inflation (y-o-y) in electricity, LPG, firewood and chips prices remained broadly steady. Core inflation eased to 3.5 per cent in January from 3.8 per cent in December. The moderation was mostly broad-based and across various sub-groups such as pan, tobacco and intoxicants, clothing and footwear, housing, household goods and services, health, recreation and amusement and personal care and effects. While inflation remained steady in transport and communications, it edged up marginally in education (Chart III.27). In terms of regional distribution, inflation softened across both rural and urban areas in January 2024, with rural inflation at 5.3 per cent and urban inflation at 4.9 per cent. Majority of the states recorded inflation less than 6 per cent (Chart III.28) with 23 out of 37 states/UTs facing inflation lower than the all-India figure of 5.1 per cent.
High frequency food price data for February so far (up to 12th) show that while cereal prices rose further, pulses prices declined. Edible oil prices also remained in a broad-based decline (Chart III.29). Amongst key vegetables, tomato prices registered a sequential uptick in February so far, but onion and potato prices corrected further. 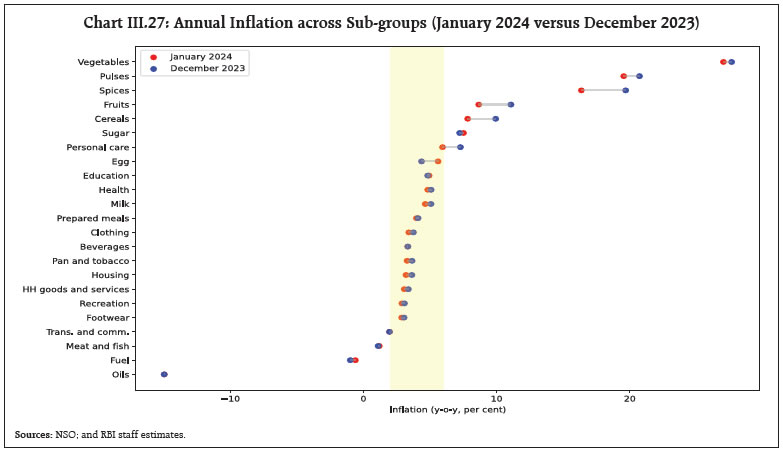
| Table III.3: Petroleum Products Prices | | Item | Unit | Domestic Prices | Month-over-month (per cent) | | Feb-23 | Jan-24 | Feb-24^ | Jan-24 | Feb-24^ | | Petrol | ₹/litre | 102.92 | 102.92 | 102.92 | 0.0 | 0.0 | | Diesel | ₹/litre | 92.72 | 92.72 | 92.72 | 0.0 | 0.0 | | Kerosene (subsidised) | ₹/litre | 55.79 | 50.50 | 50.50 | -3.1 | 0.0 | | LPG (non-subsidised) | ₹/cylinder | 1063.25 | 913.25 | 913.25 | 0.0 | 0.0 | ^: For the period February 1-12, 2024.
Note: Other than kerosene, prices represent the average Indian Oil Corporation Limited (IOCL) prices in four major metros (Delhi, Kolkata, Mumbai and Chennai). For kerosene, prices denote the average of the subsidised prices in Kolkata, Mumbai and Chennai.
Sources: IOCL; Petroleum Planning and Analysis Cell (PPAC); and RBI staff estimates. | Retail selling prices of petrol and diesel in the four major metros remained steady in February so far (up to 12th). Kerosene and LPG prices were also kept unchanged in February so far (Table III.3).
The PMIs for January 2024 indicated an uptick in input costs across manufacturing and service sectors. Selling prices, on the other hand, increased in the manufacturing sector while they moderated for the services sector (Chart III.30). In the January 2024 round of the RBI’s inflation expectations survey of households, their current perception as well as one year ahead expectations of inflation moderated by 10 bps each (Chart III.31). Inflation expectation for three months ahead period was, however, a shade higher in the latest survey round as respondents expected some rise in food inflation in the short-term. IV. Financial Conditions During the second half of January 2024 and early February, liquidity conditions largely mirrored movements in government cash balance, i.e., a frictional driver. While liquidity conditions tightened in the second half of January 2024 following the build-up of government cash balance, they eased for a brief period in the beginning of February with increase in government spending (Chart IV.1a). Liquidity conditions eased significantly after the announcement of the Interim Budget 2024-25 with the market realising the potential for higher government spending implicit in the revised estimates of government cash balances projected for 2023-24. As a result, banks drew down their excess reserves significantly which alleviated the liquidity stress in the banking system and eased the pressure on short-term rates in the first week of February. With short term rates plummeting close to the SDF rate after February 1, the Reserve Bank conducted six fine tuning variable rate reverse repo (VRRR) operations with varying maturity (1-4 days) withdrawing cumulatively ₹1.54 lakh crore from the banking system. The fine-tuning VRRR auctions progressively elicited better response as banks became confident of government spending (Chart IV.1b). Liquidity conditions tightened again in line with build-up of government cash balance in the second week of February. Going ahead, rising government expenditure is expected to ease liquidity conditions. During this period, the Reserve Bank conducted two main variable rate repo (VRR) operations and eight fine-tuning VRR auctions (up to February 15) to alleviate pressure on liquidity conditions. The demand for funds is reflected in high bid-cover ratio for fine-tuning VRR auctions conducted on February 12 and February 14. Banks also took recourse to the marginal standing facility (MSF) and borrowed, on an average, nearly ₹0.31 lakh crore (up to February 15, 2024).15 The placement of funds under the standing deposit facility (SDF) averaged ₹0.61 lakh crore. Reflecting shifting liquidity dynamics, the weighted average call rate (WACR) – the operating target of monetary policy – came down below the policy repo rate from February 5, before firming up again from February 8. The spread of the WACR over the policy repo rate averaged 20 bps during January 15 – February 15, 2024 (Chart IV.2a). Rates in the collateralised segment – the triparty and market repo rates – also moved in tandem with WACR (Chart IV.2b). In the term money segment, however, the yield on 3-month commercial paper (CP) for non-banking financial companies (NBFCs) and certificates of deposit (CDs) stayed elevated. In the primary market, fund mobilisation through issuance of CDs at ₹6.2 lakh crore during 2023-24 (up to January 2024) was higher than ₹5.4 lakh crore a year ago. Banks’ reliance on the issuance of CDs has increased this year amidst robust credit growth without commensurate growth in deposits (Chart IV.3). CP issuances at ₹10.8 lakh crore (up to January 2024) were also robust, largely similar to ₹11.4 lakh crore during the same period a year ago.
The yield on the 10-year G-sec benchmark softened to 7.09 per cent on February 15 from 7.15 per cent on January 15 (Chart IV.4a). Bond yields declined sharply on February 1 following budget announcement of gross market borrowings, which was much lower than market expectations. The yield curve shifted downwards with pronounced softening of yields across the mid to the long end of the curve (Chart IV.4b).
Corporate bond yields and the associated risk premia exhibited a mixed trend during January 15 to February 14, 2024 (Table IV.1). Corporate bond issuances during 2023-24 (up to November) were higher at ₹6.1 lakh crore as compared with ₹5.3 lakh crore a year ago. Easing long term yields and relative stability in the bond market amidst a healthy economic outlook has prompted investors to raise funds for investments through debt issuances. | Table IV.1: Financial Markets - Rates and Spread | | Instrument | Interest Rates (per cent) | Spread (basis points) (Over Corresponding Risk-free Rate) | | Dec 18, 2023 – Jan 12, 2024 | Jan 15, 2024 – Feb 14, 2024 | Variation | Dec 18, 2023 – Jan 12, 2024 | Jan 15, 2024 – Feb 14, 2024 | Variation | | 1 | 2 | 3 | (4 = 3-2) | 5 | 6 | (7 = 6-5) | | Corporate Bonds | | | | | | | | (i) AAA (1-year) | 8.02 | 8.01 | -1 | 79 | 75 | -4 | | (ii) AAA (3-year) | 7.93 | 8.00 | 7 | 76 | 84 | 8 | | (iii) AAA (5-year) | 7.97 | 7.82 | -15 | 75 | 63 | -12 | | (iv) AA (3-year) | 8.58 | 8.61 | 3 | 140 | 146 | 6 | | (v) BBB- (3-year) | 12.22 | 12.26 | 4 | 504 | 511 | 7 | Note: Yields and spreads are computed as monthly averages.
Sources: FIMMDA; and Bloomberg. | Reserve Money (RM) growth decelerated to 5.8 per cent as on February 9, 2024 from 11.2 per cent a year ago (8.8 per cent adjusted for the first-round impact of change in Cash Reserve Ratio (CRR) [Chart IV.5]. The growth in currency in circulation (CiC), the largest component of RM, decelerated to 3.7 per cent from 8.2 per cent a year ago, reflecting the withdrawal of ₹2000 banknotes.16
Money supply (M3) rose by 11.0 per cent (y-o-y) as on January 26, 2024 (9.8 per cent a year ago)17. Aggregate deposits with banks, the largest component of M3, increased by 12.0 per cent (10.0 per cent a year ago). Scheduled commercial banks’ (SCBs) credit growth stood at 16.1 per cent as on January 26, 2024 (16.3 per cent a year ago) [Chart IV.6]. SCBs’ deposit growth (excluding the impact of the merger), which registered an increase in the wake of the withdrawal of ₹2000 banknotes, remained in double digits in January 2024 (Chart IV.7). During June 2022 - May 2023, the incremental credit-deposit ratio remained above 100 per cent, but declined thereafter to below 100 per cent, reflecting the surge in deposit mobilisation. As on January 26, 2024 the incremental credit-deposit ratio stood at 96.9 per cent (Chart IV.8).
With the statutory requirements for CRR and statutory liquidity ratio (SLR) at 4.5 per cent and 18 per cent respectively, around 77.0 per cent of deposits were available with the banking system for credit expansion as on January 26, 2024. The deposit base is being supplemented by issuances of CDs (Chart IV.9). 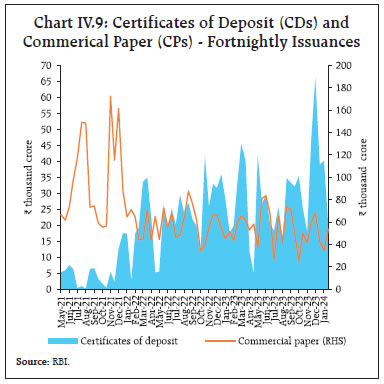 In response to the cumulative 250 bps hike in the policy repo rate since May 2022, banks have revised their repo-linked external benchmark-based lending rates (EBLRs) upward by the same magnitude. The 1-year median marginal cost of funds-based lending rate (MCLR) increased by 155 bps during May 2022 to January 2024. Consequently, the weighted average lending rate (WALR) on fresh rupee and outstanding rupee loans increased by 181 bps and 113 bps, respectively, during May 2022 to December 2023. Tight liquidity conditions, coupled with robust credit demand, prompted banks to increase their term deposit rates in recent months. The weighted average domestic term deposit rate (WADTDR) on fresh and outstanding deposits increased by 246 bps on and 180 bps, respectively, during May 2022 to December 2023 (Chart IV.10). The pass-through to WALRs on fresh rupee loans and WADTDRs on fresh deposits was higher for public sector banks than for private banks, while transmission to WALRs on outstanding loans was higher for private banks (Chart IV.11).
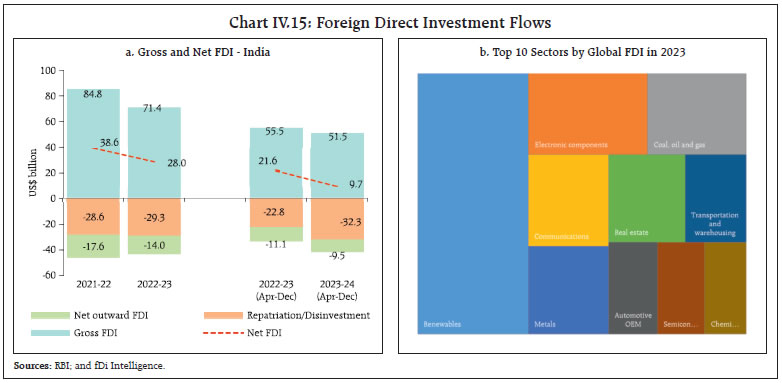
For a sample of 38018 listed banking and financial sector companies, revenues, which primarily include the interest income in case of banks, registered double digit growth amidst strong credit demand. Other income, which includes income from fees, commissions, profit and loss from investments, also remained resilient. Expenditure growth outpaced revenue growth amidst an increase in interest and other expenses, leading to some moderation in growth of operating profits. Lower provisioning costs, however, boosted the net profit of banks and financial sector companies (Chart IV.12). The Indian equity market benchmark BSE Sensex hit its all-time high of 73,328 on January 15, 2024 tracking positive global cues (Chart IV.13). FPI sell-off following quarterly earnings from a major private sector bank, however, imparted volatility to the Indian market. Thereafter, markets oscillated between gains and losses amid liquidation of a large Chinese real estate developer, hawkish comments by the US Federal Reserve Chair in the Federal Open Market Committee (FOMC) meeting and announcement of the interim Union Budget, 2024-25. Subsequently, moderation in domestic CPI inflation and pickup in IIP growth aided market sentiments. Overall, the BSE Sensex closed at 71,555 on February 13, 2024, lower by 2.4 per cent from its mid-January 2024 peak. 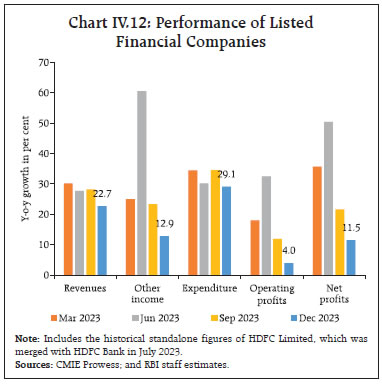 Macroeconomic uncertainty – as measured from the responses of the professional forecasters (SPF)19 survey – suggest that uncertainty continues to remain low, coinciding with a low VIX – a volatility index based on Nifty index option prices (Chart IV.14). 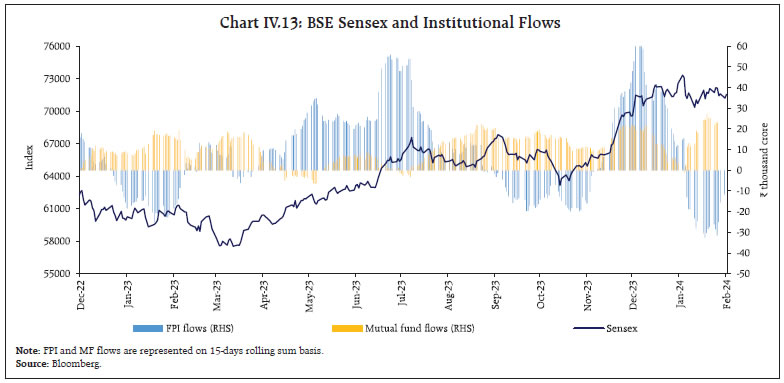 Gross inward foreign direct investment (FDI) moderated to US$ 51.5 billion during April- December 2023 from US$ 55.5 billion during the corresponding period a year ago (Chart IV.15a). Net FDI at US$ 9.7 billion during April- December 2023 were lower than US$ 21.6 billion a year ago, mainly due to a rise in repatriation of equity capital. About 65 per cent of the FDI equity inflows were received in manufacturing, electricity and other energy sectors, transport, financial services, and retail and wholesale trade sectors. Singapore, Mauritius, the US, Japan, the UAE and the Netherlands accounted for more than three-fourths of the equity flows during the same period. According to fDi Intelligence20, the number of globally announced greenfield FDI projects increased from 156 in 2022 to 174 in 2023. The most popular FDI sectors in 2023 were associated with green energy and digitisation, reflecting an undergoing structural shift in the world economy (Chart IV.15b). The United Nations Conference on Trade and Development (UNCTAD) expects a modest increase in global FDI flows in 2024, supported by receding inflation and a subsequent fall in the cost of borrowings. Existing risks in the form of persistent geopolitical tensions, heightened macroeconomic uncertainties and deepened geo-fragmentation concerns, however, limit the FDI outlook for 2024. 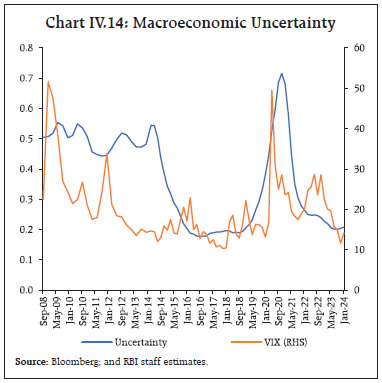
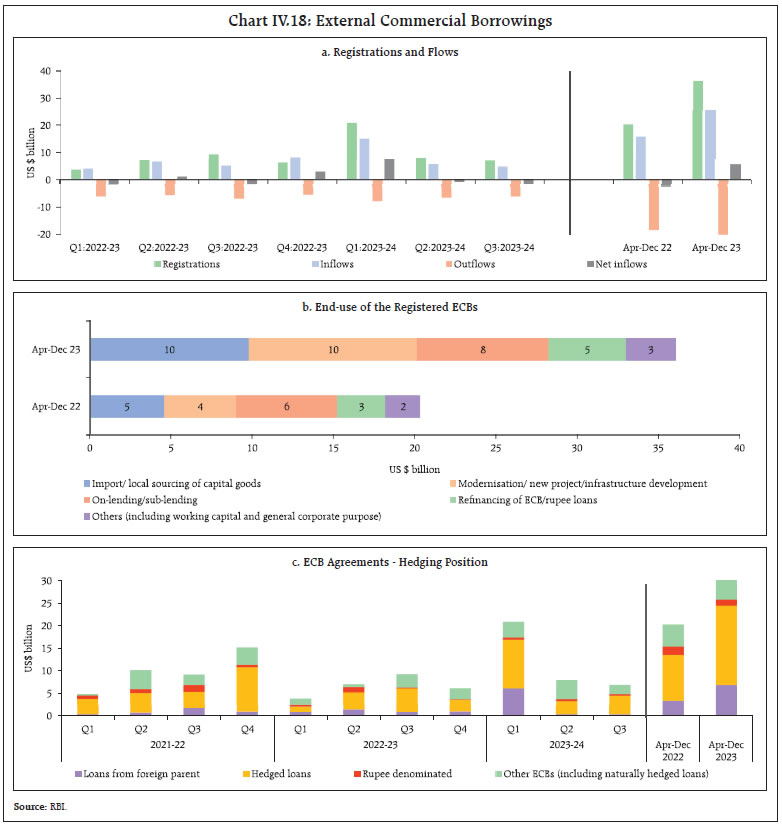
 Foreign portfolio investment (FPI) flows turned negative after two months in January 2024, weighed by rising US treasury yields. Net FPI outflows were to the tune of US$ 0.7 billion in January 2024 due to outflows in the equity segment (Chart IV.16a). The debt segment, however, recorded net inflows of US$ 2.5 billion, continuing the positive trajectory since April 2023. Within equity, financial services and FMCG recorded the highest outflows, while information technology, and oil, gas and consumable fuel received the largest inflows during January 2024. In February 2024 (up to 15th), FPI flows turned positive with net FPI inflows of US$ 1.8 billion. On a cumulative basis, net FPI inflows amounted to US$ 32.9 billion during 2023-24 so far (up to 15th February), led by equity inflows. Net equity inflows to India were to the tune of US$ 20.8 billion during 2023-24 (up to January 2024), which is the highest among emerging market peers (Chart IV.16b). 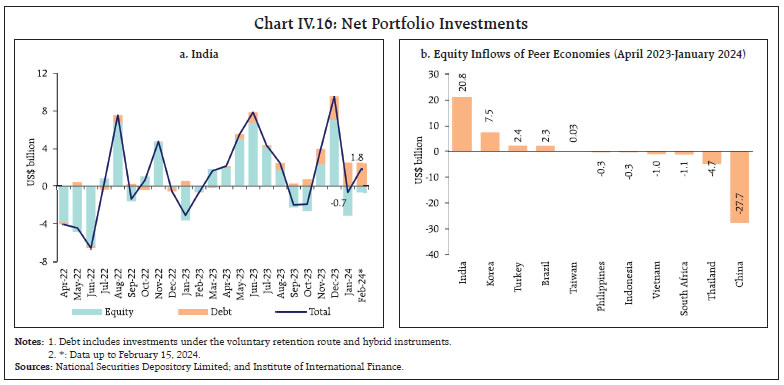 Net accretions to non-resident deposits increased to US$ 9.3 billion during April-December 2023 from US$ 5.4 billion a year ago, mainly due to a rise in net accretions to Foreign Currency Non-Resident [FCNR(B)] accounts and Non-Resident (External) Rupee Accounts [NR(E)A]. Overall, investment intentions of the private corporate sector have been positive this year so far. Total cost of projects, for which loans were sanctioned by major banks/all-India financial institutions (FIs) stood at ₹2.4 lakh crore during April-December 2023, which was 23 per cent higher than that in the corresponding period last year. Funds raised through external commercial borrowings (ECBs) for capex and initial public offerings (IPOs) remained robust during the second and third quarters of the current financial year, though their levels were lower than such resources raised during Q1:2023-24 (Chart IV.17). During April-December 2023, ECB registrations (US$ 36.1 billion) and disbursements (US$ 25.6 billion) have been higher than their levels in the corresponding period in earlier years. After the unusually high amount of ECB registrations (US$ 21 billion) during Q1:2023-24, new registrations normalised to US$ 8 billion and US$ 7 billion during the second and third quarters of 2023-24, respectively. Adjusting for principal repayments, net ECB inflows stood at US$ 5.6 billion this year so far as against net outflows of US$ 2.3 billion in the corresponding period last year (Chart IV.18a). Out of total ECBs registered during April-December 2023, more than three-fourths are for capital expenditure (Chart IV.18b). Also, nearly three-fourths of ECBs raised were effectively hedged in terms of explicit hedging, rupee denominated loans or loans from foreign parents, offsetting considerably the interest and exchange rate sensitivity of foreign exposures (Chart IV.18c). The secured overnight financing rate (SOFR), the global benchmark interest rate, increased by 50 bps during April-July 2023 but stabilised later in line with pause in the global monetary policy tightening measures. The overall cost of ECBs has risen substantially over the last two years due to a rise in global interest rates, even as the weighted average interest margin (WAIM) (over the benchmark rates) moderated to 158 bps during April – December 2023 from 169 bps a year ago and an average of 207 bps during the year 2021 (Chart IV.19). 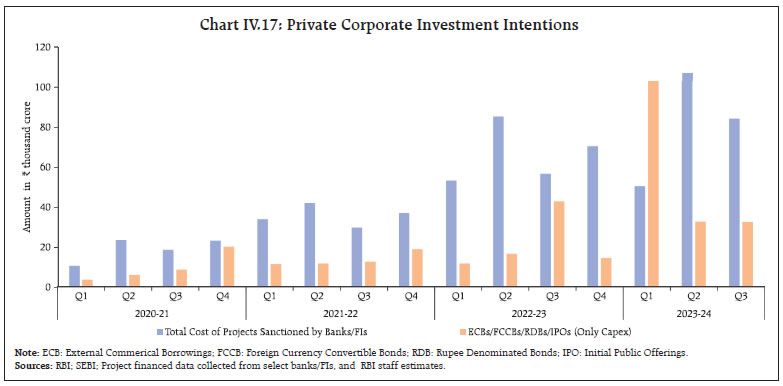
 As on February 9, 2024 foreign exchange reserves at US$ 617.2 billion stood sufficient to cover for more than 10 months of imports projected for 2023-24 and more than 97 per cent of total external debt outstanding at end-September 2023 (Chart IV.20a). India currently holds the fourth largest foreign exchange reserves in the world, up from sixth since the COVID-19 pandemic. Its reserves have increased by US$ 38.8 billion this financial year so far, the second highest among major foreign exchange reserves holding countries (Chart IV.20b).
The Indian rupee (INR) appreciated modestly by 0.2 per cent (m-o-m) vis-à-vis the US dollar in January 2024. Moreover, the INR exhibited the least volatility among major currencies during the month (Chart IV.21). In terms of 40-currency real effective exchange rate (REER), the INR appreciated marginally by 0.1 per cent (m-o-m) in January 2024 as appreciation of the INR in nominal effective terms more than offset negative relative price differentials (Chart IV.22). Payment Systems The onset of 2024 was marked by a strong expansion (y-o-y) across major digital payment modes (Table IV.2). Large-value transfers under the Real Time Gross Settlement (RTGS) posted double digit growth (y-o-y) in both volume and value terms in January 2024. The Unified Payments Interface (UPI) continued its upward run, buoyed by the initiative to enhance its domestic and international adoption. Recently, the NPCI International Payments Limited (NIPL) partnered with Lyra, a leader in securing e-commerce and proximity payments, to introduce UPI payments in France, the first European country to accept UPI.21 Continuing with the internationalisation effort, UPI and RuPay connectivity projects have been launched with Mauritius and Sri Lanka to deepen financial integration.22 Additionally, Google India Digital Services and NIPL signed a Memorandum of Understanding (MoU) to expand the global reach of the UPI, establish similar payment systems in other countries and streamline cross-border financial transactions.23 The recently released Reserve Bank’s Digital Payments Index (RBI-DPI) showed a growth (y-o-y) of 11 per cent in September 2023, underscoring the growing digitalisation of the payment ecosystem.24 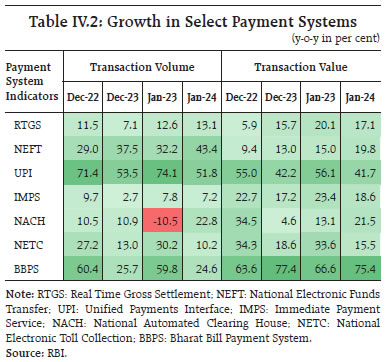 In the interim budget for 2024-25, Digital Public Infrastructure (DPI) is designated as a crucial factor of production for the 21st century, aimed at formalising the economy. A one lakh crore rupees corpus, with a fifty-year interest-free loan, is established to support technological advancements and foster innovations through long-term financing. Tax benefits for start-ups and investment extensions have been proposed to encourage entrepreneurship and economic growth. Furthermore, the Reserve Bank, in its statement on developmental and regulatory policies of February 8, 2024 proposed to streamline the onboarding process and bring in additional fraud risk management requirements within the Aadhaar Enabled Payment System (AePS) to enhance security. It proposed the adoption of a principle-based “Framework for authentication of digital payment transactions”, as well as programmability for Central Bank Digital Currency Retail (CBDC-R). An offline functionality in CBDC-R is being envisaged for enabling transactions in areas with poor or limited internet connectivity.25 Conclusion Monetary policy the world over is at an inflection point. While the tightening cycle appears to have run itself out, the path forward remains bounded by the final downslide of inflation to targets which is proving daunting due to the materialisation of tail events. In the light of these evolving macroeconomic and financial developments, the RBI’s monetary policy committee (MPC) met during February 6-8, 2024 and decided to keep the policy repo rate unchanged at 6.50 per cent - as it has done for all of 2023-24 – and persevered with the stance of withdrawal of accommodation. It noted that domestic economic activity is holding up well and is expected to be backed by the momentum in investment demand, optimistic business sentiments and rising consumer confidence. Accordingly, the projection of real GDP growth for 2024-25 was placed at 7 per cent. CPI inflation was projected at 4.5 per cent for the year 2024-25. Although lower by 90 basis points than the estimated average for 2023-24, the MPC noted with concern that large and repetitive food price shocks are impeding the disinflation engendered by the steady easing of core inflation, with geopolitical events and their impact on supply chains, and volatility in international financial markets and commodity prices posing upside risks. The MPC decided that monetary policy must remain disinflationary to ensure anchoring of inflation expectations and the progressive alignment of inflation outcomes with the target, while supporting growth. Stable and low inflation at 4 per cent provides the bedrock for sustaining economic growth. In the words of Shri Shaktikanta Das, Governor: “Price and financial stability are the foundations for strong, sustainable and inclusive growth. Our endeavour all along has been to take a holistic approach to keep the economy in balance. We must not only preserve the hard-earned strength and stability of the Indian economy but also build on this further for a long haul of higher growth with price and financial stability.”26
Annex 1: Major Takeaways from the RBI’s Enterprise Surveys Key takeaways from the Reserve Bank’s quarterly enterprise surveys conducted during Q3:2023-24 are: -
Capacity utilisation (CU) in the manufacturing sector increased to 74.0 per cent in Q2:2023-24 from 73.6 per cent in Q1:2023-24, with manufacturers remaining optimistic about CU in the ensuing quarters. Seasonally adjusted CU, however, declined to 74.5 per cent in Q2 from 75.4 per cent in the previous quarter (Charts A1 and Chart A2). -
Overall business sentiment in the manufacturing, services, and infrastructure sectors remained upbeat for H1:2024-25 (Charts A3 and Chart A4). 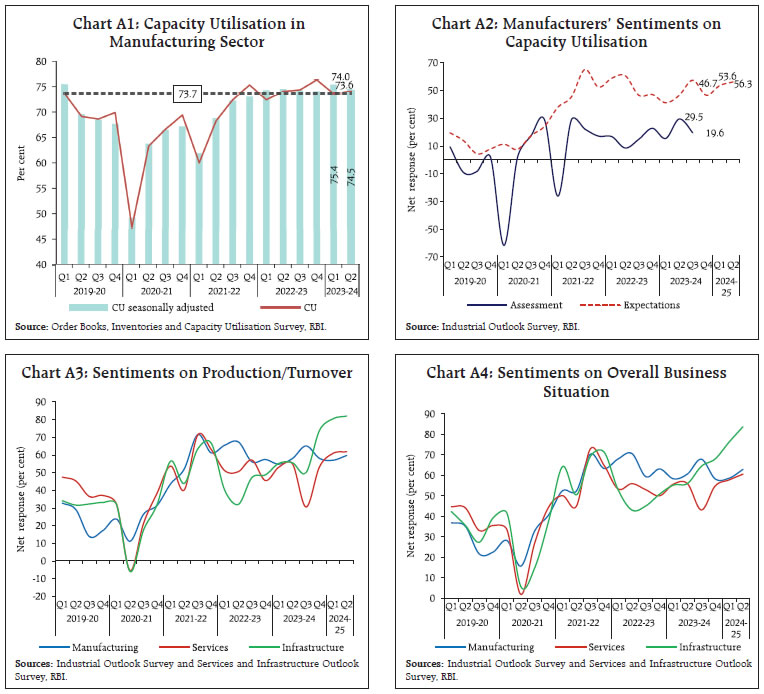 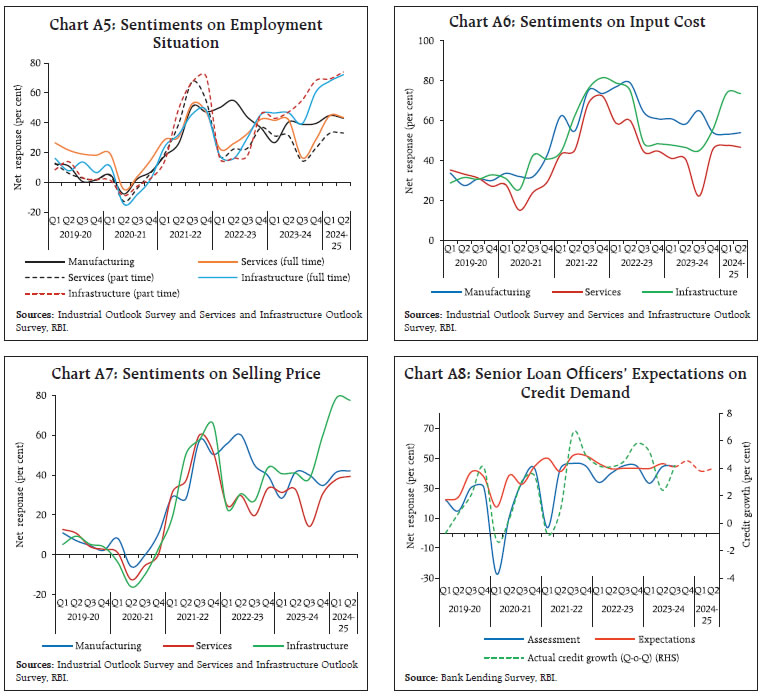 -
The employment situation is anticipated to remain positive across sectors until the first half of the next fiscal year (Chart A5). -
Input cost pressures were assessed to have recorded some moderation in Q3:2023-24 for manufacturing; however, cost pressures are likely to remain elevated in manufacturing, services, and infrastructure sectors till H1:2024-25. Growth in selling prices is expected to move in tandem (Charts A6 and Chart A7). -
Senior loan officers anticipate robust demand for bank loans in H2:2023-24 with some moderation in the retail/ personal loan segment (Chart A8). |
|