by Harendra Kumar Behera^ Monetary policy divergence across jurisdictions has reignited the debate about the level of the natural rate of interest. Updating the estimates of natural rate of interest for India with post-pandemic data, we find an upward shift, driven by growth of potential output. The estimate of the natural rate for Q4:2023-24 is at 1.4-1.9 per cent as compared with our earlier estimate of 0.8-1.0 per cent for Q3:2021-22. These estimates are centred in wide bands of uncertainty, warranting careful interpretation in the assessment of the monetary policy stance. Introduction The surge in inflation in the post-pandemic period exacerbated by geopolitical conflicts evoked a synchronised monetary policy response across jurisdictions. As central banks lifted policy rates from decade-long historical lows and adopted aggressive restrictive stances, financial conditions tightened, and real interest rates rose substantially. Subsequently, inflation eased from its peak at differing speeds and magnitudes, but the last mile of disinflation is proving to be arduously protracted. With central banks choosing to maintain disinflationary stances, a growing divergence from market expectations has reignited the debate about the level of the natural rate of interest or r-star1. In India, this debate is reflected in a proliferation of web searches of the term “neutral rate” (Chart 1). On one side of the debate, it is argued that that the changes in some of the structural determinants of r-star are driving it upwards (Brand et al., 2023; Benigno et al., 2024; Schnabel, 2024). On the other side of the spectrum, it is believed that the real interest rate should return to its pre-pandemic level once the short-term shocks dissipate (IMF, 2023a). For India, estimating the natural rate becomes particularly challenging in view of significant structural transformations and demographic shifts. In particular, pandemic-induced complexities have altered estimates of potential output and profoundly impacted inflation dynamics. This has necessitated a reassessment of traditional models and approaches to measuring the natural rate of interest. The challenge is to incorporate the impact of these unprecedented shocks into estimations. In its Wicksellian origins, the natural rate of interest is associated with an economy operating at full capacity without generating inflationary pressures: “There is a certain rate of interest on loans which is neutral in respect to commodity prices and tends neither to raise nor to lower them.”2 A strand of the literature has operationalised this definition by defining it is the level of the interest rate at which saving equals to investment, consistent with stable prices. In operational terms, the natural rate serves as a reference for gauging the stance of monetary policy (IMF, 2023a). Hence, the difference between the real policy interest rate and the natural rate measures the monetary policy stance. When the policy rate is set below the natural rate, the stance is regarded as accommodative, and the converse signifies a restrictive stance. The policy stance is neutral when the real policy rate is at the level of the natural rate. 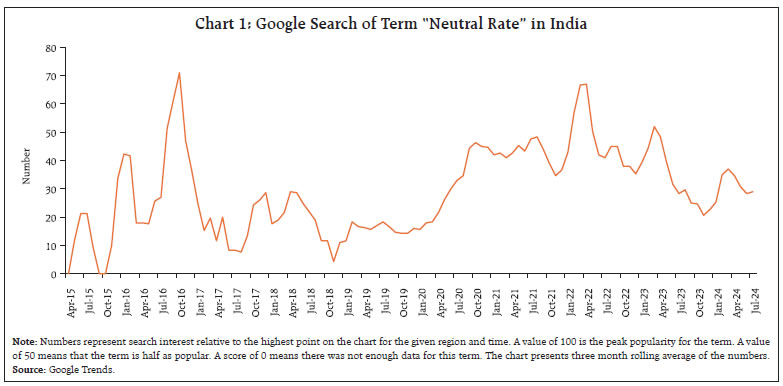 As the natural rate is not observable, it has to be estimated, as it is crucial for setting appropriate monetary policies and assessing them. Natural rate estimates are sensitive to both model selection, measurement issues and statistical uncertainty. To elaborate further, different models can produce estimates that can differ substantially. Uncertainty also stems from the data, their measurement as well as estimation approaches. Hence, estimates of the natural rate are presented in the form of confidence bands surrounding the results for every model. Informed judgement is called for in sifting through the broadest possible model estimates while incorporating all information available outside models, i.e., a risk management approach in the face of high uncertainty (Jordan, 2024). Balancing the risk of tightening monetary policy too much against the risk of tightening too little is essential in deciding the policy rate, rather than taking the decision solely based on the natural rate which is imprecise in values (Powell, 2023). Against this backdrop, the rest of the article is structured into four sections. After a discussion on determinants of the natural rate of interest in Section II, Section III presents different methodologies that are used to estimate it. Updated estimates of the natural rate for India are reported in Section IV. Concluding observations are set out in Section V. II. Drivers of the Natural Rate of Interest The natural rate is determined by factors that impact long-run saving-investment behaviour. In particular, factors that reduce saving or increase investment raise the natural rate. Higher productivity growth associated with new investment opportunities raises demand for capital which, in turn, increases real interest rates and therefore, the natural rate of interest (Boocker et al., 2023). Longer life expectancy raises saving in order to support a longer retirement. A lower dependency ratio – reflecting a higher share of working age people in the population – increases saving as those in the workforce typically save more than the elderly and young dependants. Higher inequality raises saving as richer households save a larger share of their income relative to less affluent families. Higher risk aversion induces higher saving – in particular, in safe assets – as a buffer against future economic downturns and, at the same time, lowers investment. Investments in risky assets are found to increase with advancement in digital technologies. Persistent fiscal deficits reduce gross saving and crowd out private investment. Under the secular stagnation hypothesis, an economy can experience rise in saving and fall in investment due to lack of demand for new investment and this could keep interest rates low for longer (Summers, 2016). In an integrated world with free capital movements, saving-investment gaps can be accommodated through current account deficits or surpluses. However, natural rates would still need to adjust to equate actual and potential output and saving and investment at the global level. The natural rate could also vary due to the influence of monetary policy in the long-run – although standard macroeconomic theory holds that monetary policy is neutral in the long-run and can affect real variables only in a transitory fashion, recent work shows that monetary policy can have long-lasting effects on real variables (Jordà et al., 2020; Benigno et al., 2024; Borio et al., 2019). Furthermore, prolonged monetary expansion could fuel debt accumulation and financial imbalances by impacting debt and asset price dynamics and thereby lower the natural rate over long horizons (Borio et al., 2019; Borio et al., 2022). To the extent that signals inferred from central banks have an impact on private consumption and investment decisions, it may even result in informational feedback loops inducing shifts in the natural rate. India’s demographic structure, characterised by a significant youth population and a growing working age cohort, would influence the natural rate of interest positively by inducing higher saving and investment as well as financial liabilities for education, housing, marriage and retirement. The rising demand for capital is reflected in the recent uptick in investment (Chart 2). This demographic advantage also bolsters productivity and innovation across sectors. As the demographic dividend matures, there may be shifts in saving behaviours as more individuals approach retirement age, potentially moderating the overall saving rate. Moreover, India faces several demographic changes such as a falling dependency ratio that enhances savings and investment potential (Chart 3). More recently, however, the pandemic has imposed a temporary setback in life expectancy gains and economic stability.
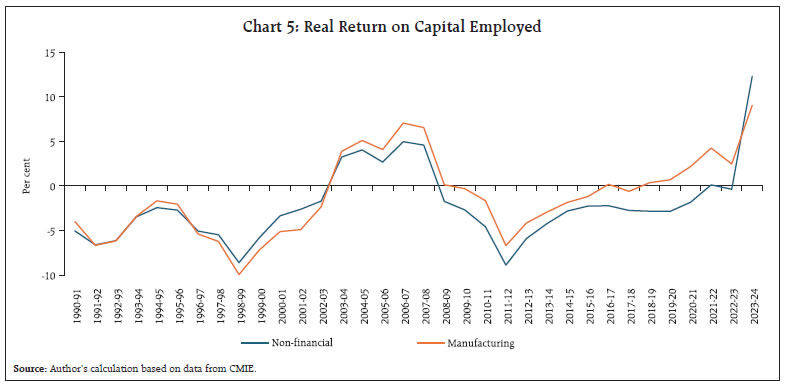
Furthermore, fiscal consolidation is balancing investment demand in order to sustain the growth momentum (Chart 4). All these factors might be contributing to a rise in India’s long-term growth potential and reversing the declining trend in the natural rate of interest that was found in the literature in the Indian context (e.g., Behera et al., 2016; Pattanaik et al., 2022). This is already being reflected in the rise in real (adjusting for inflation expectations) long-term interest rates and returns on capital in recent years (Chart 5). 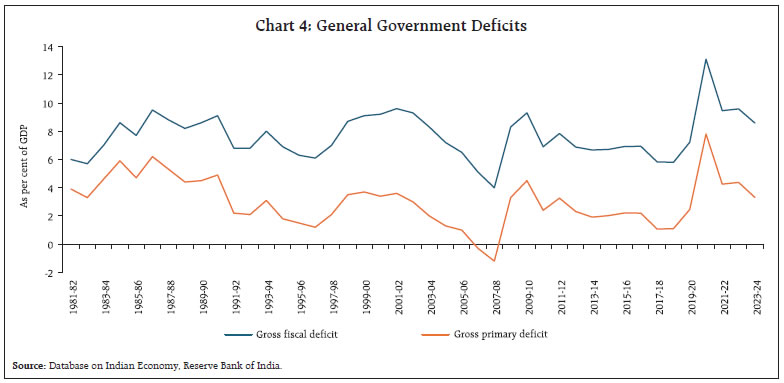
 Climate change and the green transition, and digitalisation will require exceptionally high investment. The higher frequency of extreme weather events is likely to necessitate extensive public and private investments for both rebuilding and adaptation. Furthermore, in view of rising geopolitical risks, companies that seek to make their supply chains more resilient by diversifying their sourcing strategies will generate demand for higher investment. India’s export thrust through initiatives such as its production-linked incentive scheme, districts as export hubs; and by supporting the export potential of micro, small and medium enterprises could further increase investment demand (Patra, 2024). Moreover, rapid advances in artificial intelligence and digitalisation will require large public and private sector investments in physical and human capital for acquiring and implementing new technologies and reshaping business processes. Considering that part of these massive overall investment needs will be government-financed, and that, in the new geopolitical situation, defence spending may have to be significantly stepped up, public debt burdens are likely to rise. In sum, several forces propelling rising investment demand are expected to increase the natural rate of interest going forward. III. Approaches to Estimate Natural Rate of Interest Several approaches to estimating the natural rate of interest are adopted in the literature. The challenge is to adopt the most robust and efficient one which is also suitable to country-specific circumstances. III.1 Statistical Filtering Methods The natural rate can be proxied by trends in the real interest rate. Accordingly, statistical filters, e.g., Hodrick-Prescott and Kalman filters are used to estimate the underlying trend in real interest rates by separating the cyclical component from observed real interest rates. III.2 Structural Economic Models Dynamic Stochastic General Equilibrium models incorporate microeconomic foundations and capture the interactions between economic agents over time under uncertainty. They provide a theoretical framework for estimating the natural rate, based on structural parameters like preferences, technology, and policy rules. Specifically, these models estimate the natural rate over the business cycle, which ensures that a central bank tracking the natural rate stabilises inflation either concomitantly or over the medium term in the absence of nominal frictions (Del Negro et al., 2017; Neri and Gerali, 2019). Semi-Structural Models, such as the Laubach-Williams (LW) model, use fewer structural assumptions than DSGE models. They typically combine a Phillips curve (describing inflation dynamics) and an IS curve (describing the output gap) to estimate the natural rate by fitting the model to observed data (Laubach and Williams, 2003; Holston et al., 2023). The key intuition is that rising inflation generally signals that current interest rates are below the natural rate. The model removes short-run business cycle fluctuations through a trend/cycle decomposition and attributes changes in the natural rate to trend output growth and a residual that captures other potential drivers. III.3 Time Series Models These models use historical data on interest rates, inflation, and output gaps to estimate the natural rate through econometric techniques. Vector autoregression (VAR) and Bayesian VAR are common methods that allow for interactions between variables and provide estimates of the natural rate as the five to ten year ahead forecast of the real interest rate (Lubik and Matthes, 2015; Jarocinski, 2017). III.4 Market-Based Approaches (a) Financial Markets Data: Estimates derived from financial market data such as yields on government bonds can also provide insights into the natural rate. The term structure of interest rates and inflation expectations embedded in bond prices are particularly useful (Hördahl and Tristani, 2014). (b) Forward-Looking Measures: These measures use expectations about future economic conditions from surveys or market indicators like swap rates or futures contracts to infer the natural rate. Surveys of economists and financial analysts often provide consensus estimates of the natural rate from estimates of long-term inflation expectations and long-term policy rates, which are then used to estimate the natural rate by excluding inflation expectations from policy rate forecasts. III.5 Policy Rules The Taylor rule relates the nominal interest rate to deviations of actual inflation from the target and actual output from its potential. By rearranging the rule, estimates of the natural rate can be derived on the basis of historical policy decisions and economic conditions. Each method has its strengths and limitations, and often, a combination of approaches is used to provide the most robust estimate of the natural rate of interest. IV. Estimates of Natural Rate of Interest in India Globally, empirical estimates of the natural rate of interest point to large shifts in its level after the global financial crisis and more prominently after the pandemic (see Holston et al., 2023; Brand et al., 2023; Obstfeld, 2023; Benigno et al., 2024). The trend level of the real policy rate in India derived from application of statistical filters declined by more than 200 basis points after the global financial crisis (Perrelli and Roache, 2014). Natural rates in Asian economies declined after the global crisis, reflecting lower trend GDP growth at home and a lower global neutral rate (IMF, 2015)3. Three different methodologies – theoretical calibration; semi-structural modelling; and an extended Taylor rule – point to a decline in India’s natural rate after the global crisis to 2.6 per cent, 4.2 per cent and 1.1 per cent, respectively. The IMF’s estimates suggest that the natural rate reduced to around 1 per cent (IMF, 2023b). While LW-based estimates of the natural rate of interest using different measures of inflation (i.e., headline and core CPI) were in the range of 0.8 per cent (when core CPI inflation was used as the deflator) to 1.0 per cent (when headline CPI inflation was used as the deflator) for Q3:2021-22, corresponding modified LW estimates incorporating the financial cycle were in the range of 2.0 per cent to 2.1 per cent (Pattanaik et al., 2022). Thus, estimates of the natural rate of interest for India reflect wide variations (Table 1). Using the methodology delineated in earlier exercises (Pattanaik et al., 2022) that is based on seminal work (Laubach and Williams, 2003) and its extended version (Borio et al., 2019), estimates of the natural rate for India are updated in this section. In the LW framework, the standard New Keynesian system comprising an IS curve, a Phillips curve and a policy rule are employed to estimate the natural rate as a function of potential output growth and several other determinants subsumed in a low frequency variable called ‘z’.4 This approach regards the natural rate as the level of the real interest rate that is consistent with output at its potential level and inflation at target in the absence of transitory shocks to aggregate demand and aggregate supply. The modified LW method additionally augments the IS curve with the leverage gap as a proxy for the financial cycle and a separate equation is added for the leverage gap to incorporate the interaction of monetary policy with the financial cycle (Juselius et al., 2016 and Borio et al., 2019). The leverage gap is estimated by a cointegrating regression (Pattanaik et al., 2022). | Table 1: Estimate of Natural Rate of Interest for India | | Author(s) and year of study | Deflator used to compute real interest rate | Period of study | Methodology | Estimates of natural rate | | Dash and Bhole (2011) | Headline WPI inflation applied to call money rate. | Annual data from 1986-87 to 2010-11 | Unobserved state space framework | 2.01 per cent for 2000-2011; 3.37 per cent for 1995-2000; 4.08 per cent for 1986-1995. | | Non-food manufacturing WPI inflation applied to call money rate. | | | 4.93 for 2000-2011; 3.98 per cent for 1995- 2000; 9.11 per cent for 1986-1995. | | IMF (2015) | CPI | Quarterly data from 2008:Q4 to 2014:Q3 | Calibrated Euler equation | 3.7 per cent in 2001-08; 2.6 per cent in 2009-14. | | Laubach and Williams (2003) | 5.4 per cent in 2001-08; 4.2 per cent in 2009-14. | | Semi-structural with Extended Taylor-rule | 1.3 per cent in 2001-08; 1.1 per cent in 2009-14. | | Goyal and Arora (2016)# | One-period ahead quarter-on-quarter non-food manufacturing WPI inflation applied to call money rate. | Quarterly data from 1990:Q2 to 2011:Q4 | Laubach-William (2003) approach; | Marginally negative to above 5 per cent for 2011:Q4; | | Maximum likelihood estimation | -15 per cent to 15 per cent for the full sample period. | | Behera et al., (2017) | One year ahead expected inflation data from the World Economic Survey. | Quarterly data from 1996:Q2 to 2015:Q1 | Laubach-William (2003) approach; Maximum likelihood estimation | Across models and different measures of real interest rate: 0.6 per cent to 3.1 per cent for 2015:Q1. | | Expected inflation derived from a rolling AR(1) model. | | | Core estimate: 1.6 per cent to 1.8 per cent for 2015:Q1 (LW approach). | | Applied to 91 days T-bills and policy repo rate | | | | | Pattanaik et al., (2022) | Inflation expectations derived from CPI-C inflation applied to 91 days T-bill yields | Quarterly data from 1996:Q2 to 2021:Q4 | Laubach-William (2003) approach; | 0.8 per cent to 1.0 per cent for 2021:Q4 (LW approach). | | Modified LW approach incorporating effects of financial cycle; | 2.0 per cent to 2.1 per cent for 2021:Q4 (Modified LW approach). | | Maximum likelihood estimation | | | #: Inferred the estimates from the charts presented in the paper. | Quarterly time series data on real GDP, CPI inflation, 3-month Treasury bill yields, bank credit and BSE Sensex (as a proxy for India’s equity prices) for the period 1996:Q2-2024:Q1 are used to estimate the natural rate5. The real interest rate (r) used in the model is calculated by taking the difference between 3-month Treasury bill yields and ex-ante inflation expectations as the trend of four-quarter moving average of quarter-on-quarter changes in seasonally adjusted CPI. The estimated leverage gap for India seems to capture credit booms and episodes of asset price bubbles and busts reasonably well (Chart 6). A negative leverage gap suggests that asset (equity) prices are relatively bullish when compared with the credit-GDP ratio in recent years, except during the pandemic. To overcome the problems in maximum likelihood estimation (MLE) methods and to avoid the pile-up problem7, we employ Bayesian methods with relatively loose priors, i.e., beta distribution for all variable coefficients and gamma distribution for shock variances to derive the posterior estimates of various parameters6. The assumptions on specifying the means and standard deviations of the priors are mostly motivated by existing estimates for India in the literature as well as estimates from HP filtered series of different variables wherever parameter estimates are not available in the literature. We calibrate the rate of time preference (ρ) with a value equal to 0.99, in line with the literature. As we have estimated the model with non-stationary variables, we use a diffuse Kalman filter along with the Metropolis-Hastings algorithm to estimate the model. Each set of results is based on 100,000 posterior draws after a burn-in period of 10,000. For computing each marginal likelihood value, we use 50,000 important sampling draws. 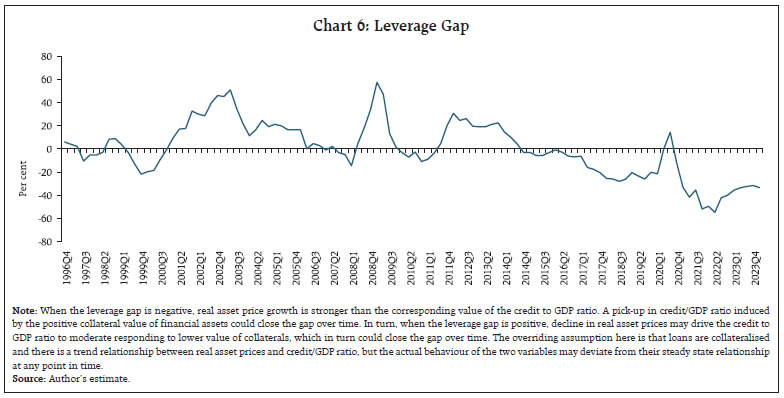 IV.1 Results The posterior estimates of the parameters in the model are found to be different from the priors, making them suitable for use to estimate the natural rate (Table 2). The posterior estimates indicate that the output gap is influenced by the leverage gap (a la Juselius et al., 2016). Some caveats, however, need to be recognised. First, the inclusion of the leverage gap in the IS curve equation increases persistence of the output gap, implying a weaker influence of monetary policy (or real interest rate gap) on demand conditions (or output gap). Second, the leverage gap exhibits a high degree of persistence. Third, we did not find a major role of monetary policy in influencing financial cycles in India as the coefficient of the real interest rate gap (γ2) in the leverage gap equation is small. The posterior mean estimates indicate that the deceleration in India’s potential output reversed in the post-pandemic period (Chart 7). The growth of potential output is estimated at around 7 per cent for Q4:2023-24. The wide credible bands at different phases represent large uncertainty about the estimates. Accordingly, the growth of potential output at present could lie somewhere in a range between 5.9 per cent to 8.3 per cent. | Table 2: Parameter Estimates with and without Leverage Gap | | Equation | Parameter | Variables | Without Leverage Gap | With Leverage Gap | | Prior mean | Prior s.d. | Posterior mean | Posterior s.d. | Prior mean | Prior s.d. | Posterior mean | Posterior s.d. | | IS Curve | ϕ1 | (yt–1 – y*t–1) | 0.6 | 0.15 | 0.571 | 0.116 | 0.6 | 0.15 | 0.575 | 0.108 | | | ϕ2 | (yt–2 – y*t–2) | 0.3 | 0.15 | 0.087 | 0.050 | 0.3 | 0.15 | 0.084 | 0.047 | | | γ1 | (rt–1 – r*t–1) | 0.3 | 0.15 | 0.142 | 0.077 | 0.3 | 0.15 | 0.141 | 0.077 | | | ϕ3 | levgt–1 | | | | | 0.2 | 0.07 | 0.211 | 0.068 | | Phillips Curve | b1 | (yt – y*t) | 0.13 | 0.05 | 0.064 | 0.021 | 0.13 | 0.05 | 0.065 | 0.021 | | | b2 | (yt–1 – y*t–1) | 0.11 | 0.05 | 0.054 | 0.021 | 0.11 | 0.05 | 0.055 | 0.021 | | Taylor Rule | β9 | it–1 | 0.8 | 0.19 | 0.872 | 0.032 | 0.8 | 0.94 | 0.873 | 0.032 | | | β10 | (πtyoy – πt*) | 1.5 | 0.1 | 1.503 | 0.100 | 1.5 | 0.1 | 1.506 | 0.099 | | | β11 | ỹt | 0.3 | 0.07 | 0.310 | 0.069 | 0.3 | 0.07 | 0.334 | 0.080 | | Natural Rate | β1 | r*t–1 | 0.95 | 0.025 | 0.911 | 0.027 | 0.95 | 0.025 | 0.924 | 0.021 | | Leverage Gap | β2 | levgt–1 | | | | | 0.5 | 0.2 | 0.901 | 0.031 | | | γ2 | (rt – r*t) | | | | | 0.3 | 0.2 | 0.003 | 0.002 |
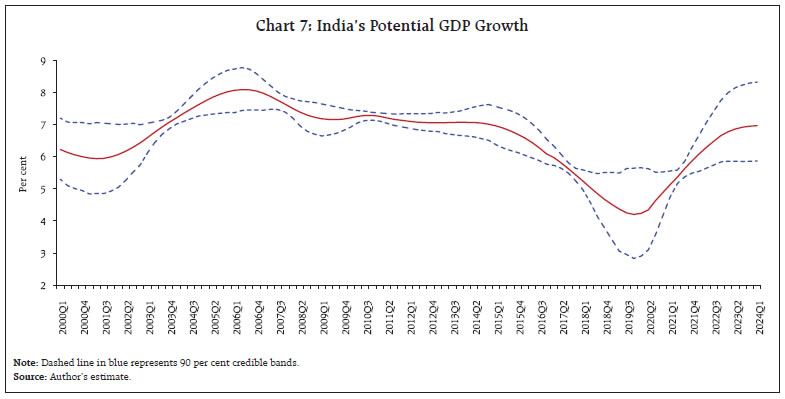 Correspondingly, the natural rate is estimated at 1.4 per cent, which has also started rising after the pandemic. The wide credible bands during the pandemic have narrowed more recently (Chart 8). Estimates of the natural rate of interest for India in the post-pandemic period show an upward movement, driven by a strong growth in potential output. The natural rate of interest estimated earlier for Q3:2021-22 is revised upward from 0.8 -1.0 per cent to 1.1-1.3 per cent, reflecting revision in GDP data. The current estimates suggest a wide range between 1.4-1.9 per cent for Q4:2023-24 (Chart 9).8
V. Conclusion Updating the estimates of natural rate of interest for India with post-pandemic data, we find an upward shift driven by growth of potential output. The estimate of the natural rate for Q4:2023-24 is at 1.4 per cent as the lower bound of a wider range of upto 1.9 per cent than estimates of 0.8-1.0 per cent for Q3:2021-22. Abstracting from the wider credible bands around our current estimates in the aftermath of the pandemic, the importance of understanding the natural rate and measuring it accurately with regular updates cannot be overemphasised. Policymakers and financial market participants must continuously refine their approaches to estimating the natural rate to ensure that it remains a reliable guide for policies that aim to achieve sustainable economic growth and stability. References Behera, H. K., Pattanaik, S., and Kavediya, R. (2017). Natural Interest Rate: Assessing the Stance of India’s Monetary Policy under Uncertainty. Journal of Policy Modeling, 39(3), 482-498. Benigno, G., Hofmann, B., Barrau, G.N. and Sandri, D. (2024). Quo vadis, r*? The Natural Rate of Interest after the Pandemic. BIS Quarterly Review, March, 17-30. Boocker, S., Ng, M. and Wessel, D. (2023). What is the Neutral Rate of Interest? Commentary, Brookings, URL: https://www.brookings.edu/articles/the-hutchins-center-explains-the-neutral-rate-of-interest/ Borio, C., Disyatat, P. and Rungcharoenkitkul, P. (2019). What Anchors for the Natural Rate of Interest? BIS Working Papers, No 777, March. Borio, C., Disyatat, P. Juselius, M. and Rungcharoenkitkul, P. (2022). Why So Low for So Long? A Long-term View of Real Interest Rates. International Journal of Central Banking, 18(3), 47-87. Brand, C., Lisack, N. and Mazelis, F. (2023). Estimates of the Natural Interest Rate for the Euro Area: An Update. ECB Economic Bulletin, Issue 8, 66-69. Dash, P. and Bhole, L. M. (2011). Measuring the Natural Rate of Interest for India. The Indian Economic Journal, 59(3), 38-55. Del Negro, M, Giannone, D., Giannoni, M. and Tambalotti, A. (2017). Safety, Liquidity, and the Natural Rate of Interest. Brookings Papers on Economic Activity, 48, Spring, 235–316. Goyal, A. and Arora, S. (2016). Estimating the Indian Natural Interest Rate: A Semi-structural Approach. Economic Modelling, 58, 141-153. Holston, K., Laubach, T., and Williams, J. C. (2023). Measuring the Natural Rate of Interest after COVID-19. Federal Reserve Bank of New York Staff Reports, No. 1063. Hördahl, P. and Tristani, O. (2014). Inflation Risk Premia in the Euro Area and the United States. International Journal of Central Banking, September,1-47. International Monetary Fund (2015). Regional Economic Outlook: Asia and Pacific, April. --- (2023a). The Natural Rate of Interest: Drivers and Implications for Policy. In: World Economic Outlook: Chapter 2, April, 45-67. ---(2023b). India: 2023 Article IV Consultation Report, Country Report No. 426, December. Jarocinski, M. (2017). VAR-based Estimation of the Euro Area Natural Rate of Interest. ECB Draft Paper. Jordà, Ò., Singh, S. R., and Taylor, A. M. (2020). The Long Economic Hangover of Pandemics. Finance & Development, 57(2), 12-15. Jordan, T.J. (2024). The Natural Rate of Interest (r*) as a Reference Point for Monetary Policy - A Practitioner’s View. Keynote speech at the 2024 Bank of Korea International Conference, Seoul, May 30. Juselius, M., Borio, C., Disyatat, P. and Drehmann, M. (2016). Monetary Policy, the Financial Cycle and Ultra-low Interest Rates. BIS Working Papers, No. 569. Lubik, T and Matthes, C. (2015). Calculating the Natural Rate of Interest: A Comparison of Two Alternative Approaches. Federal Reserve Bank of Richmond, Economic Brief, No 15-10, October. Neri, S., and Gerali, A. (2019). Natural Rates Across the Atlantic. Journal of Macroeconomics, 62, 103019. Patra, M.D. (2024). The Indian Economy - Opportunities and Challenges. Keynote Address at Nomura’s 40th Central Bankers Seminar, Kyoto, 25 March. Pattanaik, Behera, H. and Sharma, S. (2022). Revisiting India’s Natural Rate of Interest. RBI Bulletin, June, 89-99. Perrelli, R. and Roache, S.K. (2014). Time-Varying Neutral Interest Rate – The Case of Brazil. IMF Working Paper, No. 84, May. Powell, J.H. (2023). Inflation: Progress and the Path Ahead. Speech delivered at “Structural Shifts in the Global Economy,” An Economic Policy Symposium sponsored by the Federal Reserve Bank of Kansas City, Jackson Hole, Wyoming, August 25. Pescatori, A. and Turunen, J. (2016). Lower for Longer: Neutral Rate in the US. IMF Economic Review, 64, 708-731. Schnabel, I. (2024). R(ising) star? Speech delivered at The ECB and its Watchers XXIV Conference Session on: Geopolitics and Structural Change: Implications for Real Activity, Inflation and Monetary Policy, March 20. Summers, L. (2016). The Age of Secular Stagnation: What It Is and What to Do About It. Foreign Affairs, February 15. Tanaka, K., Ibrahim, P., and Brekelmans, S. (2021). The Natural Rate of Interest in Emerging Asia: Long-term Trends and the Impact of Crises. ADBI Working Paper Series, No. 1263. Wicksell, K. (1898). Interest and Prices, London, Macmillan (translation by R.F. Kahn published in 1936).
Appendix: Empirical Model A modified version of equation (1), which considers a slow adjustment process in the movement of the natural rate, can be written as: The model also includes an aggregate demand (IS curve) and a Phillips curve relationship in line with New Keynesian framework:
The LW framework is augmented by leverage gap, as a proxy for the financial cycle, in the IS curve to determine the aggregate demand and a separate equation is added for the leverage gap (Juselius et al., 2016 and Borio et al., 2019). Modified IS curve: Evolution of the leverage gap: The study uses eqs. (1) to (7) along with eq.(10) in LW framework and eqs. (1) to (10) except eq. (7) in modified LW framework to estimate natural rate of interest.
|