The global economy continues to exhibit resilience with steady growth and moderating inflation. High frequency indicators (HFIs) for the third quarter of 2024-25 indicate that the Indian economy is recovering from the slowdown in momentum witnessed in Q2, driven by strong festival activity and a sustained upswing in rural demand. The prospects for agriculture and hence rural consumption are looking up with brisk expansion of rabi sowing. Headline CPI inflation moderated to 5.5 per cent in November 2024 on the back of easing food prices. Introduction The global economy continues to exhibit resilience with steady growth and moderating inflation. In the Organization for Economic Co-operation and Development (OECD)’s assessment1, the positive growth momentum in global trade is sustained by rising container and international passenger volumes as well as the global tech cycle. Supply chains are performing well in spite of shipping congestion in key Asian hubs due to rerouting away from the Red Sea. Air freight volumes are rising, benefiting from e-commerce and shipping delays. Commodity prices have been driven down during much of 2024, reflecting a confluence of factors. In energy markets, crude prices have been softening since October 2024 as global oil consumption fell with the declining energy intensity of global GDP. Supply is also diversifying, with the market share of non-OPEC plus gradually increasing. OPEC plus itself is poised to shed spare capacity. In metal markets, the late September rally in response to the Chinese stimulus has been losing strength since. Gold prices surged on geopolitical tensions, only to be outshone by the unrelenting US dollar. In agricultural commodity markets, prices for many staple crops have trended lower due to good harvests, barring some which were hit by weather- and disease-related shocks and trade restrictions. In 2025, agricultural commodity prices may fall by 4 per cent. Yet, food price inflation remains high in low-and middle-income countries, with worsening food insecurity in 16 hunger hotspots covering 22 countries and territories, according to the early warning issued for the period November 2024 to May 2025 by the Food and Agriculture Organisation (FAO) and the World Food Programme (WFP). Conflict and armed violence remain the primary drivers of hunger in these hotspots, followed by weather extremes, economic disparities and high debt levels. The world remains far from achieving the goal of zero hunger by 2030. The World Bank’s overall commodity price index is projected to retreat by 5 per cent in 2025,2 mainly due to improving supply conditions and moderating global growth. Even as financial conditions continue to ease, global financial markets are emitting mixed signals. Stocks got back to winning ways trading Trump – S&P 500 and the Dow Jones notched records by end November – but witnessed a pullback following the release of Federal Markets Open Committee (FOMC)’s summary of economic projections, which pointed to fewer than earlier anticipated rate cuts in 2025. Bond yields have also risen on the prospect of larger fiscal imbalances and an anticipated slowdown in the pace of monetary easing. From late November, the spread on US high-yield bonds over treasuries of comparable maturity fell below the spread on fixed-rate residential mortgages for the first time to near record lows, reflecting the euphoric mood of junk bond markets following the US elections. The search for yield is apparently turning into a rush. Emerging market high-yielding sovereign dollar debt has surged, even as emerging market stocks are trading lower relative to US equities as portfolio flows stampede for the US. On the other hand, China’s long-term bond yields grapple with Japanification as they have fallen below Japanese yields, with wider implications for financial stability. The US dollar has also been hardening, with the break above 108 for the DXY on December 19 following the FOMC statement. Correspondingly, persisting downward pressures on all other currencies are beating them down to new lows as they struggle to price in the mercantilist rhetoric emanating from the incoming US administration. As close to half of the world’s population got down to choosing their leaders and governments, the still resilient global economy also appears to be on the precipice of protectionism that will realign everything from economic activity, trade, immigration to geopolitics and accentuate the divergences in post-pandemic recovery path of per capita incomes across countries. According to the International Monetary Fund (IMF), the world economy could contract by the size of the combined French and German economies, a loss to world GDP of close to 7 per cent, if there is a broad-based trade war between the world’s major economies.3 Electric vehicles have already emerged as the object of tensions. There could be broader spillovers in the form of engineered devaluations of currencies, national self-interest in reshoring supply chains and critical materials, tariff-struck countries moving their companies overseas, and fractures in the world of finance. With global public debt ‘high, rising and risky’,4 a fiscal squeeze may well undermine global growth prospects in 2025, starting with the advanced world. In response, households and businesses are opting to pay down private debt, according to the IMF’s global debt database. Inflation made landfall of sorts in 2024 and will continue to do so in 2025 without grim predictions of deep recessions materialising. According to the OECD4, consumer confidence is more sensitive to food and energy price inflation than other items, as combined food and energy price inflation has outstripped growth in nominal household disposable income since the onset of the pandemic. Labour market conditions are easing but interest rates remain elevated despite a cutting cycle having commenced in a large part of the global economy. Perhaps 2025 will see them fully re-normalise, but at what level they will settle is the question. Natural rates of interest or r stars appear to have risen in several geographies, mirroring the heightened overall policy uncertainty. COP29 ended with a new climate finance target – the New Collective Quantified Goal (NCQG) – of US$ 300 billion a year to fund climate action projects in developing countries by 2035. It fell woefully short, less than a quarter of the developing countries’ demand for US$ 1.3 trillion. India called it out as an ‘optical illusion’. With heat supercharging destructive weather around the globe, only a fraction of the costs incurred by poorer countries to adapt to climate change and shifting to clean energy will be covered. They will have to maximise the impact of this short-shrifted finance deal to de-risk investments through mechanisms like guarantees and affordable currency hedging facilities to maximise private capital participation. New measures could also include operationalising carbon markets, debt-for-nature swaps and multilateral financial support. In fact, countries took a major step forward on international carbon trading at COP29 that provides for country-to-country trading, UN-monitored carbon market and non-market mechanisms, referred to as Article 6. It will allow industrialised countries to buy carbon-cutting offsets from developing countries, thereby unlocking finance. Concerns exist, however, about the possibility of greenwashing of emission reduction and absence of time limits for rectifying deficiencies in disclosures. A long-term sustainable resourcing strategy is also needed for the Fund for Responding to Loss and Damage which aims to provide restitution for the damage from climate change impacts. Cumulative commitments to the Fund are about 0.25 per cent of what is needed. Developing countries must also engage in housekeeping by creating enabling environments for investors through sectoral policies that mitigate risks, appropriate taxonomies and climate-related disclosures. Furthermore, there are new and scaled-up technology solutions to mitigate climate change without which finance alone can only lead to sub-optimal solutions. The conversation must, therefore, broaden to innovations in climateTech – when a new scalable technology emerges, it changes the value chain of entire industries and progressively reduces the cost of adoption. The most visible example is the global adoption of photovoltaic cells and EVs. The transition to renewable energy is central to mitigating the effects of climate change. International investment in renewable energy has nearly tripled since the adoption of the Paris agreement in 2015. Developing countries have, however, received only a fifth of global clean energy investments. Nevertheless, the share of renewable energy in global electricity production is rising, with India at the forefront. While natural energy sources are abundant, they are not evenly distributed worldwide. This highlights the importance of cross-border trade in renewable energy. The transmission of renewable power across borders can help address supply-demand mismatches. Storage solutions can contribute to security of energy supply along with better grid utilisation and new trade opportunities through meeting nations’ decarbonisation commitments. Trading in renewable energy will also reduce the overall cost of the global energy transition. Multilateral agencies such as the World Trade Organisation and the World Meteorological Organisation have a crucial role to play. For India, the November releases of estimates of real gross domestic product (GDP) / gross value added (GVA) for the second quarter of 2024-25 and headline consumer price inflation have confirmed apprehensions in the November issue of the State of the Economy, reprising the dilemma of a slowing growth-high inflation conundrum. As presciently pointed out, from the expenditure side, the major factor contributing to the decline in the growth rate of the economy is fixed capital formation. From the production side, the main concern is manufacturing.5 Undermining both is inflation. The erosion of purchasing power due to repeated inflation shocks and persisting price pressures is starkly reflected in weakening sales growth of listed non-financial non-government corporations. Their outlook on demand conditions also remains subdued as no let-up in the incidence of price shocks seems to be in sight; they will increasingly be inclined to pass on input costs to selling prices. Consequently, there is no robust capacity creation by investing in fixed assets. Instead, corporations are churning and utilising existing capacity to meet the inflation-dented consumer demand. The result is lacklustre private investment. The slowdown in consumer demand seems to be associated with slower corporate wage growth. Another headwind that is emerging is the slowing rate of nominal GDP, which could hinder fiscal spending, including on capex, to achieve budgetary deficit and debt targets. As we pointed out in November, if inflation is allowed to run unchecked, it can undermine the prospects of the real economy, especially industry and exports. The time to act is now to excoriate inflation and revive investment strongly, especially as the usual winter easing of food price is setting in and the prospects of private consumption and exports accelerating are getting brighter. The prospects for agriculture and hence rural consumption are certainly looking up, with a large part of the kharif harvest likely to show up in the estimates of GDP for the third quarter and brisk expansion of rabi sowing ahead of the warmer than normal winter predicted by the India Meteorological Department (IMD). An increasing number of states are opening up and facilitating trade of agricultural commodities on the eNAM platform. The spurt in inter-mandi and inter-state trading on the platform is enabling better price discovery for farmers. Services activity remains resilient; hotels, in particular, are seeing month-on-month (m-o-m) recovery and as foreign tourists arrive, they expect a full recovery this financial year. On the consumption front, FMCG companies attributing the muted demand to urban sluggishness on concerns about food inflation believe that the slowdown has bottomed out and stabilising as it awaits an upward spiral. Hence, they are looking to boost partnerships with quick commerce platforms to revive their biggest distribution channel, namely general trade, in combination with support in the form of low inventory and better servicing. Meanwhile, they are also flagging fund raising by quick commerce companies for deep discounting and predatory pricing. Overall, Indian consumers are increasingly preferring quick commerce platforms for daily essentials but continue to opt for in-store shopping for high value purchases. Black Friday, imported from the US spanning November 29 - December 1, gained popularity this year, with premium brands taking centre-stage in promoting sales. Positives for consumption are also reflected in reports highlighting a pick-up in new hiring, likely being driven by sectors such as logistics, EVs and EV infrastructure, agriculture and agrochemicals, and e-commerce.6 A geographical shift in the job market appears to be underway. Cities like Coimbatore and Gurgaon are becoming job hubs, representing a decentralisation of employment opportunities beyond the metros. Contractual staffing or temporary hiring is witnessing significant growth, including among IT professionals.7 The gig economy is expected to add 90 million jobs in 2024.8 Global capability centres are rapidly creating high-skill jobs in technology and research and development. The Semiconductor Mission seeks to add 80,000 jobs by 2025 through an investment of ₹1.25 lakh crore. Domestic financial markets shrugged off the backwash effects of US elections in late November and early December, although a surge in the US dollar and persisting inflation led to hardening of US bond yields. Domestic equities registered best single-day jump in more than five months on November 22. Markets, however, pared part of the gains subsequently as heightened global monetary policy uncertainty and relentless hardening of US dollar impacted sentiments across EMEs. The India volatility index (VIX) had remained range-bound, but markets will need earnings growth for longer-term support. The majority of initial public offerings (IPOs) registered modest listing returns in November amid a decline in market sentiment. However, primary market activity regained momentum in December. Fundraising via the qualified institutional placement route crossed ₹1 trillion in calendar 2024 so far, the highest in its history. Venture capital funding rose 44 per cent to US$ 9.2 billion in the first ten months of 2024.9 In the credit market, the microfinance sector saw asset quality deterioration with rising slippages in the September quarter. On the other hand, provisioning by public sector banks (PSBs) moderated for the same quarter. Private banks posted an increase in provisioning but a better performance than PSBs on the income front. Overall, higher non-interest income and improved recoveries boosted net profits. Easing rates on certificates of deposits (CDs) issued by large banks is also lowering the cost of funds raised by smaller peers. The Indian rupee has remained under pressure from the strong US dollar and foreign portfolio investors (FPIs) remaining net sellers, although they have returned to both debt and equities in December. Set against this backdrop, the remainder of the article is structured into four sections. Section II covers the rapidly evolving developments in the global economy. An assessment of domestic macroeconomic conditions is set out in Section III. Section IV encapsulates financial conditions in India, while the last Section sets out concluding remarks. II. Global Setting In its December 2024 Economic Outlook, the Organization for Economic Co-operation and Development (OECD) maintained its global growth forecast at 3.2 per cent for 2024 and revised the 2025 projection up by 10 basis points (bps) to 3.3 per cent, reflecting improvements in advanced economies (AEs) like the US, the UK and emerging market economies (EMEs) such as China and India (Table II.1). Inflation is expected to moderate in G20 economies from 5.4 per cent in 2024 to 3.5 per cent in 2025 and further to 2.9 per cent in 2026. This could open up the space for monetary policy normalisation, although geopolitical risks, trade policy uncertainty, pent up fiscal and currency pressures amidst financial vulnerabilities continue to pose downside risks. Our model-based nowcast of global GDP point towards a moderation in global growth momentum in Q4:2024 (Chart II.1). The global supply chain pressures index (GSCPI) remained stable for the second consecutive month in November 2024, below its historical average (Chart II.2a). Geopolitical risks stay elevated due to ongoing tensions in the Middle East, albeit with some moderation in November 2024 (Chart II.2b). After showing some easing during September and October, shipping costs has started increasing from November (Chart II.2c). Consumer confidence improved in the US and the UK, but worsened in the Euro area10 in December 2024 (Chart II.3a). High frequency data on AEs and EMEs indicated easing of financial conditions in November (Chart II.3b). The global composite purchasing managers’ index (PMI) rose to a three-month high in November, recording growth for the thirteenth consecutive month. The acceleration was largely driven by the services sector, which remained in the expansion zone for the twenty-second consecutive month in November. In particular, consumer services activity expanded further, compensating for the comparatively lacklustre performance of manufacturing. The global manufacturing PMI, increased sequentially to the neutral mark of 50 in November after four months of contraction (Chart II.4).
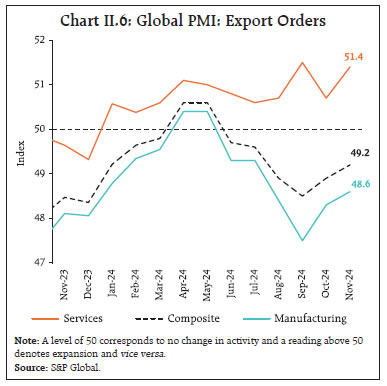
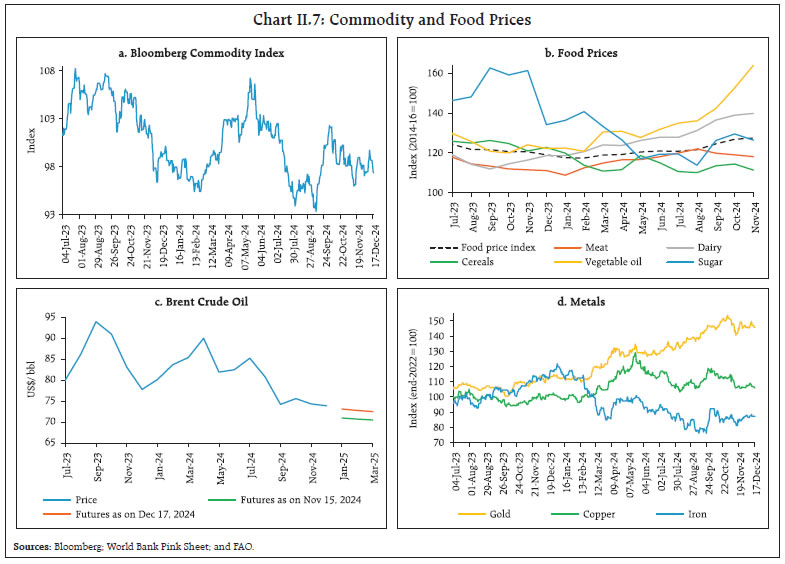
Across regions, emerging economies led by India continued to exhibit robust expansion whereas AEs such as Germany and France recorded contraction (Chart II.5). The composite PMI for export orders remained in contractionary zone since June 2024 as weak manufacturing exports continued to offset the growth in the services orders. In November, however, export orders in both manufacturing and services sectors recorded sequential increase (Chart II.6). 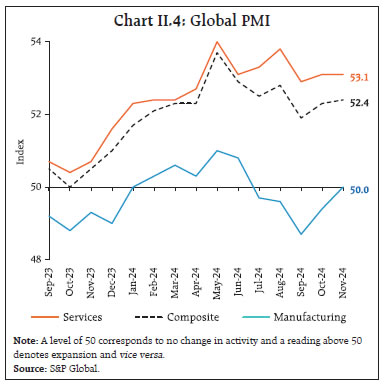 Global commodity prices recorded divergent movements in November as gains in energy and agricultural commodity prices were offset by the decline in metal prices. The Bloomberg commodity index remained volatile in November, with a decline in the first fortnight offset by an increase during the second (Chart II.7a). The Food and Agriculture Organization’s (FAO) food price index edged up by 0.5 per cent (m-o-m) in November, primarily driven by increase in the prices of vegetable oil (7.5 per cent) and dairy, partially offset by decreases in the prices of cereals, sugar and meat (Chart II.7b). Gepolitical developments have kept oil prices volatile in November, with the ceasefire in Middle East exerting downward pressure while the risk of sanctions on Iran lent support. Overall, brent crude oil prices increased by 1.3 per cent (m-o-m) in November amidst speculation of OPEC plus continuing with its supply cuts into the first quarter of 2025 (Chart II.7c). Metal prices declined in November as the outlook remained uncertain for China, the world’s largest consumer of base metals. Gold prices declined in the first half of November as a stronger US dollar increased opportunity cost for investors and partial de-escalation of tensions in the Middle East reduced safe haven demand. Prices, however, recovered in the latter half of November and early December tracking expectations of policy easing by the US Fed (Chart II.7d). 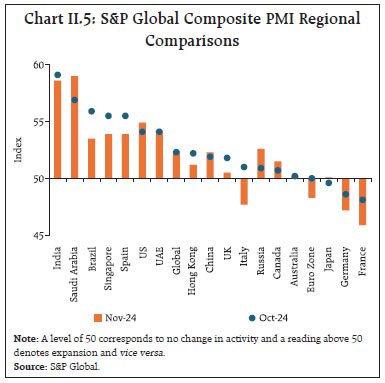
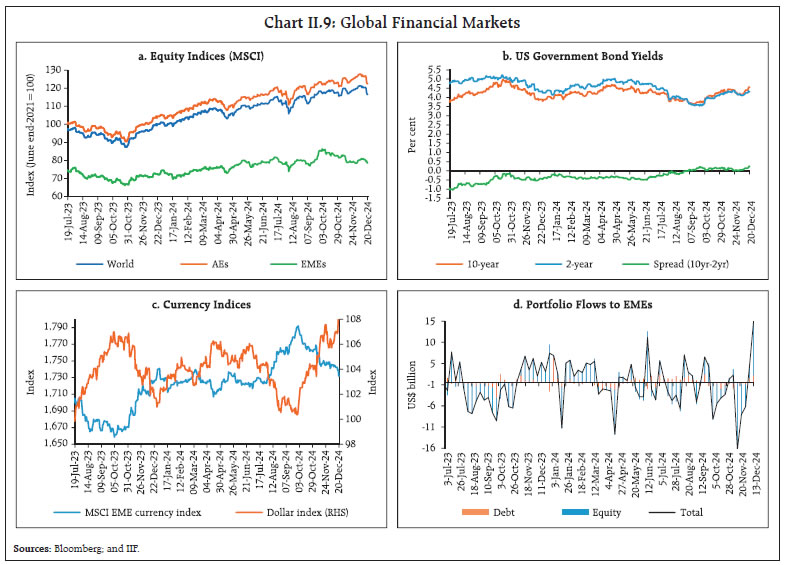
 Headline inflation continues to hover close to targets but remains above them for some major economies, amidst persistent services sector inflation. In the US, consumer price index (CPI) inflation increased to 2.7 per cent (y-o-y) in November from 2.6 per cent in October. Inflation, in terms of the personal consumption expenditure (PCE) deflator also increased to 2.4 per cent in November from 2.3 per cent in October. Headline inflation edged up in the Euro area to 2.2 per cent in November from 2.0 per cent in October and in the UK to 2.6 per cent in November from 2.3 per cent in October. Inflation in Japan (CPI excluding fresh food) increased to 2.9 per cent in November (Chart II.8a). Among EMEs, inflation increased in Brazil, Russia and South Africa, but softened in China in November (Chart II.8b). Core and services inflation remained higher than the headline in most AEs (Chart II.8c and 8d). The Morgan Stanley Capital International (MSCI) world index recorded a 3.6 per cent (m-o-m) increase in November as equity markets in AEs, particularly in the US, recorded robust upswings, tracking expectations of tax cuts as well as incoming data which pointed to resilient economic activity (Chart II.9a). The MSCI Emerging Markets Index, however, declined by 3.7 per cent in November, as speculations over tariff increases gained traction. In December so far, MSCI world recorded declines after central banks in AEs signalled greater caution in their rate cuts going forward with the slowing down of the pace of disinflation. The US government securities yields for both 10-year and 2-year bonds softened by 12 bps and 2 bps, respectively, in November (Chart II.9b). Yields, however, hardened in December and the US 10-year treasury yield reached the highest level since May 2024, along with a steepening of the yield curve, as summary of economic projections of the FOMC indicated a slower than anticipated pace of interest rate reductions in 2025. The US dollar strengthened by 1.7 per cent (m-o-m) in November over resilient US GDP data and US election results. This upsurge continued in December as Fed’s dot plot underscored through their median projection, a stronger than expected US economy with higher than previously anticipated inflation and policy rates by end of 2025. Concomitantly, the MSCI currency index for EMEs decreased by around 1 per cent in November and December each, mainly due to capital outflows in the equity segment (Chart II.9c and II.9d). 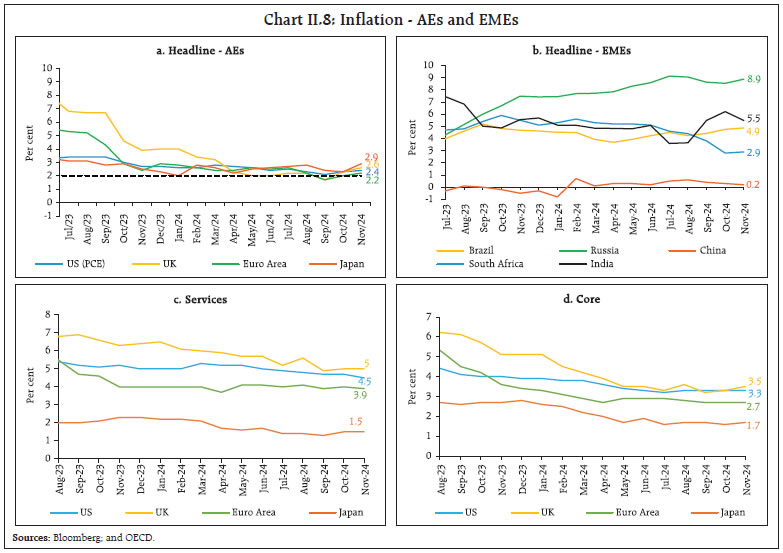
 Among AE central banks, the US Federal Reserve decided to lower the target range for the federal funds rate by 25 bps to 4.25-4.50 per cent on December 18, 2024 and indicated that the extent and timing of further adjustments to the target range for the federal funds rate will be based on a careful assessment of the incoming data, the evolving outlook, and the balance of risks. ECB cut their policy rate in December by 25 bps and Canada and Switzerland reduced their benchmark rates by 50 bps each whereas the UK, Japan and Australia kept their policy rates unchanged (Chart II.10a). South Korea and Czech Republic had lowered their policy rate by 25 bps in November. Among EME central banks, South Africa reduced its policy rates by 25 bps in November and Chile lowered its benchmark rate by 25 bps in December. Brazil, on the other hand, hiked its rate by 100 bps in its latest meeting (Chart II.10b). III. Domestic Developments High frequency indicators (HFIs) for the third quarter of 2024-25 indicate that the Indian economy is recovering from a moderation in momentum witnessed in Q2, driven by strong festival activity and a sustained upswing in rural demand. Consumer confidence was boosted by higher optimism for the year ahead, breaking out of the sequential moderation in the current assessment of conditions (Chart III.1a). Supply chain pressures remained below historical average levels, with further easing in November (Chart III.1b). Based on the economic activity index11, which indicates a pick-up in momentum in November on a seasonally adjusted basis, GDP growth nowcast for Q3:2024-25 is placed at 6.8 per cent (Chart III.1c and 1d). As per the projections based on the in-house Dynamic Stochastic General Equilibrium (DSGE), real GDP growth is likely to recover to 6.8 per cent and 6.5 per cent in Q3 and Q4 of 2024-25, respectively. Growth for 2025-26 is projected at 6.7 per cent while headline CPI inflation is projected to average 3.8 per cent in 2025-26 (Table III.1 and Chart III.2). Aggregate Demand Real GDP growth moderated to a seven-quarter low of 5.4 per cent in Q2:2024-25 as against 8.1 per cent in Q2:2023-24 and 6.7 per cent in Q1:2024-25. The sequential moderation was on account of a deceleration in the domestic drivers; private consumption and fixed investment. Government final consumption expenditure, however, recovered and net exports contributed positively to growth in Q2:2024-25 (Chart III.3). Private final consumption expenditure (PFCE), the major component of aggregate demand, grew by 6.0 per cent (y-o-y) in Q2:2024-25, higher than 2.6 per cent recorded a year ago. Subsequent HFIs suggest that rural demand conditions have continued to tread upwards, while urban demand exhibited signs of recovering. Gross fixed capital formation (GFCF) registered a growth of 5.4 per cent in Q2:2024-25 lower than 11.6 per cent in Q2:2023-24 (7.5 per cent in Q1:2024-25). This moderation was also evident in coincident indicators of capital formation, including steel consumption, cement production, and production and imports of capital goods. The growth in government final consumption expenditure (GFCE) recovered to 4.4 per cent in Q2:2024-25 following a contraction in the preceding quarter. On the external front, while exports grew modestly by 2.8 per cent in Q2:2024-25, imports contracted by 2.9 per cent. With export growth exceeding that of imports, net exports contributed positively by 1.5 percentage points to GDP growth in Q2:2024-25. 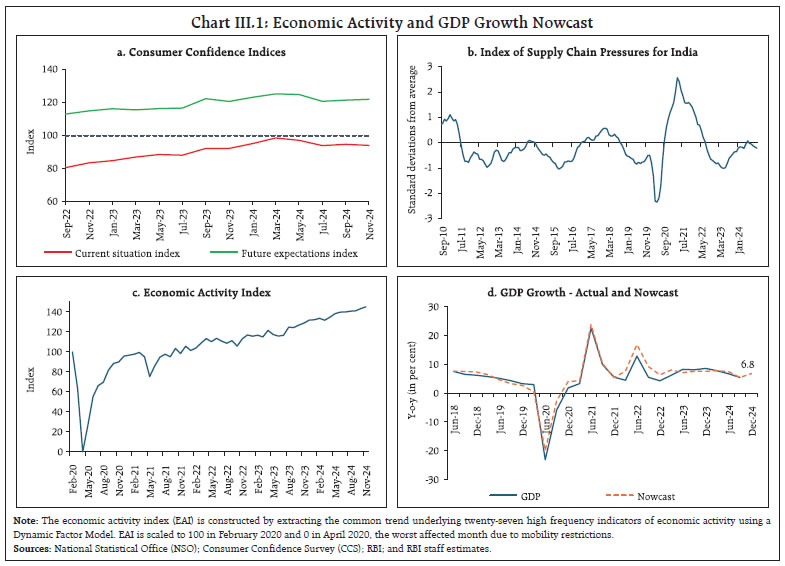
| Table III.1: Baseline Projections | | (y-o-y in per cent) | | Periods | GDP Growth | CPI Inflation | | Q3: 2024-25 | 6.8 | 5.7 | | Q4: 2024-25 | 6.5 | 4.9 | | Q1: 2025-26 | 7.4 | 4.5 | | Q2: 2025-26 | 7.3 | 3.7 | | Q3: 2025-26 | 6.0 | 3.4 | | Q4: 2025-26 | 6.0 | 3.5 | | FY 2025-26 | 6.7 | 3.8 | | Source: RBI staff estimates. | High frequency indicators suggest that aggregate demand continued to expand in October/November 2024. E-way bills increased by 16.3 per cent (y-o-y) in volume terms in November (Chart III.4a). Toll collections recorded double digit growth in November 2024, both in value and volume terms (Chart III.4b). Automobile sales contracted marginally on a y-o-y basis for the first time in 16 months, driven by the impact of a high base a year ago (26.5 per cent y-o-y growth in November 2023) [Chart III.5a]. Scooter sales expanded y-o-y, while the sales of other two-wheelers, three-wheelers and tractors recorded a marginal contraction (Chart III.5b). Vehicle registrations continued to grow in double digits (y-o-y) in November 2024 with a m-o-m pick up in registration of non-transport vehicles (Chart III.5c). India’s fuel consumption surged in November 2024, driven by farm harvesting, increasing rural activity and robust air travel (Chart III.5d). 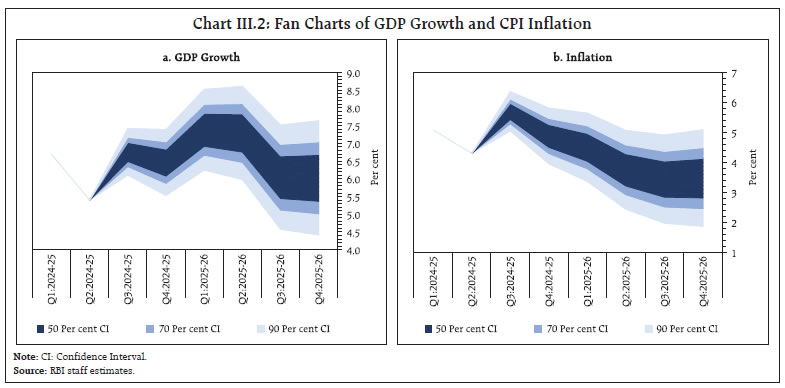 On the renewable energy front, India has made significant progress in recent years led by the addition of installed capacity of solar, wind and hydro (Chart III.6). Substantial progress has been made under the PM Surya Ghar Muft Bijli Yojana (PMSGMBY) with 6.3 lakh installations completed within 9 months of launch of PMSGMBY in February 2024.12 By November 2024, over ₹3,100 crore was also disbursed to more than four lakh consumers as subsidy under the scheme. Installations under the scheme are expected to exceed 10 lakhs by March 2025 paving the way for a sustainable future in rooftop solar energy.
In November 2024, India’s renewable energy capacity reached 205.5 GW and total non-fossil energy capacity stood at 213.7 GW, accounting for more than 46 per cent of the country’s total installed capacity. State-wise, Rajasthan, Gujarat, Tamil Nadu and Karnataka together contributed to around 50 per cent of total renewable capacity in the country (Chart III.7). India ranked 10th globally13 and second among G-20 nations in climate action, as per the Climate Change Performance Index (CCPI) 2025, released on November 20, 2024. India continued to be among the top 10 performers since 2020 driven mainly by impressive performances in the areas on climate policy, GHG emissions, and energy use components (Chart III.8). CCPI 2025 also highlighted that India has maintained low GHG emissions per capita and in recent decades, the growth in per capita emissions has been lower than the growth in per capita GDP (Chart III.9).
Employment in the organised manufacturing sector witnessed an expansion for the ninth consecutive month as per the PMI. The rate of job creation in the services sector expanded at the fastest pace since the survey’s inception14 (Chart III.10). The demand for work under the Mahatma Gandhi National Rural Employment Guarantee Act (MGNREGA) rose by 8.2 per cent m-o-m and 3.9 per cent y-o-y in November 2024 as a significant part of rabi sowing was completed. The total number of households demanding work under MGNREGA during the current year so far (Apr-Nov) in most months remained lower in comparison to post-pandemic years (Chart III.11).
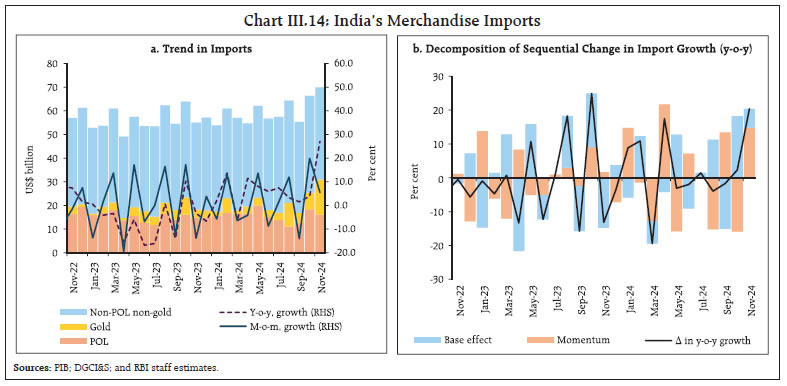
India’s merchandise exports at US$ 32.1 billion contracted by 4.8 per cent (y-o-y) in November 2024, driven by both a negative momentum and an unfavourable base effect (Chart III.12). Exports of 9 out of 30 major commodities (accounting for 38 per cent of export basket) contracted on y-o-y basis in November. Petroleum products, gems and jewellery, iron ore, organic and inorganic chemicals, and oil meals contributed negatively to export growth in the month, while electronic goods, engineering goods, rice, marine products, and ready-made garments (RMG) of all textiles were the top drivers of export growth (Chart III.13). During April-November 2024, India’s merchandise exports expanded by 2.2 per cent to US$ 284.3 billion, primarily led by engineering goods, electronic goods, drugs and pharmaceuticals, organic and inorganic chemicals, and RMG of all textiles, while petroleum products, gems and jewellery, iron ore, ceramic products and glassware, and other cereals dragged exports down. Exports to 9 out of 20 major destinations contracted in November. During April-November 2024, exports to 12 out of 20 major destinations witnessed an expansion, with the US, the UAE and the Netherlands being the top three export destinations. Merchandise imports expanded for the eighth consecutive month in November and reached an all-time high of US$ 70.0 billion, with a growth of 27.0 per cent (y-o-y), on account of a positive momentum, reinforced by base effect (Chart III.14). Out of 30 major commodities, 23 commodities (accounting for 76.0 per cent of import basket) registered an expansion on a y-o-y basis. 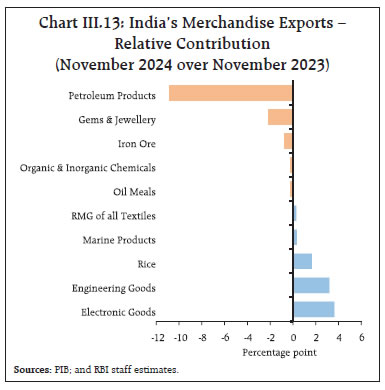
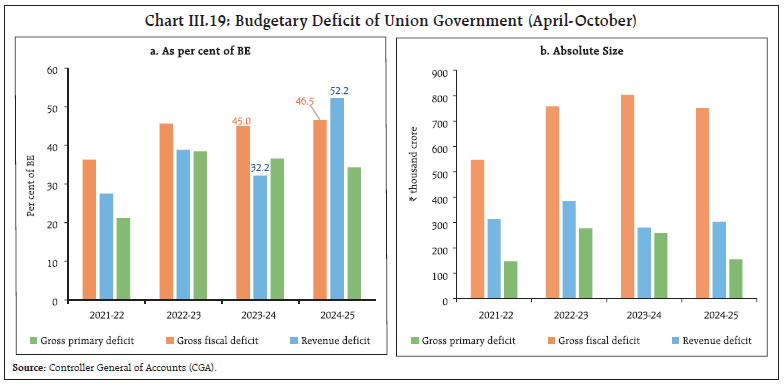
 Gold, POL, electronic goods, vegetable oil, and machinery contributed positively, while coal, coke and briquettes, iron and steel, transport equipment, leather and its products, and pearl, precious and semi-precious stones contributed negatively to import growth (Chart III.15). During April-November 2024, India’s merchandise imports at US$ 486.7 billion increased by 8.4 per cent (y-o-y), led by gold, POL, electronic goods, non-ferrous metals, and machinery, while coal, coke and briquettes, pearls, precious and semi-precious stones, chemical material and products, fertilisers, and dyeing, tanning and colouring materials contributed negatively. Imports from 13 out of 20 major source countries expanded in November and during April-November 2024. Imports from major source countries, viz., China, the UAE, and Russia, witnessed robust growth. The merchandise trade deficit widened to an all-time high of US$ 37.8 billion in November 2024. Oil deficit rose to US$ 12.4 billion in November from US$ 7.5 billion a year ago. The share of oil deficit in trade deficit, however, fell to 32.8 per cent in November from 35.4 per cent a year ago. Non-oil deficit widened to US$ 25.4 billion in November from US$ 13.8 billion a year ago (Chart III.16). During April-November 2024, India’s merchandise trade deficit widened to US$ 202.4 billion from US$ 171.0 billion a year ago. Petroleum products were the largest source of the deficit, followed by gold (Chart III.17). During October 2024, services exports at US$ 34.3 billion witnessed a robust growth of 22.3 per cent (y-o-y) while services imports rose by 27.9 per cent (y-o-y) to US$ 17.2 billion (Chart III.18). Net services export earnings increased by 17.2 per cent (y-o-y) to an all-time high of US$ 17.1 billion during the month. The gross fiscal deficit (GFD) and the revenue deficit (RD) of the Union Government [as per cent of budget estimate (BE)] witnessed an increase in April-October 2024 in comparison with the corresponding period of the previous year (Chart III.19). The increase in the budgetary deficits were primarily driven by revenue expenditure, which grew by 8.7 per cent as against 6.5 per cent a year ago. Total receipts, on the other hand, recorded a growth of 8.3 per cent, lower than 14.8 per cent during the same period a year ago. 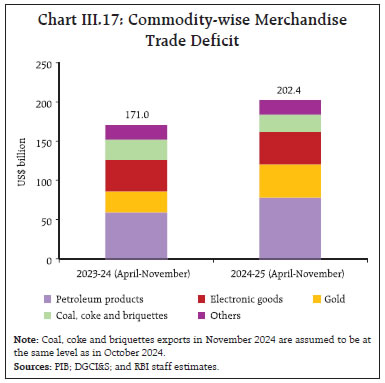 The increase in revenue expenditure was driven by outgo on major subsidies which recorded a growth of 7.3 per cent in April-October 2024 on account of food and petroleum subsidies. Capital expenditure, however, witnessed a deceleration in growth. The top six ministries, which together account for over 95 per cent of the budgeted capital expenditure for 2024-25, witnessed a decline in their capital spending during April-October 2024-25 in comparison with the corresponding period of the previous year (Chart III.20). The rise in the revenue expenditure supported the growth of total expenditure by 3.3 per cent during April-October 2024. 
 On the receipts side, the revenue receipts of the Union government registered a y-o-y growth of 8.7 per cent vis-à-vis 16.1 per cent growth in the corresponding period of the previous year. Direct taxes increased by 11.9 per cent (y-o-y), owing to a 20.2 per cent growth in income tax. Corporate tax collections, however, remained lacklustre. Indirect taxes recorded a growth of 9.5 per cent, with GST and customs revenues recording a growth of 12.0 per cent and 6.2 per cent, respectively (Chart III.21a). Similarly, non-tax revenue collection recorded a y-o-y growth of 50.2 per cent, on the back of surplus transfer of ₹2.11 lakh crore from the Reserve Bank (Chart III.21b). Despite a 10.8 per cent y-o-y growth in gross tax revenue, net tax revenue increased only by 0.2 per cent during the period, attributable to higher assignment to States by the Centre. Overall, net tax revenue during April-October 2024-25 was at 50.5 per cent of the BE. 
 GST collections (Centre plus States) stood at ₹1.82 lakh crore in November 2024, taking the cumulative GST collection for April-November 2024 to ₹14.57 lakh crore (9.3 per cent higher than during April-November 2023) [Chart III.22]. During April-October 2024-25, States’ gross fiscal deficit (GFD), at 54.4 per cent of the budget estimates15, was higher than last year’s level (Chart III.23). While States’ revenue receipts increased driven by higher tax revenues, non-tax revenue and grants recorded contraction (Chart III.24a). Within States’ own tax revenues, sales tax/VAT collections recovered from the contraction witnessed during the corresponding period a year ago whereas growth in States’ goods and services tax (SGST) and State excise moderated. 
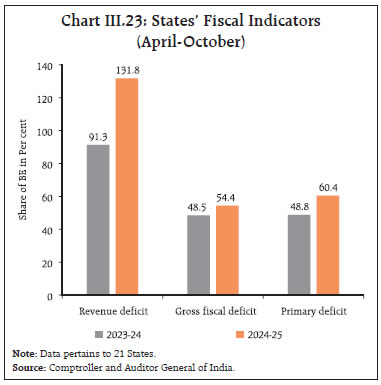 On the expenditure side, growth in revenue expenditure picked up during April-October 2024, while capital expenditure remained lower than last year’s level (Chart III.24b). Going forward, capital expenditure is expected to pick up owing partly to the Centre’s provision of special assistance of ₹1.5 lakh crore long term interest free loans. During 2024-25 so far (up to November 24, 2024), capital expenditure amounting to ₹50,571.4 crore has been released to the eligible States under the said scheme.16 Aggregate Supply Aggregate supply – measured by gross value added (GVA) at basic prices – grew by 5.6 per cent in Q2:2024-25 as compared with 7.7 per cent a year ago (6.8 per cent in Q1:2024-25). The deceleration in growth was largely on account of subdued industrial activity, while the services sector exhibited resilience and agriculture recorded an improvement (Chart III.25). 
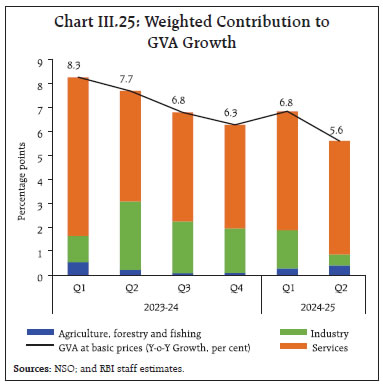 The growth in agriculture, forestry and fishing improved to 3.5 per cent in Q2:2024-25 from 1.7 per cent a year ago, driven by an increase in kharif foodgrains production in 2024-2517 which was supported by above normal southwest monsoon. Industrial activity recorded a modest growth of 2.1 per cent in Q2:2024-25 on an unfavourable base of 13.6 per cent in the corresponding quarter of the previous year. Within the industrial sector, mining and quarrying activity contracted due to heavy rainfall, while the growth in manufacturing – the dominant component – slackened to a five-quarter low of 2.2 per cent. The growth in electricity, gas, water supply and other utility services also moderated. The services sector remained resilient, growing by 7.1 per cent in Q2:2024-25 as compared with a growth of 6.9 per cent in Q2:2023-24 (7.7 per cent in Q1:2024-25). Growth in construction activity softened to 7.7 per cent in Q2:2024-25 from 13.6 per cent in Q2:2023-24 partly reflecting lower than anticipated capital expenditure by both the Union and State governments. Trade, hotels, transport, communication and services related to broadcasting recorded an acceleration in growth on both y-o-y and sequential bases. The growth in financial, real estate and professional services moderated to 6.7 per cent in Q2:2024-25 as credit and deposits growth witnessed a moderation. The performance of information technology (IT) companies, however, improved over the preceding quarter. Public administration, defense, and other services (PADO) expanded on a y-o-y basis by 9.2 per cent in Q2:2024-25. The cumulative Northeast monsoon (NEM) rainfall during October 01- December 19 was 8 per cent below its long period average (LPA), as compared with 4 per cent below LPA last year. The unusually long span of cyclone Fengal intensified the rainfall activity in southern India, closing some part of the deficit this year. The number of sub-divisions receiving deficient/large deficient rainfall, however, was higher in 2024 than a year ago (Chart III.26a). The all-India average water storage (based on 155 major reservoirs) was at 77 per cent of the total capacity as of December 19, 2024, which is 23.6 per cent and 17.9 per cent higher than last year’s storage and the decadal average, respectively (Chart III.26b). The total rabi sown area, as of December 13, 2024 was 0.4 per cent higher than the level a year ago.18 While the acreage under wheat and rice surpassed last year’s levels, it remained lower than last year for pulses, coarse cereals and oilseeds (Chart III.26c). As of December 16, 2024, the cumulative rice procurement for the kharif marketing season (KMS) 2024-25 was 4.2 per cent higher over the corresponding period of the previous year (Chart III.27). The buffer stock of rice at 515.6 lakh tonnes19 stood 5.0 times the norm as on December 01, 2024. The wheat stock stood at 206 lakh tonnes, almost equal to the buffer norm.
On November 28, 2024, the Government of India announced the sale of 2.5 million tonne of wheat through e-auctions under Open Market Sale Scheme (OMSS) till March 2025 to augment domestic supply and alleviate price pressures.20 Further, on December 11, 2024, the Government revised down the stock limit for wheat stocking entities to ensure ample supplies in the market.21 India’s manufacturing PMI registered a sequential moderation but remained in expansionary territory during November as external demand - as reflected in increase in export orders - provided support (Chart III.28a). The services PMI continued to record robust expansion driven by strong demand and new business gains (Chart III.28b). Business expectations for both manufacturing and services remained upbeat, as evident in the future output assessment. Port traffic contracted in November 2024, driven by iron ore and petroleum, oil and, lubricants (Chart III.29). The construction sector exhibited a mixed picture; steel consumption recorded a double-digit growth (y-o-y) in November whereas cement production growth decelerated in October (Chart III.30).
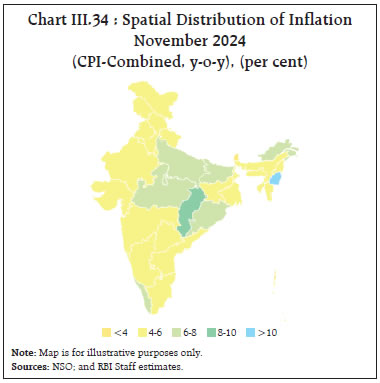
Available high frequency indicators for the services sector reflect resilient economic activity in October/November (Table III.2). Inflation Headline inflation, as measured by y-o-y changes in the all-India consumer price index (CPI)22, fell to 5.5 per cent in November 2024 from 6.2 per cent in October 2024 (Chart III.31). The decline in inflation by around 70 basis points (bps) was both on account of a month-over-month (m-o-m) decline in prices by about 15 bps and a favourable base effect of about 55 bps. CPI food and CPI fuel groups recorded a negative momentum of around (-) 50 bps and (-) 10 bps, respectively, during the month while CPI core (excluding food and fuel) group recorded a positive momentum of approximately 20 bps. Food inflation declined to 8.2 per cent in November from 9.7 per cent in October. In terms of sub-groups, significant moderation in inflation was observed in vegetables, pulses and their products, fruits, and sugar, whereas inflation in edible oils and fats, meat and fish, and prepared meals picked up. Inflation in cereals and non-alcoholic beverages group remained steady, while deflation in prices of spices deepened (Chart III.32). Fuel and light deflation deepened to (-) 1.8 per cent in November from (-) 1.7 per cent in October, on account of a higher rate of deflation in kerosene and LPG, and a lower rate of inflation in electricity. Core inflation eased to 3.7 per cent in November 2024 from 3.8 per cent in October. Among the sub-groups, moderation in inflation was observed in transport and communication, personal care and effects, and pan, tobacco and intoxicants while inflation remained steady for health, education, and clothing and footwear. Housing, recreation and amusement, and household goods and services, however, registered an increase in inflation (Chart III.33). In terms of regional distribution, inflation moderated in both rural and urban areas in November, with rural inflation at 6.0 per cent being higher than urban inflation at 4.8 per cent. Majority of states experienced inflation between 4 to 6 per cent (Chart III.34). High frequency food price data for December so far (up to 19th) showed a fall in rice prices, while wheat and atta prices continued to firm up. Edible oil prices, too, continued exhibiting upside pressures. Pulses prices, however, registered a broad-based decline. Among key vegetables, onion and tomato prices fell, while potato prices remained range bound (Chart III.35).
Retail selling prices of petrol, diesel, and kerosene remained unchanged in December thus far (up to 19th). LPG prices were also kept unchanged during this period (Table III.2). As per the PMIs, input costs across both manufacturing and services firms increased at a faster rate in November, with input cost in services recording the largest expansion in fifteen months. Selling price pressures also increased sharply across manufacturing and services firms, with manufacturing firms recording the highest rate in the last eleven years, and services firms recording the fastest pace of output price increase in around twelve years (Chart III.36). 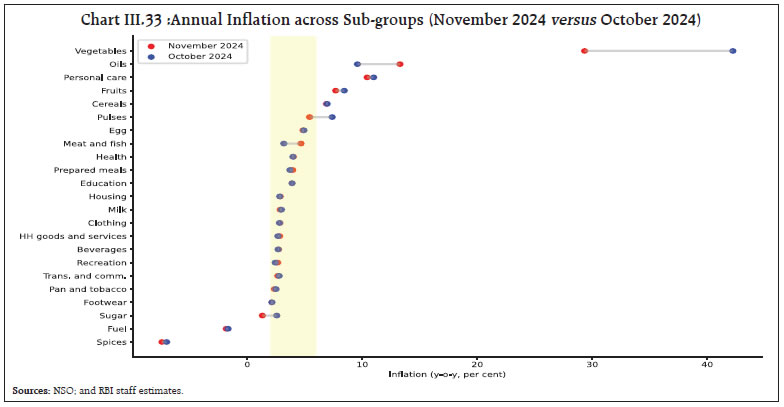
| Table III.2: Petroleum Products Prices | | Item | Unit | Domestic Prices | Month-over-month (per cent) | | Dec- 23 | Nov- 24 | Dec- 24^ | Nov- 24 | Dec- 24^ | | Petrol | ₹/litre | 102.92 | 100.99 | 101.02 | 0.0 | 0.0 | | Diesel | ₹/litre | 92.72 | 90.45 | 90.48 | 0.0 | 0.0 | | Kerosene (subsidised) | ₹/litre | 52.09 | 43.95 | 43.95 | 2.4 | 0.0 | | LPG (non-subsidised) | ₹/cylinder | 913.25 | 813.25 | 813.25 | 0.0 | 0.0 | Notes: 1. ^: For the period December 1-19, 2024.
2. Other than kerosene, prices represent the average Indian Oil Corporation Limited (IOCL) prices in four major metros (Delhi, Kolkata, Mumbai and Chennai). For kerosene, prices denote the average of the subsidised prices in Kolkata, Mumbai and Chennai.
Sources: IOCL; Petroleum Planning and Analysis Cell (PPAC); and RBI staff estimates. |
Households’ perception of current inflation increased by 30 basis points (bps) in November 2024 from its September level. Their one-year ahead inflation expectations rose 10 bps even as three-month ahead expectations fell by 10 bps (Chart III.37). The all-India housing price index (HPI), based on property registration data from 10 major cities, increased by 4.3 per cent (y-o-y) in Q2:2024-25 as compared to 3.3 per cent in the previous quarter and 3.5 per cent a year ago (Chart III.38). IV. Financial Conditions System liquidity moderated in the second half of November 2024 with the build-up in government cash balances on account of goods and services tax (GST) collections, an increase in currency in circulation and capital outflows. It turned into a deficit during the last week of November before easing in early December on the back of higher government spending. System liquidity again turned into deficit during December 16-19, 2024 on account of advance tax payments. On an average, however, system liquidity remained in surplus during the second half of November and early December, with the average daily net absorption under the liquidity adjustment facility (LAF) moderating to ₹0.39 lakh crore during November 16 to December 19, 2024 from ₹1.72 lakh crore during October 16 to November 15, 2024 (Chart IV.1). The Reserve Bank conducted two way operations in response to the dynamically evolving liquidity conditions. During the second half of November, one main and three fine-tuning variable rate reverse repo (VRRR) operations were conducted, cumulatively absorbing ₹0.99 lakh crore from the banking system. To alleviate temporary liquidity tightness because of large GST outflows, however, four fine-tuning variable rate repo (VRR) operations of 1-6 days maturity were conducted during November 22-28, 2024, cumulatively injecting ₹1.0 lakh crore into the banking system. Further, in view of liquidity tightness due to advance tax payments, the Reserve Bank conducted one main and six fine-tunning VRR operations during December 09-20, 2024, cumulatively injecting ₹4.4 lakh crore in to the banking system Even as system liquidity remained adequate during July-November, it was likely to tighten in the ensuing months due to tax outflows, increase in currency in circulation and volatility in capital flows. In order to alleviate the potential liquidity stress, the cash reserve ratio (CRR) of all banks was reduced in two equal tranches of 25 bps each to 4.0 per cent of net demand and time liabilities (NDTL) with effect from the fortnights beginning December 14, 2024 and December 28, 2024, thus releasing primary liquidity of about ₹1.16 lakh crore cumulatively to the banking system. Of the average total absorption of ₹0.92 lakh crore during November 16 to December 19, 2024, placement of funds under the standing deposit facility (SDF) accounted for about 88 per cent. Average recourse to the marginal standing facility (MSF) remained low at ₹0.08 lakh crore during November 16 to December 19, 2024. 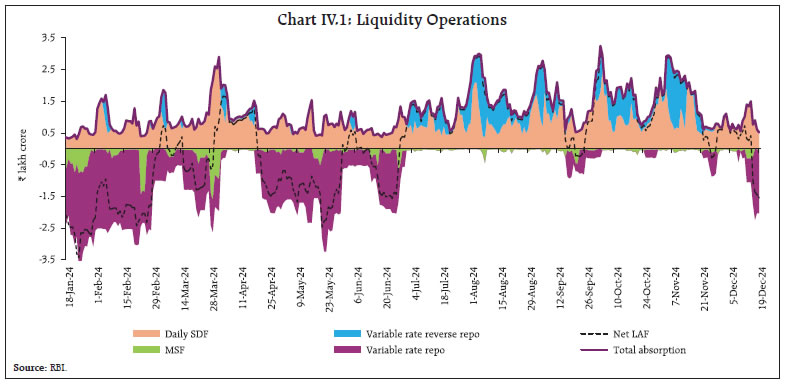 In the overnight money market, the weighted average call rate (WACR) remained within the LAF corridor, averaging 6.62 per cent during November 16 to December 19, 2024, up from 6.48 per cent during October 16 to November 15, 2024 (Chart IV.2a). The WACR firmed up for a brief period during November 22-29 and December 10-19, although it remained within the policy corridor. In the collateralised segment, both the tri-party repo and the market repo rates averaged 6 basis points (bps) and 5 bps, respectively, above the policy repo rate during November 16 to December 19, 2024 (Chart IV.2b). In the secondary market, the spread of 3-month CP (NBFC) and CD rates over the 91-day T-bill rate stood at 109 bps and 77 bps, respectively, during December 2024 (up to December 19) - higher than 104 bps and 44 bps a year ago (Chart IV.2c). Although the spreads tend to ease during periods of surplus liquidity, they have increased in recent months, mainly due to a decline in 91-day T-bill rates, barring the second half of December. In the short-term money market segment, yields on 3-month treasury bills (T-bills) and 3-month commercial paper (CP) issued by non-banking financial companies (NBFCs) moderated marginally during November 16 - December 19 from the previous month. Rates on 3-month certificates of deposit (CDs) remained rangebound during this period (Chart IV.2b). The average risk premium in the money market (spread between 3-month CP and 91-day T-bill rates) declined by 3 bps.
The weighted average discount rate (WADR) of CPs stood at 7.43 per cent in December 2024 (up to December 19), lower than 7.89 per cent during the corresponding period of the previous year, on expectations of lower interest rates going forward (Chart IV.3). Also, the weighted average effective interest rate (WAEIR) of CDs softened to 7.36 per cent (up to December 19, 2024) from 7.52 per cent a year ago as the gap between credit and deposit growth narrowed. In the primary market, CD issuances grew by 68 per cent (y-o-y) to ₹6.88 lakh crore during April-November 2024, significantly higher than ₹4.09 lakh crore in the corresponding period of the previous year, reflecting banks’ funding requirements (Chart IV.4). CP issuances stood at ₹9.85 lakh crore during 2024-25 (up to November), higher than ₹8.85 lakh crore in the corresponding period of the previous year. With the Reserve Bank increasing the risk weight on bank loans to NBFCs in November 2023, these entities have been relying on alternative market instruments to mobilise resources. 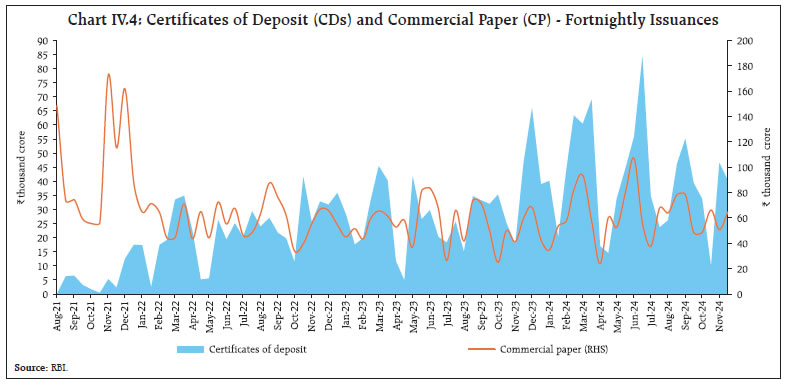 The 10-year G-sec yield remained relatively stable during the second half of November even as US treasury yields hardened. The benchmark yield softened to its lowest level in almost three years on December 4, 2024 on expectations of monetary policy easing by the Reserve Bank in the backdrop of a sharper-than-expected slowdown in GDP growth in Q2:2024-25 (Chart IV.5a). The G-sec yield curve shifted downward along the mid segment of the term structure. During November 16 – December 19, the average term spread (10-year minus 91-day T-bills) remained stable at 36 bps (Chart IV.5b). The spread of the 10-year Indian G-sec yield over the 10-year US bond fell to 222 bps as on December 19, 2024 from 310 bps in mid-September and 324 bps a year ago. Domestic bond yields fell sharply after November 29, 2024 reaching a three year low in early December. FPI flows to domestic debt instruments turned positive in December 2024 after outflows in October and November. The volatility of yields in the Indian bond market remains low relative to US treasuries (Chart IV.6). Corporate bond issuances have picked up pace in recent months as corporates took advantage of lower yields to diversify funding sources. Overall, corporate bond issuances during 2024-25 (up to November) were higher at ₹6.06 lakh crore as compared with ₹4.99 lakh crore during the corresponding period of the previous year. Corporate bond yields across the ratings and the tenor spectrum generally declined, while the associated risk premia generally increased during November 18 to December 18, 2024 (Table IV.1). Reserve money (RM) recorded a growth of 6.3 per cent (y-o-y) as on December 13, 2024 (6.4 per cent a year ago) [Chart IV.7]. The growth in currency in circulation (CiC), the largest component of RM, stood at 6.1 per cent (y-o-y) as on December 13, 2024 as compared with 3.9 per cent a year ago.
On the sources side (assets), RM comprises net domestic assets (NDA) and net foreign assets (NFA) of the Reserve Bank. Foreign currency assets increased by 5.2 per cent (y-o-y) as on December 13, 2024. Gold – a major component of NFA – grew by 46.2 per cent, mainly due to revaluation gains from gold prices. As a result, its share in NFA rose from 8.1 per cent as at end-October 2023 to 10.7 per cent as on December 13, 2024 (Chart IV.8). Money supply (M3) rose by 10.0 per cent (y-o-y) as on November 29, 2024 (11.2 per cent a year ago).23 Aggregate deposits with banks, accounting for around 87 per cent of M3, increased by 10.6 per cent (12.2 per cent a year ago). Scheduled commercial banks’ (SCBs’) credit growth moderated to 11.8 per cent as on November 29, 2024 (16.3 per cent a year ago) [Chart IV.9]. | Table IV.1: Financial Markets - Rates and Spread | | | Interest Rates (per cent) | Spread (basis points) | | (Over Corresponding Risk-free Rate) | | Instrument | Oct 18, 2024 – Nov 18, 2024 | Nov 18, 2024 – Dec 18, 2024 | Variation | Oct 18, 2024 – Nov 18, 2024 | Nov 18, 2024 – Dec 18, 2024 | Variation | | 1 | 2 | 3 | (4 = 3-2) | 5 | 6 | (7 = 6-5) | | Corporate Bonds | | | | | | | | (i) AAA (1-year) | 7.79 | 7.82 | 3 | 111 | 114 | 3 | | (ii) AAA (3-year) | 7.75 | 7.68 | -7 | 90 | 88 | -2 | | (iii) AAA (5-year) | 7.61 | 7.60 | -1 | 72 | 75 | 3 | | (iv) AA (3-year) | 8.50 | 8.47 | -3 | 166 | 167 | 1 | | (v) BBB- (3-year) | 12.14 | 12.12 | -2 | 530 | 533 | 3 | Note: Yields and spreads are computed as averages for the respective periods.
Sources: FIMMDA; and Bloomberg. |
Personal loans (housing and non-housing) remained the prime driver of overall credit expansion up to September 2024; credit to industry continued to register double digit growth (Chart IV.10). SCBs’ lending to the private corporate sector, which accounts for nearly a quarter of the total bank credit, decelerated during Q2:2024-25 from the high growth registered in the previous quarter (Chart IV.11). While growth in working capital loans accelerated for the second successive quarter, growth in term loans continued to decelerate (Chart IV.12).
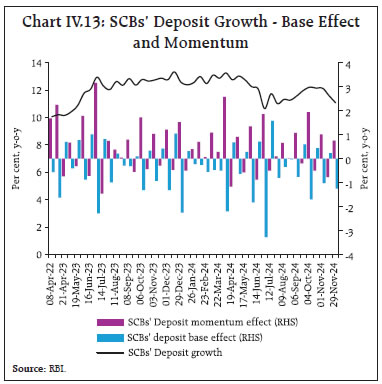
SCBs’ deposit growth (excluding the impact of the merger) moderated from 11.3 per cent at the end of August 2024 to 11.1 per cent as on November 29, 2024 (Chart IV.13). During the recent monetary policy tightening cycle, the growth in current account and savings account (CASA) deposits was outpaced by the growth in term deposits. The share of term deposits in total deposits rose further to 61.4 per cent in September 2024 from 59.8 per cent a year ago and 57.2 per cent in March 2023 (Chart IV.14). The share of term deposits bearing over 7 per cent interest rate in total term deposits increased to 68.8 per cent in September 2024 from 54.7 per cent a year ago, 33.7 per cent in March 2023 and 4.5 per cent in March 2022 (Chart IV.15). 

 SCBs’ incremental credit-deposit ratio declined from 95.8 as at end-March 2024 to 82.5 as on November 29, 2024, with incremental deposit outpacing incremental credit during August – November 2024 (till November 29) [Chart IV.16]. With the statutory requirements for CRR and SLR at 4.5 per cent and 18 per cent, respectively, around 77 per cent of deposits was available with the banking system for credit expansion as on November 29, 2024. 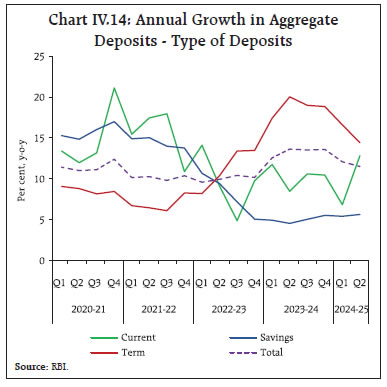 In response to the 250 bps increase in the policy repo rate since May 2022, banks have revised their repo linked external benchmark-based lending rates (EBLRs) up by a similar magnitude. The median 1-year marginal cost of funds-based lending rate (MCLR) increased by 170 bps during May 2022 to November 2024. Consequently, the weighted average lending rates (WALRs) on fresh and outstanding rupee loans increased by 203 bps and 118 bps, respectively, during May 2022 to October 2024. On the deposit side, the weighted average domestic term deposit rates (WADTDRs) on fresh and outstanding deposits increased by 241 bps and 193 bps, respectively, during the same period (Chart IV.17). 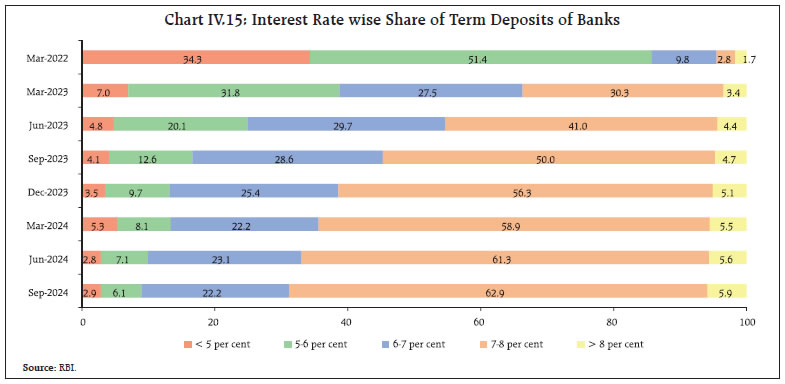
 Transmission across bank groups indicates that the increase in the WALR on fresh rupee loans was higher for public sector banks (PSBs) than for the private banks (PVBs). In the case of outstanding loans, however, the transmission among PSBs was lower. In deposits, transmission to WADTDRs of both fresh and outstanding deposits was higher for PSBs compared to PVBs during May 2022 and October 2024 (Chart IV.18). 
 Indian equity markets recorded losses in the first three weeks of November amidst weak corporate earnings, FPI sell-offs, geopolitical uncertainties, and valuation concerns. Markets, however, rebounded toward the month-end following the announcement of State election results and started off December on a strong note, driven by positive global cues. Subsequently, markets experienced a decline ahead of key monetary policy announcements, which was further exacerbated by indications by the US Fed regarding lower magnitude of interest rate cuts in 2025. Overall, the BSE Sensex gained 2.1 per cent since November 14, 2024 to close at 79,218 on December 19, 2024 (Chart IV.19). The midcap and smallcap segments continued to outperform the benchmark. 
 The ongoing volatility in equity markets, coupled with regulatory initiatives24 aimed at enhancing the functioning of primary markets, impacted sentiment in the primary equity market, as evidenced by subdued subscription levels25 and listing performance of Initial Public Offerings (IPOs) in November (Chart IV.20). Several regulatory measures aimed at strengthening the equity index derivatives framework to enhance investor protection and market stability - such as the rationalisation of weekly index derivatives products and an increase in contract sizes - came into effect in the second half of November 2024. Subsequently, there has been moderation in the average daily turnover in the equity derivatives segment (Chart IV.21). Resource mobilisation by Real Estate Investment Trusts (REITs) and Infrastructure Investment Trusts (InvITs) has been subdued in the current financial year (Chart IV.22). December marked the introduction of the first Small and Medium Real Estate Investment Trust (SM REIT).26
Alternative Investment Funds (AIFs) are gaining momentum, offering vital capital for higher-risk ventures27 (Chart IV.23a). Notably, a significant portion of investments in AIFs is being sourced from domestic investors (Chart IV.23b). Indian firms have actively raised funds from overseas markets, complementing domestic resource mobilisation. After subdued activity in the past two years, overseas fundraising has seen a modest revival in the current financial year (Chart IV.24a). In the second half of November, there was a brief uptick in yields on overseas bonds issued by a specific conglomerate (Chart IV.24b). Certain green bonds issued by other domestic corporates in overseas markets also witnessed marginal hardening of yields, but the effect was limited and it reversed quickly. 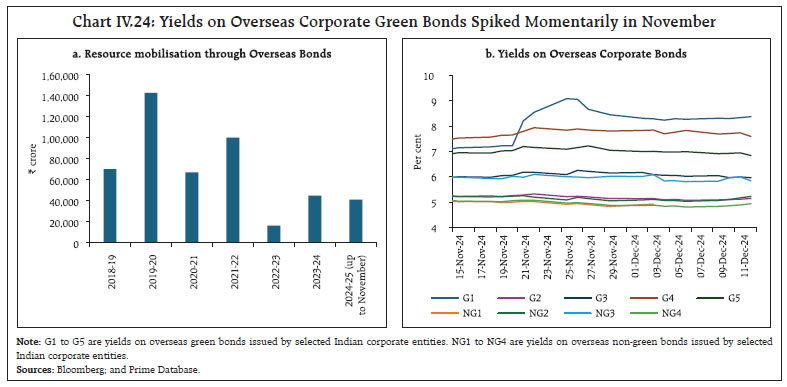
 Gross inward foreign direct investment (FDI) rose to US$ 48.6 billion during April-October 2024 from US$ 42.1 billion a year ago (Chart IV.25a). More than 60 per cent of the gross FDI inflows were directed to manufacturing, financial services, electricity and other energy, and retail and wholesale trade sectors. Major source countries included Singapore, Mauritius, the UAE, the Netherlands, and the US, contributing more than three-fourths of the flows during the period. Net FDI decelerated to US$ 2.1 billion during April-October 2024 from US$ 7.7 billion a year ago, majorly due to the rise in repatriation and net outward FDI. While repatriation rose to US$ 34.1 billion during April-October 2024 from US$ 26.4 billion a year ago, net outward FDI increased to US$ 12.4 billion from US$ 8.0 billion during the same period. A similar moderation is visible in net FDI across most peer emerging market economies (EMEs) during H1:2024 as compared to a year ago (Chart IV.25b). Foreign portfolio investors (FPIs) continued to remain net sellers in Indian financial markets in November 2024, as a rising US dollar and US yields post US elections along with high domestic stock valuations and concerns over the growth slowdown impacted sentiments. Net FPI outflows were to the tune of US$ 2.4 billion in November 2024, with net outflows of US$ 2.7 billion in equity and net inflows of US$ 0.3 billion in debt segment. However, FPI flows turned positive during December (up to December 18) with net inflows of US$ 3.6 billion (Chart IV.26a). Within sectors, oil, gas and consumable fuels, and automobile and auto components recorded the highest equity outflows while, information technology and financial services received the largest inflows during November. Rising global economic and financial uncertainties during November resulted in equity outflows from other EMEs as well (Chart IV.26b). External commercial borrowings (ECBs) disbursements as well as new loan registrations were higher during April-October 2024 in comparison to the corresponding period last year (Chart IV.27a). Adjusting for outflows on account of principal repayments, net ECB inflows during the current financial year so far were 76 per cent higher than a year ago. Over 40 per cent of ECBs registered during April-October 2024 were earmarked for capital expenditure purposes, including on-lending and sub-lending (Chart IV.27b).
The overall cost of new ECBs registered during October 2024 rose by 16 bps due to increase in the weighted average interest margin (WAIM). The overall cost of ECBs registered during April-October 2024 at 6.7 per cent remained similar to that in the corresponding period last year (Chart IV.27c). Net accretion to non-resident deposits almost doubled to US$ 11.9 billion during April-October 2024 from US$ 6.1 billion a year ago, due to higher accretion in all three accounts, namely, Non-Resident (External) Rupee Accounts [NR(E)RA], Non-Resident Ordinary (NRO) and Foreign Currency Non-Resident (Banks) [FCNR(B)] accounts. During November 2024, EME currencies faced pressures from strong FPI outflows, a strengthening US dollar, and rising US yields. Amidst these headwinds, the Indian rupee (INR) depreciated by 0.4 per cent (m-o-m) in November 2024 which was modest as compared to other major currencies. Despite heightened global uncertainties, the INR exhibited the lowest volatility among major currencies (Chart IV.28). In terms of the 40-currency real effective exchange rate (REER), the INR appreciated by 0.9 per cent (m-o-m) in November 2024 as appreciation of the INR in nominal effective terms more than offset negative relative price differentials (Chart IV.29). The foreign exchange reserves increased by US$ 6.4 billion during 2024-25 so far to US$ 652.9 billion on December 13, 2024. At the current level, it stands equivalent to more than 11 months of imports and about 96 per cent of external debt outstanding at end-June 2024 (Chart IV.30a). India’s foreign exchange reserves remained robust, as reflected in sustainable levels of reserve adequacy metrics (Chart IV.30b). Payment Systems Most modes of digital payments recorded expansion on a y-o-y basis in November 2024, albeit with a deceleration from the festival month of October (Table IV.2). Notably, the transactions using Bharat Bill Payment System (BBPS) and the Unified Payments Interface (UPI) registered robust growth. The National Electronic Toll Collection (NETC) system, displayed higher growth (y-o-y) both in volume and value terms in November. During 2024-25 so far (up to October 2024), the issuance of new cards has increased, primarily driven by debit cards. Both the volume and value of credit and debit card transactions sustained momentum in October 2024 due to the festive season (Chart IV.31). 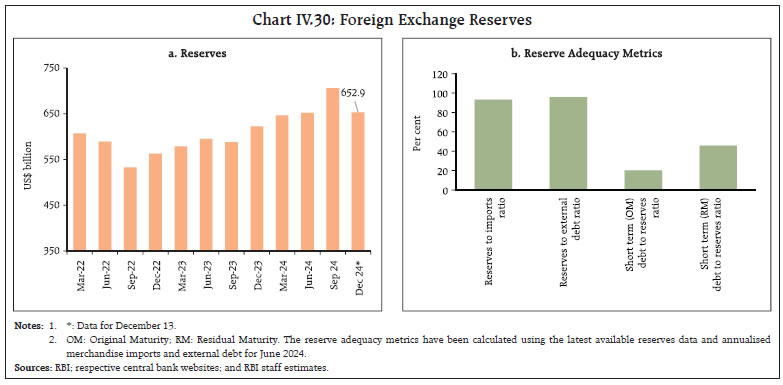
 The National Payments Corporation of India (NPCI) has introduced several new features, including the Bharat Interface for Money (BHIM) app’s new National Pension System (NPS) contribution facility, which promotes financial inclusion and simplifies retirement planning with fast processing and easy access.28 Additionally, a new product type for Aadhaar Payment Bridge (APB) and Automated Clearing House (ACH) transactions has been implemented to streamline the processing of direct benefit transfers, effective November 23, 2024, with the Reserve Bank as the sponsor.29 National Automated Clearing House (NACH) member banks, corporations, and aggregators will participate in these changes. The NPCI has also made the Advanced Encryption Standard (AES) mandatory for the Online Mandate Gateway System (ONMAGS) application, which manages electronic mandates for recurring payments. This will ensure faster, more efficient encryption and compliance with industry standards.30 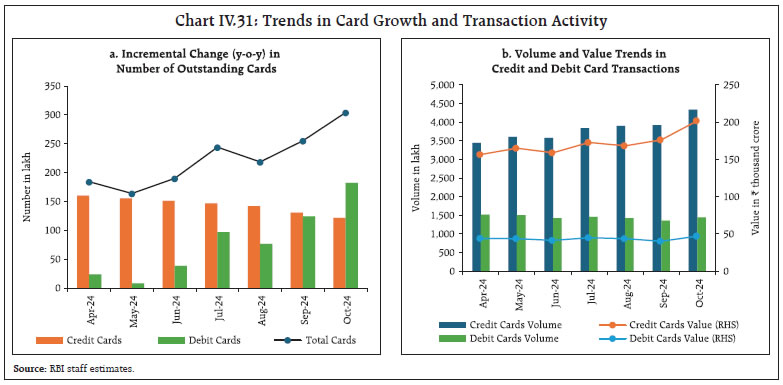 In its statement on developmental and regulatory policies dated December 6, 202431, the Reserve Bank proposed linking the FX-Retail platform (launched by CCIL in 2019) with Bharat Connect32 to enhance accessibility and transparency in foreign exchange pricing for MSMEs and individuals. The pilot will enable USD transactions via bank and non-bank systems, with broader expansion planned. Additionally, the Reserve Bank proposed allowing Small Finance Banks (SFBs) to extend pre-sanctioned credit lines through the UPI, facilitating access to low-ticket, short-tenor products for ‘new-to-credit’ customers. In the FinTech sector, the Reserve Bank has proposed constituting a committee to develop a Framework for Responsible and Ethical Enablement of AI (FREE-AI) in the financial sector. To address digital fraud, the Reserve Bank is conducting a hackathon titled “Zero Financial Frauds”, which includes a specific problem statement on mule accounts aimed at fostering innovative solutions to curb their misuse. An AI/ML-based model, MuleHunter.AI, piloted by the Reserve Bank Innovation Hub (RBIH), has shown promising results in detecting mule bank accounts. Following successful trials with two major public sector banks, the Reserve Bank encourages banks for wider collaboration with RBIH to advance this initiative. V. Conclusion The global economy stands ready to enter 2025 with resilience as disinflation and monetary policy pivots gain traction, supported by recovering real incomes, steady labour markets, and a gradual revival in global trade. Challenges, however, persist in the form of ongoing geopolitical tensions, concerns over growing protectionism and a large public debt overhang. These developments have adverse implications for emerging market economies (EMEs), with their currencies and equities vulnerable to the sharp bouts of declines seen in 2024 in a highly uncertain environment for trade and capital flows. India’s growth trajectory is poised to lift in the second half of 2024-25, driven mainly by resilient domestic private consumption demand. Supported by record level foodgrains production, rural demand, in particular, is gaining momentum. Sustained government spending on infrastructure is expected to further stimulate economic activity and investment. Global headwinds, however, pose risks to the evolving outlook for growth and inflation. Expectations around India’s resilient growth trajectory going forward are also coalescing with a more sustainable underpinnings in view of positive climate action, with increased policy focus on renewable energy, electric vehicles (EVs), green hydrogen, and steps towards institutionalizing the carbon market. These concerted efforts indicate a promising path toward achieving net-zero emissions. Leveraging global frameworks for carbon trading and scaling climate finance, including green bonds, will further reinforce decoupling of growth and emissions. Alongside, India is riding the wave of digitalisation to boost growth, improve productivity and enhance the reach of products and services, spurred by shifts in more discerning consumer behaviour and the deepening reach of online shopping, particularly in smaller towns. This surge also underscores a growing investor confidence and the momentum of innovative energies driving India’s FinTech ascendency.
|