The resilience of the global economy is being tested by escalating trade tensions and a heightened wave of uncertainty around the scope, timing, and intensity of tariffs. While engendering heightened volatility in global financial markets, these have also caused apprehensions about the slowdown in global growth. Amidst these challenges, the Indian economy continues to demonstrate resilience as evident in the robust performance of the agriculture sector and improving consumption. The reverberations of a tumultuous external environment, however, are being reflected in sustained foreign portfolio outflows. India’s macroeconomic strength to face these challenges is bolstered by a decline in headline CPI inflation to a seven-month low of 3.6 per cent in February 2025 on account of a further correction in food prices. Introduction The global economy, which entered 2025 on a strong note of resilience, is caught in a storm of escalating trade tensions and a heightened wave of uncertainty around the scope, timing, and intensity of tariffs. What is more certain, however, is that trade wars and escalating tariffs could have a deleterious impact on growth and fuel inflation, not just in the countries directly involved but for the global economy as a whole. Estimates suggest that a full-blown tariff war could raise the price level by 1.0-1.2 per cent in the US, reduce real GDP growth by 0.6 percentage points in 2025, and leave the U.S. economy persistently 0.3-0.4 per cent smaller in the long run.1 The projections by the Conference Board indicate that the world economy is likely to witness a significant deceleration over the next decade.2 These assessments have been vindicated by the incoming data pointing to a weakening US growth momentum.3 Financial markets are increasingly pricing in the anticipated slowdown in global growth, with benchmark indices in the US and most non-European geographies witnessing a decline. As of March 17, 2025, the US dollar has given up all of its gains since mid-November 2024, weighed by US trade policy and growth uncertainties. Geopolitical tensions and changing global power relations are adding another layer of complexity. In Europe, shifting security priorities are triggering a surge in military spending, particularly in Germany and its neighbouring nations, driving bond yields to rise the most in a week in nearly three decades. Expectations that the fiscal stimulus would lead to a turnaround in growth in the Euro area led to gains in European equities, making them significantly outperform their US counterparts in 2025. With financial markets on the edge and global tensions rising, the months ahead are shrouded in uncertainty. Amidst these challenges, the outlook for global commodities remains a silver lining. Supply prospects for food and energy have been improving. Global cereals production during 2025 is projected to surpass that of 2024.4 Oil prices (UK Brent) declined by about 15 per cent since mid-January 2025 (up to March 11) to below US$ 70 over concerns that a trade war could dampen economic growth and weaken energy demand. Prices are expected to moderate through 2025-26 as inventories increase due to production expansion in an environment of modest demand growth.5 Metal prices, however, witnessed increases in February, tracking news of the US imposition of import tariffs on steel and aluminum. Tariff concerns and safe-haven demand drove gold prices to a historical high of US$ 3000 per ounce on March 14, 2025. Policymakers are now walking a tightrope, having to balance the upward strain of rising prices on account of tariffs and currency depreciation, as well as the downward pressure on inflation from economic slowdown. The stubbornness of headline inflation in AEs, along with a sticky core and services inflation, could act as a constraint on monetary policy being used as a tool to counteract the potential slowdown engendered by the tariff war. Emerging economies remain vulnerable to the contagion effects of these developments through the trade, capital flows and currency depreciation channels. Divergence in domestic macroeconomic conditions is also reflected in dissension in policy actions among central banks. The Indian economy continues to demonstrate resilience in this turbulent global environment, as the growth momentum is supported by robust sectoral performance and improving consumption trends. The Second Advance Estimates (SAE) released by the National Statistics Office (NSO) project a steady 6.5 per cent growth for 2024-25. The latest quarterly data further underscores this strength, with real GDP expanding by 6.2 per cent in Q3:2024-25, shaking off the sluggishness of the previous quarter. Private consumption expenditure is on an upward trajectory, signalling strong consumer confidence and sustained demand. Government spending has picked up significantly in recent months, providing a further fillip to growth. Key sectors, including construction, financial services, and trade, continue to thrive as pillars of economic resilience. Various high-frequency indicators of economic activity point towards a sustained momentum in growth during Q4 as well. The first revised estimates (FRE) of GDP for 2023-24 placed the real GDP growth at 9.2 per cent — the highest in over a decade if we exclude the post-COVID rebound — demonstrating that in an uncertain world, India’s growth story remains a beacon of stability and progress. Recent developments across different sectors reaffirm the assessment of a sequential pick-up in growth momentum. The kharif season 2024-25 has seen an upward revision in production estimates for foodgrains and oilseeds and rabi foodgrains registered a growth of 2.8 per cent mainly on account of above normal rainfall supported by comfortable reservoir levels.6 Despite a mild loss in momentum, the Indian manufacturing sector saw a rise in purchasing activity and employment in February 2025.7 The services sector recorded a strong expansion in new businesses and employment.8 Notwithstanding the innate strength built on strong macroeconomic fundamentals and prudent policy, the reverberations of a tumultuous external environment are also reflected in various segments of the economy. Sustained foreign portfolio outflows exerted significant pressures on domestic equity markets in February and engendered currency depreciation. As discussed in more detail in Section IV, domestic investors have, however, increased their holdings, acting as a counterbalancing force, leading to a shift in ownership patterns. India’s financial landscape is also navigating these external risks manifested through various channels while addressing domestic funding needs. The Reserve Bank has remained agile, swiftly tackling liquidity shortages triggered by government tax flow dynamics, currency leakages and foreign portfolio investor (FPI) outflows. The Reserve Bank has deployed a strategic mix of interventions, including open market operations (OMO), daily variable rate repo (VRR) auctions, and dollar/rupee buy-sell swap auctions. These proactive measures have helped stabilise market liquidity conditions, ensuring financial resilience in an unpredictable global environment. Headline CPI inflation moderated to a seven-month low of 3.6 per cent in February 2025 as food prices, especially vegetables, recorded a sharp decline driven by the arrival of winter crops in the market. Core (CPI excluding food and fuel) inflation, however, increased to 4.1 per cent. The decline in overall inflation is expected to further support recovery in consumption and bolster macroeconomic strength, which would act as a bulwark to ward off the myriad of external challenges. Set against this backdrop, the remainder of the article is structured into four sections. Section II covers the rapidly evolving developments in the global economy. An assessment of domestic macroeconomic conditions is set out in Section III. Section IV encapsulates financial conditions in India, while the last Section sets out the conclusions. II. Global Setting Persistent trade and geopolitical uncertainties continue to test the global economy’s resilience. In its Global Economic Outlook interim report of March 2025, the Organization for Economic Co-operation and Development (OECD) revised its global GDP growth forecast downward by 20 basis points (bps) to 3.1 per cent for 2025 and by 30 bps to 3.0 per cent for 2026 (from their December 2024 projections). Among the advanced economies (AEs), the US is projected to outperform other AEs in the near term and emerging market economies (EMEs) are expected to remain key drivers of global growth (Chart II.1). It has been found that policy uncertainty has emerged as a major risk for global economic prospects (Box II.1) 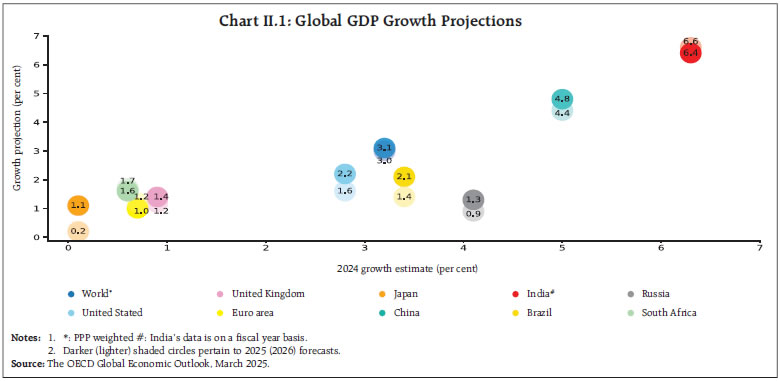
Box II.1: Impact of Trade Policy Uncertainty on Global Economic Activity There has been a resurgence of policy uncertainty recently, particularly relating to geopolitics and trade (Chart II.B1a). The World Trade Policy Uncertainty Index (TPU)9, which was relatively low and stable until 2016, experienced a significant spike in 2018, driven by tariff wars between the US and China, as well as the US ending tariff exemptions for key trading partners, which prompted retaliatory measures. This heightened uncertainty subsided post-2020 but re-emerged in late 2024, driven by concerns about new trade restrictions, tariff increases, and tighter immigration policies following the US presidential elections (Chart II.B1b).  The impact of heightened trade policy uncertainty reverberates across key economic variables, as evidenced by their impulse responses to an increase in TPU in a Vector Autoregression (VAR) framework. World exports experience a significant decline in response to increased TPU, highlighting the adverse effects on global trade flows (Chart II.B2a). For EMEs, an increase in TPU leads to a notable decline in industrial production (Chart II.B2b). This is particularly concerning for EMEs that rely heavily on exports as an engine of economic growth. In the commodity markets, the Energy Price Index shows a temporary increase in response to surging TPU, reflecting heightened risk perceptions and potential supply disruptions (Chart II.B2c). Similarly, the equity market, as measured by the S&P 500 index for the US, reacts negatively to rising TPU, indicating a decline in investor confidence (Chart II.B2d). These responses underscore the broad and interconnected impact of TPU on various facets of the global economy. References: Ahir, H., Bloom, N., and Furceri, D. (2022). World Uncertainty Index. NBER Working Paper. Caldara, D., Iacoviello, M., Molligo, P., Prestipino, A., and Raffo, A. (2019). Does Trade Policy Uncertainty affect Global Economic Activity? FEDS Notes. Washington, DC: Board of Governors of the Federal Reserve System. https://doi.org/10.17016/2380-7172.2445. | Our model-based nowcast of global GDP indicates a significant deceleration in global growth momentum in Q1:2025 (Chart II.2). Global supply chain pressures recorded an uptick in February, inching towards historical average levels (Chart II.3a). The geopolitical risk indicator rose in February 2025 due to rising trade protectionism and simmering political tensions despite the fragile ceasefire in the Middle East (Chart II.3b). Indicators of global shipping costs showed mixed signals as the Baltic Dry Index reached a three-month high in February, reversing the decline seen during the Lunar New Year period in Asia (Chart II.3c). Meanwhile, the Drewry World Container Index continued to decline due to increased shipping capacity (Chart II.3d). In February 2025, consumer sentiments worsened in the US, Japan, and Brazil while improving marginally in the Euro area and the UK (Chart II.4a and II.4b). Financial conditions eased in major AEs, but among EMEs, they tightened in China and Brazil (Chart II.4c and 4d).
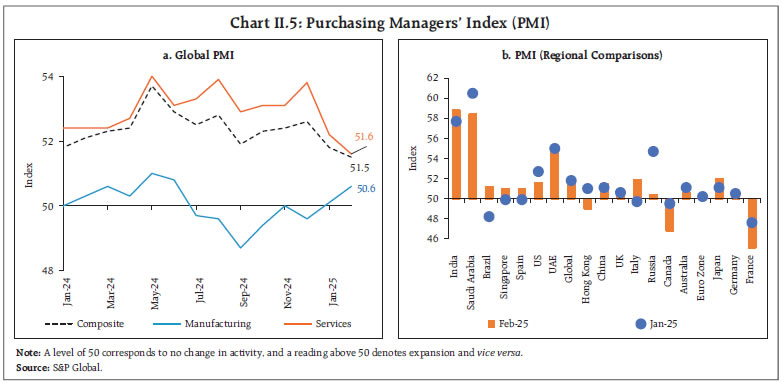
The global composite purchasing managers’ index (PMI) moderated to a 14-month low in February 2025, as the upturn in the manufacturing sector was offset by a deceleration in the service sector business activity (Chart II.5a). Global manufacturing PMI picked up pace as growth of output and new orders strengthened, while slower new orders growth and flagging business optimism led to a deceleration in the global services PMI. Across regions, India outperformed other major emerging markets, while growth remained weak in Europe, and Canada’s downturn intensified (Chart II.5b). 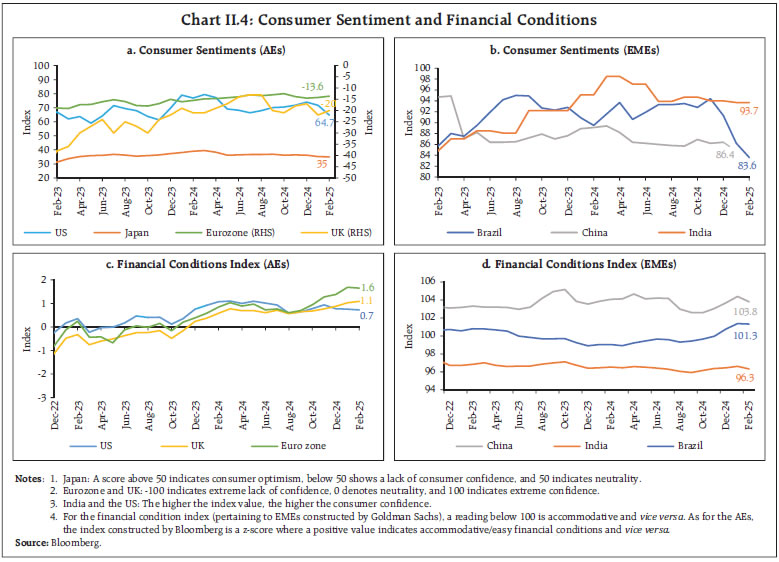
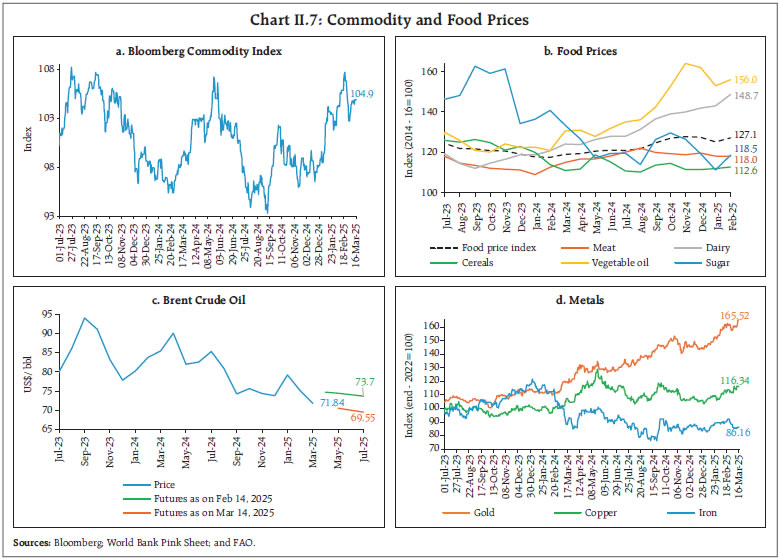
 The composite PMI for new export orders recorded a sequential pick-up, albeit remaining in the negative territory, as the rate of contraction in manufacturing export orders narrowed. Services export orders continued to expand despite a sequential deceleration. Across major economies, Japan, India, and China recorded an expansion in export orders, while the US and the UK witnessed a contraction (Chart II.6a and II.6b). The World Trade Organization’s (WTO) Goods Trade Barometer index at 102.8 for January indicates above trend merchandise trade growth, driven by accelerated imports in anticipation of potential trade policy changes. Global commodity prices remained volatile in February, as indicated by the Bloomberg Commodity Index, registering a modest increase of 0.4 per cent on a month-on-month (m-o-m) basis (Chart II.7a). Food prices measured by the FAO’s food price index increased by 1.6 per cent in February 2025, primarily driven by increase in the prices of sugar, dairy and vegetable oil partially offset by decrease in prices of meat (Chart II.7b). Crude oil prices declined by 4.6 per cent (m-o-m) driven by a significant build-up in US crude stockpiles and tariff uncertainty raising global growth concerns (Chart II.7c). Crude oil prices continued to decline in March following OPEC plus decision to proceed with its output increase in April. Base metal prices increased in February and early March, supported by expectations of additional stimulus in China and weakening of the US dollar. Gold prices also surged in February (Chart II.7d), bolstered by safe-haven demand and purchases by central banks. Headline inflation continues to exhibit stickiness in major economies’ last mile of disinflation. In the US, CPI inflation moderated to 2.8 per cent (y-o-y) in February from 3.0 per cent in January. Headline inflation in the Euro area moderated to 2.4 per cent in February from 2.5 per cent in January. Inflation in Japan (CPI excluding fresh food) increased to 3.2 per cent in January, while in the UK, it accelerated by 50 bps (Chart II.8a). Among EMEs, CPI inflation in China returned to deflationary zone at (-)0.7 per cent in February, marking its lowest level in over a year driven by weak domestic demand (Chart II.8b). CPI inflation recorded an increase in Russia and Brazil in February, and in South Africa in January. Core and services inflation remains above headline in most AEs (Chart II.8c and II.8d). 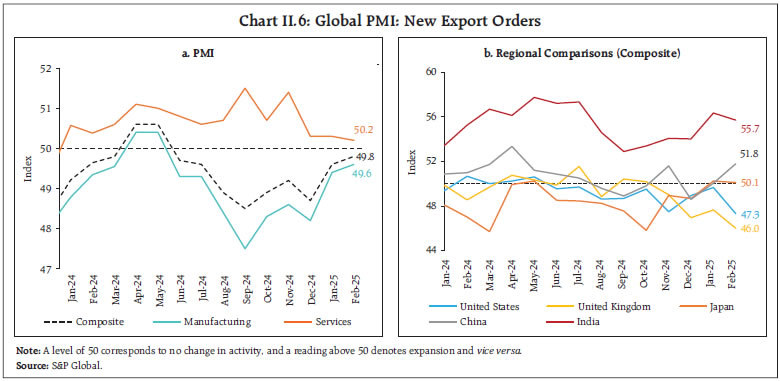
 The Morgan Stanley Capital International (MSCI) world equity index declined by 0.7 per cent (m-o-m) in February as losses in AEs outweighed gains in EMEs. The index rose in the first half of February, supported by strong quarterly corporate earnings in the US, but declined subsequently extending their decline to March so far (up to 14th) as the release of weaker than expected economic data10 and heightened uncertainty regarding trade policies dented optimism (Chart II.9a). Yields on the US government securities remained volatile with a softening bias tracking these developments (Chart II.9b). Potential negative impact of trade restrictions on US growth weighed on the US dollar and the US dollar index (DXY) weakened by 0.7 per cent in February and continued to weaken in March. Concomitantly, the MSCI currency index for EMEs increased marginally despite modest capital outflows (Chart II.9c and II.9d). Central banks have either lowered their policy rates or maintained a status quo in their latest policy meetings. Among AE central banks, the European Central Bank (ECB) and Canada cut their policy rates by 25 bps in March and the UK, Czech Republic, Australia and South Korea lowered their key rates by 25 bps in February. Iceland and New Zealand accelerated their rate cuts to 50 bps in February (Chart II.10a). Israel, however, kept its policy rate unchanged. Among EME central banks, China, Russia, Hungary, the Philippines, Indonesia and Romania kept their policy rates unchanged in February. Malaysia, Peru and Poland kept their policy rates unchanged in March while Thailand lowered its policy rate by 25 bps, and Mexico cut its benchmark rate by 50 bps (Chart II.10b).
III. Domestic Developments The Indian economy recorded a sequential pick-up in growth during Q3:2024-25 driven by private consumption and government spending. Supply chain pressures remained below historical average levels, despite a marginal uptick in February (Chart III.1). Aggregate Demand The second advance estimates (SAE) of national income released by the National Statistical Office (NSO) on February 28, 2025 placed India’s real gross domestic product (GDP) growth at 6.5 per cent in 2024-25 – an upward revision of 10 bps from the first advance estimates (FAE) despite a higher base. This reflects an upward revision of 120 bps in net exports to 7.1 per cent and 30 bps in private final consumption expenditure (PFCE) to 7.6 per cent. Growth for 2023-24 was also revised upwards by 100 bps to 9.2 per cent from the provisional estimates (PE). In terms of quarterly trajectory, growth accelerated to 6.2 per cent in Q3:2024-25 from 5.6 per cent in Q2. PFCE growth accelerated to 6.9 per cent during Q3, owing to a sustained momentum in rural consumption and a revival in urban consumption. Government final consumption expenditure (GFCE) growth improved to 8.3 per cent during Q3 as expenditure by both the Union and the State governments picked up. Growth in fixed investment, however, moderated to 5.7 per cent, as mirrored in its proximate indicators – steel consumption and import of capital goods. Despite headwinds to global trade and world demand, exports recorded a growth of 10.4 per cent, primarily supported by services. With growth in exports surpassing that of imports, the net exports contributed positively to GDP growth by 2.5 percentage points in Q3:2024-25 (Chart III.2). High frequency indicators suggest that aggregate demand continued to remain resilient in Q4:2024-25. Activity indicators such as E-way bills and toll collections recorded double digit (y-o-y) growth in February 2025 (Chart III.3a and Chart III.3b). Wholesale automobile sales contracted by 6.4 per cent (y-o-y) in February (Chart III.4a). The two-wheeler segment declined by 9.0 per cent (y-o-y), mainly due to a fall in motorcycle sales (Chart III.4b). Tractor sales registered double-digit growth for the third consecutive month. Vehicle registrations recorded a contraction in February, driven by a decline in both non-transport and transport vehicles segments (Chart III.4c). Petroleum consumption decreased by 2.1 per cent (y-o-y) in February (Chart III.4d).
In February 2025, job creation in the organised manufacturing sector recorded the second fastest rate of expansion since the inception of the PMI survey. Employment in the services sector also continued to expand at a robust pace (Chart III.5) As per the latest quarterly Periodic Labour Force Survey (PLFS), urban unemployment rate during October-December 2024 was at 6.4 per cent, unchanged from the previous quarter and lowest in the PLFS series. The Labour Force Participation Rate (LFPR) and the Worker Population Ratio (WPR) remained steady (Chart III.6). After recording sequential increase for four consecutive months, the demand for work under the Mahatma Gandhi National Rural Employment Guarantee Scheme (MGNREGS) declined by 3.1 per cent (m-o-m) in February 2025, coinciding with the onset of Rabi harvesting (Chart III.7). India’s merchandise exports at US$ 36.9 billion contracted by 10.9 per cent (y-o-y) in February 2025, driven by an unfavourable base effect which more than offset the positive momentum (Chart III.8). Exports of 17 out of 30 major commodities (accounting for 75.3 per cent of export basket in 2023-24) contracted on y-o-y basis in February. Petroleum products, engineering goods, chemicals and gems and jewellery contributed negatively, while electronic goods, rice, mica, coal and other ores supported export growth in February (Chart III.9).
During April-February 2024-25, India’s merchandise exports expanded by 0.1 per cent to US$ 395.6 billion, primarily led by electronic goods, engineering goods, rice and drugs and pharmaceuticals, while petroleum products, gems and jewellery and iron ore dragged exports down. Exports to 14 out of 20 major destinations contracted in February 2025, while exports to 13 out of 20 major destinations expanded during April-February 2024-25, with the US, the UAE and the Netherlands being the top three export destinations. The merchandise imports at US$ 51.0 billion decreased by 16.3 per cent (y-o-y) in February mainly due to a fall in oil and gold imports, after expanding for 10 consecutive months. Out of 30 major commodities, 12 commodities (accounting for 56.8 per cent of import basket) registered a contraction on y-o-y basis (Chart III.10). Petroleum, crude and products, gold, silver, coal, coke and briquettes, etc., and pearls, and precious and semi-precious stones dragged imports down, while electronic goods, chemical material and products, vegetable oil, machinery, electrical and non-electrical, and non-ferrous metals contributed positively (Chart III.11). During April-February 2024-25, India’s merchandise imports at US$ 656.7 billion increased by 5.7 per cent (y-o-y), mainly led by gold, electronic goods, petroleum, crude and products, and machinery while coal, coke and briquettes, etc., pearls, precious and semi-precious stones, and iron and steel, contributed negatively. Imports from 13 out of 20 major source countries contracted in February 2025, while imports from 11 out of 20 major source countries expanded during April-February 2024-25. Major import source countries, viz., China, Russia and the UAE witnessed imports growth during the period. Merchandise trade deficit fell to its lowest level since August 2021 to US$ 14.1 billion driven by a fall in both oil and non-oil deficit. The share of oil deficit in trade deficit fell to 43.3 per cent in February from 44.5 per cent a year ago owing to a larger decline (Chart III.12). During April-February 2024-25, India’s merchandise trade deficit widened to US$ 261.1 billion from US$ 225.8 billion a year ago. Petroleum products were the largest source of deficit, followed by electronic goods and gold (Chart III.13).
In January 2025, services exports grew by 12.0 per cent (y-o-y) to US$ 34.7 billion, and services imports increased by 12.6 per cent (y-o-y) to US$ 16.7 billion (Chart III.14). Net services export earnings recorded a growth of 11.5 per cent (y-o-y) in January. During April-January 2024-25, the gross fiscal deficit (GFD) and revenue deficit (RD) as a per cent of revised estimate (RE) stood higher than the corresponding period of the previous year mainly due to the pickup in both revenue and capital expenditure of the Union government in recent months (Chart III.15a).11 Tax collections also continued to remain robust. The key fiscal indicators such as revenue receipts, revenue expenditure and capital expenditure remained broadly in line with the previous year (as per cent of RE), barring the non-debt capital receipts which have been lower than the previous year (Chart III.15b). The total expenditure of the Union government grew at 6.4 per cent vis-à-vis 5.9 per cent in the corresponding period of the previous year as both capital and revenue expenditure expanded. Within the Centre’s revenue expenditure, the outgo on major subsidies increased by 7.0 per cent driven by higher food subsidy, as compared to a contraction of 21.0 per cent last year. The capital expenditure incurred during April-January 2024-25 stood at 74.4 per cent of its RE for 2024-25, broadly in line with the previous year. Centre’s capex witnessed consistent pick up from October 2024, compensating for the sluggishness witnessed during H1:2024-25 (Chart III.16a). Ministries with highest budgeted capex target for 2024-25 have attained substantial progress in achieving their revised capital expenditure target of 2024-25 (Chart III.16b).
The gross tax revenue and total receipts of the Centre recorded a growth of 10.3 per cent and 6.6 per cent, respectively, in April-January 2024-25. Income tax and GST continued to be the major drivers for the Centre’s robust tax collections in 2024-25. While the performance of corporation tax remained sub-par, there has been an improvement in the growth of customs duty and union excise duty (Chart III.17). The GST receipts (Centre plus States) grew by 9.1 per cent (y-oy) in February 2025 (Chart III.18a). The cumulative GST collection for April-February 2024-25 amounted to ₹20.13 lakh crore, 9.4 per cent higher than a year ago. During April-January 2024-25, the tax collection from securities transaction tax (STT) has recorded a substantial growth of 75.3 per cent raising its share in direct tax receipts to 2.6 per cent from 1.6 per cent last year (Chart III.18b). Non-tax revenue collection registered a robust growth on the back of surplus transfer of ₹2.11 lakh crore from the Reserve Bank of India. On the other hand, the performance of non-debt capital receipts remains tepid, partly on account of lower disinvestment receipts. As per provisional accounts data for April-January 2024-25, States’ GFD as a per cent of the budget estimates was marginally lower than last year on account of an improvement in revenue performance and a compression in capital expenditure (Chart III.19). Revenue receipts posted a robust growth, supported by higher tax revenue, even as growth in non-tax revenue moderated (Chart III.20a). Within States’ own tax revenues, States’ goods and services tax (SGST) witnessed robust growth and sales tax/VAT collections showed signs of recovery from a contraction during the same period in the previous year. 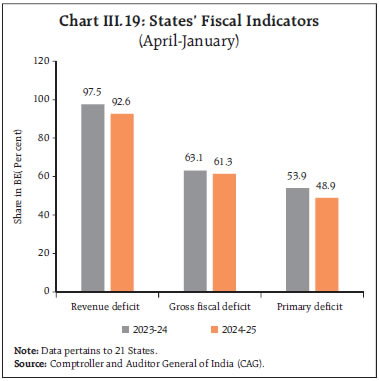
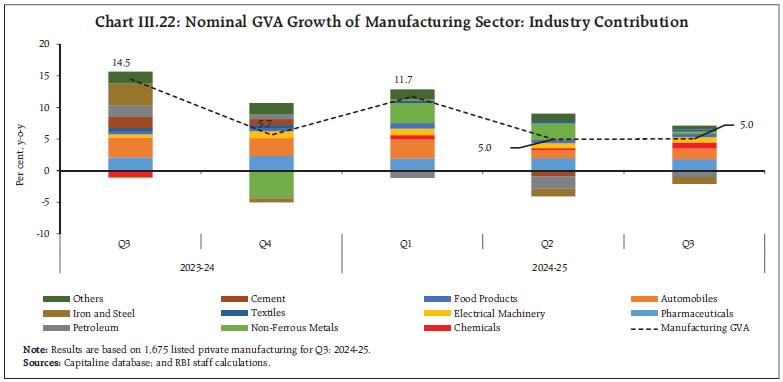
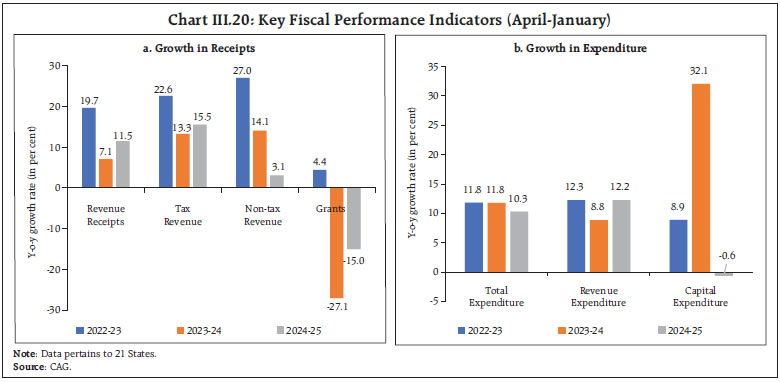 On the expenditure side, growth in revenue expenditure picked up during April-January 2024-25, while capital expenditure declined (Chart III.20b). The rise in revenue expenditure, alongside a contraction in capital outlay has weakened the quality of States’ spending, with the ratio of revenue expenditure to capital outlay (RECO) rising to 7.1 in April-January 2024-25 from 6.1 in the same period last year. Aggregate Supply Real gross value added (GVA) at basic prices is estimated to grow at 6.4 per cent in 2024-25 as per the SAE, similar to that in the FAE. In Q3:2024-25, real GVA growth accelerated to 6.2 per cent (y-o-y) from 5.8 per cent in the preceding quarter (Chart III.21). The growth was propelled by the agriculture and services sector, while the industry sector performed modestly. The nominal GVA growth of listed private manufacturing companies remained unchanged from the previous quarter at 5.0 per cent (y-o-y) during Q3:2024-25. Pharmaceuticals, automobiles, and chemicals industries contributed the most to the growth together accounting for 38 per cent in total GVA. In contrast, iron and steel, petroleum and cement industries contributed negatively to overall GVA growth (Chart III.22). Agriculture, forestry and fishing expanded by 5.6 per cent in Q3:2024-25, owing to robust kharif foodgrains production and higher horticulture production.12 The industrial sector showed a modest recovery in Q3 after a muted performance in the preceding quarter. Manufacturing sector – the primary driver of industrial GVA growth – registered a growth of 3.5 per cent, aided by improved profitability of the listed corporate manufacturing firms. The activity in mining and quarrying recuperated, recording a growth of 1.4 per cent in Q3:2024-25 from a contraction in Q2. Electricity, gas, water supply and other utility services grew at 5.1 per cent in Q3:2024-25 as against 3.0 per cent growth recorded in the preceding quarter. The services sector remained steady in Q3:2024-25. Construction growth moderated to 7.0 per cent compared with the preceding quarter, as reflected in moderation in steel consumption, while growth in trade, hotels, transport, and related services improved to 6.7 per cent, driven by stronger trade activity. Financial, real estate, and professional services maintained a 7.2 per cent growth rate, while public administration, defence, and other services (PADO) grew by 8.8 per cent, supported by robust growth in other services. 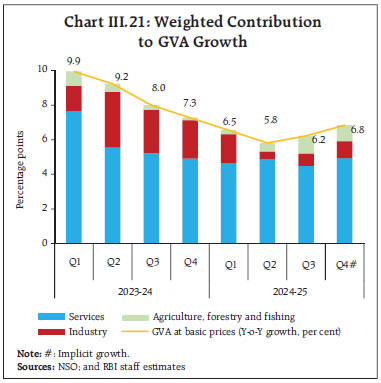
 In its outlook for seasonal temperature during the hot weather season, the IMD has projected above-normal maximum temperatures over most parts of the country during March to May 2025. Above-normal temperatures may lead to an increase in power demand. However, India’s rising focus on the electricity generation from renewable sources especially solar, may help in meeting increased power demand during the summer season (Chart III.23). Solar energy remains the dominant contributor accounting for 47 per cent of the total installed renewable energy capacity. Recently, India achieved a historic milestone of surpassing 100 GW of installed solar power capacity which increased from 2.82 GW in 2014 to 100 GW in 2025.13 With the objective to supply solar power to one crore households by March 2027, PM Surya Ghar: Muft Bijli Yojana (PMSGMBY) facilitates the installation of rooftop solar panels. As of March 10, 2025, there were 10.09 lakh households with rooftop solar installations. Gujarat, Maharashtra, Uttar Pradesh, Kerala, and Rajasthan together accounting for more than 84 per cent of the total installations as per the state-wise data available up to January 27, 2025 (Chart III.24).  The second advance estimates of the agriculture crop production (kharif and rabi)14 placed total foodgrains production at 330.9 million tonnes in 2024-25, 4.8 per cent higher than the final estimates of 2023-24 due to increase in both kharif and rabi production, by 6.8 per cent and 2.8 per cent, respectively (Chart III.25). Wheat (major rabi staple cereal) production has been estimated at record 115.4 million tonnes which is 1.9 per cent higher than the final estimates of the previous year. As on March 07, 2025, the summer acreage was 21.1 per cent higher than the same during the previous year. Area under all the major crops was higher than last year, except for oilseeds for which it was at slightly lower level than a year ago (Chart III.26). Reservoir levels (based on 155 major reservoirs) are in a comfortable position at 47 per cent of total reservoir capacity (as of March 13, 2025) which is higher than the previous year as well as the decadal average levels (Chart III.27). This partially allays concerns for the standing rabi crops emanating from the Indian Meteorological Department (IMD’s) projection of anomaly in temperature and above normal number of heatwave days for the whole summer season (March to May) in most part of the country (Chart III.28).
The overall public stock of foodgrains held by the Food Corporation of India (FCI) stood at 3.8 times the buffer requirements, mainly due to a higher stock of rice (Chart III.29). Rice stocks are at 8.9 times the buffer requirement. Wheat stocks are higher than last year by 38.3 per cent and are above the buffer norm. Rice procurement during the current marketing season at 464.4 lakh tonnes (as on March 11, 2025) is 5.0 per cent higher than last year.
For the upcoming rabi marketing season (2025-26) commencing from April 01, 2025, the estimates for wheat procurement have been fixed at 310 lakh tonnes.16 Similarly, the estimates for rabi rice procurement and rabi coarse grains (including millets) have been fixed at 70 lakh tonnes and 16 lakh tonnes, respectively. India’s manufacturing PMI moderated to a 14-month low in February due to a slowdown in new orders and output (Chart III.30a). The services PMI, recorded a sequential acceleration in February, aided by robust increase in new business (Chart III.30b). Among the high frequency indicators of industrial activity, growth in port traffic accelerated in February 2025, driven by higher growth in other miscellaneous cargo and containerised cargo (Chart III.31). In the construction sector, steel consumption growth accelerated to 11.2 per cent (y-o-y) in February while the cement production levels reached a 15-month high, growing by 14.5 per cent in January (Chart III.32).
Available high frequency indicators for the services sector reflect resilience in economic activity (Table III.1). Inflation Headline inflation, as measured by y-o-y changes in the all-India consumer price index (CPI)17, declined to a seven-month low of 3.6 per cent in February 2025 from 4.3 per cent in January (Chart III.33). The 70 bps decline in inflation was on account of a negative price momentum of around 50 bps which was further aided by a favourable base of around 20 bps. The food group recorded a negative momentum of around (-)1.6 per cent during the month while momentum in CPI fuel and core (excluding food and fuel) groups was positive at 0.1 and 0.7 per cent, respectively. 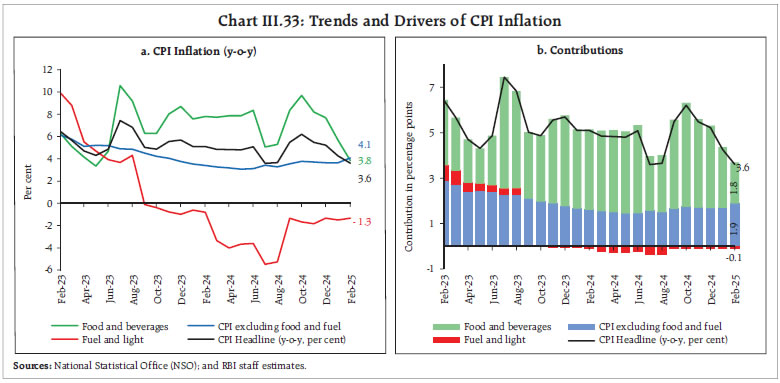 Food inflation declined to 3.8 per cent (y-o-y) in February from 5.7 per cent in January. In terms of sub-groups, vegetables, pulses and eggs recorded a sharp correction in prices and entered the deflationary zone while inflation moderated in cereals, meat and fish, and milk and products. On the other hand, inflation in oils and fats, fruits, sugar and confectionary, non-alcoholic beverages and prepared meals picked up. Spices continued to remain in deflation, although at a lower rate (Chart III.34). Fuel and light deflation narrowed to (-)1.3 per cent in February from (-) 1.5 per cent in January, on account of a lower rate of deflation in kerosene prices, and a higher rate of inflation in electricity prices. LPG prices continued to record a steady rate of deflation. Core inflation increased to 4.1 per cent in February from 3.6 per cent in January. Inflation increased in pan, tobacco and intoxicants, housing, health, transport and communication, and personal care and effects, while it remained unchanged in sub-groups such as clothing and footwear, household goods and services, recreation and amusement, and education (Chart III.35). In terms of regional distribution, rural and urban inflation eased to 3.8 per cent and 3.3 per cent, respectively, in February 2025. At the state level, inflation rate ranged from 1.3 per cent to 7.3 per cent. Majority of the states recorded inflation less than 6 per cent (Chart III.36). High frequency food price data for March so far (up to 17th) show an increase in cereal prices, both for rice and wheat. Edible oil prices have firmed up as well - mainly driven by palm, soybean and sunflower oil. Pulses prices, on the other hand, continued to show broad-based moderation. Prices of key vegetables including potato, onion and tomato witnessed further correction (Chart III.37).
Retail selling prices of petrol, diesel and LPG remained unchanged in March thus far (up to 17th) while kerosene prices moderated (Table III.2). | Table III.2: Petroleum Products Prices | | Item | Unit | Domestic Prices | Month-over-month (per cent) | | Jan-25 | Feb-25 | Mar-25^ | Feb-25 | Mar-25^ | | Petrol | ₹/litre | 101.02 | 101.02 | 101.02 | 0.0 | 0.0 | | Diesel | ₹/litre | 90.48 | 90.48 | 90.48 | 0.0 | 0.0 | | Kerosene (subsidised) | ₹/litre | 43.93 | 46.37 | 46.23 | 5.6 | -0.3 | | LPG (non-subsidised) | ₹/cylinder | 813.25 | 813.25 | 813.25 | 0.0 | 0.0 | Notes: 1. ^: For the period March 1-17, 2025.
2. Other than kerosene, prices represent the average Indian Oil Corporation Limited (IOCL) prices in four major metros (Delhi, Kolkata, Mumbai and Chennai). For kerosene, prices denote the average of the subsidised prices in Kolkata, Mumbai and Chennai.
Sources: IOCL; Petroleum Planning and Analysis Cell (PPAC); and RBI staff estimates. | As per the PMIs, input costs recorded a slower rate of expansion in February for both manufacturing and services sector. Selling price pressures, on the other hand, slowed down marginally across manufacturing firms but increased for services firms (Chart III.38).
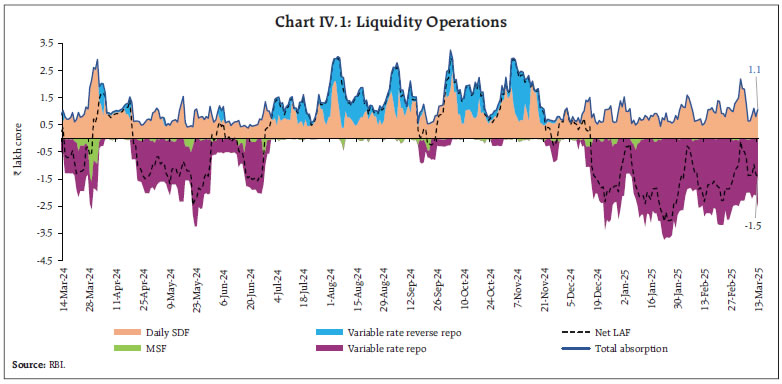
The all-India house price index (HPI), based on property registration data from ten major cities, increased by 3.1 per cent (y-o-y) in Q3:2024-25 as compared to 4.3 per cent in the previous quarter and 3.8 per cent a year ago (Chart III.39). IV. Financial Conditions System liquidity remained in deficit in the latter half of February and early March (up to March 13, 2025) amidst the seasonal pick-up in currency in circulation (CiC). Since mid-February, the Reserve Bank conducted three open market operation (OMO) purchase auctions (on February 20, March 12 and March 18, 2025) of a cumulative amount of ₹1.4 lakh crore, and a 45-day variable rate repo (VRR) auction of ₹57,951 crore on February 21, 2025 to inject durable liquidity. Additionally, rupee liquidity was injected through a three-year USD/INR Buy/Sell swap auction of USD 10 billion on February 28, 2025. During the quarter so far, the Reserve Bank has injected around ₹5.5 lakh crore of durable liquidity into the banking system through a combination of OMO purchases, longer-duration VRR auctions and forex swaps (Table IV.1). Furthermore, the Reserve Bank has been conducting daily VRR auctions since January 16 to tide over transient liquidity tightness, with standalone primary dealers (SPDs) being allowed to participate in these daily auctions. An aggregate amount of ₹9.68 lakh crore was injected into the banking system through two main and twenty-two fine-tuning VRR operations of maturities ranging from 1 to 8 days during February 16 to March 17, 2025. This slew of measures undertaken by the Reserve Bank aided in moderating the liquidity deficit. Consequently, the average daily net injection under the liquidity adjustment facility (LAF) stood at ₹1.41 lakh crore during February 16 to March 13, 2025, as compared to ₹1.92 lakh crore during January 16 to February 15, 2025 (Chart IV.1). | Table IV.1: Durable liquidity measures during Q4:2024-25 | | Measure | Description | Auction Date | Amount injected (in ₹ crores) | | OMO Purchase | Through NDS-OM | January 2025 | 38,825 | | OMO Purchase auction | | January 30, 2025
February 13, 2025
February 20, 2025
March 12, 2025
March 18, 2025 | 20,020
40,000
40,000
50,000
50,000 | | Term Repo Auctions | 56-day VRR auction
49-day VRR auction
45-day VRR auction | February 07, 2025
February 14, 2025
February 21, 2025 | 50,010
75,003
57,951 | | USD/INR Buy Sell swap auction | Tenor: 6 months
Tenor: 3 years | January 31, 2025
February 28, 2025 | Approx. 44,000 (USD 5.10 Billion)
Approx. 88,000 (USD 10.06 Billion) | | | | Total | Approx. 5,53,809 | | Source: RBI. |
 Despite the prevailing liquidity deficit, banks’ placement of funds under the standing deposit facility (SDF) averaged ₹1.15 lakh crore between February 16, 2025, and March 13, 2025, higher than ₹0.85 lakh crore in the previous month. The co-existence of deficit liquidity conditions and substantial fund placements under the SDF suggests the asymmetric distribution of liquidity within the banking system as well as increased liquidity preference on the part of banks. Meanwhile, daily average borrowings under the marginal standing facility (MSF) declined marginally to ₹0.03 lakh crore during February 16, 2025 and March 13, 2025 from ₹0.04 lakh crore in the previous period. The weighted average call rate (WACR) – the operating target of monetary policy – remained within the policy corridor and the spread of the WACR over the policy repo rate averaged 5 basis points (bps) during February 16 and March 13, 2025, same as during January 16 to February 15, 2025 (Chart IV.2a). Rates in the collateralised segment, however, moderated below the policy repo rate amidst improving liquidity conditions. Across the term money market segment, rates have declined with yields on 3-month treasury bills (T-bill) and 3-month commercial paper (CP) issued by non-banking financial companies (NBFCs) recording a moderation during February 16 - March 13, 2025 over the previous month (Chart IV.2b). The yields on certificates of deposit (CDs), however, marginally increased from 7.49 per cent to 7.52 per cent during the same period. The average risk premia in the money market (3-month CP [NBFC] minus 91-day T-bill) increased to 142 bps during February 16 - March 13, 2025 from 137 bps during Janaury 18 - February 14, 2025. Similarly, the spread of the 3-month CD rate over the 91-day T-bill rate edged up (Chart IV.2c). The weighted average discount rate (WADR) of CPs and the weighted average effective interest rate (WAEIR) of CDs remained lower than the levels recorded a year ago (Chart IV.3).
Banks continue to rely on CDs to meet their funding requirements on account of the persisting gap in credit and deposit growth. In the primary market, issuances of CDs grew by 34 per cent (y-o-y) to reach an all-time high of ₹10.58 lakh crore during 2024-25 (up to March 7, 2025) [Chart IV.4]. Similarly, CP issuances at ₹13.90 lakh crore were higher by 13.5 per cent during 2024–25 (up to February 28, 2025) compared with the corresponding period a year ago. The yield on the 10-year G-sec benchmark broadly remained range-bound and was at 6.70 per cent on March 13, 2025, as compared to 6.71 per cent on February 14, 2025 (Chart IV.5a). The domestic yield curve softened in the very short and mid-segment while remaining stable for all other tenors (Chart IV.5b). Between February 16 and March 13, 2025, the average term spread (10-year G-sec yield minus 91-day T-bills yield) increased by 8 bps as compared to the previous period.
The spread of the 10-year Indian G-sec yield over the 10-year US bond increased in the latter half of February, mainly due to a fall in US bond yields. The volatility of yields in India remained low relative to US treasuries (Chart IV.6). Corporate bond issuances at ₹7.94 lakh crore were 18.0 per cent higher during 2024-25 (up to January) compared to last year. Corporate bond yields exhibited mixed trends while the corresponding risk premia increased across ratings and tenor spectrums during the second half of February till March 12, 2025 (Table IV.2).
| Table IV.2: Financial Markets - Rates and Spread | | Instrument | Interest Rates
(per cent) | Spread (bps) | | (Over Corresponding Risk-free Rate) | | Jan 16, 2025 – Feb 15, 2025 | Feb 16, 2025 – Mar 12, 2025 | Variation | Jan 16, 2025 – Feb 15, 2025 | Feb 16, 2025 – Mar 12, 2025 | Variation | | 1 | 2 | 3 | (4 = 3-2) | 5 | 6 | (7 = 6-5) | | Corporate Bonds | | | | | | | | (i) AAA (1-year) | 7.87 | 7.86 | -1 | 116 | 122 | 6 | | (ii) AAA (3-year) | 7.64 | 7.67 | 3 | 90 | 97 | 7 | | (iii) AAA (5-year) | 7.50 | 7.62 | 12 | 73 | 85 | 12 | | (iv) AA (3-year) | 8.43 | 8.44 | 1 | 169 | 175 | 6 | | (v) BBB- (3-year) | 12.10 | 12.09 | -1 | 536 | 540 | 4 | Note: Yields and spreads are computed as averages for the respective periods.
Sources: FIMMDA; and Bloomberg. | Reserve money (RM), excluding the first-round impact of change in the cash reserve ratio (CRR), recorded a growth of 6.8 per cent (y-o-y) as of March 7, 2025 (5.5 per cent a year ago) [Chart IV.7]. Growth in CiC, the largest component of RM, stood at 5.5 per cent (y-o-y) as of March 7, 2025, as compared with 3.5 per cent a year ago. On the sources side (assets), RM comprises net domestic assets (NDA) and net foreign assets (NFA) of the Reserve Bank. Growth in foreign currency assets accelerated to 3.9 per cent (y-o-y) on March 7, 2025, from 1.6 per cent (y-o-y) at the end of January 2025 (Chart IV.8). Gold – the other major component of NFA – grew by 53.8 per cent mainly due to revaluation gains on gold prices, leading to a steady rise in its share in NFA from 8.3 per cent as of end-March 2024 to 11.7 per cent as of March 7, 2025.
As of February 21, 2025, the money supply(M3) had increased by 9.6 per cent (year over year) (10.9 per cent a year ago).18 Aggregate deposits with banks, accounting for around 86 per cent of M3, increased by 10.1 per cent (11.9 per cent a year ago). Scheduled commercial banks’ (SCBs’) credit growth moderated to 12.0 per cent as of February 21, 2025 (16.6 per cent a year ago) due to an unfavourable base effect, partly offset by positive momentum (Chart IV.9).
Based on the latest available quarterly data, credit continues to grow at a healthy pace despite the recent deceleration across various sectors during Q3:2024-25 (Chart IV.10). Credit growth within the personal loans segment remained the primary driver of overall credit expansion, even though there has been a moderation in unsecured personal loan segment following the increase in risk weights announced in November 2023. SCBs’ lending to the private corporate sector, which accounted for nearly a quarter of the total bank credit, moderated in Q3:2024-25. However, credit to public sector entities continued to rise (Chart IV.11a). Growth in working capital loans accelerated, indicating a pick-up in economic activity (Chart IV.11b).
As on February 21, 2025, SCBs’ deposit growth (excluding the impact of the merger) remained at its end-January 2025 level of 10.6 per cent (Chart IV.12). Term deposits’ growth continued to outpace growth in saving deposits in Q3:2024-25 (Chart IV.13). Consequently, the share of term deposits in total deposits rose to 62.1 per cent from 60.3 per cent a year ago. The share of deposits bearing an interest rate of 7 per cent or above (in total term deposits) increased to 70.8 per cent in December 2024, up from 61.4 per cent in December 2023 and 33.7 per cent in March 2023 (Chart IV.14).
SCBs’ incremental credit-deposit ratio increased from 80.7 per cent as at end-October 2024 to 88.2 per cent as on February 21, 2025 (Chart IV.15). In response to the 25-bps cut in the policy repo rate during the February Policy, banks have reduced their repo-linked external benchmark-based lending rates (EBLRs) by a similar magnitude. The 1-year marginal cost of funds-based lending rates (MCLRs) of SCBs rose by 178 bps during May 2022 to January 2025. The weighted average lending rate (WALR) on fresh and outstanding rupee loans increased by 181 bps and 115 bps, respectively, during the same period (Chart IV.16a). In case of deposits, the weighted average domestic term deposit rate (WADTDR) on fresh deposits of SCBs, which include both retail and bulk deposits, increased by 253 bps. The WADTDR on outstanding deposits also increased by 199 bps during May 2022 to January 2025 (Chart IV.16b). 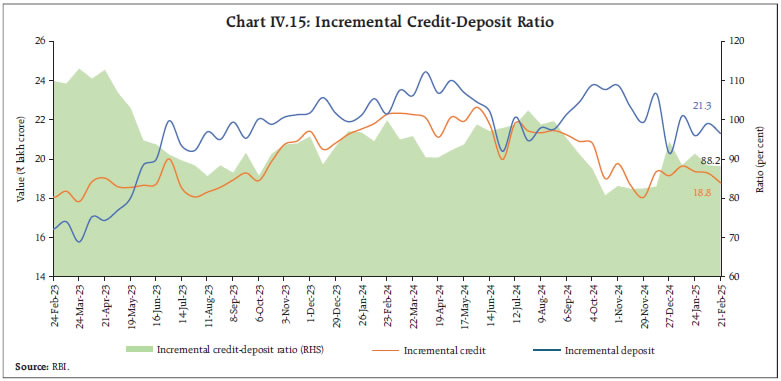
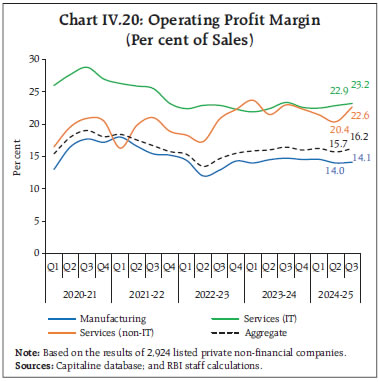
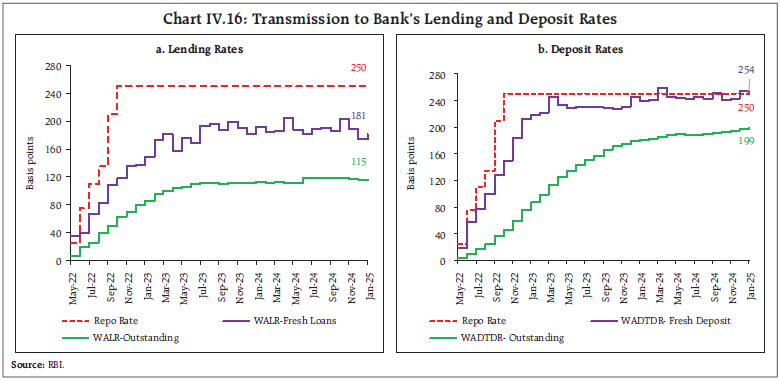 Transmission across bank groups indicates that the increase in the WALR on fresh rupee loans was higher for public sector banks (PSBs) vis-à-vis private sector banks (PVBs). In case of outstanding rupee loans, however, the transmission in PSBs was lower. On the other hand, transmission to deposit rates was higher for PSBs during May 2022 to January 2025 (Chart IV.17a and b). The corporate sector showed signs of recovery during Q3:2024-25, following a subdued performance during Q2. Sales of listed private non-financial companies increased by 8.0 per cent (y-o-y) during Q3:2024-25, an improvement from 5.4 per cent in the previous quarter and 5.5 per cent in the corresponding quarter a year ago. Sales growth (y-o-y) of listed private manufacturing companies improved during Q3:2024-25 (Chart IV.18). The turnaround in growth was mainly driven by higher sales in automobiles, chemicals, food products and electrical machinery industries whereas sales in the petroleum, iron and steel, and cement industries continued to contract on an annual basis during Q3, though the pace of contraction moderated (Chart IV.19). The information technology (IT) sector recorded a higher sales growth, as compared with the previous quarter and a year ago. Sales growth of non-IT services companies continued to grow in double digits despite a deceleration. This growth was mainly driven by the ‘Wholesale and Retail Trade’ and ‘Transport and Storage Services’ segments. With operating expenses growing at a slower pace than sales, operating profit expanded at the aggregate level during Q3:2024-25, leading to a sequential improvement of 50 bps in the operating profit margin. Margin improved across all major sectors during the quarter, aligning with their improved sales growth (Chart IV.20). 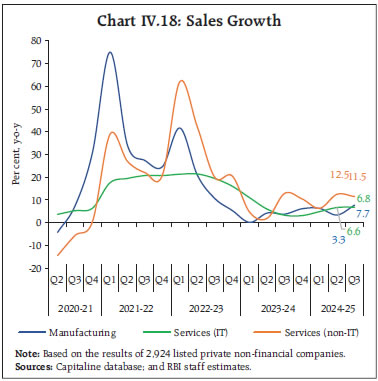 Indian equity markets continued to experience pressure in the latter half of February and early March, following persistent selling by foreign institutional investors (FIIs), uncertainty surrounding the US government tariff policies and concerns over corporate earnings amid mixed global cues. Overall, the BSE Sensex declined by 2.3 per cent since February 14, 2025, to close at 74,170 on March 17, 2025. The equity market correction in recent months has been broad-based, resulting in declines across sectoral indices (Chart IV.21a). The broader market indices have experienced sharper falls, as reflected in a higher proportion of their constituents hitting 52-week lows in the recent period and notably, on March 3, 2025, 31 per cent of the constituent members of the NSE 500 index touched a fresh 52-week low, compared to 22 per cent of the Nifty 50 members (Chart IV.21b). 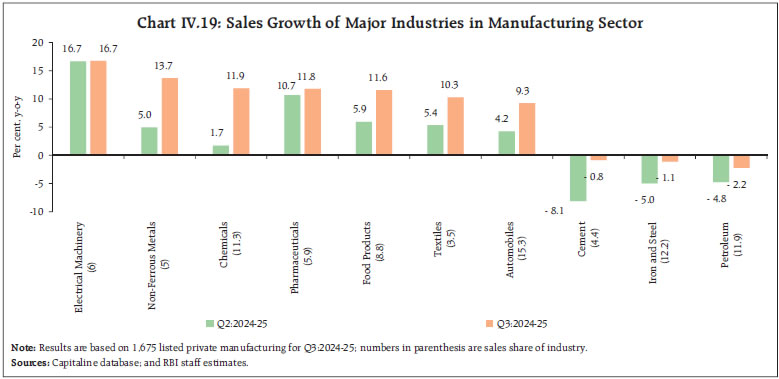
 As per Prime Database, persistent selling by FIIs has reduced their ownership in NSE-listed companies to 17.2 per cent by end-December 2024, marking a multi-year low. In contrast, domestic institutional investors (DIIs) have increased their holdings, pushing the FII-to-DII ownership ratio to its lowest level since June 2009 (Chart IV.22).19 The recent market correction, coupled with regulatory measures in the equity derivatives segment, has led to a decline in turnover across both the equity derivatives and cash segments in recent months (Chart IV.23).20
Weak sentiments in the secondary market also affected fund-raising activity in the primary market in January 2025 (Chart IV.24).21
In light of recent correction in equity markets, it is noteworthy that 60.8 per cent of retail investors’ equity assets have been held for more than 24 months (Chart IV.25).22 This indicates that retail investors have demonstrated persistence in holding onto their equity investments, particularly through mutual funds (MFs) and systematic investment plans (SIPs). Three recent developments hold signficant potential for enhancing the financialisation of household savings. First, the introduction of micro SIP schemes23, which will make MF products more accessible to a wider audience. Second, the launch of specialised investment funds24, designed to offer investors greater flexibility and serve as a bridge between MFs and portfolio management services (PMS). Third, the establishment of a centralised database for corporate bonds, which would provide an authentic source of information on corporate bonds in India.25 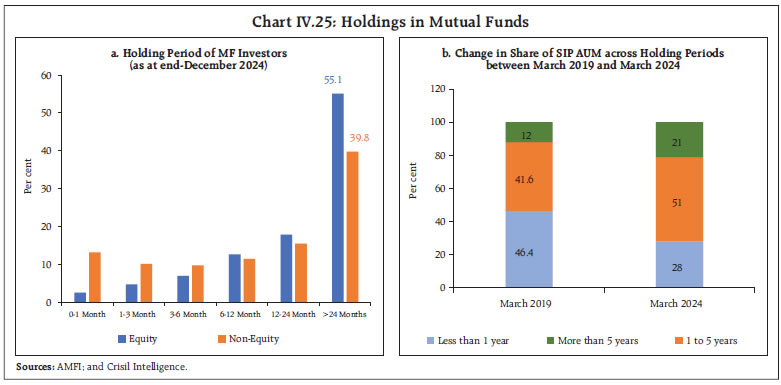 Gross inward foreign direct investment (FDI) continues to remain strong, growing by 12.4 per cent (y-o-y) to US$ 67.7 billion during 2024-25 (April-January) from US$ 60.2 billion over the corresponding period a year ago (Chart IV.26a). However, net FDI declined to US$ 1.4 billion during 2024-25 (April-January) from US$ 11.5 billion a year ago, owing to higher repatriation and outward FDI from India. Sector-wise, manufacturing received the highest share of equity inflows, followed by financial services, electricity and other energy, and communication services - together accounting for more than 60 per cent of the flows. Over 75 per cent of the flows were from Singapore, Mauritius, the US, the UAE and the Netherlands during the period. 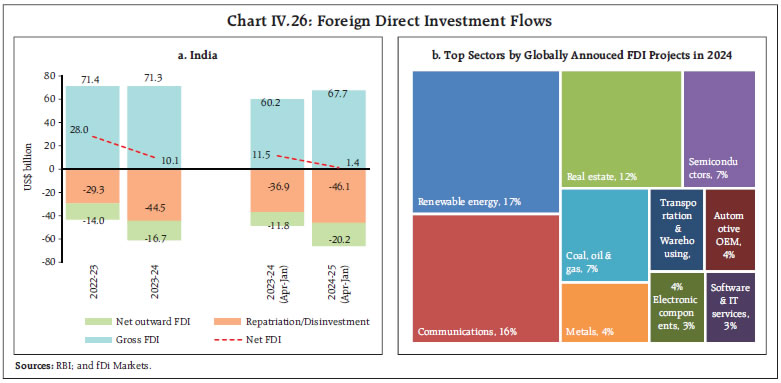 In terms of globally annouced greenfield FDI projects, India ranked second after the US during 2024, up from sixth position in 2020. Of the total FDI projects announced worldwide worth US$ 1.8 trillion in 2024, India accounted for around 6 per cent (over US$ 100 billion). Emerging sectors – renewables, communications, semiconductors, and metals – remained the most attractive FDI sectors globally during 2024 (Chart IV.26b). In India, metals, renewable energy and semiconductors were the top industries, accounting for about 60 per cent of the total annouced FDI projects in 2024. Foreign portfolio investment (FPI) flows continued to experience outflows in February 2025. Net FPI outflows worth US$ 4.0 billion were recorded in February, with net equity outflows of US$ 5.4 billion (Chart IV.27a). Furthermore, Global FPI flows during the month were significantly redirected towards Chinese equities, amidst increasing optimism about revival of the Chinese economy through monetary and fiscal stimulus (Chart IV.27b). In India, FPI outrush continued in March 2025 with net outflows of US$ 0.9 billion (up to March 17). Net accretion to non-resident deposits (NRD) at US$ 14.3 billion during 2024-25 (April-January) were higher from US$ 10.2 billion a year ago, with higher accretion to all three accounts, namely, Non-Resident (External) Rupee Accounts [NR(E)RA], Non-Resident Ordinary (NRO) and Foreign Currency Non-Resident (Banks) [FCNR(B)] accounts. External commercial borrowing (ECB) registrations (US$ 47.3 billion) and disbursements (US$ 42.3 billion) during April 2024 – January 2025 on a cumulative basis, were significantly higher than those recorded in the corresponding period of the previous year. ECB outflows due to principal repayments stood at US$ 23.9 billion during this period, resulting in robust net inflows of US$ 18.4 billion — more than twice the level observed in the corresponding period of the previous year (Chart IV.28). Of the total ECBs registered during April 2024 - January 2025, nearly 44 per cent were intended for capital expenditure purposes (Chart IV.29). The continued decline in the secured overnight financing rate (SOFR) since August 2024 has contributed to a reduction in the overall cost of ECBs. In January 2025, the overall cost of ECBs declined by 129 bps compared with the corresponding period of the previous year (Chart IV.30).
The Indian rupee (INR) depreciated by 0.9 per cent (m-o-m) during February 2025, weighed by heavy FPI outflows (Chart IV.31). The extent of depreciation of the INR, however, was lower than the previous month. In addition, the INR remained one of the least volatile major currency. The INR depreciated by 2.4 per cent (m-o-m) in terms of the 40-currency real effective exchange rate (REER) in February 2025 due to depreciation of the INR in nominal effective terms and narrowing of India’s inflation differential with its major trading partners (Chart IV.32).
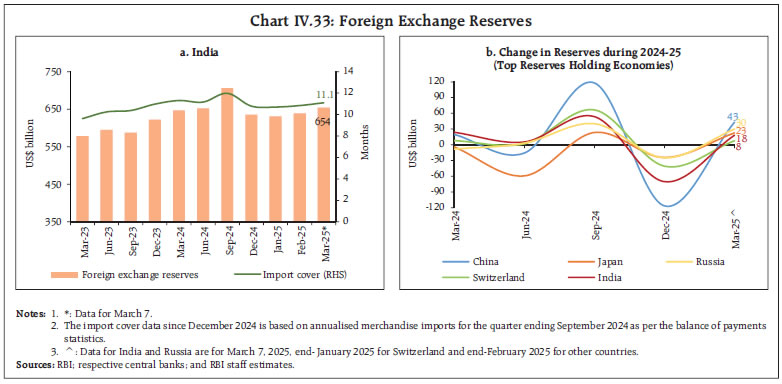
As on March 7, 2025, India held foreign exchange reserves worth US$ 654.0 billion, sufficient for over 11 months of imports and 91 per cent of external debt outstanding at end-September 2024 (Chart IV.33a). The top reserves-holding economies witnessed drawdown in forex reserves during Q3:2024-25, with some signs of recovery in 2025 (Chart IV.33b). Payment Systems India’s digital payment ecosystem expanded in February 2025, led by the Bharat Bill Payment System (BBPS) and Unified Payments Interface (UPI) (Table IV.4). The growing role of digital payments in boosting entrepreneurship and business expansion in India is evident from the rise in person-to-merchant (P2M) transactions, comprising 62.5 per cent of total UPI transactions in February 2025, up from 60.8 per cent a year ago. 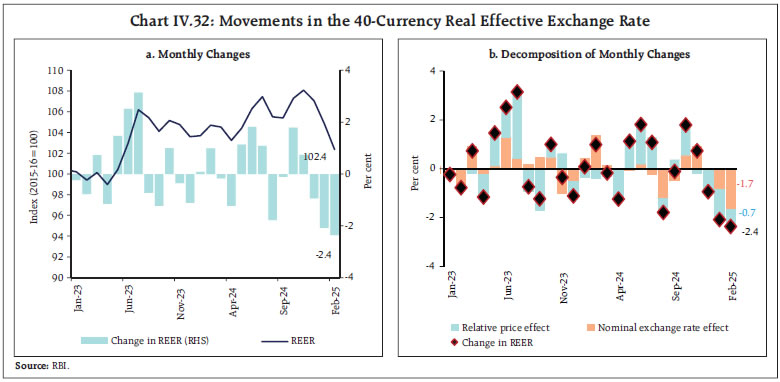
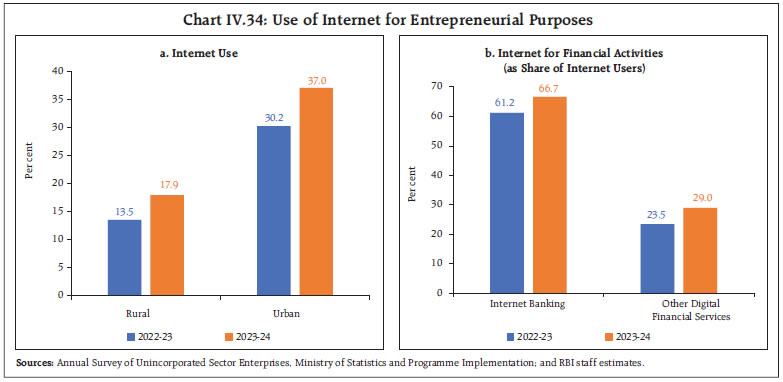
 In the digital finance segment, the working capital requirements of micro, small and medium enterprises (MSMEs) are increasingly being met through the Trade Receivables Discounting System (TReDS), as reflected in the sharp rise in factoring units26 (FU) financed— which recorded a growth of 78 per cent in volume and 68 per cent in value (y-o-y) in January 2025. The average number of MSME sellers27 registered on TReDS rose to 41,094 in January 2025 from 24,081 a year ago. The transformation is also reflected in the rising proportion of unincorporated sector enterprises utilising the internet for entrepreneurial activities. At the national level, internet adoption increased from 21 per cent in 2022-23 to 26.7 per cent in 2023-24, with a faster uptake among urban enterprises (Chart IV.34a). Additionally, the share of enterprises using the internet for financial activities has increased (Chart IV.34b). 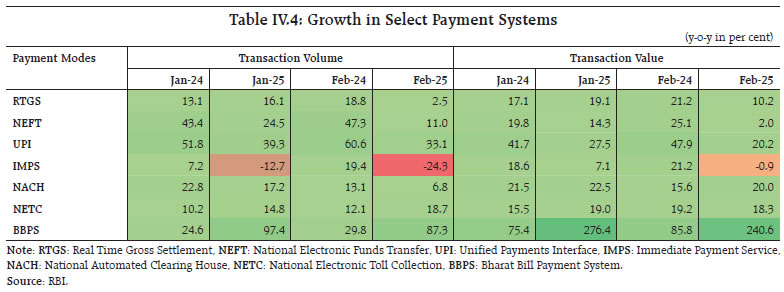
 On the policy front, the Reserve Bank has issued the Framework for Recognising Self-Regulatory Organisations (SROs) for the Account Aggregator Ecosystem (SRO-AA) and invited applications for their recognition.28 The National Payments Corporation of India (NPCI) introduced addendums to improve the UPI Lite functionality, including transfer-out, balance reconciliation, app passcode, and enhanced UPI limits, further enhancing user experience, especially for offline29 transactions.30, 31 V. Conclusion The immediate course of the global economy is likely to be shaped by escalating trade tensions, inflationary pressures stemming from tariffs, and attendant financial market volatility. Recently announced fiscal stimulus is expected to provide a short-term boost to growth in the euro area, although sharp spikes in yields witnessed after such announcements indicate that resulting increases in long-term borrowing costs are likely to constrain very large expansions. Commodity prices have a benign outlook as a baseline case in line with the expected moderation in demand in an environment of growth slowdown. The pass-through of higher tariffs to consumer prices, however, remains a key risk to inflation, which is already exhibiting signs of stubbornness in many AEs. Central banks in AEs would have to factor in such pressures while calibrating policy responses in an environment of potential slowdown in growth. EMEs, on the other hand, are likely to record higher growth than their AE counterparts, although capital outflows and potential currency depreciation remain major risks. Domestically, macroeconomic fundamentals remain strong, and economic growth is poised to sustain momentum driven by robust domestic demand, steady investment activity, and ongoing policy-driven infrastructure development along with a pick-up in government spending. Headline inflation has moderated significantly from above 6 per cent in October 2024 to 3.6 per cent in February 2025. Robust kharif production, better rabi sowing coupled with higher reservoir levels and seasonal winter correction in vegetable prices augur well for food inflation, although volatility in commodity prices and weather anomalies remain potential upside risks to the overall inflation outlook. While facing challenges from weakening global trade and tariff uncertainty, India’s external sector continues to find support from resilient services exports, which remain less affected by global disruptions. Going forward, India’s structural strengths—sound fiscal policies, a well-calibrated monetary framework, and digital transformation initiatives—are expected to provide a strong foundation for long-term sustainable economic growth.
|