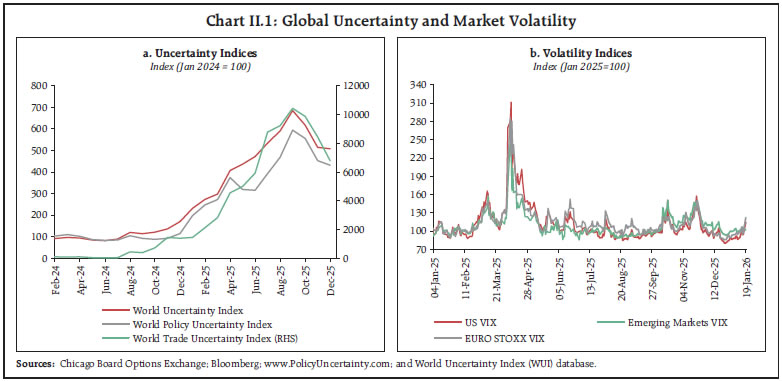
Global growth remained resilient in 2025 despite heightened uncertainties. Though elevated, global uncertainty witnessed further moderation in December. The first advance estimates of GDP for 2025-26 reflected the resilience of the Indian economy, driven by domestic factors amidst a challenging external environment. High-frequency indicators for December suggest continued buoyancy in growth impulses with demand conditions remaining upbeat. Headline CPI inflation edged up in December but remained below the lower tolerance level. The flow of financial resources to the commercial sector has increased over the past year, with both non-bank and bank sources contributing to the credit pick-up. Introduction Global growth remained resilient in 2025 despite heightened uncertainties. The IMF’s World Economic Outlook update of January 2026 revised upward its global growth projections for 2026, on strong technology-led investment, alongside fiscal and monetary support and broadly accommodative financial conditions. The balance of risks to the growth outlook, however, remained tilted to the downside. Global uncertainty, though elevated, moderated further in December. Volatility in global financial markets, after moderating through much of the month, edged up in January due to rising geopolitical tensions. Global economic activity moderated to its lowest level in six months in December as growth across manufacturing and services softened. New export orders reverted to contraction, driven by a broad-based decline in both manufacturing and services export orders. Major equity markets recorded modest gains in December. Non-US markets, however, showed better returns as investors diversified their portfolios amidst concerns about concentration risks in the US. In January 2026 so far, equity markets rallied till mid-month, led by Japan, but retreated later amidst increased geopolitical uncertainties. Global bond yields rose across most of the advanced economies (AEs) as a result of the repricing of worldwide interest rate expectations, the Bank of Japan’s rate hike, and an improved economic outlook in the US. Portfolio flows to emerging markets rebounded, reversing the outflows in the previous month, led by inflows into the debt segment. Global commodity prices recorded divergent movements. Prices of industrial and precious metals firmed up. Crude oil prices held steady on a favourable demand-supply balance in December. Prices edged higher in early January amidst rising geopolitical tensions but partly corrected later. Inflation eased but remained at elevated levels in the AEs amidst persistent services inflation. Monetary policy actions marked a divergence in policy stances among systemic central banks in December. The first advance estimates of gross domestic product (GDP) for 2025-26 reflected the resilience of the Indian economy, driven by domestic factors – private final consumption expenditure (PFCE) and fixed investment – amidst a challenging external environment. A strong rebound in the manufacturing sector and continued buoyancy in services are expected to boost growth in gross value added (GVA). High-frequency indicators for December suggest continued buoyancy in growth impulses. Demand conditions remained upbeat, underpinned by a resurgence in rural demand and a gradual recovery in urban demand. Headline consumer price index (CPI) inflation edged up in December but continued to remain below the lower tolerance level for the fourth consecutive month. The uptick in inflation in December was driven by a lower rate of deflation in food and a pick-up in core (CPI excluding food and fuel) inflation. Core inflation continued to be disproportionately influenced by prices of precious metals, with the core inflation excluding gold and silver remaining steady at its all-time low. The December print is the last inflation reading in the current base year (2012=100) series. In the money market, the weighted average call rate – the operating target of monetary policy – traded above the policy repo rate but largely within the corridor. Average yields on treasury bills declined, while those on commercial papers increased. Interest rates on certificate of deposits also edged up amidst an expected increase in supply following the pick-up in credit growth. In the fixed income segment, the yield curve shifted upwards across tenors in January. Growth in bank deposits and credit registered a marked increase in December. During 2025-26 so far (up to December 31), the total flow of financial resources to the commercial sector increased compared to the same period a year ago, with non-bank sources along with bank sources contributing to the credit pick-up. Indian equity markets exhibited bidirectional movements in December. Strong buying by domestic institutional investors (DIIs) provided support to equity markets, amidst persistent selling by foreign portfolio investors (FPIs). In January 2026, downward pressures on the equity markets resurfaced in the wake of fresh tariff warnings by the US. Net FPI registered outflows from both the equity and debt segments in December, amidst uncertainty surrounding the stalled India-US trade deal and the depreciation of the rupee. India’s external sector remains resilient, as evidenced by the improved international investment position as at end-September 2025. Comfortable foreign exchange reserves and a sustainable current account deficit continue to underpin India’s external sector stability. Set against this backdrop, the remainder of the article is structured into four sections. Section II covers the rapidly evolving developments in the global economy. Section III provides an assessment of domestic macroeconomic conditions. Section IV encapsulates financial conditions in India, while Section V presents the concluding observations. II. Global Setting The IMF’s World Economic Outlook update of January 2026 revised upward its global growth projections for 2026, even as the balance of risks remained tilted to the downside. Global growth estimate for 2025 was revised up by 10 basis points (bps) to 3.3 per cent and projections for 2026 by 20 bps to 3.3 per cent relative to the October release, reflecting strong technology-led investment, alongside fiscal and monetary support and broadly accommodative financial conditions (Table II.1). Growth projections for major AEs, including the US, the UK and the Euro area, were revised upward. Among emerging market and developing economies (EMDEs), growth remained robust, led by India and China. The World Bank’s Global Economic Prospects Report (January 2026) also revised global growth estimates for 2025 upward by 40 bps to 2.7 per cent, reflecting stronger-than-expected growth in major AEs, led by the US and the Euro area (Table II.1). Global growth projections for 2026 was also revised up by 20 bps to 2.6 per cent. However, it is still expected to moderate from 2025 levels due to a likely deceleration in trade growth. Global uncertainty declined for the third consecutive month in December, though continuing to be elevated. World policy uncertainty index moderated at a lower pace, while the world trade uncertainty index saw a significant fall in December. Financial market volatility edged lower for most of December, led by reduced uncertainty and compressed risk premia across major advanced and emerging market economies. Volatility in global financial markets edged up in January due to renewed geopolitical tensions (Charts II.1a and II.1b). | Table II.1: Global GDP Growth Projections – Select AEs and EMDEs | | (Y-o-y, per cent) | | Organisation | IMF* | World Bank^ | | Estimate/Projection | 2025 | 2026 | 2027 | 2025 | 2026 | 2027 | | Month of Projection | Oct 2025 | Jan 2026& | Oct 2025 | Jan 2026 | Jan 2026 | June 2025 | Jan 2026& | June 2025 | Jan 2026 | June 2025 | Jan 2026 | | 1. World | 3.2 | 3.3 | 3.1 | 3.3 | 3.2 | 2.3 | 2.7 | 2.4 | 2.6 | 2.6 | 2.7 | | 2. Advanced Economies | 1.6 | 1.7 | 1.6 | 1.8 | 1.7 | 1.2 | 1.7 | 1.4 | 1.6 | 1.5 | 1.6 | | US | 2.0 | 2.1 | 2.1 | 2.4 | 2.0 | 1.4 | 2.1 | 1.6 | 2.2 | 1.9 | 1.9 | | UK | 1.3 | 1.4 | 1.3 | 1.3 | 1.5 | - | - | - | - | - | - | | Euro Area | 1.2 | 1.4 | 1.1 | 1.3 | 1.4 | 0.7 | 1.4 | 0.8 | 0.9 | 1.0 | 1.2 | | Japan | 1.1 | 1.1 | 0.6 | 0.7 | 0.6 | 0.7 | 1.3 | 0.8 | 0.8 | 0.8 | 0.8 | | 3.Emerging Market and Developing Economies | 4.2 | 4.4 | 4.0 | 4.2 | 4.1 | 3.8 | 4.2 | 3.8 | 4.0 | 3.9 | 4.1 | | Emerging and Developing Europe | 1.8 | 2.0 | 2.2 | 2.3 | 2.4 | - | - | - | - | - | - | | Russia | 0.6 | 0.6 | 1.0 | 0.8 | 1.0 | 1.4 | 0.9 | 1.2 | 0.8 | 1.2 | 1.0 | | Emerging and Developing Asia | 5.2 | 5.4 | 4.7 | 5.0 | 4.8 | - | - | - | - | - | - | | India# | 6.6 | 7.3 | 6.2 | 6.4 | 6.4 | 6.3 | 7.2 | 6.5 | 6.5 | 6.7 | 6.6 | | China | 4.8 | 5.0 | 4.2 | 4.5 | 4.0 | 4.5 | 4.9 | 4.0 | 4.4 | 3.9 | 4.2 | | Latin America and the Caribbean | 2.4 | 2.4 | 2.3 | 2.2 | 2.7 | 2.3 | 2.2 | 2.4 | 2.3 | 2.6 | 2.6 | | Mexico | 1.0 | 0.6 | 1.5 | 1.5 | 2.1 | 0.2 | 0.2 | 1.1 | 1.3 | 1.8 | 1.8 | | Brazil | 2.4 | 2.5 | 1.9 | 1.6 | 2.3 | 2.4 | 2.3 | 2.2 | 2.0 | 2.3 | 2.3 | | Sub-Saharan Africa | 4.1 | 4.4 | 4.4 | 4.6 | 4.6 | 3.7 | 4.0 | 4.1 | 4.3 | 4.3 | 4.5 | | South Africa | 1.1 | 1.3 | 1.2 | 1.4 | 1.5 | 0.7 | 1.3 | 1.1 | 1.4 | 1.5 | 1.5 | Notes: 1. #: India’s data is on a fiscal year basis (April-March).
2. &: Estimates.
3. * World growth rates are measured at purchasing-power-parity weights.
4. ^ Growth rates are calculated using GDP weights at average 2010-19 prices and market exchange rates.
Sources: IMF, World Economic Outlook, January 2026; and World Bank Global Economic Prospects, January 2026. |
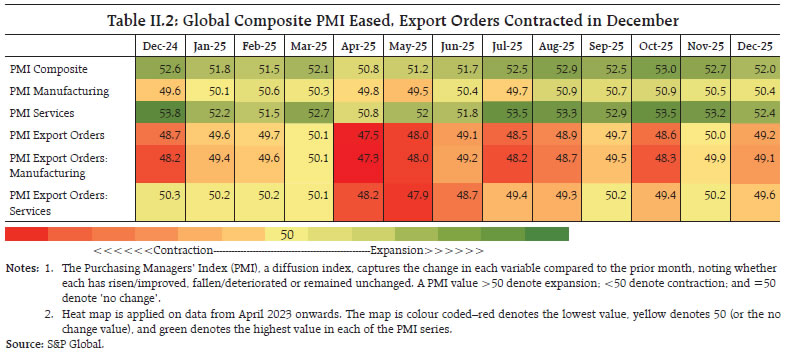 The global composite PMI moderated in December to its lowest level in six months as growth in output across manufacturing and services eased. New export orders reverted to contraction in December, driven by a broad-based decline in both manufacturing and services export orders (Table II.2). Business activity, as reflected in PMI indices, expanded across major AEs, except Canada. Among major EMDEs, business activity expanded in India and China, while it remained broadly unchanged in Russia. New export orders continued to remain in contraction in most AEs, barring the UK and Australia. Among major EMDEs, export orders continued to expand in India at a robust pace. However, China’s new export orders moved into contraction amidst subdued external demand (Charts II.2a and II.2b). 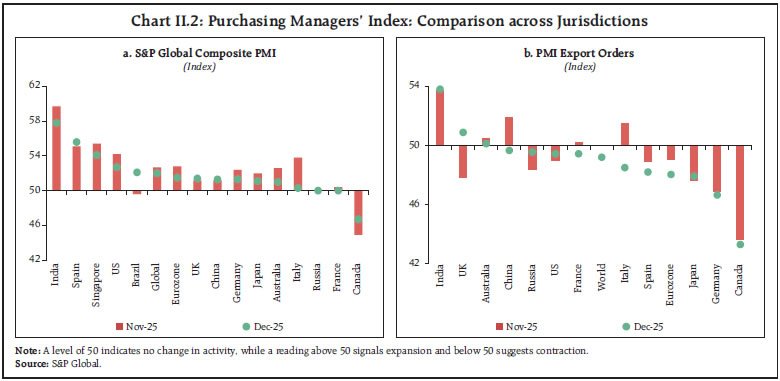 Global commodity prices exhibited divergent movements in December. The World Bank Commodity Price Index declined marginally due to lower energy prices, while non-energy items, such as metals and precious metals, registered a notable uptick. Food and Agriculture Organization’s Food Price Index declined for the fourth consecutive month, dragged by dairy products, meat and vegetable oils (Chart II.3a). The Bloomberg Commodity Index registered an increase in January so far, driven by higher metal and gold prices. Gold prices which maintained an upward trajectory up to end-December, corrected thereafter due to year-end portfolio rebalancing and profit booking by investors. In January so far, prices edged up amidst renewed geopolitical tensions. Brent crude oil prices traded in a narrow range in December. Prices picked-up in early January amidst rising geopolitical tensions but partly corrected later (Charts II.3b). Industrial metal prices have seen a substantial upsurge in the recent period, amidst supply constraints and tariff uncertainties. Copper prices accelerated in recent months on tight demand-supply balance and on uncertainties surrounding US import tariffs. Acute supply constraints resulted in a sharp pick-up in tin prices in recent months. Aluminium prices strengthened on persistent supply pressures stemming from China’s smelting capacity cap and production constraints in Europe. Silver prices surged on rising demand, for industrial use and as a safe-haven asset, amidst tight supplies (Chart II.4). Inflation eased but remained at elevated levels in most AEs due to persistent services inflation. In the Euro area, headline inflation eased further in December, driven by a decline in energy costs, while inflation in the US remained steady. Inflation in the UK fell to a six-month low led by food and beverages. Japan’s inflation also edged lower on low food inflation (Chart II.5a). Among major EMDEs, inflation edged up in China, driven by food prices, even as core inflation remained steady. In contrast, lower food and beverage prices led to easing of inflationary pressures in Brazil and in Russia, where headline inflation moderated to its lowest level since September 2023. Inflation in South Africa eased due to moderation in transport costs (Chart II.5b). 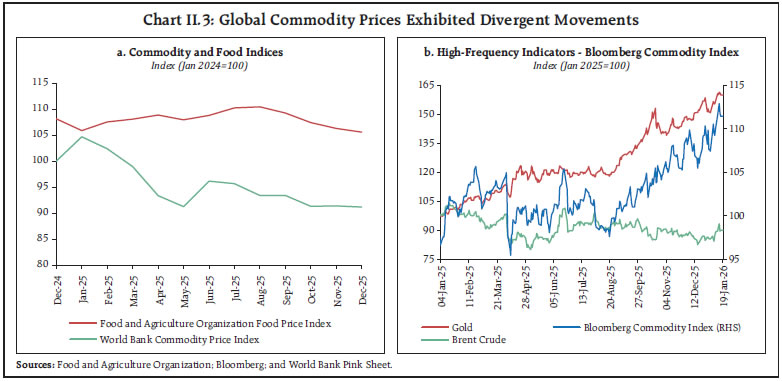
 Equity markets in major economies rallied in December and early January but retreated later amidst rising geopolitical uncertainties. Equity markets in the US experienced intermittent volatility in December and January. Markets saw a mid-month correction in December, led by sell-offs in the technology sector, before rebounding on softer-than-expected inflation data. Thereafter, markets remained range-bound till mid-January before registering a downturn due to geopolitical tensions. European equity markets remained broadly steady in December, but rising geopolitical tensions led to a decline from mid-January. Equity markets in Japan, though witnessing occasional pullbacks, saw a modest gain in December. Markets registered gains till mid-January before retreating on geopolitical considerations. Chinese equity markets strengthened since mid-December on positive domestic data. However, it eased around mid-January due to increased regulatory scrutiny on trading (Chart II.6a). The US Treasury yields hardened in early December, following hawkish signals from the Bank of Japan, but eased subsequently after the Federal Reserve’s rate cut and a softer US inflation print. Yields, however, rose again towards the year-end on strong economic data and the release of FOMC minutes indicating a likely slower pace of future monetary easing. In January so far, yields eased on weaker labour data before rising again on global bond sell-off triggered by heavy selling in Japanese government debt. The JP Morgan emerging market bond yield spread narrowed in December and January, supported by positive investor demand (Chart II.6b). 
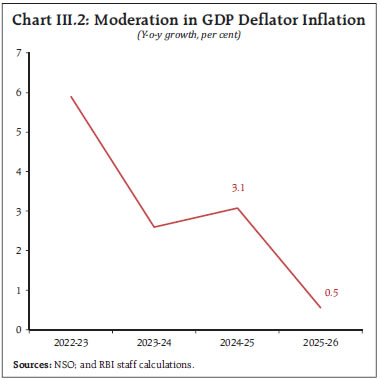
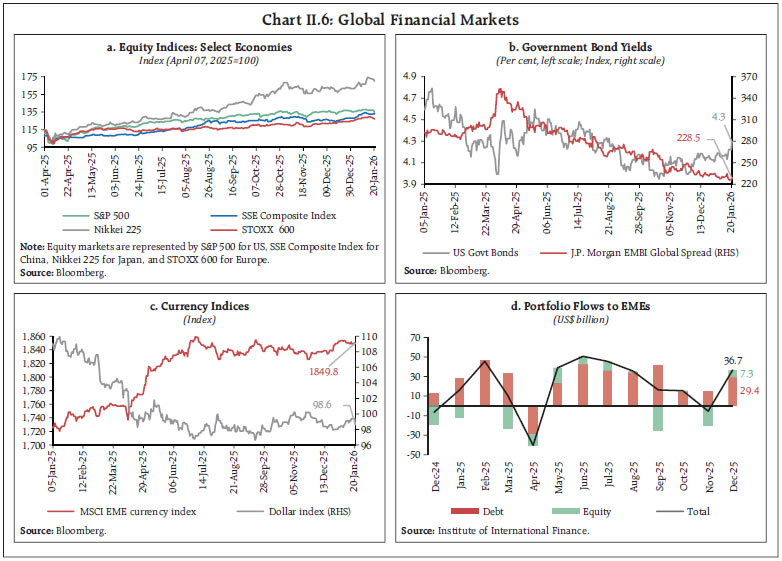 The US dollar depreciated through most of December following the Federal Reserve’s rate cut but rebounded thereafter on a stronger-than-expected Q3 GDP growth print (Chart II.6c). Portfolio flows to emerging markets rose to a four-month high, supported by a weaker US dollar, an improved outlook for Asia, and investor diversification away from the US assets (Chart II.6d). In December 2025, monetary policy actions of systemic central banks exhibited divergence. Among the AEs, the US and the UK lowered policy rates in response to weak labour market conditions, while Japan raised its policy rate to a three-decade high as inflation remained above target. In the case of EMDEs, China, Indonesia, and Brazil kept their policy rates unchanged, whereas Russia, Philippines, Thailand and Mexico undertook rate cuts. In January so far, China, South Korea and Indonesia kept their policy rates unchanged (Chart II.7). III. Domestic Developments The first advance estimates of GDP for 2025-26 underscore the resilience of the Indian economy, with the real GDP recording a robust growth despite persistent global headwinds. On the demand side, PFCE and fixed investment were the key growth drivers. On the supply side, a strong rebound in the manufacturing sector and continued buoyancy in services boosted GVA growth. High-frequency indicators for December suggest a continued buoyancy in growth impulses. Demand conditions remained upbeat, underpinned by a resurgence in rural demand and a gradual recovery in urban demand. Aggregate Demand The Indian economy has demonstrated marked resilience amidst global uncertainties, with real GDP growth estimated at 7.4 per cent in 2025-26, up from 6.5 per cent a year ago.2 In 2025-26, growth in PFCE − the mainstay of aggregate demand − remained broadly steady, while growth in fixed investment improved over the previous year. Government final consumption expenditure also accelerated, further supporting overall growth momentum. PFCE growth was underpinned by sustained rural demand and a gradual recovery in urban demand, part of which may be attributed to the rationalisation of the goods and services tax (GST).3 On the external front, net exports acted as a drag on growth. India’s total exports recorded a modest growth, supported by a steady performance in services, despite merchandise exports weakening following the imposition of steep tariffs by the US.4 Growth in imports, on the other hand, outpaced that in exports, aided in part by base effects (Chart III.1 and Annex Table A1). Notwithstanding the robust real GDP growth in 2025-26, the nominal GDP growth registered a five-year low of 8.0 per cent. The narrowing of the gap between nominal and real GDP growth was reflected in the fall in GDP deflator inflation, which dipped to its lowest level in 2025-26 (Chart III.2). Economic activity continued to register a strong growth in December. E-way bill generation continued to record healthy growth, supported by GST rate rationalisation, alongside stock clearance and firms’ efforts to meet year-end sales targets. Growth in GST revenue collections was primarily driven by higher import-related GST receipts.5 Petroleum consumption registered a pick-up in growth owing to the elevated travel and logistics activity during the month.6 Electricity demand recovered, with the winter-related demand gaining traction. Digital payments sustained strong robust growth in both value and volume terms (Table III.1). 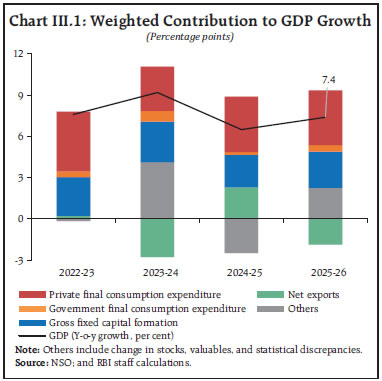
 Overall demand conditions remained upbeat in December. Indicators of rural demand regained momentum with retail automobile sales recording broad-based growth across categories. An increase in automobile sales was driven by enhanced affordability following GST rate cuts, year-end promotional offers, and increased demand ahead of expected price revisions in January. Retail sales of two-wheelers and tractors posted strong growth supported by increase in minimum support prices for rabi crops and GST rationalisation. Retail passenger vehicle sales stood out, marking the strongest growth in 14 months. Domestic air passenger traffic, however, recorded a decline, partly due to dense winter fog and disruption in flight schedules in early December (Table III.2). 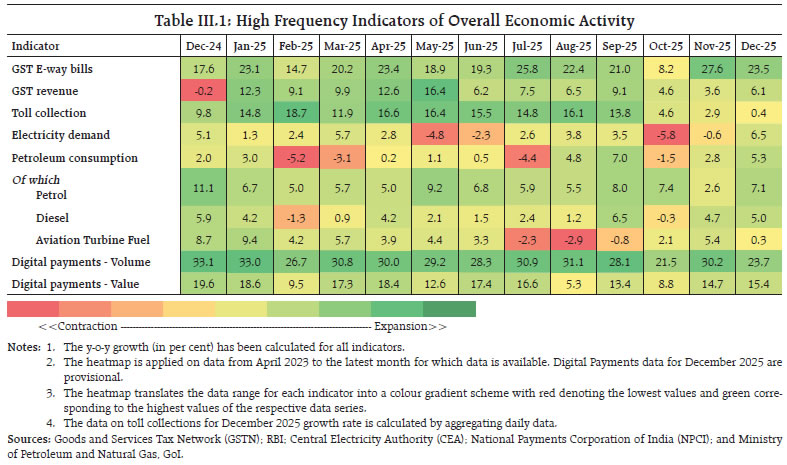 As per the Periodic Labour Force Survey (released on January 16, 2026), the all-India unemployment rate showed a slight uptick in December, with rural rate being steady and the urban rate edging up. Labour force participation rate continued with its upward trend seen since June. PMI employment for manufacturing moderated in December but remained in the expansionary zone, while PMI employment in services witnessed a contraction for the first time in three-and-a-half years.7 The Naukri JobSpeak Index registered a healthy growth in December led by fresh hiring especially in non-IT sectors like insurance, hospitality, and business process outsourcing. Demand for work under the Mahatma Gandhi National Rural Employment Guarantee Scheme (MGNREGS) remained in contraction for the sixth consecutive month in December, pointing to sustained improvement in rural labour market conditions (Table III.3). 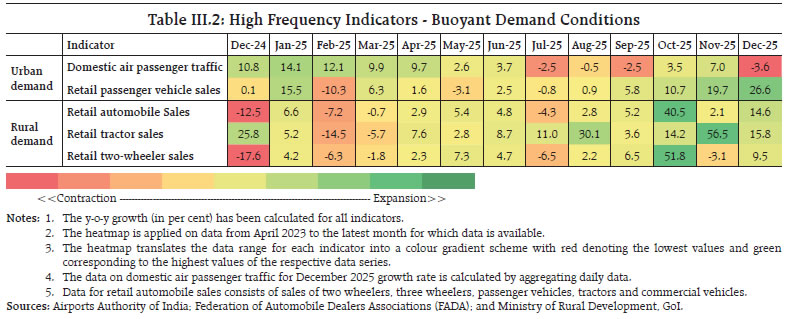 In December, the government introduced the Viksit Bharat–Guarantee for Rozgar and Ajeevika Mission Gramin (VB-G RAM G) Act, replacing the MGNREG Act, 2005. The Act provides an enhanced statutory guarantee of 125 days of unskilled manual wage-employment per rural household annually, while strengthening livelihood security through outcome-linked creation of rural assets. During April-November 2025, the key deficit indicators of the Centre, as per cent of budget estimates (BE), were higher than the same period last year (Chart III.3a).8 The higher fiscal deficit was on account of a deceleration in revenue receipts alongside robust growth in capital expenditure.9 Gross tax revenue growth moderated, driven by a slowdown in direct tax collections and a marginal contraction in indirect tax collections.10 The deficit indicators of states during April-November 2025, as a proportion of BE for the financial year, remained lower than the same period last year (Chart III.3b). This improvement was a result of moderation in revenue expenditure relative to their budget estimates. In contrast, growth in capital expenditure recorded a turnaround from last year’s contraction, leading to an improvement in the quality of expenditure. Within revenue receipts, States’ goods and service tax collections grew at a slower pace than last year, while grants from the Centre declined. Trade During the year so far (April-December), the merchandise trade deficit was higher than that of last year, primarily driven by petroleum products, electronic goods and gold.11 India’s merchandise exports and imports during this period witnessed a broad-based expansion.12 In December, the merchandise trade deficit widened on account of a higher growth of imports than exports (Chart III.4).13 While gold imports declined in December, silver imports recorded a double-digit growth. Exports to China continued to be in double digits, supported by exports of marine products and iron ore in December.14 The US has announced an additional 25 per cent tariff on countries continuing to trade with Iran. Iran has less than 0.5 per cent share in India’s exports as well as in imports in 2024-25.15 After the imposition of a 50 per cent tariff by the US in end-August, India’s exports to the US declined in the subsequent months, except for November 2025.
Net services exports grew in November with exports accelerating and imports declining (Chart III.5).16 Services exports growth increased in November, primarily due to rise in business, computer, and transport services exports. Services imports contracted, mainly due to a fall in imports of business and transportation services. Aggregate Supply On the supply side, growth in real GVA at basic prices is estimated to firm up to 7.3 per cent in 2025-26 from 6.4 per cent in 2024-25. This acceleration was propelled by a buoyant services sector and improved activity in the industrial sector despite some moderation in the agricultural sector (Chart III.6 and Annex Table A2). Industrial sector picked up pace, supported by a strong performance in manufacturing. Momentum in the services sector was sustained, with financial, real estate, and professional services driving the overall growth. Agriculture and allied activities witnessed a moderation in growth.
Agriculture The rabi sowing season is nearing completion, and higher acreage is reported across all major crops so far.17 Strong progress in rabi sowing has been supported by favourable rainfall in the post-monsoon season.18 In the top five rabi-producing states − Uttar Pradesh, Madhya Pradesh, Punjab, Haryana, and Rajasthan − a combination of lower temperature and adequate soil moisture has created a conducive environment for crop growth (Chart III.7).19 For kharif marketing season 2025-26 so far, the procurement of rice is higher than the last year.20 Consequently, the combined public stock of rice and wheat with the government remains adequate to meet any contingency going forward.21 Monthly Indicators of Industrial Activity In November, growth in industrial activity, as measured by the year-on-year (y-o-y) change in the Index of Industrial Production (IIP), jumped to a 25-month high, primarily driven by a robust manufacturing growth. Mining sector also rebounded after two consecutive months of contraction. The index of eight core industries posted a four month high growth in December, led by strong growth in steel and cement and turnaround in electricity generation. High-frequency indicators of industrial activity remained strong in December. Automobile production experienced accelerated growth across segments in December, underpinned by a healthy booking pipeline driven by policy support, including income tax relief, GST rationalisation, and easier financing conditions. Tractor production also surged in view of buoyant sales propelled by improved cash flows from strong kharif output. Electricity generation, which had contracted for two consecutive months, recovered in December. The manufacturing PMI remained in expansion despite some deceleration due to slower expansion in new orders and output (Table III.4). India has been making rapid progress towards clean energy transition. Installed power capacity has increased by nearly 36 per cent over the past five years, largely driven by the expansion of renewable energy. In 2025, India recorded its highest-ever annual addition to renewable energy capacity, primarily led by a surge in solar installations (Chart III.8). Additionally, the introduction of the Sustainable Harnessing and Advancement of Nuclear Energy for Transforming India (SHANTI) Bill22, 2025 along with the Nuclear Energy Mission is expected to boost nuclear power capacity to 100 GW by 2047 while enabling limited private participation in the nuclear energy sector under regulatory oversight.
Monthly Indicators of Services Activity India’s services sector continued to exhibit healthy expansion in December. Retail commercial vehicles sales sustained strong growth due to improved goods movement and underlying economic activity. Port cargo traffic also maintained the growth momentum [Table III.5]. Inflation Headline inflation23 rose for the second consecutive month in December after reaching the lowest level in the current CPI series (2012=100) in October. It rose to 1.3 per cent in December, driven by a lower rate of deflation in food group along with an increase in core (i.e., CPI excluding food and fuel) inflation [Chart III.9].24 Food prices remained in deflation for the fourth consecutive month, though the rate of deflation eased.25 Within food group, prices declined for cereals, pulses, spices, and vegetables on a y-o-y basis. Inflation in sub-groups such as fruits, non-alcoholic beverages, prepared meals and oils and fats moderated, while that in egg, meat and fish, milk and products, and sugar edged up (Chart III.10). Fuel and light inflation moderated to 2.0 per cent in December from 2.3 per cent in November, mainly due to favourable base effects. This was driven by a decrease in inflation of kerosene-PDS and LPG. Core inflation increased to 4.6 per cent in December from 4.3 per cent in the previous month. Inflation eased in clothing and footwear, health, household goods and services, transport and communication, housing, recreation and amusement, and education while it picked up in personal care and effects, driven by rising gold prices. Excluding precious metals, core inflation was at 2.3 per cent in December, the same as in November. In terms of spatial distribution, inflation in both urban and rural areas firmed up in December.26 Across states/UTs, inflation varied from (-) 4.2 per cent to 9.5 per cent, with the majority of states continuing to record inflation below 2 per cent. Overall, a broad-based rise in inflation was observed, with 26 states/ UTs recording an uptick in inflation (Chart III.11). High-frequency food price data for January so far (up to 19th) point towards a softening in cereal prices. Among pulses, a broad-based moderation in prices is observed across gram, moong and tur/arhar dal. Within edible oils, sunflower oil and groundnut oil prices increased. Within vegetables, onion prices picked up while potato prices eased further (Chart III.12). 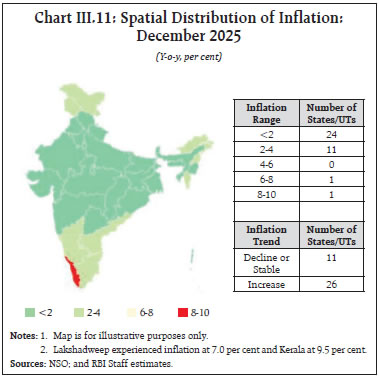

| Table III.6: Petroleum Products Prices | | Item | Unit | Domestic Prices | Month-over-month (Percent) | | Jan-25 | Dec-25 | Jan-26^ | Dec-25 | Jan-26^ | | Petrol | ₹/litre | 101.0 | 101.1 | 101.2 | 0.0 | 0.0 | | Diesel | ₹/litre | 90.5 | 90.5 | 90.5 | 0.0 | 0.0 | | Kerosene (subsidised) | ₹/litre | 43.9 | 48.6 | 45.1 | 5.9 | -7.4 | | LPG (non-subsidised) | ₹/cylinder | 813.3 | 863.3 | 863.3 | 0.0 | 0.0 | ^: For the period January 1-19, 2026.
Note: Other than kerosene, prices represent the average Indian Oil Corporation Limited (IOCL) prices in four major metros (Delhi, Kolkata, Mumbai and Chennai). For kerosene, prices denote the average of the subsidised prices in Kolkata, Mumbai and Chennai.
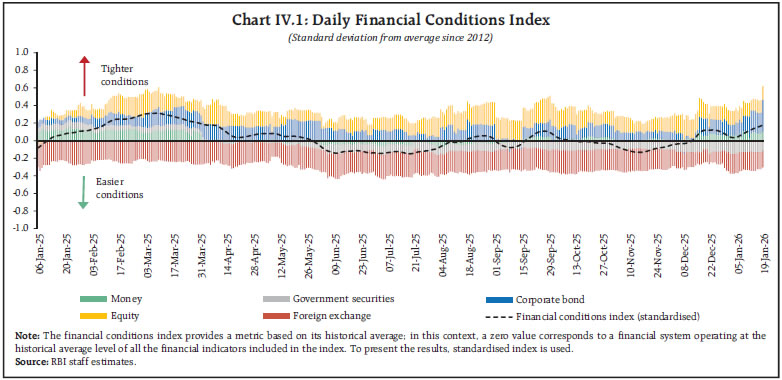
Sources: IOCL; Petroleum Planning and Analysis Cell (PPAC); and RBI staff calculations. | Retail selling prices of petrol, diesel and LPG remained unchanged in January 2026 (up to 19th) while it declined for Kerosene (Table III.6). In December, both manufacturing and services PMI witnessed an increase in the rate of expansion of input prices. While the output price inflation for manufacturing firms softened, it increased for services (Chart III.13). IV. Financial Conditions Financial conditions exhibited two-way movement since the second half of December (Chart IV.1). The banking system’s liquidity transitioned from surplus to deficit during the second half of December, due to a buildup in government cash balances resulting from advance tax and GST-related payments. To assuage the transient liquidity tightness, the Reserve Bank conducted variable rate repo (VRR) auctions.27 The Reserve Bank also announced fresh open market operations (OMOs) comprising purchase auctions amounting to ₹2 lakh crore and 3-year USD/INR Buy/Sell Swap auction of USD 10 billion.28 From end-December to January (up to 19th), system liquidity again turned into surplus as a result of faster government spending and RBI’s durable liquidity operations. 
 Overall, average net absorption under the liquidity adjustment facility stood at ₹0.21 lakh crore during December 16, 2025 – January 19, 2026, in comparison to net absorption of ₹1.90 lakh crore in the preceding one-month period (Chart IV.2). Average balances under the standing deposit facility declined, and banks’ recourse to the marginal standing facility increased marginally.29 Money Market The weighted average call rate (WACR) generally hovered within the policy corridor during December and January (up to January 19th). It remained above the policy repo rate in the second half of December and January (up to January 19th). On December 31st, it rose above the MSF rate with the usual quarter-end tightness compounded by the fortnightly reserve maintenance requirements. On average, the WACR was higher at 5.4 per cent during December 16, 2025 to January 19, 2026, compared with the preceding one-month period (Chart IV.3a). Overnight rates in the collateralised segments – as measured by the benchmark secured overnight rupee rate (SORR)–moved in tandem with the uncollateralised rate. Yields on three-month treasury bills averaged lower while those on three-month commercial papers issued by non-banking financial companies edged up during this period. The interest rate on three-month certificate of deposits also edged up on account of an expected increase in supply amidst a pick-up in credit growth (Chart IV.3b).30 The average risk premium in the money market (the spread between the yields on 3-month commercial paper and 91-day treasury bill) witnessed an uptick.31 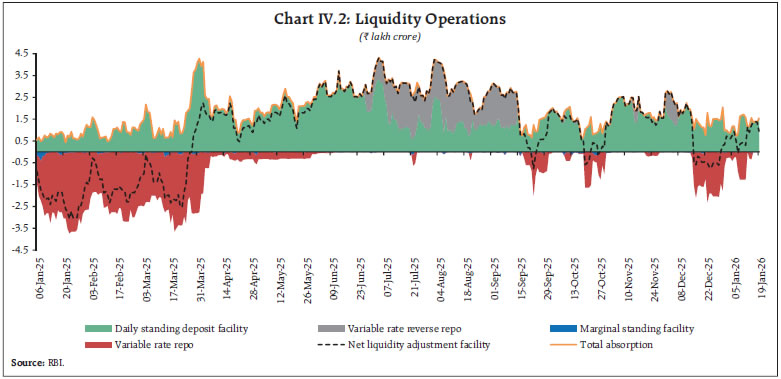 Government Securities (G-Sec) Market In the fixed income segment, G-Sec yields hardened for most of December and January so far (up to 19th) amidst dimming market expectations of further rate cuts. A brief softening, however, followed the announcement of OMO purchases by the Reserve Bank on December 23, 2025 (Chart IV.4a).32 Compared to December 16, 2025 the yield curve (as on January 19, 2026) has risen across tenors (Chart IV.4b). Corporate Bond Market Corporate bond yields hardened across tenors and the rating spectrum. Consequently, their spread over government securities widened (Table IV.1). New corporate bond issuances decreased in November compared to October. On a cumulative basis, total issuances were marginally higher in the current financial year so far than in the same period last year.33
Money and Credit Reserve money growth (adjusted for CRR) for the fortnight ending January 15, 2026, moderated although currency in circulation recorded an accelerated pace of expansion.34 For the fortnight ending December 31, 2025, growth (y-o-y) in money supply picked up as compared to the previous fortnight, driven by higher aggregate deposits and currency with the public (Chart IV.5).35 Credit and deposit growth of scheduled commercial banks (SCBs) recorded a pronounced increase in December (Chart IV.6).36 | Table IV.1: Corporate Bonds Yields Hardened | | Instrument | Interest Rates (Per cent) | Spread (bps) | | (Over Corresponding Risk-free Rate) | | November 16, 2025 – December 15, 2025 | December 16, 2025 – January 16, 2026 | Variation | November 16, 2025 – December 15, 2025 | December 16, 2025 – January 16, 2026 | Variation | | 1 | 2 | 3 | (4 = 3-2) | 5 | 6 | (7 = 6-5) | | (i) AAA (1-year) | 6.82 | 7.13 | 31 | 123 | 152 | 29 | | (ii) AAA (3-year) | 7.01 | 7.20 | 19 | 107 | 123 | 16 | | (iii) AAA (5-year) | 7.17 | 7.35 | 18 | 77 | 80 | 3 | | (iv) AA (3-year) | 8.01 | 8.18 | 17 | 207 | 221 | 14 | | (v) BBB- (3-year) | 11.66 | 11.79 | 13 | 573 | 582 | 9 | Note: Yields and spreads are computed as averages for the respective periods.
Source: FIMMDA. |  During 2025-26 so far (up to December 31), total flow of financial resources to the commercial sector increased to ₹30.8 lakh crore from ₹21.3 lakh crore a year ago (Table IV.2a). Non-bank sources − corporate bond issuances, and foreign direct investment to India − showed a marked increase during the year so far. As on December 31, 2025, the total outstanding credit to the commercial sector rose by 15.0 per cent, with non-bank sources registering a growth of 16.4 per cent (Table IV.2b). 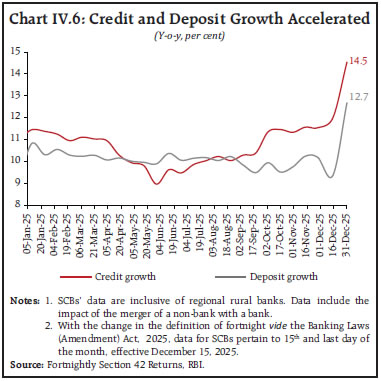
| Table IV.2a: Flow of Financial Resources to the Commercial Sector | | (₹ lakh crore) | | Source | April-March | Up to December 31 | | 2023-24 | 2024-25 | 2024-25 | 2025-26 P | | A. Non-Food Bank Credit | 21.40 | 17.98 | 12.78 | 20.27 | | B. Non-Bank Sources (B1+B2) | 12.64 | 17.10 | 8.55 | 10.58 | | B1. Domestic Sources | 10.20 | 13.86 | 6.43 | 7.66 | | B2. Foreign Sources | 2.43 | 3.25 | 2.12 | 2.92 | | C. Total Flow of Resources (A+B) | 34.04 | 35.09 | 21.32 | 30.85 | P: Provisional. Notes:
1. Figures in the columns might not add up to the total due to rounding off of numbers.
2. For detailed notes and data, please refer to Current Statistics Table No: 18(a).
Sources: RBI; SEBI; AIFIs; and RBI staff estimates. |
| Table IV.2b: Outstanding Credit to the Commercial Sector | | (₹ lakh crore; Figures in parentheses are y-o-y percentage changes) | | Source | At End-March | As on December 31 | | 2024 | 2025 | 2024 | 2025 P | | A. Non-Food Bank Credit | 164.09 | 182.07 | 176.87 | 202.35 | | | (20.2) | (11.0) | (11.1) | (14.4) | | B. Non-Bank Sources (B1+B2) | 77.56 | 88.85 | 82.14 | 95.58 | | | (4.2) | (14.6) | (11.7) | (16.4) | | B1. Domestic Sources | 56.59 | 66.37 | 60.21 | 71.62 | | | (4.9) | (17.3) | (14.8) | (18.9) | | B2. Foreign Sources | 20.97 | 22.48 | 21.93 | 23.96 | | | (2.4) | (7.2) | (4.2) | (9.2) | | C. Total Credit (A+B) | 241.65 | 270.93 | 259.01 | 297.93 | | | (14.5) | (12.1) | (11.3) | (15.0) | P: Provisional. Notes: 1. Figures in the columns might not add up to the total due to rounding off of numbers.
2. Data on non-bank sources excludes issuances of equities and hybrid instruments under domestic sources and foreign direct investment in equities under foreign sources.
3. Flows based on outstanding data may not tally with the flows provided in Table IV.2a due to:
(a) Merger of HDFC Limited with HDFC Bank on July 1, 2023;
(b) Conversion of some Housing Finance Companies into Non- Banking Financial Companies; and
(c) Valuation effect in case of foreign sources.
4. For detailed notes and data, please refer to Current Statistics Table No: 18(b).
Sources: RBI; SEBI; AIFIs; and RBI staff estimates. | Overall non-food bank credit37 growth (year-over-year) remained largely robust in November (Chart IV.7). Industrial credit growth eased marginally, with credit to large industries remaining stable. Credit growth (y-o-y) in the micro, small, and medium enterprises (MSME) sector continued to be in double digits in November. The credit to the services sector registered double-digit growth (year-over-year), albeit at a moderate pace compared to the previous month. Within the services sector, although bank lending to NBFCs eased, segments such as trade remained buoyant. Growth in personal loans softened, driven largely by a deceleration in the housing and credit card segments. Vehicle loans, however, continued to witness steady expansion. Deposit and Lending Rates In response to the cumulative 100 basis points reduction in the policy repo rate during February–November 2025, banks reduced their repo-linked external benchmark-based lending rates (EBLRs) by the same magnitude. The marginal cost of funds-based lending rate (MCLR) of banks also moderated. The weighted average lending rates on both fresh and outstanding rupee loans declined during this period. On the deposit side, banks reduced interest rates on fresh term deposits significantly. The pass-through to the interest rates on outstanding deposits was gradual, reflecting the effect of longer tenor of term deposits at fixed rates (Table IV.3). 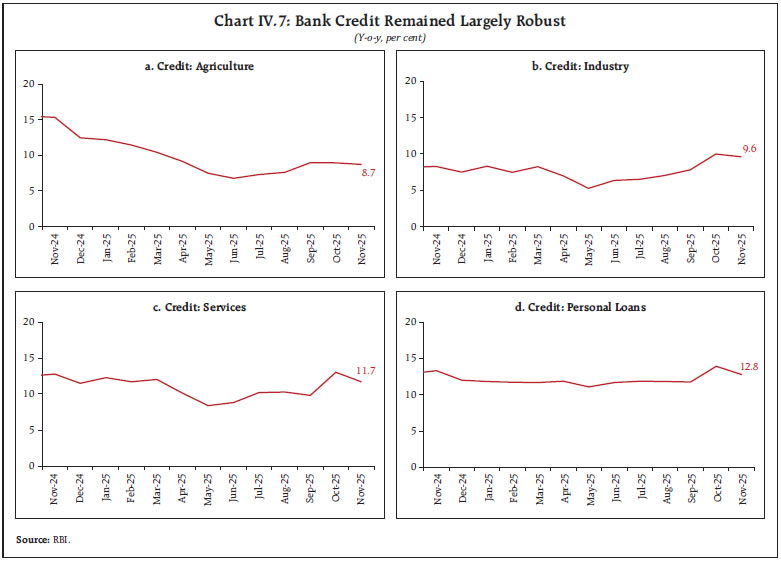
| Table IV.3: Transmission to Banks’ Deposit and Lending Rates | | (basis points) | | | | Term Deposit Rates | Lending Rates | | Period | Repo Rate | WADTDR- Fresh Deposits | WADTDR- Outstanding Deposits | EBLR | 1-Year MCLR (Median) | WALR - Fresh Rupee Loans | WALR- Outstanding Rupee Loans | | Overall | Interest Rate Effect# | | (1) | (2) | (3) | (4) | (5) | (6) | (7) | (8) | (9) | | Tightening Period May 2022 to Jan 2025 | 250 | 259 | 206 | 250 | 175 | 182 | 191 | 115 | | Easing Phase Feb 2025 to Nov 2025 | -100 | -103 | -36 | -100 | -50 | -62 | -82 | -66 | #: Calculated at January 2025 weights.
WALR: Weighted average lending rate; WADTDR; Weighted average domestic term deposit rate.
MCLR: Marginal cost of funds-based lending rate; EBLR: External benchmark-based lending rate.
Note: Data on EBLR pertain to 32 domestic banks.
Source: RBI. | The decline in the weighted average lending rate on fresh and outstanding rupee loans was higher in the case of private banks relative to public sector banks (Chart IV.8). On the deposit side, transmission was higher for public sector banks compared to private banks in case of fresh term deposits. The union government reviewed the interest rates on various small savings instruments, which are linked to secondary market yields on G-secs of comparable maturities and kept them unchanged for Q4:2025-26. The prevailing rates on these instruments exceed their formula-based rates. Equity Markets Indian equity markets exhibited bidirectional movements in December 2025 amidst caution surrounding the India-US trade deal and the Rupee’s depreciation against the US dollar. Positive global cues, including the US Federal Reserve’s policy rate cut, the conclusion of the India-New Zealand free trade agreement, and renewed AI optimism, provided support. The metals sector registered maximum gains due to robust domestic GDP growth, rising global metal prices, and the imposition of a three-year safeguard duty on select steel imports by the Government. Strong buying by domestic institutional investors (DIIs) provided some support to equity markets, amidst persistent selling by foreign portfolio investors (FPIs) (Chart IV.9). In January 2026 (up to the 19th), equity markets witnessed renewed downward pressure in the wake of fresh tariff warnings by the US. External Sources of Finance During April-November 2025, foreign direct investment (FDI) remained higher than in the same period last year, both in gross and net terms. Gross inward FDI remained steady in November with Japan, Singapore, and the US accounting for more than 75 per cent of total FDI inflows. The highest recipients (around 75 per cent) of FDI inflows were the financial services sector, followed by manufacturing, and retail and wholesale trade. However, net FDI remained negative in November for the third consecutive month, mainly due to high repatriation. Outward FDI moderated in November, with Singapore, Mauritius, the US and the UK accounting for more than half of total outward FDI (Chart IV.10). Sector-specific breakdown suggests that more than 70 per cent of outward FDI was in manufacturing, financial, insurance, and business services. During 2025-26 so far (up to January 16), net FPI registered outflows, driven by the equity segment.38 The uncertainty surrounding the India-US trade deal and the weakening of the rupee have kept net FPI flows to India muted in recent months (Chart IV.11). After a brief phase of net inflows in October and November, FPIs registered net outflows of US$4.2 billion in December. Debt flows also turned negative in December after a five-month period.
The registrations and net inflows of external commercial borrowings (ECBs) moderated during April-November 2025 compared to the same period a year ago, reflecting a broader slowdown in offshore fundraising activity (Chart IV.12).39 A significant portion40 of the ECB funds was mobilised for capital expenditure purposes. India’s external sector continues to be resilient as evident in the latest key external vulnerability indicators as at end-September 2025. Debt service ratio and net international investment position (IIP)-to-GDP ratio improved, and the external debt-to-GDP ratio remained below 20 per cent (Chart IV.13). India’s external debt increased by US$ 9.6 billion to US$ 746.0 billion at end-September 2025 from end-March 2025, while it declined by US$ 0.7 billion from US$ 746.7 billion at end-June 2025.
India’s foreign exchange reserves remain comfortable, providing cover for more than 11 months of goods imports and a cover for around 92 per cent of the external debt outstanding (Chart IV.14).41
India’s net IIP improved during Q2:2025-26 (Chart IV.15).42 This improvement was driven by the combined impact of decrease in foreign-owned assets in India and increase in Indian residents’ overseas financial assets.43 Foreign Exchange Market The Indian rupee (INR) depreciated against the US dollar in December, pressured by foreign portfolio outflows and uncertainty surrounding the India-US trade deal (Chart IV.16). The volatility of the INR, as measured by the coefficient of variation, remained relatively lower than that of most major currencies. In January so far (up to 19th), the INR depreciated by 1.2 per cent over its end-December level. In real effective terms, the Indian rupee depreciated in December due to depreciation of INR in nominal effective terms and relatively lower inflation in India vis-à-vis its major trading partners (Chart IV.17).
V. Conclusion The year 2026 began with an escalation of geopolitical tensions, marked by developments such as the US intervention in Venezuela, the simmering conflict in the Middle East, ambiguity surrounding the Russia–Ukraine peace deal, and escalation of the row over Greenland, all of which point to still-elevated geo-economic risks and policy uncertainty ahead. Even amidst these global uncertainties, the current state of the economy provides ground for optimism going forward. The GDP growth estimates for 2025-26 indicate that India will remain the fastest-growing major economy in the world. India has made significant efforts to diversify and strengthen its exports, aiming to mitigate external sector risks. The country is currently engaged in trade negotiations with 14 countries or groups, representing nearly 50 nations, including the European Union, Gulf Cooperation Council countries, and the United States.44 The month of December saw India concluding trade negotiations with New Zealand and Oman. The year 2025 also witnessed major economic reforms, including the rationalisation of tax structures, implementation of labour codes for labour market reforms, and financial sector deregulation, all of which are expected to strengthen the growth prospects.45 The Reserve Bank’s Report on Trend and Progress of Banking in India 2024-25 underscored the resilience of the banking system, supported by strong capital buffers, improved asset quality, and robust profitability. Macro stress test results from the latest Financial Stability Report released in December 2025, affirmed the resilience of banks and non-banking financial companies to withstand losses under adverse scenarios and maintain capital buffers well above the regulatory minimum. Going forward, the policy focus on striking a balance between innovation and stability, consumer protection, and a prudent approach to regulation and supervision should help improve productivity and support long-term economic growth.
Annex | Table A1: Real GDP Growth | | (Y-o-y, per cent) | | Components | Share in 2025-26
(Per cent) | Weighted Contribution (in percentage points) | 2023-24
(FRE) | 2024-25
(PE) | 2025-26
(FAE) | 2024-25
(PE) | 2025-26
(FAE) | | I. Total Consumption Expenditure | 65.2 | 4.3 | 4.5 | 5.9 | 6.5 | 6.8 | | Private | 56.3 | 4.0 | 4.0 | 5.6 | 7.2 | 7.0 | | Government | 8.9 | 0.2 | 0.5 | 8.1 | 2.3 | 5.2 | | II. Gross Capital Formation | 36.7 | 2.5 | 2.6 | 10.5 | 6.7 | 7.0 | | Fixed Investment | 33.8 | 2.4 | 2.6 | 8.8 | 7.1 | 7.8 | | III. Net Exports | -2.5 | 2.3 | -1.9 | -384.8 | 71.5 | -217.8 | | Exports | 21.4 | 1.4 | 1.4 | 2.2 | 6.3 | 6.4 | | Imports | 24.0 | -0.9 | 3.2 | 13.8 | -3.7 | 14.4 | | IV. GDP | 100.0 | 6.5 | 7.4 | 9.2 | 6.5 | 7.4 | Notes: Components may not add up to total due to other remaining items.
FRE: First revised estimates; PE: Provisional estimates; FAE: First advance estimates.
Sources: NSO; and RBI staff calculations. |
| Table A2: Real GVA Growth | | (Y-o-y, per cent) | | Sectors | Share in 2025-26
(Per cent) | Weighted Contribution (in percentage points) | 2023-24
(FRE) | 2024-25
(PE) | 2025-26
(FAE) | 2024-25
(PE) | 2025-26
(FAE) | | I. Agriculture and allied activities | 13.8 | 0.7 | 0.4 | 2.7 | 4.6 | 3.1 | | II. Industry | 21.2 | 1.0 | 1.2 | 11.0 | 4.5 | 5.8 | | Mining and quarrying | 1.8 | 0.1 | 0.0 | 3.2 | 2.7 | -0.7 | | Manufacturing | 17.1 | 0.8 | 1.2 | 12.3 | 4.5 | 7.0 | | Electricity, gas, water supply and other utility services | 2.2 | 0.1 | 0.0 | 8.6 | 5.9 | 2.1 | | III. Services | 65.0 | 4.8 | 5.7 | 9.2 | 7.5 | 8.8 | | Construction | 9.1 | 0.8 | 0.6 | 10.4 | 9.4 | 7.0 | | Trade, hotels, transport, communication, and services related to broadcasting | 18.5 | 1.1 | 1.4 | 7.5 | 6.1 | 7.5 | | Financial, real estate and professional services | 24.4 | 1.7 | 2.4 | 10.3 | 7.2 | 9.9 | | Public administration, defence and other services | 13.0 | 1.1 | 1.3 | 8.8 | 8.9 | 9.9 | | IV. GVA at basic prices | 100.0 | 6.4 | 7.3 | 8.6 | 6.4 | 7.3 | Note: FRE: First revised estimates; PE: Provisional estimates; FAE: First advance estimates.
Sources: NSO; and RBI staff calculations. |
|