The conflict in West Asia has intensified pressures on the global supply chains in March with some easing observed in the first half of April. Domestic economic activity displayed resilience in many segments with slowdown in a few others. CPI inflation, driven by fuel and food, marginally edged up in March. The money market and bond yields moderated after the temporary ceasefire in West Asia. A slowdown in imports and expansion in exports narrowed trade deficit to a nine-month low. Foreign portfolio investment (FPI) flows remained volatile, although net foreign direct investment (FDI) turned positive in February. Introduction The resilience of the global economy, already inflicted with trade tensions, is being tested by the conflict in West Asia. The near halt in tanker movements through the Strait of Hormuz has intensified pressures in the global supply chains. The durability and intensity of the conflict pose substantial uncertainty to the global growth prospects amidst broader supply chain disruptions and elevated energy prices. Global economic activity moderated to an 11-month low as momentum weakened across manufacturing and services sectors. Global commodity prices, barring precious metals, surged sharply with the upturn becoming broad-based. Crude oil prices touched multi-year high of US$ 118.4 per barrel on March 31 and remain high.1 More recently, a two-week ceasefire between the US and Iran in early April eased tensions to an extent and brought commodity prices down from their recent peaks, although they continue to be elevated. Consumer sentiments have plummeted due to concerns over higher prices eroding purchasing power and weaker asset valuations.2 Business optimism too fell to a five-month low in March, one of its weakest levels since the pandemic in 2020.3 The International Monetary Fund (IMF) has projected a moderation in global growth in 2026 alongside an increase in inflation. The growth slowdown and inflationary pressures are expected to be more pronounced in emerging market and developing economies (EMDEs).4 Financial markets adequately priced in these turbulent developments. Global equity indices declined across major economies amidst heightened uncertainty. A partial recovery was seen in early April on a temporary ceasefire. Bond yields, especially in the US, hardened in March on persistent inflationary concerns, while emerging market bond yield spreads widened. Portfolio flows to emerging markets declined sharply in March, marking the biggest outflow since the pandemic. Inflation pressures firmed up across major advanced economies (AEs) in March and central banks predominantly held rates steady in the face of heightened uncertainty. Domestic high-frequency indicators for March, in general, do not reflect much adverse impact of the global supply chain bottlenecks as some of the key risks have been contained by the Government, ensuring uninterrupted availability of petroleum products across the country. Overall demand conditions remained resilient with greater support from rural areas. Automobile sales and vehicle registrations remain strong with GST relief still playing out. Logistics indicators such as e-way bill generation, and petrol and diesel consumption, recorded robust growth during the month. Early signs of deceleration are, however, evident in select indicators like port cargo, air passenger traffic and the outlook of purchasing managers. The manufacturing PMI, albeit in expansionary zone, declined to its lowest level in nearly four years. Cost pressures and uncertainty took a toll on new orders and output, which grew at the slowest rates since mid-2022. The services PMI showed resilience, although, its pace of expansion slowed to a 14-month low, reflecting softening in new business. The index of eight core industries also declined, marking its 19-month low, driven by a decline in production of fertilisers, crude oil, coal, and electricity. As regards agriculture, favourable summer sowing for pulses, oilseeds and coarse cereals offset the decline in rice amidst concerns over input supplies following the war in West Asia. The reservoir storage levels remain sufficient for the ongoing summer season. The current public foodgrain stocks also remain well above the buffer norms to meet any contingency requirements. However, the likelihood of below-normal rainfall during the south-west monsoon due to possible El Niño conditions, poses downside risk to agricultural output. Trade deficit narrowed in March falling to a nine-month low. On a sequential basis, exports expanded, while imports contracted in March 2026. The conflict in West Asia led to a decline in exports and imports from the region. Despite the energy shock from West Asia, headline consumer price index (CPI) inflation for March showed a muted increase, accompanied by a rise in fuel inflation driven by an increase in domestic LPG prices and a pick up in food inflation. Wholesale inflation too, driven by rising costs of fuel and power, climbed up in March for the fifth consecutive month. Swift supply management by the Government to tackle the supply side bottlenecks helped in containing inflationary pressures.5 In the fast evolving backdrop, the Monetary Policy Committee kept the policy rate unchanged in its April 2026 meeting and retained a “neutral” stance to retain flexibility to respond to incoming data. System liquidity, after moderating in the second half of March amidst tax outflows, improved in April as pressure from tax outflows waned and government spending picked up. Reflecting the liquidity conditions, the weighted average call rate (WACR) moved below the repo rate in April. Yields on treasury bills, after inching up in the second half of March, softened in April. Yields on commercial papers and interest rate on certificates of deposit remained elevated in March, before easing significantly in April. The yields on dated government securities hardened in March and continued to remain elevated in April, partly mirroring global trends since the breakout of West Asia conflict. Growth in bank credit has been high with improved transmission to interest rates in the current easing cycle. During 2025-26, the total flow of financial resources to the commercial sector increased, with both bank and non-bank sources contributing to the credit pick-up in general. Indian equity markets declined in March amidst persistent uncertainty and selling pressures by foreign portfolio investors (FPIs) before recovering moderately in April on the announcement of temporary ceasefire and moderation in crude oil prices. Net FPI outflows surged in March and the net selling continued into April. India’s net international investment position (IIP) improved during Q3:2025-26 supported by an increase in Indian residents’ overseas financial assets. The Rupee depreciated in March, but the announcement of temporary ceasefire and RBI’s measures aimed at curtailing speculative arbitrage positions between onshore and offshore markets provided some support to the currency in early April. India’s key external sector vulnerability indicators remained contained at end-December 2025 and foreign exchange reserves continued to remain comfortable as at April 10, 2026. Set against this backdrop, the rest of the article is structured into four sections. Section II covers the rapidly evolving developments in the global economy. Section III provides an assessment of domestic macroeconomic conditions. Section IV encapsulates financial conditions in India, while Section V presents the concluding observations. II. Global Setting Global growth prospects remained uncertain in a protracted conflict situation in West Asia marked by acute supply shortages. In its latest World Economic Outlook (April 2026), the IMF projected a moderation in global growth in 2026, reflecting the adverse impact of the conflict (Table II.1). Inflation projections were revised upwards, driven by elevated energy prices amidst supply disruptions following the closure of the Strait of Hormuz. The growth slowdown and rising inflationary pressures were projected to be more pronounced across EMDEs. At the same time, growth prospects could strengthen with faster materialisation of productivity gains from artificial intelligence (AI) and a sustained easing of trade tensions. | Table II.1: IMF’s GDP Growth Projections – Select AEs and EMDEs | | (Y-o-y, per cent) | | Projection for | 2026 | 2027 | | Month of Projection | January 2026 | April 2026 | January 2026 | April 2026 | | World | 3.3 | 3.1 | 3.2 | 3.2 | | Advanced Economies | 1.8 | 1.8 | 1.7 | 1.7 | | US | 2.4 | 2.3 | 2.0 | 2.1 | | UK | 1.3 | 0.8 | 1.5 | 1.3 | | Euro area | 1.3 | 1.1 | 1.4 | 1.2 | | Japan | 0.7 | 0.7 | 0.6 | 0.6 | | Emerging Market and Developing Economies | 4.2 | 3.9 | 4.1 | 4.2 | | Russia | 0.8 | 1.1 | 1.0 | 1.1 | | Emerging and Developing Asia | 5.0 | 4.9 | 4.8 | 4.8 | | India# | 6.4 | 6.5 | 6.4 | 6.5 | | China | 4.5 | 4.4 | 4.0 | 4.0 | | Latin America and the Caribbean | 2.2 | 2.3 | 2.7 | 2.7 | | Mexico | 1.5 | 1.6 | 2.1 | 2.2 | | Brazil | 1.6 | 1.9 | 2.3 | 2.0 | | Middle East and Central Asia | 3.9 | 1.9 | 4.0 | 4.6 | | Sub-Saharan Africa | 4.6 | 4.3 | 4.6 | 4.4 | | South Africa | 1.4 | 1.0 | 1.5 | 1.3 | Note: #: India’s data is on a fiscal year basis (April-March), while for all other countries it is for calendar years.
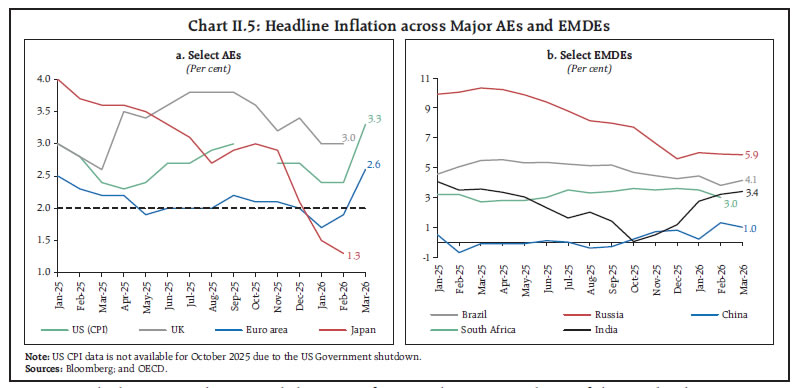
Source: IMF’s World Economic Outlook, April 2026. | As the US-Iran war expanded into a wider regional conflict, the geopolitical risk increased sharply in March (Chart II.1a). Following the intensification of the conflict, financial market volatility surged to an 11-month high during March, before easing in April on reports of a temporary ceasefire (Chart II.1b). Concurrently, disruptions to freight and shipping routes, particularly around the Strait of Hormuz, led to a near standstill in maritime traffic, resulting in an intensification of global supply chain pressures to their highest level since January 2023 (Chart II.1c). The global composite Purchasing Managers’ Index (PMI) moderated to an 11-month low in March, reflecting weaker business optimism and supply chain disruptions. Pace of output expansion eased across both the manufacturing and service sectors. New export orders returned to contraction in March, after expanding in February 2026 for the first time since April 2025 (Table II.2). Business activity saw a broad-based moderation across major AEs and EMDEs (Chart II.2a). Trends in new export orders remained divergent across regions, with orders contracting across most AEs, with the notable exceptions of Australia, Japan and Germany. Among major EMDEs, export orders expanded at a robust pace in India, while they contracted in Russia (Chart II.2b). 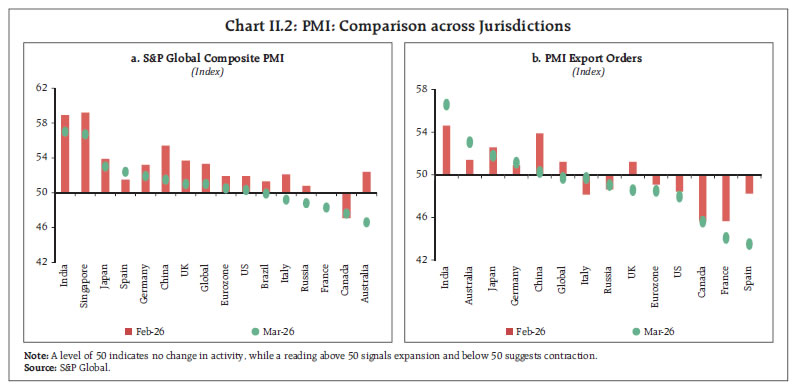 The standstill tanker traffic in the Strait of Hormuz caused a significant disruption in the global supply chains in March. The World Bank Commodity Price Index rose sharply, driven by higher energy and fertiliser prices. The Food and Agriculture Organization’s Food Price Index reflected broad-based inflation across major commodity groups (Chart II.3a). Gold prices, however, softened in March as elevated inflation risks tempered expectations of monetary policy easing, alongside a shift in safe-haven demand towards the US dollar and fixed income assets. In April, gold prices remained volatile, reflecting shifting expectations on policy rates amidst developments in West Asia (Chart II.3b). 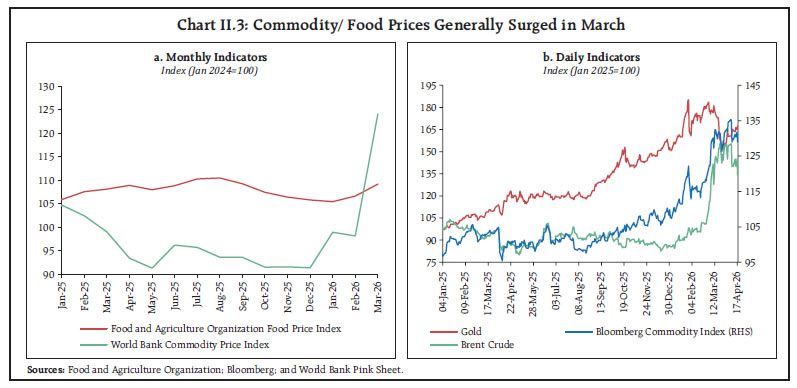 Barring precious metals, commodity prices soared amidst escalation in West Asia conflict, with the upturn becoming increasingly broad-based. The Bloomberg Commodity Index surged in March and remained elevated in early April, driven by sharp increase in energy prices, before witnessing a partial pullback on a temporary ceasefire. Brent crude oil prices rose to a four-year high of US$ 118.4 per barrel on March 31 and remained elevated thereafter despite some decline on account of ceasefire(Chart II.3b). Aluminium prices surged, due to supply shortages triggered by attacks on aluminium smelters in the region. Aviation fuel prices spiked, alongside sharp increase in gasoline and LPG prices, partly reflecting refinery outages. In April, aviation fuel and gasoline prices remained elevated, though LPG prices moderated from their peak. West Asia being the major producer of sulphur and urea, supply disruptions in the region led to a surge in fertiliser prices (Chart II.4). In March, headline inflation increased across major AEs, as disruptions to key shipping routes and surging energy prices renewed supply-side pressures. Among major AEs, inflation in the US and the Euro area accelerated, largely driven by higher energy prices (Chart II.5a). Among major EMDEs, inflation trends remained mixed. Inflation eased in China, while it rose in Brazil due to higher fuel prices (Chart II.5b). In March, global equity markets declined across major economies, amidst heightened uncertainty surrounding the conflict and reduced expectations of policy rate cuts. Notably, Japan recorded significant declines, with earlier gains driven by AI-related optimism which were partly reversed due to profit booking and rising global risk aversion. In April so far, markets recouped part of their earlier losses on signs of de-escalation of the conflict (Chart II.6a). 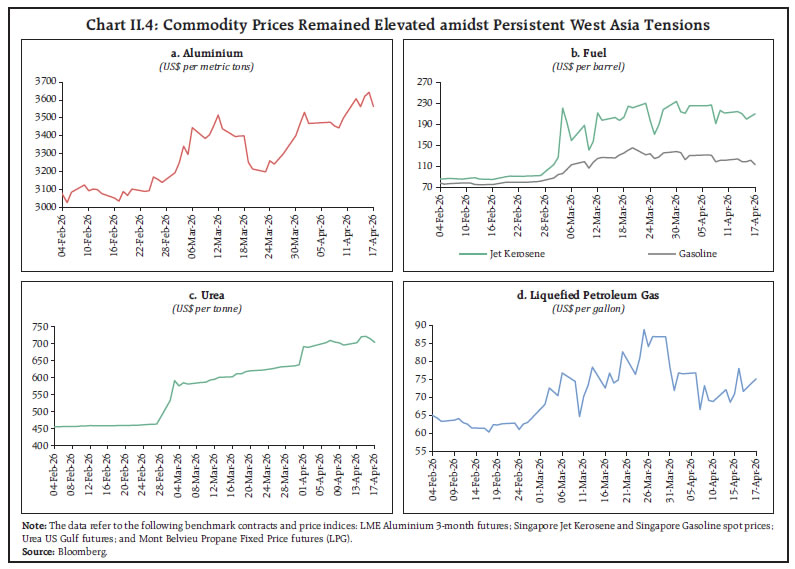
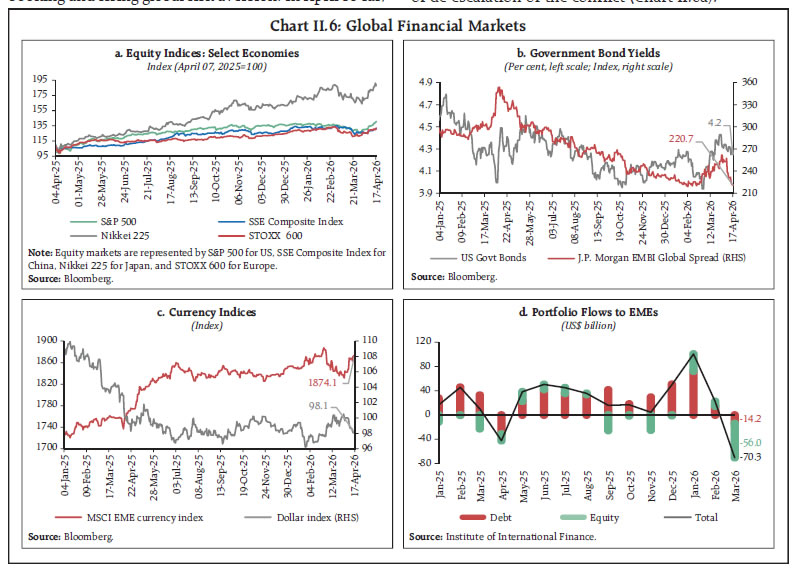 The US 10-year Treasury yields hardened in March despite safe-haven demand, as rate cut expectations diminished amidst rising inflation concerns. Yields softened in April as easing geopolitical tensions and renewed hopes of US–Iran negotiations reduced inflation concerns. The emerging market bond yields spread widened as risk-off sentiment and a stronger US dollar led investors to demand higher compensation for risk. The spread narrowed in April amidst expectations of easing geopolitical tensions (Chart II.6b). The US dollar index strengthened in March on safe-haven demand and higher interest rate expectations, further supported by the lower exposure of the US to oil price shocks. In April, the index softened amidst improving global risk sentiment (Chart II.6c). Portfolio flows to emerging markets weakened in March as investor sentiment deteriorated amidst escalating tensions in West Asia (Chart II.6d). In March, most systemic central banks kept policy rates unchanged, reflecting caution amidst upside risks to inflation and lingering geopolitical uncertainties (Chart II.7). Among AEs, the US, the UK, the Euro area, Japan, Sweden, Switzerland and Canada held rates steady as rising global energy costs clouded the inflation and growth outlook. In contrast, Australia raised its benchmark rate for the second consecutive meeting, as inflation remained above the target band. Among major EMDEs, China, Indonesia, Malaysia, Philippines and South Africa kept their policy rates unchanged, while Russia, Mexico and Brazil cut the rates. In April so far, China, New Zealand, and South Korea kept their policy rates unchanged. III. Domestic Developments The Indian economy continues to hold its ground despite facing a major supply shock due to the conflict in West Asia. In March, available high-frequency indicators of economic activity displayed divergent trends: demand conditions remained resilient, despite some pockets of slowdown in economic momentum. RBI’s forward-looking surveys pointed towards softening consumer confidence on the current situation and moderation in business optimism along with buildup of cost pressures.6 The Monetary Policy Committee (MPC), in its bi-monthly review of April 2026, unanimously voted to keep the policy repo rate unchanged at 5.25 per cent. The MPC also decided to continue with the neutral stance, retaining the flexibility to respond judiciously to incoming information. The decision was guided by the strong fundamentals of the Indian economy, which provided it with a greater resilience to withstand external shocks. Aggregate Demand High-frequency indicators of economic activity exhibited mixed performance in March. E-way bills continued to show double-digit growth supported by GST rate rationalisation reflecting strong goods movement. GST revenue surged, reflecting sustained consumption and improved compliance.7 Petrol and diesel consumption saw an uptick, partly driven by buying amidst fears of supply disruptions. However, overall petroleum consumption moderated, largely on account of a sharp decline in aviation turbine fuel demand due to widespread flight suspensions following the West Asia conflict. Digital payments continued to record robust growth in terms of both transaction value and volume. However, electricity demand remained moderate, primarily due to above-normal rainfall in the first 25 days of March, which reduced cooling requirements. Toll collections continued with the declining trend reflecting the introduction of the FASTag Annual Pass scheme in August 20258 (Table III.1). 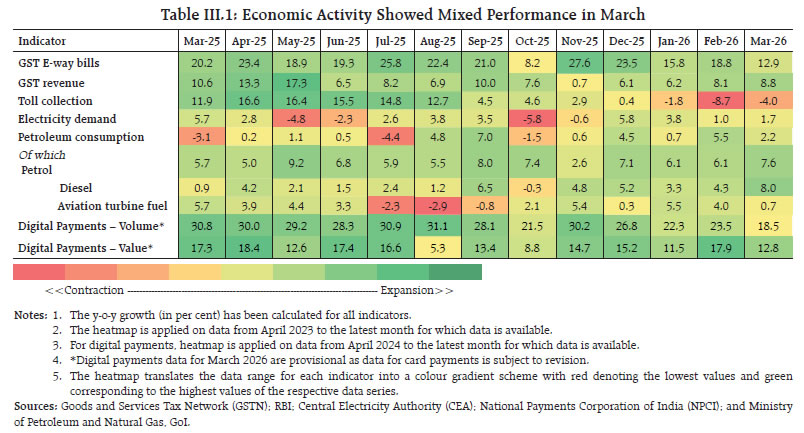
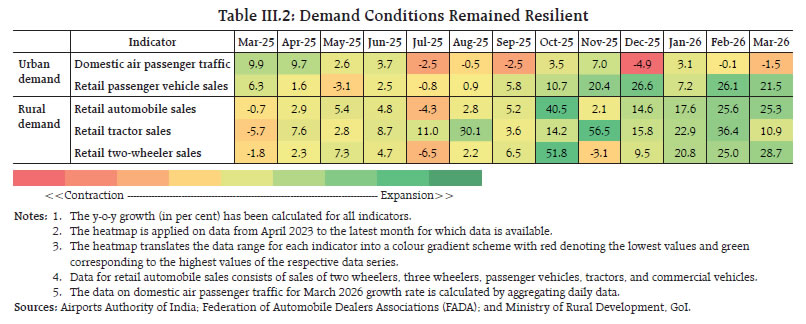 Rural economy played an important role in sustaining the resilience in demand in March. Automobile sales growth was driven by strong retail demand supported by post-GST momentum. Increased electric vehicle (EV) demand, particularly in the two-wheeler segment, also contributed to the overall momentum (Table III.2). Labour market conditions improved during 2025, as compared to 2024.9 The all-India unemployment rate (based on usual status) declined to 3.1 per cent in 2025 from 3.2 per cent in 2024, with reductions observed in both rural and urban areas. Furthermore, urban areas witnessed steady labour force participation rate along with rising worker population ratio, while rural areas experienced a decline in both the parameters. Quality of employment saw improvement, with the proportion of regular wage/salaried workers increasing; reflecting a shift towards formal employment. Sectoral decomposition reveals that the share of agriculture in total employment continued to decline, while manufacturing and other services − comprising business and financial services, IT, education, health, and administration − gained ground. In March, the all-India unemployment rate measured by current weekly status, witnessed an increase in both rural and urban areas.10 The labour force participation rate and worker population ratio declined in rural areas, while they remained broadly stable in urban areas. The PMI employment for manufacturing and services rose to a seven-month and nine-month peak, respectively, in March 2026. The Naukri JobSpeak Index also showed robust growth in white-collar hiring, led by hospitality, BPO/ ITES, and education. The demand for work under the Mahatma Gandhi National Rural Employment Guarantee Scheme (MGNREGS) continued to decline for the ninth consecutive month, indicating the availability of alternate job opportunities in rural areas (Table III.3). During April-February 2025-26, all the key deficit indicators of the Centre as per cent of revised estimates (RE) were lower than the previous financial year (Chart III.1a). The lower fiscal deficit was on account of a rise in net tax revenue and muted growth in revenue expenditure.11 Growth in net tax revenue was primarily driven by double digit growth in corporation tax, customs and union excise duties.12 Capital expenditure continued to record strong growth, reflecting Government’s thrust on improving the quality of spending.13 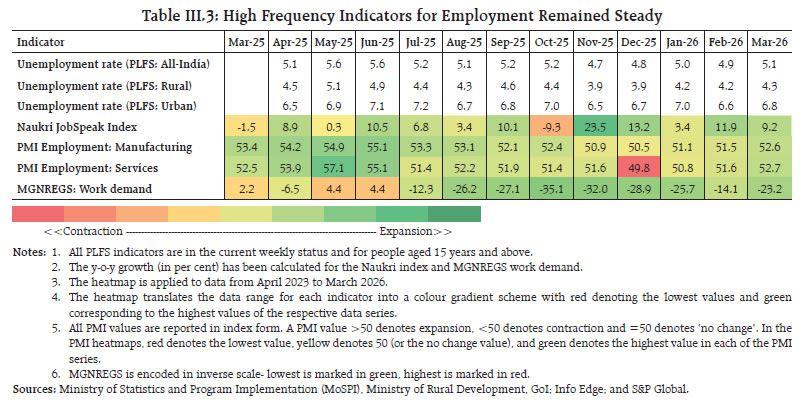 The deficit indicators of states during April-February 2025-26, as a proportion of budget estimates for the financial year, were higher than the same period last year (Chart III.1b). The higher deficit was primarily driven by a moderation in revenue receipts relative to their budget estimates. Within revenue receipts, states’ goods and service tax (GST) growth decelerated, while state excise and stamp duties remained robust. On the expenditure side, growth in states’ revenue expenditure moderated, while capital expenditure recorded strong growth. Trade During 2025-26, merchandise trade deficit stood higher than last year, primarily driven by petroleum products, gold, and electronic goods.14 Both merchandise exports and imports experienced growth during the year.15 Despite the lingering tariff uncertainties, exports to the US expanded in 2025-26.16 In a major trade reconfiguration, China became the largest trading partner of India overtaking the US.17 In March 2026, merchandise trade deficit narrowed on both sequential and year on year (y-o-y) basis (Chart III.2). Month-over-month, exports expanded while imports contracted. However, on y-o-y basis, both exports and import fell with the contraction in former being higher than the latter. While the contraction in exports (y-o-y) was relatively broad-based, contraction in imports (y-o-y) was primarily driven by double-digit decline in petroleum imports.18 Gold imports also contracted attributable to fall in gold prices amidst ongoing geopolitical tensions.19 The ongoing conflict in West Asia impacted the trade negatively as India relies heavily on the Gulf shipping routes. The conflict led to an average 54 per cent decline in exports and imports from West Asia in March.20 Imports from Russia saw a sequential uptick.21 Net services exports growth moderated in February, with imports growing faster than exports (Chart III.3).22 Both exports and imports of business, software, and travel services witnessed an increase. Aggregate Supply Agriculture The sowing in the summer (zaid) season has been marginally higher than last year. Higher acreage under pulses, coarse cereals and oilseeds offset a sharp decline in rice, amidst concerns over input supplies following the war in West Asia (Chart III.4).23 Monthly Indicators of Industrial Activity In February, growth in industrial activity, as measured by the year-on-year change in the Index of Industrial Production (IIP), inched up, driven by strengthening in manufacturing and capital goods. Continued strength was observed in investment-linked segments, with infrastructure and construction goods remaining the strongest contributors. The index of eight core industries contracted in March, marking a 19-month low, driven by a decline in production of fertilisers, crude oil, coal, and electricity. High-frequency indicators of industrial activity for March pointed towards moderation due to the West Asia conflict. The manufacturing PMI declined to its lowest level since June 2022, as new orders and output growth slowed. Automobile production continued to record strong growth across major segments (Table III.4). 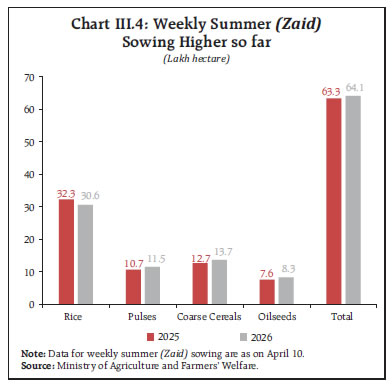 India is making progress towards climate resilience. In March, the Government has updated the Nationally Determined Contributions (NDCs) aimed at combating climate change via reduced emissions, increased electric power capacity from non-fossil fuel sources and enhancing carbon sinks.24 India has seen notable progress in renewable energy adoption validating the feasibility of updated NDC targets. It ranks third globally in terms of total renewable energy capacity and has reached more than 53 per cent of non-fossil fuel capacity (Chart III.5).25 Sustaining this momentum through continued expansion of renewable energy capacity, grid integration and complementary climate actions is important for translating updated commitments into credible outcomes. Monthly Indicators of Services Activity India’s services sector showed some deceleration in March, while displaying continued expansion in services PMI. While the demand remained resilient, led by new export orders, the output was constrained by the impact of West Asia conflict. Retail commercial vehicle sales continued to record double digit growth supported by infrastructure related goods movement, and higher adoption of EVs. Port cargo, however, was moderate in view of disruptions in trade due to the ongoing West Asia conflict. A sharp decline in international air passenger traffic was noted due to widespread cancellations and disruptions of international flights (Table III.5).
Inflation CPI headline inflation26 increased to 3.4 per cent in March from 3.2 per cent in February, mainly on account of higher food and fuel inflation.27 Core (CPI excluding food and fuel28) inflation remained stable, indicating broad containment of underlying inflation pressures. Precious metals continued to remain a major driver of core inflation. Core inflation excluding precious metals was also steady at a moderate level. CPI fuel inflation increased due to the hike in LPG prices partly reflecting the shoot up of international prices (Chart III.6). Seven out of the twelve divisions saw a sequential increase in inflation rates (Chart III.7). The ‘paan, tobacco and intoxicants’ division recorded increase for the second consecutive month following the implementation of additional excise duty on tobacco products and the revised GST rate structure with effect from February 01, 2026. Inflation in the ‘personal care, social protection and miscellaneous goods and services’ division remained the highest, despite softening in precious metal prices. Food inflation in March 2026 was driven by both positive momentum and unfavourable base effect. Meat and fish, fruits and nuts, and oils and fats contributed to higher prices. In terms of spatial distribution, inflation edged up both in urban and rural areas in March. Overall, inflation ranging from 0.7 per cent to 5.8 per cent was observed across states/UTs. Majority of the states, however, continued to experience inflation below 4 per cent (Chart III.8).
High-frequency data up to 16th April point towards a softening in rice and wheat prices. Within pulses, tur prices registered a marginal uptick while gram prices saw a decline. Edible oils witnessed a broad-based rise in prices. Prices of all major vegetables viz., potato, onion and tomato have softened in April so far (Chart III.9). Retail selling prices of LPG increased by 7 per cent in April (up to 16th) while it remained unchanged for petrol, diesel and kerosene (Table III.6). The PMI data for March revealed an intensification of input cost pressures across both manufacturing and services firms. The increase in output prices, however, moderated for manufacturing firms, reflecting competition to retain customers and secure new clients, and a softer increase in new orders. In contrast, prices charged by services firms continued to increase, aided by a near record expansion in international orders offsetting the domestic business slow down (Chart III.10). | Table III.6: Petroleum Products Prices | | Item | Unit | Domestic Prices | Month-over-month (per cent) | | Apr-25 | Mar-26 | Apr-26^ | Mar-26 | Apr-26^ | | Petrol | ₹/litre | 101.0 | 101.2 | 101.2 | 0.0 | 0.0 | | Diesel | ₹/litre | 90.5 | 90.5 | 90.5 | 0.0 | 0.0 | | Kerosene (subsidised) | ₹/litre | 43.5 | 46.8 | 46.8 | 6.2 | 0.0 | | LPG (non-subsidised) | ₹/cylinder | 863.3 | 911.6 | 923.3 | 5.6 | 7.0 | ^: For the period April 1-16, 2026.
Note: Other than kerosene, prices represent the average Indian Oil Corporation Limited (IOCL) prices in four major metros (Delhi, Kolkata, Mumbai and Chennai). For kerosene, prices denote the average of the subsidised prices in Kolkata, Mumbai and Chennai.
Sources: IOCL; Petroleum Planning and Analysis Cell (PPAC); and RBI staff calculations. |
IV. Financial Conditions Overall financial conditions eased in April, as compared to March, on account of relatively easy conditions in forex and corporate bond markets (Chart IV.1). From a moderate surplus in March, system liquidity29 improved significantly in April (up to 16th) (Chart IV.2).30 During the first half of March, system liquidity remained comfortable, supported by RBI’s open market operations (OMOs).31 However, in the second half of March, the liquidity surplus moderated on account of tax and GST related outflows.32 Liquidity conditions improved in April as pressures from tax outflows waned along with faster government spending. Reflecting the improving liquidity conditions, banks’ use of standing deposit facility (SDF) increased significantly in April over March. Marginal standing facility (MSF) usage remained stable, suggesting that day-to-day liquidity mismatches were well-managed.33 Money Market The weighted average call rate (WACR) hovered in the lower half of the policy corridor during the first half of March but then it rose and traded above the repo rate during the second half, reflecting tax outflows.34 Subsequent surplus liquidity conditions in April (up to 16th) led to WACR falling below the repo rate (Chart IV.3a).35 Overnight rates in the collateralised segments – as measured by the benchmark secured overnight rupee rate (SORR) − generally moved in tandem with the uncollateralised rate. The average yields on treasury bills inched up during the second half of March before easing in April (up to 16th). Yields on commercial papers (CPs) and interest rate on certificates of deposit (CDs) after remaining elevated in March, eased significantly in April (Chart IV.3b).36
The average risk premium in the money market (the spread between the yields on 3-month commercial paper and 91-day treasury bill) moderated.37 Government Securities (G-Sec) Market Dated government security (G-sec) yields hardened across maturities during March amidst the breakout of West Asia conflict (Chart IV.4a).38 Yields continued to remain elevated in early April but moderated significantly following the announcement of temporary ceasefire. Yields, however, traded higher than their end-February levels, reflecting prevailing uncertainty (Chart IV.4b). Corporate Bond Market Corporate bond yields hardened across most tenors and rating spectrums in April over March (up to 15th), while their spreads eased (Table IV.1). New corporate bond issuances increased in March 2026 as compared with February 2026. On a cumulative basis, however, total issuances have remained lower in the current financial year as compared to last year.39 | Table IV.1: Corporate Bond Yields Hardened | | | Interest Rates (Per cent) | Spread (bps) | | (Over Corresponding Risk-free Rate) | | Instrument | March 2026 | April 2026 (up to April 15th) | Variation (bps) | March 2026 | April 2026 (up to April 15th) | Variation | | 1 | 2 | 3 | (4 = 3-2) | 5 | 6 | (7 = 6-5) | | (i) AAA (1-year) | 7.40 | 7.31 | -9 | 171 | 161 | -10 | | (ii) AAA (3-year) | 7.36 | 7.61 | 25 | 112 | 110 | -2 | | (iii) AAA (5-year) | 7.52 | 7.68 | 16 | 92 | 88 | -4 | | (iv) AA (3-year) | 8.22 | 8.44 | 22 | 198 | 193 | -5 | | (v) BBB minus (3-year) | 11.92 | 12.14 | 22 | 567 | 563 | -4 | Note: Yields and spreads are computed as averages for the respective periods.
Source: FIMMDA. | Money and Credit During March 2026, reserve money (adjusted for CRR) maintained its high growth trajectory with currency in circulation expanding at a robust pace.40 The growth in money supply also remained high (Chart IV.5).41 Scheduled commercial banks’ (SCBs’) credit and deposit growth soared during March, with the former outpacing the latter since the second half of 2025-26 (Chart IV.6).42 Along with bank credit, the finance from nonbank sources also expanded in 2025-26 (up to March 31). The total flow of financial resources to the commercial sector increased to ₹44.7 lakh crore from ₹32.3 lakh crore a year ago (Table IV.2a). Non-bank sources − corporate bond issuances, and foreign direct investment to India43− showed a marked increase during the year.44 As on March 31, the total outstanding credit to the commercial sector rose by 15.8 per cent, with non-bank sources registering a growth of 15.6 per cent (Table IV.2b). In February 2026, non-food bank credit45 registered a broad-based expansion across key sectors (Chart IV.7). Agriculture and industrial credit growth witnessed an uptick. Credit to both large industries and MSMEs continued to grow at a strong pace. Credit flow to the services sector remained buoyant, underpinned by a steady double-digit growth in bank lending to NBFCs and commercial real estate. Within personal loans, housing and vehicle segments remained steady, while gold loans recorded higher growth. 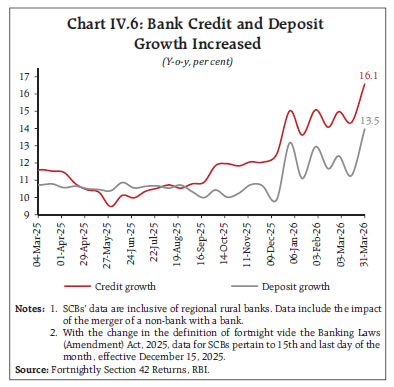
| Table IV.2a: Increased Flow of Financial Resources to the Commercial Sector | | (₹ lakh crore) | | Source | April-March | Up to March 31 | | 2023-24 | 2024-25 | 2024-25 | 2025-26 P | | A. Non-Food Bank Credit | 22.95 | 18.08 | 18.08 | 29.19 | | B. Non-Bank Sources (B1+B2) | 12.64 | 17.10 | 14.25 | 15.48 | | B1. Domestic Sources | 10.20 | 13.86 | 10.98 | 10.56 | | B2. Foreign Sources | 2.43 | 3.25 | 3.27 | 4.92 | | C. Total Flow of Resources (A+B) | 35.59 | 35.18 | 32.33 | 44.67 | P: Provisional.
Notes: 1. Figures in the columns might not add up to total due to rounding off.
2. For detailed notes and data, please refer to Current Statistics Table No: 18(a).
Sources: RBI; SEBI; AIFIs; and RBI staff calculations. | Deposit and Lending Rates In response to the cumulative 125 basis points (bps) reduction in the policy repo rate, scheduled commercial banks have adjusted both repo-linked external benchmark-based lending rates and marginal cost of funds-based lending rates downward during February 2025 to February 2026 (Table IV.3). The pass-through to weighted average lending rates (WALRs) has been strong during the ongoing easing cycle across sectors (Chart IV.8). On the deposit side, the softening in weighted average domestic term deposit rate on fresh deposits was driven primarily by bulk deposits. | Table IV.2b: Higher Outstanding Credit to the Commercial Sector | | (₹ lakh crore; Figures in parentheses are y-o-y percentage changes) | | Source | At End-March | As on March 31 | | 2024 | 2025 | 2025 | 2026 P | | A. Non-Food Bank Credit | 165.64 | 183.72 | 183.72 | 212.91 | | | (21.3) | (10.9) | (10.9) | (15.9) | | B. Non-Bank Sources (B1+B2) | 77.57 | 88.86 | 85.57 | 98.91 | | | (4.2) | (14.6) | (13.4) | (15.6) | | B1. Domestic Sources | 56.59 | 66.37 | 62.65 | 73.27 | | | (4.9) | (17.3) | (14.8) | (17.0) | | B2. Foreign Sources | 20.98 | 22.49 | 22.92 | 25.64 | | | (2.4) | (7.2) | (9.8) | (11.9) | | C. Total Credit (A+B) | 243.21 | 272.58 | 269.29 | 311.82 | | | (15.3) | (12.1) | (11.7) | (15.8) | P: Provisional.
Notes: 1. Figures in the columns might not add up to total due to rounding off.
2. Data on non-bank sources excludes issuances of equities and hybrid instruments under domestic sources and foreign direct investment in equities under foreign sources.
3. Flows based on outstanding data may not tally with the flows provided in Table IV.2a due to:
(a) Merger of HDFC Limited with HDFC Bank on July 1, 2023;
(b) Conversion of some Housing Finance Companies into Non-Banking Financial Companies; and
(c) Valuation effect in case of foreign sources.
4. For detailed notes and data, please refer to Current Statistics Table No: 18(b).
Sources: RBI; SEBI; AIFIs; and RBI staff calculations. | During February 2025 – February 2026, pass-through to WALR was higher for private banks as compared to public sector banks. On the deposit side, the extent of transmission was broadly similar across both groups. The reduction in both deposit and lending rates has been higher for foreign banks (Chart IV.9). Equity Markets Indian equity markets declined in March amidst persistent geopolitical uncertainty. A broad-based decline was observed across sectors leading to a sharp rise in volatility.46 In April (up to 16th), however, markets recovered amidst resumption of US-Iran peace talks and moderation in crude oil prices (Chart IV.10). 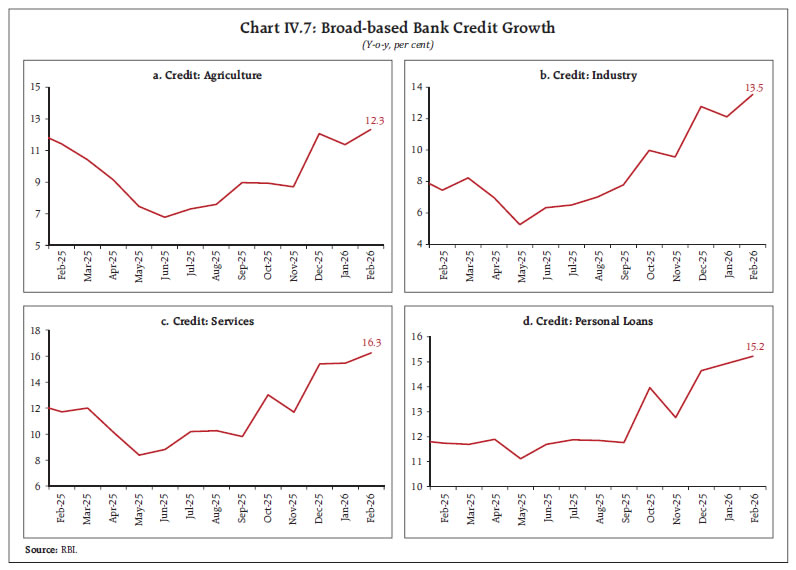
| Table IV.3: Robust Transmission to Banks’ Deposit and Lending Rates | | (Basis points) | | | | Term Deposit Rates | Lending Rates | | Period | Repo Rate | WADTDR- Fresh Deposits | WADTDR- Outstanding Deposits | EBLR | 1-Year MCLR (Median) | WALR - Fresh Rupee Loans | WALR- Outstanding Rupee Loans | | Overall | Interest Rate Effect# | | (1) | (2) | (3) | (4) | (5) | (6) | (7) | (8) | (9) | | Tightening Cycle May 2022 to Jan 2025 | 250 | 259 | 206 | 250 | 175 | 182 | 191 | 115 | | Easing Cycle Feb 2025 to Feb 2026 | -125 | -97 | -47 | -125 | -55 | -89 | -92 | -87 | #: Calculated at January 2025 weights.
WALR: Weighted average lending rate; WADTDR; Weighted average domestic term deposit rate;
MCLR: Marginal cost of funds-based lending rate; EBLR: External benchmark-based lending rate.
Note: Data on EBLR pertain to 32 domestic banks.
Source: RBI. | External Sources of Finance During April 2025 - February 2026, foreign direct investment (FDI) inflows remained higher than last year both in gross and net terms.47 In February, net FDI turned positive after remaining negative for six consecutive months, on account of higher gross inflows and lower repatriations. Around 75 per cent of the outward FDI flows in February were directed to Singapore, the UAE, and the UK (Chart IV.11). During 2025–26, net FPI registered outflows driven largely by the equity segment.48 In March, net FPI outflows accentuated on account of deteriorating global investor sentiments following the West Asia conflict (Chart IV.12).
The registrations and net inflows of external commercial borrowings moderated during April 2025 - February 2026 compared to the last year, reflecting a slowdown in offshore fundraising activity (Chart IV.13).49 A significant share of the borrowings was mobilised for capital expenditure by corporates.50
The key external sector vulnerability indicators, viz., external debt-to-GDP ratio, net international investment position (IIP) to GDP ratio, and debt service ratio, remained contained at end-December 2025. India’s external debt was placed at US$ 765.5 billion at end-December 2025, recording an increase of US$ 18.3 billion over its level at end-September 2025 (Chart IV.14). India’s foreign exchange reserves remain comfortable, providing cover for goods imports of around 11 months51 and around 92 per cent52 of the external debt outstanding as at end-December 2025 (Chart IV.15). India’s net international investment position (IIP) improved during Q3:2025-26 (Chart IV.16).53 This improvement was driven by a higher increase in Indian residents’ overseas financial assets relative to foreign-owned assets in India.54 Foreign Exchange Market Amidst financial market volatility due to the West Asia conflict, the Indian rupee (INR) witnessed depreciation against the US dollar in March (Chart IV.17).55 The depreciation pressures were, however, arrested in April following the measures taken by the Reserve Bank56 and the announcement of a ceasefire between the US and Iran. In real effective terms, the Indian rupee depreciated in March due to depreciation of INR in nominal effective terms and relatively lower inflation in India vis-à-vis its major trading partners (Chart IV.18).
V. Conclusion The global macroeconomic milieu has undergone a significant shift with supply chain disruptions and rising energy costs due to the West Asia conflict. Heightened volatility in commodity prices and financial markets has added to the uncertainty. Further intensification of the conflict, its prolongation and widening geographical spread remain the key downside risks to the global outlook. The intensity and the duration of the conflict and the resultant damage to the energy and other infrastructure add risk to the inflation and growth outlook.57 If the conflict persists and supply chains are not restored early, it may create challenges to the domestic economy in the form of higher energy costs, input cost pressures, disruption in trade flows and financial market spillovers. Though inflation remains contained within the tolerance band, upside risks have increased, driven by supply-side disruptions, including weather-related uncertainties. Possible second round effects with the supply shock transforming itself into demand shock also warrant careful and continuous assessment. The temporary two-week ceasefire between the US and Iran has, however, provided some breather to the global economy. The strong macroeconomic fundamentals should support the Indian economy to maintain its resilience to withstand such shocks.
|