The review on Indian investment abroad in joint ventures (JVs) and wholly owned subsidiaries (WOSs) is brought out along with the quarterly release of India's balance of payments (BoP) statistics. The present review covers India's outward investment in JVs and WOSs during the quarter January-March, 2008 and the financial year 2007-08 (April-March).
I. India's Outward FDI Proposals1
I.1 Magnitude
During the quarter January-March, 2008, 666 proposals amounting to US $ 4,635 million were cleared for investments abroad in JVs and WOSs, as against 549 proposals amounting to US $ 7,115 million during the corresponding period of the previous year (Table 1). Equity accounted for 60.4 per cent of the proposals for investment, followed by loans (28.1 per cent) and guarantees (11.5 per cent). During the quarter, 99.5 per cent of the proposals involving 91.4 per cent of the investments were through automatic route and the rest were through approval route.2
During the full financial year 2007-08, the number of proposals for investment in JVs and WOSs stood at 2,261 for an aggregate amount of US $ 23,072 million,
Table 1: India's Outward FDI: Proposals Cleared |
(US $ million) |
Period |
Number of
Proposals |
Amount of Proposals |
|
|
Equity |
Loan |
Guar ntee |
Total |
January-March, 2007 |
549 |
6650.87 |
204.58 |
260.01 |
7115.46 |
January-March, 2008 |
666 |
2797.24 |
1303.74 |
533.74 |
4634.72 |
2006-07 (April-March) |
1817 |
11244.96 |
1475.28 |
2339.76 |
15060.00 |
2007-08 (April-March) |
2261 |
14122.23 |
2635.51 |
6314.24 |
23071.98 |
Note: Data are provisional. |
|
|
|
|
|
recording a growth of 24.4 per cent in the number of proposals and 53.2 per cent in amount of investment over the year. Equity accounted for 61.2 per cent of the proposals for investment, while loans for 11.4 per cent and guarantees for 27.4 per cent. During 2007-08, automatic route covered 99.6 per cent of the proposals involving 96.4 per cent of the amount of investments. The rest were through approval route (Table 2).
I.2 Sectoral Pattern and Direction
I.2.a Sectoral Pattern
During the quarter January-March, 2008, out of the total outward FDI proposals cleared, almost 91 per cent were
Table 2: Route-wise Clearance of India's Outward FDI Proposals |
(US $ million) |
Route |
Number |
Amount |
|
of Proposals |
Equity |
Loan |
Guarantee |
Total |
January-March, 2008 |
|
|
|
|
|
I. Approval Route |
3 |
202.53 |
– |
195.00 |
397.53 |
II. Automatic Route |
663 |
2594.71 |
1303.74 |
338.74 |
4237.19 |
Total (I + II) |
666 |
2797.24 |
1303.74 |
533.74 |
4634.72 |
2007-08 (April-March) |
|
|
|
|
|
I. Approval Route |
10 |
634.94 |
– |
195.00 |
829.94 |
II. Automatic Route |
2251 |
13487.29 |
2635.51 |
6119.24 |
22242.04 |
Total (I + II) |
2261 |
14122.23 |
2635.51 |
6314.24 |
23071.98 |
Note: Data are provisional. |
for investments of US $ 5 million and above, while in the financial year 2007-08 as a whole, about 95 per cent outward FDI proposals were for such large investments. Sector-wise, during the financial year 2007-08, 43 per cent of the proposals were in manufacturing followed by non-financial services (11 per cent) and trading (4 per cent) [Chart 1]. Within the manufacturing sector, proposals were in the areas like electronic equipment, fertilisers, agricultural and allied products and gems and jewellery. Investment proposals in non-financial services included activities, such as telecommunications, medical services, software development services
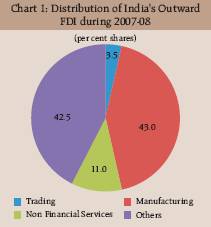
and stock broking. Proposals in trading covered areas, such as textiles, chemicals, readymade garments and petroleum products. Investment proposals in the category of others included oil exploration, shipping and market research.
I.2.b Direction
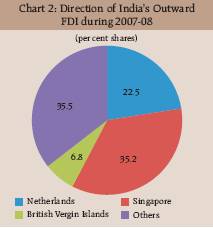
Direction of investment proposals indicates that Singapore, Mauritius, Cyprus and the UAE together accounted for over 50 per cent of the proposals for outward FDI (US $ 5 million and above) during January-March, 2008. For financial year as a whole (2007-08), 35 per cent of the proposals for outward FDI (US $ 5 million and above) were towards destination of Singapore, followed by Netherlands (23 per cent) and British Virgin Islands (7 per cent) [Chart 2]. Large Indian investments going to countries like Singapore, Cyprus, the Netherlands, UAE, British Virgin Islands and Mauritius reflect the generally liberal policies of these countries, particularly the involving favourable tax treatment and investment protection treaties.
II. India's Outward FDI: Actual Outflows3
II.1 Magnitude of Outflows
Actual outward FDI during the quarter January-March, 2008 stood at US $ 7,322 million, which was higher by 63.4 per cent than that during previous year (Table 3). Of the total investments, 70 per cent were in the form of equity and the remaining 30 per cent were loans.
Actual outward FDI during 2007-08 amounted to US $ 17,436 million, an increase of 29.6 per cent over the investments of US $ 13,454 million in the previous year. Of the total investments, 81.6 per cent were in the form of equity
Table 3: India's Outward FDI: Actual Outflows |
(US $ million) |
Period |
Equity* |
Loan |
Guarantee Invoked |
Total |
January-March, |
|
|
|
|
2007 |
3731.10 |
749.97 |
– |
4481.07 |
January- March, |
|
|
|
|
2008 |
5125.73 |
2195.84 |
– |
7321.57 |
2006-07 |
|
|
|
|
(April-March) |
11828.37 |
1626.04 |
– |
13454.41 |
2007-08 |
|
|
|
|
(April-March) |
14222.23 |
3213.56 |
– |
17435.79 |
* : Does not include investments of
individuals and banks.
Note : Data are provisional. |
and the remaining 18.4 per cent in the form of loans. The India's outward FDI witnessed a substantial pick up from 2006-07 onwards, facilitated largely by progressive liberalization of overseas investment policies (Chart 3 and Box).
II.2 Inflows from Outward FDI
According to the available information, during the quarter January-March, 2008, inflows (such as dividend,
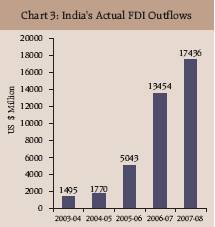
Table 4: Inflows from India's Outward FDI |
(US million) |
Period |
Dividend |
Others@ |
Total |
January-March, |
|
|
|
2007 |
2.25 |
221.31 |
223.56 |
January-March, |
|
|
|
2008 |
16.94 |
561.48 |
578.42 |
2006-07 |
|
|
|
(April-March) |
22.40 |
495.64 |
518.04 |
2007 -08 |
|
|
|
(April-March) |
46.35 |
869.16 |
915.51 |
@ : Include royalty, licence fee, brand fee, technical know-how fee, repayment of loan, etc.
Note : Data are provisional. |
royalty, licence fee, repayment of loan, etc.) from India's outward FDI amounted to US $ 578 million, compared with US $ 224 million during the corresponding quarter of 2006-07 (Table 4).
During 2007-08 (April-March), inflows from India's outward FDI amounted to US $ 916 million, recording a growth of 76.7 per cent over the inflows a year ago (US $ 518 million).
Box: India's Overseas Investment: Major Liberalisation Measures
December 1969: The Government of India for the first time issued formal guidelines for overseas direct investment. Under this, Indian parties were permitted minority participation in turnkey projects involving no cash remittances.
April 1978: An Inter-Ministerial Committee in the Ministry of Commerce was set up to clear proposals for Overseas Investments. There was a requirement for repatriation of dividend of 50 per cent of the declared profits.
1992: An Automatic Route for overseas investments was introduced and cash remittances were allowed for the first time. The total value was restricted to US $ 2 million with a cash component not exceeding US $ 0.5 million in a block of 3 years.
1995: The work relating to overseas investment was transferred from Ministry of Commerce to RBI to provide a single window. In terms of the policy, a fast track route was introduced where limits were raised from US $ 2 million to US $ 4 million and linked to average export earnings of the preceding three years. Cash remittance continued to be restricted to US $ 0.5 million. Beyond US $ 4 million, proposals were considered under Approval Route at the Special Committee level.
March 1997: Exchange earners other than exporters were also brought under the fast track route. Indian promoters were allowed to set up second and subsequent generation companies, provided the first generation company was set up under the fast track route.
2000: The introduction of FEMA brought about significant policy liberalisation. The limit for investment up to US $ 50 million, which was earlier available in a block of three years, made available annually without any profitability condition. Companies were allowed to invest 100 per cent of the proceeds of their ADR/GDR issues for acquisitions of foreign companies and direct investments in JVs and WOSs.
March 2002: Automatic route was further liberalised wherein Indian parties investing in JVs/WOSs outside India were permitted to invest an amount not exceeding US $ 100 million as against the earlier limit of US $ 50 million in a financial year. Also the investments under the automatic route could be funded by withdrawal of foreign exchange from an authorised dealer (AD) not exceeding 50 per cent of the net worth of the Indian party.
March 2003: Automatic Route was significantly liberalised to enable Indian parties to fund to the extent of 100 per cent of their net worth.
February 2004: With a view to enabling Indian corporates to become global players by facilitating their overseas direct investment, permitted end-use for external commercial borrowing (ECB) was enlarged to include overseas direct investment in JVs/WOSs. This would facilitate corporates to undertake fresh investment or expansion of existing JV/WOS including mergers and acquisitions abroad by harnessing resources at globally competitive rates.
May 2005: With a view to promoting Indian investment abroad and to enable Indian companies to reap the benefits of globalization, the ceiling of investment by Indian entities was revised from 100 per cent of the net worth to 200 per cent of the net worth of the investing company under the automatic route for overseas investment.
June 2007: The limit of 200 per cent of the net worth of the Indian party was enhanced to 300 per cent of the net worth under automatic route (200 per cent in case of registered partnership firms).
September 2007: The limit of 300 per cent of the net worth of the Indian party was further enhanced to 400 per cent of the net worth of the Indian party.
June 2008: Indian companies have been allowed to invest in excess of 400 per cent of their net worth as on the date of the last audited balance sheet in the energy and natural resources sectors, such as oil, gas, coal and mineral ores. The investment in excess of 400 per cent of the net worth shall be made only with the prior approval of the Reserve Bank.
* Prepared in the Division of International Trade, Department of Economic Analysis and Policy, Reserve Bank of India. The previous article was published in RBI Bulletin, April 2008 issue.
1 India's outward FDI in this review refers to Indian investment abroad in joint ventures (JVs) and wholly owned subsidiaries (WOSs) by Indian public and private limited companies, registered partnership firms and remittances in respect of production sharing agreements for oil exploration. It does not include outward FDI by individuals and banks.
2 Indian residents are permitted to make investment in overseas joint ventures and wholly owned subsidiaries under automatic route and approval route. Under automatic route, all proposals are routed through designated authorized dealer banks and these do not require prior approval from the Reserve Bank. Proposals not covered by the conditions under the automatic route require the prior clearance of the Reserve Bank and come under approval route.
3 Financing of outward FDI by Indian entities is broadly in the form of equity, loan and guarantee. These include sources, such as drawal of foreign exchange in India, capitalization of exports, funds raised through external commercial borrowings, foreign currency convertible bonds and ADRs/GDRs, and also through leveraged buyouts by way of setting up of special purpose vehicles (SPVs). The equity data presented in this review do not include equity of individuals and banks, and the SPVs set up for funding overseas investment.
|