Sreerupa Sengupta, D. Suganthi and Bishwanath Goldar* Received: June 22, 2023
Accepted: October 16, 2023 The paper attempts to include land as an input in the KLEMS-type production function and estimate agricultural total factor productivity growth (TFPG) for India. For doing so, land quality is accounted for by assigning weights to different land types: irrigated, rainfed and fallow. The estimates suggest that the rate of agricultural TFPG was 0.8 per cent per annum between 1980 and 2019 without accounting for land. However, it increased to 2.0 per cent and 1.8 per cent per annum with the inclusion of land and land quality, respectively. The growth accounting decomposition shows that the contribution of TFPG to agricultural output growth increased from 48 per cent in the 1980s to 78 per cent in the 2010s. Examination of the drivers of agricultural TFPG through an Autoregressive Distributed Lagged (ARDL) model suggests that public gross capital formation (GCF) stock, research and development, mechanisation in agriculture, and favourable terms of trade significantly improve agricultural productivity in India. JEL Classifications: Q1, Q16, D24, O47 Keywords: Agricultural total factor productivity growth, Growth accounting, ARDL analysis, India Introduction India has transitioned to a food surplus economy, emerging as a major producer and leading exporter of several key agricultural commodities. This transformation was made possible by supporting the agricultural sector through price support policy, input subsidies and investment in infrastructure and Research and Development (R&D) over several decades. Specifically, agricultural TFPG fuelled by high-yielding seed technology and investment in public research coupled with input subsidies contributed to the success of the Green Revolution (Djurfeldt et al., 2005; Dorward et al., 2004). Post-Green Revolution, there was a stagnation in crop yields and variation in agricultural growth performance across states. The input subsidies (fertiliser, power, credit, irrigation and insurance) increased farm production by promoting technology adoption but crowded out public investment, leading to inefficient resource allocation and environmental degradation through intensification of input usage (Gulati and Sharma, 1995). Concomitantly, the public GCF peaked in the early 1980s, declining and stagnating in recent decades. Similarly, the R&D expenditure by both Centre and States remained low hovering between 0.3 per cent and 0.7 per cent of agricultural GVA between 1980-81 and 2019-20 (RBI, 2022). The agricultural TFPG and crop yields in India are lower than in several developed and developing countries (USDA, 2023) (Chart A1). Enhancing agricultural productivity growth is essential from a welfare point of view, as higher agricultural production would ensure food security, stable food prices and higher farm income. The global evidence suggests that the poverty reduction effects of agricultural growth are much higher than manufacturing or services sector growth (Christiaensen et al., 2011; Cervantes-Godoy and Dewbre, 2010). Several studies have attempted to estimate TFPG in Indian agriculture in a growth accounting framework, but most have excluded the role of land quality and water (Krishna and Meenakshi, 2022). For agricultural production, land quality not only represents soil fertility but also other factors like climate, rainfall and topography. Thus, it is essential to adjust the land quality to measure the precise contribution of TFPG to agricultural output growth. One way to incorporate land quality is to distinguish between permanent pasture and cropland. Globally, on average two-thirds of all agricultural land represents permanent pastures (Mottet et al., 2017). Within cropland, one of the ways to differentiate land quality is to divide it into rainfed versus irrigated cropland. For the period 1998-2002, almost 43 per cent of global cereal production was from irrigated cropland (Thenkabail et al., 2010; Palazzo et al., 2019). In the absence of irrigation, cereal production would have been lower by 20 per cent (Siebert and Doll, 2010). Therefore, accounting for land quality would enable the identification of the sources of output growth, i.e., land expansion (extensification) vs input intensification (intensification) and TFP. Even if the total agricultural land area remains the same but there is a rise in the share of irrigated land, it could be viewed as an augmentation in land input through cropping intensity. Against this backdrop, the paper includes land as an input in the KLEMS-type production function and re-estimates agricultural TFPG. The paper contributes to the existing literature in the following ways. Firstly, earlier studies on TFPG for agriculture sector were based on value added production function approach, whereas the estimates in this paper are based on gross output production function approach, which consider the implicit role of intermediate inputs in driving productivity. Secondly, the TFPG estimates in the paper are based on the KLEMS framework and in doing so, apart from the traditional KLEMS inputs it includes an additional input – land in the production function. Thirdly, to account for the role of land quality in driving TFPG, different weights are assigned to different land types: irrigated, rainfed and fallow. Lastly, the paper examines the long-run drivers of the agricultural TFP, which can help in the formulation of appropriate policies for enhancing agricultural growth. The paper’s estimates show that agricultural TFPG increased across all sub-periods after accounting for land as an additional input in the production function. The agricultural TFPG accounting for quality-adjusted indicators of land, however, remained subdued as compared to the estimates of agricultural TFPG accounting for land. TFPG estimates of crop subsector based on cost of cultivation data show that productivity growth increased from 0.32 per cent per annum in the 2000s to 1.21 per cent in the 2010s. The results of the decomposition exercise indicate that TFPG accounted for 48 per cent of agricultural output growth in the 1980s which increased to 78 per cent in the 2010s. Furthermore, the empirical analysis highlights that public GCF stock, R&D, mechanisation in agriculture and favourable terms of trade significantly improved agricultural TFPG in India. The rest of the paper is organised as follows. Section II presents a review of past studies estimating agricultural TFPG since the 1980s. Section III documents some stylised facts on inputs of agricultural production. Section IV describes data sources and methods to estimate TFPG using land as an additional input in the production process. Section V reports the TFPG estimates of agriculture and allied sector and presents the empirical estimates of determinants of agricultural productivity in India. Finally, Section VI provides concluding observations. Section II
Literature Review The adoption of a broad range of institutional reforms, technology advancements and regulatory regimes enabled growth in agricultural output over several decades (Chand and Parappurathu, 2012; Krishna and Meenakshi, 2022). Institutional reforms and an expansion in the area under cultivation fueled post-independence agricultural growth. The pace of output growth in the 1950s was short-lived, followed by a slowdown in the early-1960s. The green revolution since the middle of the 1960s resulted in a substantial increase in agricultural output (Chand et al., 2012; Dholakia and Dholakia, 1993; Fan et al., 1999; and Evenson et al., 1999). A significant increase in TFPG was observed by the late 1970s and the 1980s (see Annex 2). Along with introducing high-yielding seed varieties, public sector investment in agriculture, intensified use of chemical fertilisers and pesticides, and investment in irrigation resources played an important role in increasing agricultural productivity (Pray and Nagarajan, 2014). Furthermore, rural road connectivity and electrification improved (Chand and Parappurathu, 2012; Akber et al., 2022; and Bathla, 2014), leading to productivity increases in the 1970s and 1980s. Some important studies that estimate TFPG for the agricultural sector for the period 1980 - 2019 are given in Table 1. A common finding across these studies is that TFPG during the 1980s was higher than in the 1990s (Fan et al., 1999; Coelli and Rao, 2005; and Sivasubramaniam, 2004). In the 1990s, economic and trade liberalisation coupled with technology fatigue slowed the growth momentum in agriculture. The TFPG decelerated in the original green revolution-belt growing rice and wheat (north-western region) due to over-exploitation of water resources, soil fatigue and a weak agricultural extension system. Concurrently, capital investment by the private household sector in tube wells, drip irrigation and diversification towards commercial and high-value crops improved substantially. This was majorly driven by the growth in formal credit to agriculture (Gulati and Bathla, 2001). | Table 1: TFP Growth Estimated in Various Studies | | Studies | Sector | Time Period | TFP (annual Growth per cent) | | Fan et al. (1999) | Agriculture and allied activities | 1980-89 | 2.52 | | 1990-94 | 2.29 | | Coelli and Rao (2005) | Agriculture and allied activities | 1980-00 | 0.9 | | Avila and Evenson (2004) | Crops | 1981-01 | 2.33 | | Livestock | 1981-01 | 2.66 | | Crops and Livestock | 1981-01 | 2.41 | | Sivasubramanian (2004) | Agriculture and allied sector | 1981-90 | 1.89 | | 1990-00 | 1.16 | | Fuglie et al. (2011) | Agriculture and allied activities | 1981-90 | 1.4 | | 1991-00 | 1.2 | | 2001-09 | 1.7 | | Bosworth and Maertens (2010) | Agriculture and allied activities | 1980-90 | 1.9 | | 1990-00 | 0.7 | | 2000-06 | 0.9 | | Goldar et al. (2014) | Agriculture and allied activities | 1980-99 | 1.8 | | 2000-08 | 0.7 | | 1980-08 | 1.5 | | Das (2016) | Agriculture and allied activities | 1981-90 | 1 | | 1991-00 | 1.3 | | 2000-08 | 1.9 | | Krishna and Meenakshi (2022) based on United States Department of Agriculture (USDA) data | Agriculture and allied activities | 1981-88 | 1.02 | | 1988-94 | 1.65 | | 1995-04 | 0.61 | | 2004-10 | 2.82 | | 2010-19 | 2.43 | Note: Studies estimating crop level productivity have been excluded from the list as our focus is on aggregate level productivity trends.
Source: Authors’ compilation. | During the 2000s, the National Agricultural Policy was launched, which was intended to boost agricultural growth by improving public and private investments in agriculture. Additionally, it focused on agriculture diversification in favour of horticultural and cash crops. The provision of formal credit for working capital, investment and export promotion policies led to a recovery in agricultural output growth. During 2000 to 2010, some studies showed a marginal increase in agricultural TFPG (Das, 2016; and Fuglie et al., 2011) and rapid growth post-2010 (Krishna and Meenakshi, 2022). From 1950 to 2000, as per Krishna (2006), TFPG’s contribution to agricultural and industrial output growth was identical at 1.13 per cent. Post-liberalisation in the 1990s, TFPG in the non-agriculture sector (2.04 per cent) was higher than in the agriculture sector (1.68 per cent) (Sivasubramanian, 2004). Krishna and Meenakshi (2022), using India KLEMS data, found that from 1980 to 2019, TFPG in the agricultural sector was 3.06 per cent per annum. In contrast, for industry and services, the growth in TFPG was 0.12 per cent and 1.45 per cent, respectively. Using the India KLEMS data again, Gulati et al. (2020) analyse the contribution of TFPG to GVA growth for agriculture, manufacturing and services sector and find that the growth in agriculture GVA was majorly driven by TFPG, reflecting a lower contribution of factor inputs. Section III
Stylised Facts The contribution of the agricultural sector to India’s total GVA has declined over time. Within agriculture, however, there has been a gradual diversification. The share of the crop subsector has fallen and those of livestock, fishing and aquaculture have increased (Chart 1). Even within the crop sector, the emerging green shoot is horticulture. A decade-wise analysis shows that the growth in agricultural output1 in the 1980s was 2.8 per cent per annum, which moderated slightly to 2.5 per cent per annum between 1991 and 2000. However, from 2001 to 2009, agricultural output growth increased to 2.7 per cent per annum; post-2010, output growth increased further to 3.5 per cent per annum (Chart 2). Growth in TFP of agriculture depends on the availability of inputs like land, water, seeds, pesticides, fertiliser, electricity, machinery and labour. The major land types in India are irrigated, rainfed, pasture, and fallow. The gross irrigated area has increased significantly with a consistent fall in the rainfed area (Chart 3a). The severe droughts in 1988-89, 2002-03, 2014-15 and 2015-16 led to a fall in the rainfed area. However, nearly half of the gross sown area depends on rainfall even today. Pasture and fallow areas, too, have declined over the years. 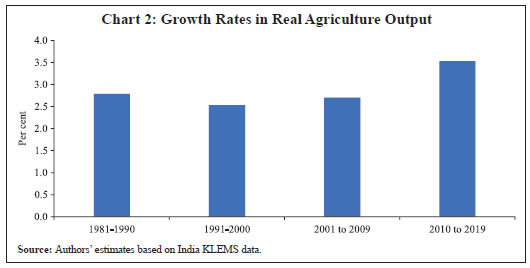 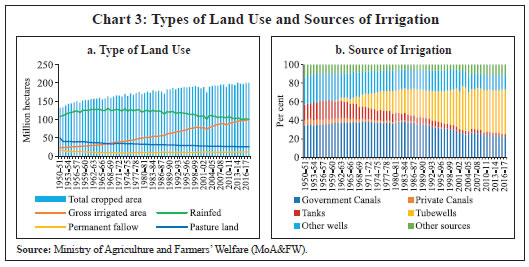 There are four sources of irrigation: canal irrigation, well irrigation, tank irrigation, and “other” (such as waterfalls and streams). Groundwater irrigation from wells and tubewells has accelerated more than surface-water irrigation from canals. The contribution of canal irrigation has come down, offset by wells and tubewells, owing to the expansion of rural electrification. In the 1980s, wells contributed nearly 46 per cent of irrigation, while 40 per cent of the contribution came from canals. By 2016-17, groundwater-well irrigation accounted for 62 per cent of the total net irrigated area (Chart 3b). During 1980-81 and 2017-18, the area sown more than once increased from 32 million hectares to 61 million hectares, recording a growth of 88 per cent. As a result, the cropping intensity increased from 123 to 144 during the same period2. This can be attributed to accelerated irrigation capacity, enabling multi-cropping. With a limit to expanding the area for agricultural use, multiple-season cropping also enhanced the cropping intensity of land, which was facilitated by irrigation technologies. Similar to land, intensified use of modern inputs can also drive agricultural productivity growth. Fertiliser consumption has increased rapidly over time. The fertiliser subsidy policy has achieved the objective of spurring its consumption and raising food production, but it has also led to overuse of urea, leading to an imbalance in fertiliser use. Also, the fertiliser production capacity has not increased over time, increasing dependence on imports. The availability of good quality seeds is also another essential factor driving agricultural productivity. The production and distribution of certified quality seeds have increased rapidly since the 2000s (Charts 4a and 4b). In terms of mechanisation, the production of tractors grew significantly after the 2000s (Chart 4c). Pesticide consumption, however, declined between 1990-91 and 2010-11 and showed an increase thereafter (Chart 4d).  Employment growth in agriculture started to slow down in the 1990s and has declined thereafter (Chart 5a). The slowdown in the growth rate of agricultural workers implies a structural shift, with workers moving to construction, manufacturing and services. There was a rapid increase in use of energy and services (financial and transport services), which are intermediate inputs for agriculture. Energy inputs grew from 2 per cent in the 1980s to 9 per cent in the 2010s, while services inputs increased from 1.1 per cent to 5.4 per cent during the same period (Chart 5b). Finally, cropland was a slow-growing input; the growth was 0.5 per cent in the 1980s, which declined to 0.2 per cent in the 2010s. With a reduction in labour and land in agriculture, the intensive use of capital, energy, and services increased much faster than other inputs. Although land use per worker declined, there was an increase, although marginal, in the material intensity (Chart 6). Section IV
Data Sources and Estimation Methodology IV.1 Data for Output, Input and Factor Income Share TFP in agriculture can be defined as the ratio of output to total inputs and measures the average productivity of all inputs for the agriculture and allied sectors. TFP differs from crop yield rates, as it takes into account a broader set of inputs used for production. Crop yield rates measure output per unit of input (partial productivity), whereas TFP (multifactor productivity) measures the average productivity of all inputs (land, labour, capital, intermediate inputs) employed in production of all agricultural outputs. Thus, growth in TFP represents the overall rate of technical efficiency change in the sector. We estimate TFP growth (TFPG) for agriculture using the gross output production function. The detailed method of estimating the gross output based TFPG is given in next subsection. Gross output data are obtained from the National Accounts Statistics, Central Statistical Office. For estimating sectoral level TFPG, a gross output-based production function is considered to be better than a gross value added-based production function, as it considers the role of intermediate inputs (Jorgenson and Griliches, 1967). For agriculture, new technology is often embodied in intermediate inputs like seeds and chemicals. Therefore, the TFPG measured using gross output production function captures the technical change better than the TFPG measured using gross value added production function. The inputs in the gross output-based production function include capital, land, labour and intermediate inputs. Agricultural capital (reproducible) includes farm machinery, breeding stocks, nut-bearing trees, buildings and structures. The data source of capital stock is the USDA (2023) database. The capital stock series is constructed using the perpetual inventory method. The non-reproducible capital – land is excluded from capital stock estimation and is treated as a separate input. Land input data is obtained from Agricultural Statistics at a Glance of MoA and FW. Land input is considered in two forms. First is the total land surface and second is quality-adjusted land, which accounts for the productivity difference between rainfed, irrigated cropland and permanent pastures. The weights for rainfed, irrigated and pasture lands are based on their relative productivity. For India, one hectare of irrigated area is assumed to be as productive as 2.778 hectares of rainfed cropland; and one hectare of permanent pasture is assumed to be as productive as 0.056 hectares of rainfed cropland. Thus, 1 hectare of each type (3 hectares) would total to 3.835 hectares of quality-adjusted land (1.000+2.778+0.057). These weights are directly taken from USDA (2023) database, which uses the Fuglie (2018) method. Labour data have been sourced from the India KLEMS database. In India KLEMS database, the total number of persons employed in agriculture is estimated from employment-unemployment surveys of the National Statistical Office (NSO) (38th round to 68th round) and Periodic Labour Force Survey rounds (PLFS of 2017-18, 2018-19 and 2019-20). Agricultural intermediate inputs, including fuel, fertilisers, feeds, seeds, financial services and transport services have been categorised as energy, material and services inputs, and the data are sourced from the India KLEMS database. The intermediate input series in India KLEMS is estimated from the input-output transaction table (IOTT) published by NSO. The current series of intermediate inputs is converted to constant prices using weighted WPI deflators for material inputs and weighted implicit deflators for services inputs. The weights are obtained from IOTT. The weighted average input growth rates are used to estimate the contribution of each input to output growth. The weights are based on input cost shares. The cost shares for labour and intermediate inputs are taken from India KLEMS, the cost share of land is calculated from the USDA (2023) database and the residual is taken as the cost share of capital. In the USDA database, the cost share of land is based on 21 productivity studies that estimated the cost share for India (USDA Documents and Methods 2020)3. The input cost shares used in this study are provided in Table 2. The input cost share of employment has increased over time and accounts for 43 per cent of the total cost share from 2011 to 2019. Among other inputs, the cost share of land has increased, whereas the cost share of capital has reduced over time. | Table 2: Input Cost Shares Used for Calculation of Agriculture Productivity | | (Per cent) | | Shares | 1981 to 1990 | 1991 to 2000 | 2001 to 2010 | 2011 to 2019 | | Employment | 39 | 42 | 41 | 43 | | Capital | 12 | 13 | 07 | 08 | | Energy | 01 | 01 | 02 | 02 | | Material | 26 | 19 | 18 | 13 | | Service | 05 | 05 | 06 | 07 | | Land | 17 | 19 | .27 | 27 | | Source: Authors’ estimates. | As a robustness check, a comparison of input cost shares with previous studies shows that the cost shares used in this paper are closer to Fuglie (2008) and Avila and Evenson (2010) (Table 3). These studies assign a higher cost share to labour and intermediate inputs and a lower cost share to land and capital. However, the cost shares used in this study are markedly different from the cost share used in Das (2016), which assigns high cost share to land while the share for labour is very low. For instance, the cost share for labour used in Das (2016) is around 18 per cent of GVA for 2000-2008. The GVA data from National Accounts Statistics reports the average GVA in current prices from 2000 to 2008 as ₹6,29,551 crore. Hence, the average labour income per year works out to ₹1,13,319 crore. The NSO data indicates that on average 24.8 crore workers are engaged in agriculture during this period. If the labour income based on Das (2016) is considered, then the average wage rate per day for agricultural workers works out to ₹194.This is much lower than the average wage rate of rural workers engaged in agriculture5. | Table 3: Comparison of Cost Share Estimates with Previous Studies | | (Per cent) | | Authors’ Names | Years | Land | Labour | Machines | Intermediate Inputs | | Fuglie (2008) | Average of 1977 and 1987 | 23 | 46 | 01 | 29 | | Avila and Evenson (2010) | 1981 to 2001 | 39 | 43 | 08 | 12 | | Goldar et al. (2014) – India KLEMS Productivity Report | 1980 to 2008 | 17 to 21 | 38 to 40 | 17 to 21 | 20 to 27 | | Das (2016) | 1981-1990 | 54 | 22 | 12 | 12 | | 1991 -2000 | 61 | 19 | 10 | 10 | | 2000-2008 | 63 | 18 | 10 | 10 | | Our paper | 1981 to 1990 | 17 | 39 | 12 | 32 | | 1991 to 2000 | 19 | 42 | 13 | 26 | | 2001 to 2010 | 27 | 41 | 07 | 25 | | 2011 to 2019 | 27 | 43 | 08 | 22 | Note: Intermediate input in other studies is the sum of livestock, fertilisers and seeds, while in our paper, intermediate inputs are classified following the KLEMS classification.
Source: Compiled from various sources. | IV.2 Method of Estimating TFPG The growth accounting method pioneered by Jorgenson and Griliches (1967) is used for estimating agricultural TFPG. Growth accounting allows for an assessment of the contribution of primary factors and intermediate inputs to output growth and also derives a measure for TFPG. TFPG indicates how efficiently inputs are being used in the production process. Under the assumption of perfect competition and constant returns to scale, output growth is equal to the compensation share weighted contribution of input growth and TFPG. In this way, we can account for the proportion of output explained by input growth and TFPG, respectively. We begin with the fundamental accounting identity, where the value of output equals the value of inputs. Y is gross agricultural output, P is prices, L is labour input, K is capital input and E, M and S are intermediate inputs - namely energy, material and services and La is land input. Thus, apart from traditional factors of labour, capital and intermediate inputs, we also include an additional input of land, which is important for estimating agricultural productivity. Under specific assumptions of constant returns to scale and competitive markets, we can define TFPG as The growth accounting theory assumes that producers maximise profits. Thus, the output elasticity with respect to each input equals their factor income share. It also assumes that technology exhibits constant returns to scale, implying total revenue equals total cost. The underlying equation is a Cobb-Douglas production function and under all the above conditions, the productivity index represents Hicks-neutral technical change. Section V
Empirical Analysis V.1 Estimates of TFPG for the Agriculture and Allied Sector The TFPG is estimated for four sub-periods: 1981-1990, 1991-2000, 2001-2010, and 2011-2019. In addition, three alternate estimates of TFPG were computed (Table 4). The first estimate (TFPG KLEMS) is calculated based on India KLEMS data. The second productivity estimate includes land (TFPG including LAND), in addition to KLEMS inputs. Finally, the third TFPG estimate (TFPG including LAND quality) adjusts TFPG for land quality. The results show that agricultural TFPG increased across all sub-periods when land was included as an additional input in the production function. However, the improvement in TFPG was marginally lower after adding a quality-adjusted indicator of land. This finding is consistent with Fuglie (2018), who shows that the growth rate of inputs increases with the addition of land quality, moderating the TFPG6. The agricultural TFPG estimates derived from the KLEMS framework, excluding land, declined during the 1990s and 2000s compared to the earlier sub-period of the 1980s. Later, in the sub-period 2010-2019, productivity growth rebounded and witnessed an impressive increase. When we included land input in the KLEMS model, no slowdown in productivity during the 1990s and 2000 was observed. | Table 4: TFPG Rates - Alternate Estimates | | (Per cent) | | TFPG | 1981 to 1990 | 1991 to 2000 | 2001 to 2010 | 2011 to 2019 | | TFPG KLEMS | 1.0 | 0.6 | 0.5 | 1.3 | | TFPG (including LAND) | 1.5 | 1.5 | 2.1 | 2.9 | | TFPG (including LAND Quality) | 1.3 | 1.3 | 1.9 | 2.7 | | Source: Authors’ estimates. | As a robustness check, we calculate an alternate set of TFPG based on cost shares of the India Productivity Report (2014) – henceforth the Productivity Report (Annex 3). Our results differ from the TFPG numbers reported in the Productivity Report for four reasons. First, the land used in our paper is the sum of rainfed, irrigated and permanent pasture. The Productivity Report defines land as the sum of gross/net cropped area and fallow land. Second, we assign different weights to rainfed, irrigated and permanent pastures based on relative productivity to account for land quality. Land quality has not been considered in the Productivity Report. Third, we use capital stock data obtained from the USDA (2023) database, whereas the Productivity Report uses capital stock and capital service data from India KLEMS database. The India KLEMS series has a higher capital input growth than the USDA capital stock series. Thus, the TFPG estimates based on the Productivity Report are lower than ours. Fourth, our paper uses a different set of cost shares for land input than that reported in the Productivity Report. V.2 TFPG Estimates for the Crop Sector The crop sector represents around 60 per cent of agricultural GVA. Therefore, estimating TFPG in the crop sector is important to understand its continued significance despite the increase in the share of allied sector activities in overall agricultural GVA. Within the crop sector, rice and wheat are the two major crops, accounting for 37 per cent of the gross cropped area. The cost shares of the inputs are derived using the cost of cultivation data. The inputs considered are labour, capital, land and intermediate inputs - seeds, fertilisers, feeds, insecticides, and irrigation charges. The distribution of cost shares for 2004-05 and 2019-20 is depicted in Charts 7a and 7b. 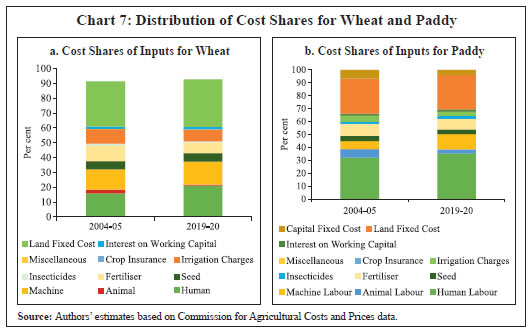 The TFPG of the crop sector, which was 0.32 per cent from 2000 to 2010, increased to 1.21 per cent from 2011 to 2019 (Chart 8). A further sub-period classification shows that productivity growth from 2000 to 2005 was (-)1.08 per cent, which improved to 1.72 per cent from 2006 to 2010. Productivity growth during 2011-2015 was 0.76 per cent per annum, which increased to 1.77 per cent per annum during 2016-2019. Thus, the crop sector TFPG increased during the sub-period 2011- 2019 as compared to the earlier decade. V.3 Contribution of TFPG to Output Growth The expansion in cropping intensity, intensifying input use and TFPG contributed to agricultural output growth (Chart 9). In the 1980s and 1990s, most of the output growth was due to the intensification of input use. The expansion of land input was an essential source of output growth in the 1980s. However, its contribution decreased in subsequent decades. Since the 2000s, TFPG has become the main driver of agricultural output growth. The resource decomposition analysis shows that the TFPG’s contribution to output growth increased from 48 per cent in the 1980s to 78 per cent in the 2010s. The decomposition exercise indicates that in the absence of land expansion, increased agricultural output would come from increased TFPG or more intensive use of inputs. However, the change in input prices could affect the intensification of input use7. This would raise land productivity, but expanding output through input intensification will last only over a short-term, as the existing technology can be subjected to diminishing returns. On the other hand, TFPG comes from improvements in R&D expenditure and technological advancements like precision agriculture. Thus, investing in research and innovation activities can sustain the incremental effect on productivity and output for extended periods. The analysis shows that TFPG accounted for a 70 per cent increase in output growth in India from 2000 to 2019. The results obtained for India are in line with the global scenario. As per the World Bank report from 2001 to 2015 TFPG accounted for two-third of global agricultural output growth (Dieppe et al., 2021). For developing countries, the report finds that with shrinkage in land and labour for the agricultural sector, the increase in agricultural output is mainly attributed to improvement in TFPG. 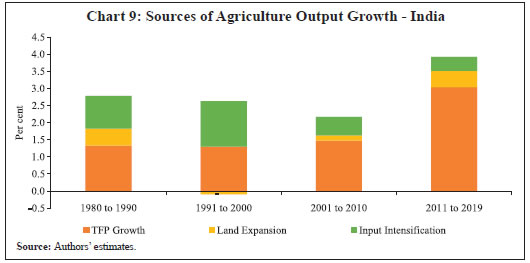 V.4 Drivers of TFP Several factors, like R&D investment, human resources, cropping intensity, the balanced use of plant nutrients, infrastructure development and literacy rate, can have an impact on the agricultural TFPG. The direction of statistically significant effect of these variables on TFPG is given in Table A2. Using data from 1980-81 to 2019-20, the drivers of land and land quality-adjusted TFP for Indian agriculture are estimated. The primary focus is to study the long - run drivers of TFP in Indian agriculture. The expenditures towards infrastructure and R&D investment and household farm investment can play a significant role in spurring productivity growth in the long run. Public investment in agriculture primarily relates to investments in canals, building of roads and provision of electricity for enhanced irrigation. Private household investments dominate the sector’s overall GCF, and it accounts for expansion in irrigated area through groundwater irrigation through tubewells/well and machinery. The returns to investment are, however, realised with a lag (Evenson et al., 1999; and Chand et al., 2012). The public gross capital formation and R&D stock is the cumulative expenditure over the last four years, constructed following Evenson et al. (1999) and Chand et al. (2012). The public GCF and research stock variable is the summation of expenditure over the last four years by assigning weights as 0.25 in the year t-1, 0.5 in the year t-2, 0.75 in the year t-3 and 1.0 in year t-4. Furthermore, the combined effect of cumulative R&D and public GCF stock is employed. An indicator of private household investment in Indian agriculture is the mechanisation variable, which measures farm machinery in metric horsepower (1000 CV) (including tractors, harvester-threshers, milking machines and water pumps)8. The other proxy indicators of private household investment in India agriculture are private GCF and long-term institutional credit to the sector (Gulati and Bathla, 2001). Due to the multicollinearity issue, the mechanisation variable was employed in the estimation model9. In addition, terms of trade between agricultural and non-agricultural sectors as a proxy for relative prices are expected to influence TFP positively by boosting farm investments and rainfall deviation dummy taking value ‘1’ for negative deviation and ‘0’ otherwise is considered. Additionally, the drivers of TFP in agriculture using the USDA (2023) TFP series from 1980 to 2019 were examined as a robustness analysis10. The empirical specification is as follows: The stationarity test of all the variables conducted using the Augmented Dickey-Fuller test (ADF, 1981) reveals that the variables are stationary at levels or at the first difference (Table A3). Thus, the drivers of agricultural TFP in the long run are explored using the Autoregressive Distributed Lagged (ARDL) modelling framework. The lags are selected using AIC criterion with maximum 2 lags for parsimony. The ARDL bounds test for cointegration between the indicators of agricultural TFP and other independent variables shows that the F-statistic is higher than the upper bound critical value indicating cointegration between variables. This shows the existence of a long-run relationship (Table 5). The diagnostics in terms of higher adjusted R-square, Breusch–Godfrey serial correlation test and Breusch-Pagan-Godfrey heteroskedasticity test suggest that the estimates are robust. The results of the long-run equation from different model specifications show that public GCF stock in agriculture had a positive influence on agricultural TFP. Furthermore, sum of public GCF and R&D expenditure improved agricultural TFP. This result is consistent with other studies that show public investment and R&D expenditure positively influence Indian agriculture (Evenson et al., 1999; and Chand et al., 2012). The budgetary allocation for R&D in agriculture is low, hovering between 0.3 per cent and 0.7 per cent of agricultural GVA between 1980-81 and 2019-20 (RBI, 2022). The number of hybrid crop varieties notified or released for commercial cultivation by the Indian Council of Agricultural Research has been skewed towards cereals and investment need to be spurred to address the yield gaps in other crop groups. Mechanisation enhanced agricultural TFP. The terms of trade in favour of agriculture gave a boost to agricultural TFP. | Table 5. ARDL Long-run Results | | Explanatory Variables | Dependent Variable: Agricultural TFP | | Agricultural TFP Land adjusted | Agricultural TFP Land adjusted | Agricultural TFP Land Quality adjusted | Agricultural TFP Land Quality adjusted | Agricultural TFP (USDA) | Agricultural TFP (USDA) | | Public GCF Stock in Agriculture in Real Terms | 0.117*** | | 0.158 | | 0.243*** | | | (0.027) | | (0.036) | | (0.082) | | | R&D and Public GCF Stock in Agriculture in real terms | | 0.119*** | | 0.161*** | | 0.248*** | | | (0.027) | | (0.036) | | (0.083) | | Mechanisation in Agriculture | 0.114*** | 0.112*** | 0.084*** | 0.082*** | 0.003 | -0.001 | | (.013) | (.014) | (0.018) | (0.018) | (0.036) | (0.037) | | Rainfall Dummy | 0.031 | 0.031 | | | | | | (0.016) | (0.016) | | | | | | Terms of Trade | 0.124* | 0.129* | 0.142 | 0.149 | 0.591*** | 0.602* | | (0.072) | (.070) | (0.109) | (0.107) | (0.197) | (0.195) | | ECT | -0.684*** | -0.682*** | -0.497*** | -0.497*** | -0.528*** | -0.526*** | | Diagnostic Statistics | | Observations | 35 | 35 | 35 | 35 | 35 | 35 | | Adjusted R2 | 0.72 | 0.73 | 0.65 | 0.65 | 0.47 | 0.48 | | Model Type | ARDL | ARDL | ARDL | ARDL | ARDL | ARDL | | (3,3,1,2,2) | (3,3,1,2,2) | (2,3,1,2) | (2,3,1,2) | (1,3,1,2) | (1,3,1,2) | | DW statistic | 2.2 | 2.2 | 2.0 | 2.03 | 2.1 | 2.1 | | Serial correlation (p-value) | 1.285 | 1.521 | 0.082 | 0.130 | 0.258 | 0.292 | | (0.257) | (0.22) | (0.775) | (0.719) | (0.612) | (0.589) | | Heteroscedasticity | 35.00 | 35.00 | 35.00 | 35.00 | 35.00 | 35.00 | | (0.42) | (0.42) | (0.42) | (0.42) | (0.42) | (0.42) | | Bound test for cointegration (F statistic) | 8.374*** | 8.521*** | 7.845*** | 7.925*** | 6.816*** | 6.968*** | Notes: 1. ***, **, and *, denote the level of significance at 1 per cent, 5 per cent, and 10 per cent, respectively.
2. Figures in parentheses are standard errors.
3. All variables are transformed into natural logarithms except rainfall.
Source: Authors’ estimates. | Section VI
Conclusion Productivity plays a central role in sustaining higher agricultural growth. Existing estimates of TFPG in India, however, are volatile and remain lower than in several emerging and Asian economies. This motivated the estimation and in-depth analysis of agricultural TFPG accounting for land and land quality by using differential weights for rainfed, irrigated and pastureland based on relative productivity. With the inclusion of land quality, agricultural productivity growth estimates are higher compared to the standard KLEMS estimate of TFPG. The TFPG accounted for 70 per cent of agricultural output growth from 2000 to 2019, implying that productivity growth is the primary driver of agricultural output growth while input intensification plays a limited role. A decadal analysis shows agricultural productivity, augmented with land variables, increased steeply from 2010 to 2019. Empirical analysis of determinants of agricultural TFP from 1980-81 to 2019-20 suggests that public GCF stock and sum of public GCF and R&D stock, complemented with private farm investment in mechanisation improves agricultural TFP in India. Thus, a sustained increase in the public sector investment in infrastructure and R&D expenditure is imperative for enhancing productivity and farm incomes. Furthermore, the empirical findings reveal that higher private farm investments in terms of mechanisation boost agricultural TFPG. Investment in R&D to deepen technology capital, public GCF to strengthen physical infrastructure and policy focus to improve mechanisation are key to spur further growth in TFP in the Indian agriculture. References Akber, N., Paltasingh, K.R., and Mishra, A.K. (2022). How can Public Policy encourage Private Investments in Indian Agriculture? Input Subsidies vs. Public Investment, Food Policy,107 (102210). Ali, M., and Byerlee, D. (1991). Economic efficiency of small farmers in a changing world: A survey of recent evidence. Journal of International Development, 3(1): 1-27. Avila, Antonio Flavio Dias and Robert E. Evenson (2010). Total Factor Productivity Growth in Agriculture: The Role of Technological Capital, in Prabhu L. Pingali and Robert E. Evenson (Ed.), Handbook of Agricultural Economics, North Holland, 3769-3822 Bathla,S. (2014). Public and private capital formation and agricultural growth in India: Statelevel analysis of inter-linkages during pre- and post-reform Periods. Agricultural Economics Research Review, 27(1): 19-36. Berndt, E. R., and Fuss, M. A. (1986). Productivity measurement with adjustments for variations in capacity utilisation and other forms of temporary equilibrium. Journal of Econometrics, 33(1-2): 7-29. Bosworth, B., Collins, S. M., & Virmani, A. (2007). Sources of growth in the Indian economy. NBER Working Paper 12901. Cervantes-Godoy, D., & Dewbre, J. (2010). Economic importance of agriculture for poverty reduction. OECD Food, Agriculture and Fisheries Working Papers, No. 23. Chand, R. and Parappurathu, S. (2012). Temporal and Spatial Variations in Agricultural Growth and its Determinants. Economic and Political Weekly, 27(26): 55-64. Chand, R., Kumar, P and Kumar, S. (2012). Total Factor Productivity and Returns to Public Investment on Agricultural Research in India. Agricultural Economics Research Review, 25(2): 181-194. Christiaensen, L., Demery, L., & Kuhl, J. (2011). The (evolving) role of agriculture in poverty reduction—An empirical perspective. Journal of development economics, 96(2), 239-254. Coelli, T. J., and Rao, D. P. (2005). Total factor productivity growth in agriculture: a Malmquist index analysis of 93 countries, 1980–2000. Agricultural Economics, 32, 115-134. Das, V. K. (2016). Agricultural Productivity Growth in India: An Analysis Accounting for Different Land Types. The Journal of Developing Areas, 50(2): 349-366. Dieppe, A. (Ed.). (2021). Global productivity: Trends, drivers, and policies. World Bank Publications. Dholakia, R. H., and Dholakia, B. H. (1993). Growth of Total Factor Productivity in Indian Agriculture. Indian Economic Review, 25-40. Djurfeldt, G., Holmen H., Jirstorm M. and Larsson, R. (2005). The African food crisis: Lessons from the Asian green revolution. CABI Publishing, Wallingford. Dorward, A., Fan, S., Kydd, J., Lofgren, H., Morrison, J., Poulton, C., Rao, N., Smith, L., Tchale, H. & Thorat, S. (2004). Rethinking agriculture policies for pro-poor growth, Natural Resources Perspectives (94). Overseas Development Institute (ODI), London. Evenson, R., E., Pray, Carl E. and Rosegrant, M. W. (1999). Agricultural Research and Productivity Growth in India. Research Report 109, International Food Policy Research Institute, Washington, DC, USA. Fan, S., Hazell, P and Thorat, S (1999) Linkages between Government Spending, Growth and Poverty in Rural India. Research Report 110. International Food Policy Research Institute, Washington, DC, USA. Rosegrant, M. W. Fuglie, K. O. (2018). Is agricultural productivity slowing? Global food security, 17, 73-83. Fuglie, K., Heisey, P., King, J. L., Day-Rubenstein, K., Schimmelpfennig, D., Wang, S. L., and Karmarkar-Deshmukh, R. (2011). Research investments and market structure in the food processing, agricultural input, and biofuel industries worldwide. USDA-ERS Economic Research Report, (130). Fuglie, Keith O. (2008).Is a slowdown in agricultural productivity growth contributing to the rise in commodity prices?, Agricultural Economics, 39, 431-441 Goldar, B. N., Das, D. K., Aggarwal, S., Erumban, A. A., Sengupta, S., De, K.., Das, P. C. (2014). Estimates of Productivity Growth for the Indian Economy. Reserve Bank of India. Gulati, A., and Bathla, S. (2001). Capital formation in Indian agriculture: Re-visiting the debate. Economic and Political Weekly, 36(20): 1697-1708. Gulati, A., and Sharma, A. (1995). Subsidy Syndrome in Agriculture. Economic and Political Weekly, 30(39): 93-102. Gulati, S, Saksena, U., Shukla, A.K., Dhanya, V. and Sonna, T. (2020). Trends and Dynamics of Productivity in India: Sectoral Analysis, Reserve Bank of India Occasional Papers, 41(1): 77-108. Jorgenson, D. W., & Griliches, Z. (1967). The explanation of productivity change. The review of economic studies, 34(3), 249-283. Krishna, K. L. (2006). Some aspects of total factor productivity in Indian agriculture. In India in a Globalising World: Some Aspects of Macroeconomy, Agriculture, and Poverty: Essays in Honour of CH Hanumantha Rao (pp. 277-298). Academic Foundation. Krishna K.L and Meenakshi J.V. (2022). Agricultural Productivity Growth and Structural Transformation in Rural India: Some Recent Evidence, Journal of Quantitative Economics, 20(1):S277–S302. Mottet, A., de Haan, C., Falcucci, A., Tempio, G., Opio, C., and Gerber, P. (2017). Livestock: On our plates or eating at our table? A new analysis of the feed/food debate. Global Food Security, 14, 1-8. Murgai, R., Ali, M., and Byerlee, D. (2001). Productivity growth and sustainability in post–Green Revolution agriculture: the case of the Indian and Pakistan Punjabs. The World Bank Research Observer, 16(2): 199-218 Palazzo, A., Valin, H. J. P., Batka, M., & Havlík, P. (2019). Investment needs for irrigation infrastructure along different socioeconomic pathways. World Bank Policy Research Working Paper, (8744). Parayil, G. (1992). The green revolution in India: A case study of technological change. Technology and culture, 33(4): 737-756. Pray, C.E. andNagarajan, L. (2014). The transformation of the Indian agricultural input industry: has it increased agricultural R&D. Agricultural Economics, 45, 145-156. RBI (2022). Report on Currency and Finance 2021-22. Reserve Bank of India. Siebert, S., and Döll, P. (2010). Quantifying blue and green virtual water contents in global crop production as well as potential production losses without irrigation. Journal of Hydrology, 384(3-4): 198-217. Sivasubramonian, S. (2004). The Sources of Economic Growth in India: 1950-51 to 1999-00, New Delhi: Oxford University Press. Thenkabail, P. S., Hanjra, M. A., Dheeravath, V., & Gumma, M. (2010). A holistic view of global croplands and their water use for ensuring global food security in the 21st century through advanced remote sensing and non-remote sensing approaches. Remote sensing, 2(1), 211-261. USDA (2023). International Agricultural Productivity Database, United States Department of Agriculture.
Annex 1. Annex 2. Agriculture Productivity Trends from 1950 to 1980 Parayil (1992) categorises three distinct phases in India’s green revolution. The first phase (1952-1965) witnessed the development of a national agricultural research system. The second phase (1962-1967) saw various reforms in the agriculture sector which were necessary to facilitate the transfer of high-yielding varieties (HYV) seeds to Indian farmers. The third stage (1965-1975), which was the green revolution period saw the diffusion and adoption of technology among farmers. During the initial years of the green revolution, the estimates from various studies show negligible growth in total factor productivity in India. For instance, the USDA (2023) data on agricultural productivity shows that TFPG from 1965-1975 was 0.83 per cent per annum, whereas TFPG in later years from 1980-1990 was 1.8 per cent per annum. The study by Bosworth et al. (2007) finds that TFPG in Indian agriculture was -0.20 per cent per annum from 1960-1973. In contrast, in the post-green revolution period of 1973-1983, the TFPG increased to 0.90 per cent per annum and further accelerated to 1.20 per cent per annum from 1983-1993. Nin Pratt et al. (2010) find that TFPG from 1961-1973 was -1.70 per cent per annum which improved to 0.50 per cent per annum from 1974-1980. A study by Sivasubramanian (2004) finds TFPG during the pre-green revolution period of 1950-51 to 1964-65 was 1.47 per cent per annum which reduced to 0.08 per cent per annum in the post-green revolution period of 1964-65-1980-81. Thus, the productivity estimates calculated by various studies show that TFPG in the green revolution period (1965-1975) was lower than in the 1980s. This implies a lag between investment in inputs and the realisation of TFP gains for India. Empirical evidence from Asian countries presents that when green revolution was first adopted, inefficiencies were high due to a lack of skills among farmers. Hence, TFP increased after a lag of a few years. The increase in TFP post-green revolution was possibly due to learning by doing as farmers gained experience using new technology (Ali and Byerlee, 1991). Murgai et al. (2001) in their analysis of TFPG in the green revolution period note that the technology was complex and knowledge-intensive, demanding more information and new skill sets of farmers and extension agents. In most cases, poorly educated farmers switched in a single generation from traditional farming to high-yielding variety and multiple cropping practices; Thus, diffusion and adoption of new technology took time. A second reason for low TFPG during green revolution could be that many small farmers invested in tubewells to meet the water supply needs with the introduction of high-yielding seed. However, when the fixed cost was incurred, these tube wells were initially underutilised and thus, during the initial investment period, TFP gains were underestimated (Berndt and Fuss, 1986). Annex 3. TFPG Estimates with Alternate Cost Shares In India Productivity Report (2014) prepared under the India KLEMS project, TFPG estimates for agriculture have been computed using land as an additional input. The cost shares used for TFPG estimation range from 0.38 to 0.40 for labour, 0.17 to 0.21 for land and capital, and 0.20 to 0.27 for intermediate inputs. When the cost shares based on that report are used, it is observed that TFPG rates moderate across all subperiods. The results are presented in Table A2. It is important to note that in this study higher TFPG is due to a higher cost share for land as compared to the Report on Productivity (2014). Although that report took 0.17 to 0.21 as weights for land, it is mentioned that as per discussion with the Commission of Agriculture Costs and Prices, Ministry of Agriculture, an alternate input cost structure where land=0.35, labour =0.25, capital and intermediate input=0.20 as weights would be a more realistic estimate. | Table A1: TFPG Rates Using Alternate Cost Shares | | (Per cent) | | Growth rates | 1981 to 1990 | 1991 to 2000 | 2000 to 2010 | 2011 to 2019 | | TFPG 1 | 1.5 | 1.5 | 2.1 | 2.9 | | TFPG 2 | 1.54 | 1.31 | 1.70 | 2.36 | Note: TFPG 1 refers to the growth rate of TFP based on our study.
TFPG 2 refers to the growth rate of TFP based on alternative cost shares from the Productivity Report prepared under the India KLEMS project.
Source: Authors’ estimates. |
| Table A2: Expected Effect on Agricultural TFP | | Variables | Expected Effect on Agricultural TFP | | Public GCF stock | Positive | | Formal Agriculture Credit | Positive | | Combined Public GCF Stock and R&D | Positive | | R&D Stock | Positive | | Machinery | Positive | | Cropping Intensity | Positive | | Literacy Rate | Positive | | Fertiliser Consumption | Positive | | Terms of Trade | Positive | | Rainfall Deficiency from LPA dummy | Negative | | Source: Authors’ compilation. |
| Table A3: Unit Root Test | | Variables | Augmented Dickey-Fuller test | | Level | First Difference | Decision | | C | C&T | C | C&T | | | Agricultural TFP Index Land adjusted | 0.013 | -2.901 | -9.047*** | -9.045*** | I(1) | | Agricultural TFP Index Land Quality Adjusted | 0.151 | -2.591 | -8.962*** | -9.055*** | I(1) | | Agricultural TFP Index USDA | 0.330 | -1.332 | -7.569*** | -7.763*** | I(1) | | Public GCF Stock | -0.085 | -1.484 | -5.803*** | -6.287*** | I(1) | | Formal Agriculture Credit | 0.788 | -1.261 | -4.813*** | -4.883*** | I(1) | | Combined Public GCF Stock and R&D | 0.483 | -1.499 | -4.103*** | -4.233*** | I(1) | | R&D Stock | -0.451 | -1.687 | -3.385** | -3.339* | I(1) | | Tubewell Irrigated Area | -1.596 | -0.870 | -7.682*** | -8.638*** | I(1) | | Canal Irrigated Area | -2.856* | -3.048 | -5.897*** | -5.814*** | I(1) | | Machinery | -2.724* | -0.604 | -3.885*** | -4.344*** | I(1) | | Terms of Trade | -0.271 | -1.329 | -4.800*** | -4.764*** | I(1) | | Rainfall Deviation from LPA | -5.502 | -5.603 | -10.54*** | -10.42*** | I(0) | Note: ***, **, and * denote rejection of the null hypothesis at 1 per cent, 5 per cent and 10 per cent level of significance, respectively.
All variables are transformed into natural logarithms.
Source: Authors’ estimates. |
|