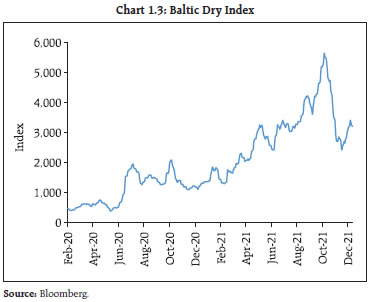
The global recovery is clouded by the emergence of the Omicron variant of COVID-19. Inflationary pressures persist and monetary policy paths are diverging among major economies. On the domestic front, the recovery is regaining traction after the debilitating second wave of the pandemic. The corporate sector has displayed resilience and bank credit growth is showing signs of a gradual recovery, led by the retail segment. Stress is, however, visible among micro, small and medium enterprises (MSME) and in the micro finance segment. Introduction 1.1 The emergence of Omicron as a COVID-19 variant of concern in late November 2021 caused panic to sweep across financial markets, triggering the worst ‘Black Friday’ plunge on record by the Dow Jones that reverberated worldwide. Bond yields and international crude prices turned volatile and the recent strength of the US dollar has been shaken. Fresh travel restrictions as well as quarantining and social distancing protocols have been imposed and countries are on high alert to ascertain the efficacy of existing vaccines to the new mutation. 1.2 Even ahead of Omicron, global growth and trade had begun to lose pace, stalled by formidable headwinds from supply disruptions and bottlenecks, logistics dysfunctions, shipping charges and port congestions as well as shortage in key intermediates and personnel. These forces, along with elevated commodity prices, have rendered inflationary pressures persistent across geographies, posing a serious risk to global economic prospects. As an increasing number of advanced economy (AE) central banks join their emerging market economy (EME) counterparts in either raising monetary policy rates or in telegraphing faster normalisation, global financial conditions have tightened and turned volatile. Retrenchment in capital flows across most EMEs have amplified currency depreciation among these countries. Many of them are contending with large pandemic-induced losses of gross domestic product (GDP) and jobs that will take years to reclaim, even if pre-pandemic levels are being sighted by some. Overall global demand has weakened, with world GDP growth estimated to have lost a full percentage point in Q3:2021 on a sequential seasonally adjusted annualised basis. Overall, the near-term outlook remains clouded, with global growth projections being trimmed by multilateral agencies. 1.3 Looking ahead, an important factor that is set to reshape the macroeconomic and financial landscape is the impact of climate change and the mitigating policy commitments at the Conference of the Parties – 26th United Nations Climate Change Conference (COP-26) - towards environmental resilience. Action on these assurances is being prioritised by the recent intensification of natural calamities - floods in the United Kingdom; heatwaves and wildfires in the United States, Canada and Australia; droughts in Brazil and higher frequency of cyclones and unseasonal rains in various parts of India. The World Bank estimates that more than 750 million South Asians have been affected by one or more climate-related disasters in the last two decades, with the damage exceeding $150 billion. The changing climate is likely to trigger even larger disasters1. At the same time, efforts towards shifting to greener energy and curbing carbon emissions entail transitional implications for factory output, global supply chains, inflation conditions and overall economic activity. Combating climate change may pose medium-term trade-offs, particularly for developing countries facing formidable challenges in access to affordable financing and technology. In this context, the global Network for Greening the Financial System (NGFS), where India has been actively participating after joining it in April 2021, has been studying climate related risks through forward looking scenario analyses to draw out their monetary and financial implications. 1.4 Against this backdrop, this chapter examines the evolving macrofinancial risks arising from global developments and the spillovers to the domestic economy, with a specific emphasis on corporate and MSME sectors. The chapter concludes with salient findings of the Reserve Bank’s latest Systemic Risk Survey conducted in November 2021. I.1 Global Backdrop I.1.1 Macrofinancial Developments and Outlook 1.5 Since the July 2021 issue of the Financial Stability Report (FSR), the rejuvenation of the global recovery in the first half of 2021 has started losing momentum, impacted by resurgence of infections in several parts of the world, supply disruptions and bottlenecks and the persistent inflationary pressures that have manifested themselves in their wake. The slowdown in activity is occurring even in countries with relatively high vaccination rates that seemed to be emerging as global growth drivers. For many EMEs, however, vaccine access remains a binding constraint and output and employment remain below pre-pandemic levels. With inflation persisting at unconscionable levels, several EMEs were first off the mark in normalising and even tightening monetary policy. In AEs too, persistent price pressures have induced some of them to raise policy rates and/or contemplate hastening normalisation. 1.6 As macroeconomic performances diverge and precipitate wide differences in policy paths, global spillovers are unsettling financial markets, asset prices and capital flows with associated macrofinancial risks in this uncertain global environment. Yet, some recent high frequency indicators of macroeconomic conditions appear to be lagging these early warnings from financial developments. 1.7 The global composite purchasing managers’ index (PMI) has risen to expansion zone since July 2020, accelerating to a four-month high in November 2021. Services sector activity has recorded sustained growth since September 2021, offsetting the slight moderation in manufacturing due to elevated price pressures and persistent supply shortages. Overall, financial and business services seem to be weathering the pandemic, while consumer services have weakened and manufacturing is facing headwinds from supply disruptions (Chart 1.1). Global retail e-commerce sales are surging on pent up demand and are expected to close the year 2021 with a growth of 14.3 per cent in US dollar terms2. Global consumer confidence is upbeat with the progress on vaccination, with 41 per cent of respondents indicating increased spending on groceries, 33 per cent on fashion and 30 per cent on health and beauty3. 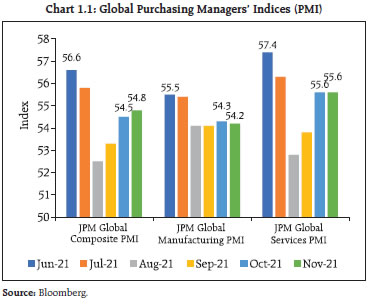 1.8 World merchandise trade volumes, which had risen 22.4 per cent year-on-year in Q2:2021 have been slowing in the second half of the year, as reflected in the November 2021 reading of the Goods Trade Barometer of the World Trade Organization (WTO) at 99.5 - a sharp drop from the reading of 110.4 in August 2021 (Chart 1.2). The decline in the barometer reflects a combination of tapering import demand and disrupted production and supply of widely traded goods such as automobiles and semi-conductors. The Baltic Dry Index, a measure of shipping charges for dry bulk commodities, crossed its highest mark in more than a decade in October 2021, but it recorded a sudden drop in the remaining months of Q4 (Chart 1.3). According to the WTO, merchandise trade volume is projected to slow to 6.6 per cent by Q4:2021. Global trade volume is projected to grow by 9.7 per cent in 2021 and by 6.7 per cent in 20224. 1.9 Even as slowing growth and persistent inflationary pressures have shifted the balance of risks around the global recovery to the downside, several new risks have emerged on the horizon. Decentralised Finance (DeFi), which is regarded as the new form of intermediation in crypto markets, has recently been flagged by the Bank for International Settlements (BIS) as carrying the danger of concentration of power. Vulnerabilities such as high leverage, liquidity mismatches, built-in interconnectedness and the absence of shock absorbers such as banks could undermine financial stability as DeFi becomes widespread. Yet another risk stems from the rapid growth and consolidation of private markets that revolve around funds gathered from institutional investors by asset managers that are typically private equity or venture capital firms that have expanded into provision of credit. Private markets tend to be highly pro-cyclical in risk-taking patterns in their search for yields, thereby amplifying spillovers. The rapid growth of open-ended bond funds is another risk, exacerbating stress in financial markets, especially through fire sale dynamics as was seen in the March 2020 bond market turmoil and subsequent episodes. The rapid growth of foreign exchange derivative markets in EMEs, especially in Asia, has been accompanied by increased trading in forex derivatives in EME currencies against the US dollar, which has more than doubled since 2013. Since hedging instruments are typically short-term, maturity mismatches inherently develop between long-term dollar assets and short-term hedges, exposing investors to rollover risks and dollar funding shortages in periods of market stress. These developments impinge on a highly unsettled international environment clouded by uncertainties relating to the pace of normalisation of monetary policy by systemically important central banks, heightened geopolitical tensions and above all, the course of the pandemic. Reflecting these dynamics, the Global Economic Surprise Index (GESI), which compares incoming data with economists’ forecasts, went into negative territory during Q3:2021 and it was only towards the end of November 2021 that it started to edge up (Chart 1.4). 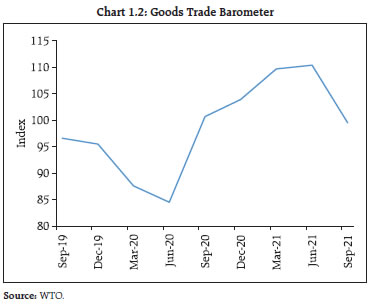
 1.10 In October 2021, the International Monetary Fund (IMF) revised its outlook for the global economy downwards relative to its April 2021 projections. It expected that global output would grow by 5.9 per cent in 2021 before moderating to 4.9 per cent in 2022 (Table 1.1). The projections are marked by a widening divergence in growth paths for advanced economies and developing countries largely due to differences in coverage of vaccination and policy support. The IMF had indicated the likelihood of further downgrades in its projections due to the emergence of the Omicron variant5.
| Table 1.1 : Growth Projections for 2021-2023 | | (per cent) | | | 2020 | 2021* | 2022* | 2023* | | IMF | | | | | | Advanced Economies | -4.5 | 5.2 | 4.5 | 2.2 | | Emerging Markets and Developing Economies | -2.1 | 6.4 | 5.1 | 4.6 | | World | -3.1 | 5.9 | 4.9 | 3.6 | | OECD | | | | | | World | -3.4 | 5.6 | 4.5 | 3.2 | Note *: Projections.
Source: IMF’s World Economic Outlook Database (October 2021), OECD Economic Outlook, Volume 2021 Issue 2 (December). | 1.11 More recently, i.e., in December 2021, the Organisation for Economic Cooperation and Development (OECD) pointed to the loss of momentum of the global recovery and that it is becoming increasingly imbalanced. It noted that stronger and longer-lasting inflation pressures have emerged at an unusually early stage of the cycle, with labour shortages and supply bottlenecks. Accordingly, the OECD expects the global recovery to continue but moderate over time. The projection of global GDP growth for 2021 has been adjusted downwards from its earlier projection in September 2021 by 10 basis points to 5.6 per cent, while easing to 4.5 per cent in 2022 and 3.2 per cent in 2023 (Table 1.1). The OECD expects global output to grow by 3.8 per cent (y-o-y) in Q4:2021. 1.12 In the months following the release of the July 2021 FSR up to the emergence of Omicron, global financial markets had shown resilience amidst bouts of volatility triggered by resurgence of infections in various parts of the world, diverging paths of recoveries and consequent monetary stances and actions. Risk appetite had resumed in equity markets, with stock indices posting new highs in several countries. Equities were buoyed by the sustained strength of realised and expected earnings, despite elevated option prices conveying investor nervousness about the risk of imminent correction. The ground lost by stock prices in August and early September due to persisting supply chain disruptions and elevated commodity prices was recouped subsequently. Corporate bond markets too remained upbeat, with investment grade spreads below historical levels and even for lower rated high yield bonds right up to late November. Strong corporate results in the July-September quarter prompted corporate bond issuances above pre-pandemic levels, with record offerings of lower rated bonds. They were supported by easy financial conditions, including in private markets. Risk appetite extended to crypto assets, with the rising profile of DeFi providing added momentum. 1.13 By contrast, gilt bond markets experienced considerable volatility and patches of illiquidity. Market sentiment was unsettled by a growing certainty of normalisation of monetary policy sooner rather than later. The disconnect with central bank forward guidance produced wide fluctuations in the shape of yield curves in various countries. In November, when systemic central banks confirmed the commencement of normalisation amidst alarming increases in inflation prints, gilt markets started turning volatile, pricing in interest rate increases in advance of central bank communication. This was starkly reflected in the overnight index swap (OIS) rates, suggesting that government bond markets and central banks had widely differing perceptions on the macroeconomic outlook. The markets’ view seemed to be confirmed by central banks pivoting to less accommodative guidance and shorter-term yields rose higher than longer-term yields, flattening yield curves across the world. Longer term yields had risen markedly between August and October, tracking crude prices which reflected similar sentiments about the redux of demand and earlier interest rate increases than later. Investor positioning and leverage amplified yield moments from October as the earlier complacency about relaxed lift-offs was jolted and there was a scurry for unwinding of positions even as liquidity became stretched. Real yields sank deeper into negative territory. 1.14 EMEs were roiled by the tightening of global financial conditions superimposed on elevated domestic inflation. Accordingly, persistent downward pressure on exchange rates ensued. In many of them, high inflation co-existed with flagging recoveries. In most EMEs, domestic financial conditions had considerably tightened when Omicron arrived. The US dollar posted large appreciations vis-a-vis EME currencies, which were also weakened by stubbornly rising crude prices. Equity portfolio flows dried up and turned into outflows. Flows into EME bond markets displayed country-specific patterns. In countries prompted to raise policy rates by inflation pressures, local bond yields rose, tightening their financial conditions further, and corporate bond spreads widened. 1.15 Omicron changed all this. Equity markets lost previous gains, and, in several countries, they were left with losses. Corporate bond spreads widened. Gilt yields turned volatile but fell in early December as the new variant spread apparently with milder symptoms than feared. In EMEs, currencies extended their depreciation and yields hardened, causing financial conditions to tighten further. Financial conditions have also tightened in AEs, almost symmetrically in the US and the Euro area. With Omicron triggering safe haven demand, there has been a sharp appreciation of the US dollar against both AE and EME currencies (Charts 1.5-1.7). 1.16 In contrast to bearishness in short to medium term yields of major AEs, especially in the US and the UK, German short-term yields have stayed flat, reflecting somewhat diminished economic prospects for the Euro zone and the sustainability of the European Central Bank (ECB)’s current accommodative stance. In the long-term too, German yields have moderated, which is also evident more recently in the US and the UK yields (Charts 1.8-1.9).
I.1.2 Other Global Macrofinancial Developments 1.17 The global macrofinancial environment is fraught with policy shifts across a broad range of large EMEs as also AEs. A. Public Debt 1.18 The response to the pandemic has caused sovereign debt levels around the world to rise sharply, with the sizable fiscal stimuli to support lives and livelihoods (Table 1.2). This is likely to leave lasting scars on government finances, with implications for medium term fiscal sustainability and policy space to deal with future crises. | Table 1.2 : General Government Fiscal Balance, 2019–26: Overall Balance | | (per cent of GDP) | | | Actuals | Projections | | 2019 | 2020 | 2021 | 2022 | 2023 | 2024 | 2025 | 2026 | | World | -3.6 | -10.2 | -7.9 | -5.2 | -4.2 | -3.8 | -3.6 | -3.5 | | Advanced G-20 | -3.6 | -11.7 | -9.6 | -5.4 | -4.0 | -3.6 | -3.5 | -3.5 | | Euro Area | -0.6 | -7.2 | -7.7 | -3.4 | -2.4 | -2.0 | -1.7 | -1.6 | | France | -3.1 | -9.2 | -8.9 | -4.7 | -3.9 | -3.6 | -3.4 | -3.4 | | Germany | 1.5 | -4.3 | -6.8 | -1.8 | -0.4 | 0.0 | 0.5 | 0.5 | | Italy | -1.6 | -9.5 | -10.2 | -4.7 | -3.5 | -2.9 | -2.6 | -2.4 | | Japan | -3.1 | -10.3 | -9.0 | -3.9 | -2.1 | -2.1 | -2.1 | -2.2 | | United Kingdom | -2.3 | -12.5 | -11.9 | -5.6 | -3.6 | -3.2 | -3.1 | -2.9 | | United States | -5.7 | -14.9 | -10.8 | -6.9 | -5.7 | -5.2 | -5.3 | -5.3 | | Others | -0.2 | -5.2 | -4.2 | -2.3 | -1.4 | -1.0 | -0.7 | -0.6 | | EMEs | -4.7 | -9.6 | -6.6 | -5.8 | -5.2 | -4.8 | -4.4 | -4.1 | | Emerging G-20 | -5.4 | -10.3 | -7.0 | -6.3 | -5.7 | -5.2 | -4.8 | -4.4 | | Asia | -5.9 | -10.8 | -7.9 | -7.0 | -6.2 | -5.7 | -5.2 | -4.8 | | China | -6.3 | -11.2 | -7.5 | -6.8 | -6.2 | -5.6 | -5.0 | -4.5 | | India | -7.4 | -12.8 | -11.3 | -9.7 | -8.8 | -8.3 | -8.1 | -7.8 | | Low-Income Developing Countries | -3.9 | -5.2 | -5.4 | -5.0 | -4.5 | -4.3 | -4.1 | -3.9 | | World Output (per cent) | 2.8 | -3.1 | 5.9 | 4.9 | 3.6 | 3.4 | 3.3 | 3.3 | Note: Overall Fiscal Balance refers to net lending (+) / net borrowing (-) of the government.
Source: IMF Fiscal Monitor, October 2021. | 1.19 A significant share of the new supplies of debt paper was absorbed by central banks through quantitative easing (QE). As central banks turn off liquidity spigots even as fiscal conditions remain stretched, global debt markets are likely to face turbulent transitions. 1.20 In the case of several AEs, central banks’ aggregate holdings of government debt are significant; even going into 2021, they have continued to absorb a significant part of new issuances (Chart 1.10). Hence, as central banks get ready to unwind their extraordinary interventions in debt markets, expectations about the impact on liquidity and interest rates have turned bearish and yields have whipsawed (Chart 1.11). 1.21 Uncertainty regarding the risk-free sovereign rate has also led to volatility in funding markets, as reflected in the upward shift in the term structure of volatility for USD swaptions, with the 3-year rate as underlying (Chart 1.12). B. Risks in Bank Balance Sheets 1.22 As policy normalisation commences in several countries, realignment of interest rates could lead to discretionary shifts in portfolios among domestic banks as well as recalibration of banking sector liabilities. In this context, a noteworthy adjustment has been observed in European banks’ liability strategies, with demand for term funding issuances by banks (both short-term and long-term) going up and central bank liquidity as a source of liability financing falling sharply (Chart 1.13).
C. Risks in the Non-Banking Financial Sector 1.23 Unprecedented QE by central banks and the resultant infusion of liquidity has led to large expansion of balance sheets of mutual funds, in particular, the bond / money market funds (Chart 1.14). Spillovers from such funds to asset market liquidity intensify in times of volatility. Lower interest rates have also resulted in expansion of leveraged bets on equity prices (margin trades) in some prominent markets. Liquidity risk remains a concern for some bond funds, particularly those which offer investors high redemption frequency while investing in asset classes that turn illiquid during times of stress6. 1.24 Moreover, domestic non-banks are major investors in government debt in several AEs (Chart 1.15). Their incremental share in government debt subscription remains significant. In the context of winding down of QE, any synchronised effort to shrink central banks’ balance sheets may potentially lead to abrupt recalibration of interest rates levels.
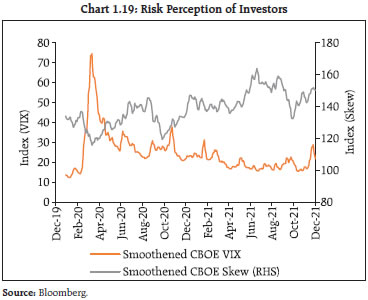
I.1.3 Capital Flows and Exchange Rate Volatility 1.25 In an international environment characterised by heightened uncertainty, EMEs are particularly susceptible to ebbs and flows in bond investors’ risk appetite and hence the vicissitudes of capital flows - surges; sudden stops; reversals. Bond flows to EMEs have generally moved in line with portfolio returns, with the onset of the pandemic; however, they have flattened as investors scrambled to assess the emerging global interest rate environment (Chart 1.16). 1.26 Cross-border banking flows to non-bank entities of EMDEs remained relatively stable during the pandemic (Table 1.3). EME cross-currency basis (CCB) swaps, which declined sharply in the wake of the pandemic, have risen since, implying that the demand for US dollar flows through the CCB swap route has also normalised (Chart 1.17). While the Federal Reserve’s currency swap lines with major economies (including EMEs such as Brazil and Mexico) had a stabilising effect, negative CCB swap rates persisted among EMEs till Q2:2021. 1.27 In recent years, equity and bond flows to EMEs have generally moved in sync. Since the outbreak of the pandemic, however, equity flows to EMEs have been robust on the back of resilient corporate earnings (Chart 1.18). Concerns are, however, emerging about the slow recovery in contact intensive service sectors, the disruptions caused by global supply chains and finally, the uncertain prospects for the Chinese economy. As a result, while option implied volatility of S&P 500 (VIX) has been range-bound, a common market-based indicator representing cost of protection against sharp declines, i.e., the CBOE Skew has been off its post-pandemic lows (Chart 1.19). | Table 1.3 : Cross-border Banking Flows to Non-Bank Entities of EMDEs | | (USD billion) | | Quarter | Non-Bank Sector | Projections | | Claims | Liabilities | Claims | Liabilities | | Q4-2019 | 2,123.1 | 1,327.2 | 1,590.6 | 941.8 | | Q1-2020 | 2,101.6 | 1,369.3 | 1,569.8 | 943.8 | | Q2-2020 | 2,127.0 | 1,346.0 | 1,585.9 | 945.9 | | Q3-2020 | 2,149.8 | 1,367.7 | 1,625.3 | 960.1 | | Q4-2020 | 2,227.9 | 1,419.2 | 1,672.7 | 1,011.5 | | Q1-2021 | 2,221.1 | 1,408.8 | 1,677.7 | 987.3 | | Q2-2021 | 2,246.5 | 1,462.6 | 1,684.4 | 1,030.9 | | Source: BIS. |
I.1.4 London Inter Bank Offered Rate (LIBOR) Transition 1.28 The impending transition of Sterling, Euro, Swiss Franc and Japanese Yen LIBOR settings in all tenors, and US Dollar LIBOR 1-week and 2-month settings after end-December 2021 has imparted urgency to moving towards benchmarking of products in alternate risk-free rates (ARRs) and development of interest rate derivative (IRD) segments linked to ARRs. The average monthly ISDA-Clarus8 risk-free rates (RFR) Adoption Indicator, which tracks how much global trading activity (as measured by DV019) is conducted in cleared over-the-counter (OTC) and exchange-traded IRDs referencing ARRs in six major currencies, touched 17.4 per cent in Q3:2021, up from 11.0 per cent in the preceding quarter. Progress across currencies in adoption of ARR benchmarking has been uneven, with Euro-linked IRDs lagging (Table 1.4). 1.29 The adoption of the ARR Index for long-term IRDs has been slow even in currencies with significant ARR adoption, as per the data on OTC derivatives submitted to US regulators (Table 1.5). Nevertheless, the position has improved in Q3:2021 relative to Q2. Since real sector hedging of interest rate and currency exposures is largely dependent on a liquid and vibrant long-term derivatives segment, slow progress in this regard, particularly for the Euro, may have implications for efficient risk transfer. 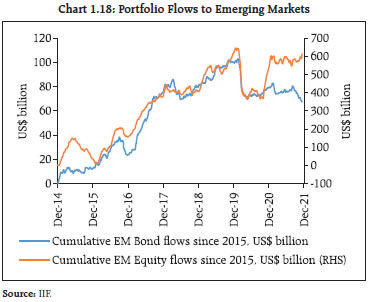
| Table 1.4: Percentage DV01 Contributed by RFRs - Currency wise | | (per cent) | | Month | RFR USD | RFR EUR | RFR GBP | RFR JPY | RFR AUD | RFR CHF | | Jan-21 | 5.7 | 0.8 | 45.9 | 3.5 | 3.1 | 7.7 | | Feb-21 | 5.0 | 1.0 | 45.8 | 3.5 | 5.2 | 8.8 | | Mar-21 | 4.6 | 1.3 | 44.9 | 2.4 | 5.1 | 6.3 | | Apr-21 | 7.4 | 1.7 | 51.0 | 3.9 | 6.0 | 16.7 | | May-21 | 6.8 | 1.5 | 54.9 | 6.8 | 2.7 | 13.7 | | Jun-21 | 6.0 | 1.8 | 61.0 | 6.9 | 5.1 | 13.7 | | Jul-21 | 7.4 | 2.1 | 58.8 | 23.4 | 17.1 | 34.1 | | Aug-21 | 12.5 | 2.4 | 63.3 | 49.5 | 14.5 | 50.4 | | Sep-21 | 15.2 | 2.3 | 64.8 | 54.2 | 18.5 | 43.4 | | Oct-21 | 15.8 | 9.2 | 75.3 | 63.4 | 19.7 | 53.8 | | Source: ISDA Clarus RFR adoption indicator. | I.1.5 Commodity Markets 1.30 Inflationary pressures have increased significantly in the recent months, especially across AEs, driven by upto 30 per cent year-on-year increases in energy prices (Table 1.6). Even food prices have remained far above their long-term growth rates. 1.31 Global commodity markets continued their rise during the second half of 2021, with patches of price corrections emanating from developments in China before the emergence of Omicron led to a sharp correction in the second half of November 2021. Some of the declines have started reverting again in early December. The outlook appears uncertain as supply bottlenecks gradually ease, global liquidity and monetary policy regimes begin recalibration to normalise and demand gathers steam. 1.32 Before Omicron, crude oil prices had been hardening, supported by pent-up demand and increasing mobility as more countries reopened their borders10 (Chart 1.20). While call options dominated the trading volume since October 2021, bearish sentiments with regard to the near-term oil price outlook have surfaced recently due to the emergence of Omicron (Chart 1.21). The World Bank expects non-energy commodity prices to soften from their current elevated levels as supply bottlenecks ease. The demand for industrial and base metals is, however, likely to be robust on the back of global investment in decarbonisation (Chart 1.22). Inflationary pressures are reinforced by the fall in production of food items, supply side disruptions and rising input costs. The food price index of the Food and Agriculture Organisation (FAO) rose by 27.3 per cent in November 2021 (y-o-y), led by sharp increases in prices of dairy products, cereals, edible oils and sugar (Chart 1.23). | Table 1.5 : US Reported RFR-linked Interest Rate Derivatives | | (USD billion) | | Quarter | Q3 2021 | YTD Q3 2021 | Traded Notional
(US$ billions) | Trade Count | Traded Notional
(US$ billions) | Trade Count | | SOFR | 2,121.3 | 20,351 | 3,815.5 | 32,190 | | Upto 1 year | 595.9 | 966 | 1,338.2 | 1,850 | | 1 to 5 years | 882.1 | 8,437 | 1,535.5 | 14,456 | | Over 5 years | 643.3 | 10,948 | 941.7 | 15,884 | | SONIA | 4,867.4 | 26,200 | 12,059.8 | 61,217 | | Upto 1 year | 3,510.9 | 2,766 | 8,667.5 | 6,735 | | 1 to 5 years | 815.0 | 8,810 | 2,010.5 | 19,921 | | Over 5 years | 541.4 | 14,624 | 1,381.8 | 34,561 | | SARON | 81.9 | 1,222 | 100.6 | 1,460 | | Up to 1 year | 29.7 | 70 | 38.7 | 97 | | 1 to 5 years | 40.6 | 672 | 46.7 | 770 | | Over 5 years | 11.6 | 480 | 15.1 | 593 | | TONA | 204.4 | 2,729 | 349.1 | 3,203 | | Upto 1 year | 65.9 | 213 | 187.3 | 437 | | 1 to 5 years | 73.8 | 856 | 93.7 | 1,021 | | Over 5 years | 64.6 | 1,660 | 68.1 | 1,745 | | €STR | 184.2 | 857 | 320.5 | 1,586 | | Upto 1 year | 145.0 | 211 | 247.1 | 355 | | 1 to 5 years | 26.5 | 282 | 47.4 | 538 | | Over 5 years | 12.7 | 364 | 26.1 | 693 | SOFR - Secured Overnight Financing Rate (US)
SONIA - Sterling Overnight Index Average (UK)
SARON - Swiss Average Rate Overnight (Switzerland)
TONA - Tokyo Overnight Average Rate (Japan)
€STR - Euro Short-Term Rate (Euro area)
Source: ISDA Clarus quarterly RFR adoption report |
| Table 1.6 : CPI Inflation in Select Advanced Economies | | (per cent) | | | Total | Energy | Food | | US | 6.2 | 30.0 | 5.4 | | UK | 3.8 | 22.4 | 1.3 | | Germany | 4.5 | 18.7 | 4.5 | | OECD – Total | 5.2 | 24.2 | 4.5 | | Source: Organisation for Economic Co-operation and Development (OECD) |
1.33 The role of investment funds in fuelling and sustaining bullishness in commodity prices is becoming increasingly important as the assets under management (AUM) of these funds are significant (Chart 1.24). Retail and institutional investments in commodities are estimated at USD 710 billion in October 2021 after taking into account the active and passive investments across Europe and US11. Such investments are driven by the motive of diversification of investment risk with imperfect pricing hedges. The commodities targeted by the investment funds span agricultural products to precious metals, with a recent spike in energy.
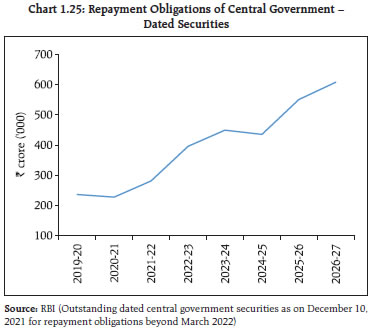
I.1.6 Private Cryptocurrency Risks 1.34 The proliferation of private cryptocurrencies across the globe has sensitised regulators and governments to the associated risks. Private cryptocurrencies pose immediate risks to customer protection and anti-money laundering (AML) / combating the financing of terrorism (CFT). They are also prone to frauds and to extreme price volatility, given their highly speculative nature. Longer-term concerns relate to capital flow management, financial and macro-economic stability, monetary policy transmission and currency substitution. 1.35 According to the Financial Action Task Force (FATF)12, the virtual asset ecosystem has seen the rise of Anonymity-Enhanced Cryptocurrencies (AECs), mixers and tumblers, decentralised platforms and exchanges, privacy wallets, and other types of products and services that enable or allow for reduced transparency and increased obfuscation of financial flows. New illicit financing typologies continue to emerge, including the increasing use of virtual-to-virtual layering schemes that attempt to further muddy transactions in a comparatively easy, cheap and anonymous manner. 1.36 Aggregate market capitalisation of the top 100 crypto currencies has reached USD 2.8 trillion13. In the EMEs that are subject to capital controls, free accessibility of crypto assets to residents can undermine their capital regulation framework. 1.37 To sum up, even as global growth and trade lose pace, global financial markets remain resilient, although Omicron has imparted heightened uncertainty. Although equity markets suffered the most, they have clawed back losses. Nonetheless, the risk of sharp corrections remains elevated. Corporate bond spreads have widened post-Omicron, but appetite remains strong, especially in the lower rated end of the spectrum. As central banks dial down their extraordinary liquidity support, short-term yields in the government bond markets are expected to rise more sharply than for longer maturities and flatten the yield curve. Patches of illiquidity and disorderly trading could well be encountered if divergences between the outlook of markets and forward guidance of central banks force unwinding of leveraged positions. Financial conditions are tightening for EMEs, with rising bond yields and currency depreciations. Elevated inflationary pressures co-existing with large slack in economic activity is complicating the conduct of monetary policy against the backdrop of limited fiscal space and the unrelenting grip of the pandemic. 1.38 The rapid growth of decentralised finance (DeFi) is geared predominantly towards speculation and investing and arbitrage in crypto assets, rather than towards the real economy. The limited application of anti-money laundering and know-your-customer (AML/KYC) provisions, together with transaction anonymity, exposes DeFi to illegal activities and market manipulation, and poses financial stability concerns. 1.39 Open ended funds (OEFs) are enhancing liquidity in bond markets, but they also have financial stability implications. Hence, their liquidity buffers could be expanded by a countercyclical add-on. In addition, OEFs could collectively be moved to redemption terms that are more closely aligned with the liquidity profile of their portfolios. Redemptions in kind supported by financial intermediaries to mitigate liquidity stresses could be an alternative approach to enhance resilience. Macroprudential tools should be stringent enough to help ensure liquidity mismatches are adequately managed and do not give rise to externalities. These tools should be able to identify and address systemic risks in the OEFs. The tools should be “usable” during episodes of stress. 1.40 Private markets have become an important financing channel for the real economy, especially in Asia where their dominant activity is venture capital. Private markets seem to exhibit relatively high procyclicality in risk-taking. In this context, funds involved in private credit reveal a strong sensitivity to monetary policy actions and stances. 1.41 Non-bank actors are bringing in dollar funding stresses, revealing gaps in traditional policy approaches to forex (FX) markets. These non-bank investors have traditionally been subject to less stringent FX liquidity regulation and risk management rules than banks, and financial authorities face challenges in monitoring their funding needs. At this stage, it is important to better understand non-bank investors’ role in creating or propagating systemic risk so that policy actions can be taken to smooth out financial risk-taking over time. In this context, a consolidated approach to oversight that encompasses the root causes of dollar funding problems created by institutional investors and asset managers in FX markets may be appropriate. Risk based supervision can allow for flexible hedging of currency risk in order to mitigate spikes in the demand for short-term dollars in times of stress as well as incentivise longer-term hedging. 1.42 Finally, as the world prepares for combating climate change and enhancing environmental resilience, attention needs to go to environmental, social and governance (ESG) markets to support the transition. Here, accurate ESG information is key, with a reliable and standardised taxonomy for cross-country comparison and robust metrics. I.2 Domestic Macrofinancial Risks 1.43 In India the second wave of the pandemic showed distinct signs of subsiding by July 2021. Localised restrictions were eased and the engines of growth started revving up, aided by the progress of vaccination. The number of daily new infections, which peaked at over 4 lakh cases in mid-May 2021, moderated to less than 60 thousand in early July and less than 10 thousand by early December 202114. The pace of vaccination has been scaled up significantly, with 14 instances of ten million shots delivered on a single day, cumulatively numbering 1.42 billion up to December 28, 202115. With nearly 60 per cent of the adult population fully vaccinated, rapid progress is being made towards attaining 80-90 per cent coverage of the target population equivalent to herd immunity levels16. 1.44 In the period following the release of the July 2021 FSR, the Indian economy expanded by 8.4 per cent year-on-year (y-o-y) in July-September 2021, with the level of GDP exceeding pre-pandemic levels (July-September 2019) for the first time since the pandemic struck. More recent high-frequency indicators of economic activity suggest some loss of momentum in the third quarter of 2021-22. The pace of the recovery remains uneven across sectors, inflation formation is being subjected to repetitive supply shocks and the outlook is overcast with global risks. Omicron haunts near-term prospects. I.2.1 Public Finance 1.45 During April-October 2021, all the deficit indicators of the centre (gross fiscal deficit; primary deficit; revenue deficit) exhibited improvement y-o-y as well as from their pre-pandemic levels. Gross tax revenues have been buoyant, with robust growth under all major heads, with direct taxes in the lead. Total expenditure grew 9.9 per cent, the noteworthy feature being expansion of capital outlay by 28.3 per cent, led by roads and highways (Table 1.7). 1.46 With the second supplementary demand of grants presented in December 2021, the budgeted fiscal deficit of 6.8 per cent of GDP may come under strain. It is important to note that the supplementary demand for grants embeds a substantial component of fiscal consolidation in the form of retirement of high cost repayment obligations relating to Air India. The size of gross government borrowing has proceeded at a pace that suggests that budget estimates will be adhered to (Table 1.8). 1.47 However, repayment obligations (difference between gross and net borrowings) of the central government indicate a significant uptrend going forward, implying that gross borrowing is likely to remain elevated notwithstanding fiscal consolidation (Chart 1.25). | Table 1.7: Fiscal Indicators – Central Government | | (₹ crore unless otherwise stated) | | | Apr-Oct 2020 | Apr-Oct 2021 | % change (y-o-y) | | Gross Tax Revenue | 8,75,591 | 13,64,101 | 55.79 | | of which, Direct Tax Revenue* | 3,86,025 | 6,59,066 | 70.73 | | of which, Indirect Tax Revenue# | 4,45,673 | 6,46,283 | 45.01 | | Tax Revenue (Net) | 5,75,697 | 10,53,135 | 82.93 | | Total Expenditure | 16,61,454 | 18,26,725 | 9.95 | | of which, Capital Expenditure | 1,97,355 | 2,53,270 | 28.33 | | Fiscal Deficit | 9,53,154 | 5,47,026 | -42.61 | | Revenue Deficit | 7,72,196 | 3,13,478 | -59.40 | | Primary Deficit | 6,19,698 | 1,47,289 | -76.23 | * Includes Securities Transaction Tax, Fringe Benefit Tax, Wealth Tax etc.
# Includes Central GST, Integrated GST, Customs, Excise Duties, Service Tax.
Source: Controller General of Accounts (CGA), Ministry of Finance. |
| Table 1.8 : Market Borrowings by the Centre and States | | (face value in ₹ crore) | | Item | Gross | Net | | 2019-20 | 2020-21 | 2021-22 | 2020-21 | 2021-22*
Budget | 2021-22
(Till Nov 26) | | Budget | (Till Nov 26) | | Government of India | 7,10,000 | 13,70,324 | 12,05,500 | 8,70,357 | 11,43,114 | 9,67,708 | 6,55,800 | | State Governments | 6,34,521 | 7,98,816 | NA | 4,06,246 | 6,51,777 | NA | 2,97,259 | | Source: RBI | 1.48 During H1: 2021-22, SCBs’ acquisition of government securities (G-Secs) and state development loans (SDLs) increased sharply, with their incremental holding accounting for 39 per cent and 68 per cent of the net issuance of G-Secs and SDLs, respectively. The dated G-Sec holding of the Reserve Bank also went up during the period, accounting for 27 per cent of the net issuance. (Tables 1.9 - 1.10). 1.49 The quarterly weighted average cost of incremental government borrowing has inched up in line with market benchmark yield movements (Chart 1.26). Yields in the tenor bucket of 5-15 years have eased in December (as on December 13, 2021) vis-à-vis at the beginning of financial year (Chart 1.27). Transfers to the held-to-maturity (HTM) segment have risen for both G-Sec and SDLs, reflecting a general bearish outlook on interest rates and a decline in active interest rate risk (Table 1.11). Going forward, banks’ reliance on trading gains through revaluation of assets to drive other operating income is likely to decline. | Table 1.9 : Incremental Holdings of dated G-Secs and SDLs : H1:2021-22 | | (₹ crore) | | | G-Secs | SDLs | | SCBs | 2,30,585 | 1,85,441 | | Insurance Companies | 59,082 | -23,235 | | Provident Funds | -28,446 | -94,811 | | RBI | 1,61,179 | 5,454 | | Source: RBI. |
| Table 1.10 : Dated G-Secs and SDLs –Investor Profile | | (per cent) | | | G-Secs as a proportion to SCBs' domestic assets | SDLs as a proportion to SCBs' domestic assets | SLR securities as a proportion to SCBs’ domestic assets | RBI holding as a proportion total outstanding G-Secs | | Mar-2008 | 19.2 | 3.8 | 23.0 | 7.8 | | Mar-2015 | 16.5 | 5.0 | 21.6 | 13.5 | | Mar-2020 | 15.1 | 6.7 | 21.8 | 15.1 | | Mar-2021 | 15.5 | 7.0 | 22.5 | 16.2 | | Sep-2021 | 16.1 | 7.7 | 23.8 | 17.0 | | Source: RBI. |
| Table 1.11 : Bank Group-wise Incremental HTM holdings, H1:2021-22 | | (₹ crore) | | | G-Secs | SDLs | Others | Total | | Public Sector Banks (PSBs) | 17,403 | 64,885 | -24,101 | 58,187 | | Private Sector Banks (PVBs) | 50,436 | 6,394 | 10,334 | 67,163 | | Foreign Banks (FBs) | 5,478 | 580 | - | 6,058 | | All SCBs | 73,317 | 71,858 | -13,768 | 1,31,407 | Note: Based on 46 SCBs which account for about 98 per cent of the total assets of the banking system.
Source: Individual bank submission to RBI. | I.2.2 Government Securities and Fixed Income Derivatives Markets 1.50 Domestic fixed income markets have remained resilient during the pandemic and volumes have picked up in recent months. The government securities market and overnight indexed swaps (OIS) market turnovers show a general rise in activity in both segments (Chart 1.28). This has also coincided with a softening of realised volatility in the 10-year segment, the most traded tenor, even as volatility has inched up at the short end of the curve in response to the rebalancing of liquidity by the Reserve Bank through variable rate reverse repo (VRRR) auctions. 1.51 The auction methodology for issue of benchmark securities of certain tenors and floating rate bonds (FRBs) was changed to the uniform price auction method in July 2021.This shift in auction methodology has generally narrowed bidding spreads and led to better price realisation (Box 1.1). Box 1.1: An Assessment of the Uniform Price Auction Method The impact of the change in auction methodology to the uniform price auction method for issue of benchmark securities of 2-year, 3-year, 5-year, 10-year, 14-year tenors and FRBs was evaluated in respect of two parameters: (a) participation of auction underwriters, i.e., the primary dealers (PDs); and (b) participation of other bidders. For non-bank PDs’ auction bids in respect of primary auctions of relevant tenors and the bidding behaviour of new PVBs during April 2020 - September 2021, the change in auction methodology appears to have had a statistically significant beneficial impact on the success ratio for both these investor classes (Table 1). In addition to the success ratio, the intensity of bidding can be gauged from the spread between the weighted average price of bidding and weighted average price for bids accepted. The change in auction methodology has generally narrowed the spread of bidding (Table 2). Combined with the previous result of the crowding-in of additional investor interest due to uniform pricing, this implies a better price realisation for the Government under the revised auction methodology. | Table 1: Auction Methodology and Bidding Behaviour | | Variable | PD Success Ratio | New PVB Success Ratio | | Constant | 0.115199 | 0.269432 | | | (4.324)*** | (5.422)*** | | ACU_COMM_CUT_OFF | 0.000184 | -0.002425 | | | (0.214) | (-1.510) | | YLD_CHG_ PREV_AUC | -0.000688 | 0.002726 | | | (-0.502) | (1.065) | | YLD_CHG_ PREV_DAY | 0.003674 | 0.001191 | | | (1.075) | (0.187) | | MATURITY_ AUC_PAPER | 0.006553 | 0.005462 | | | (3.518)*** | (1.578) | | DISCR_AUC_DUMMY | -0.049638 | -0.092788 | | | (-2.084)** | (-2.089)** | | R-squared | 0.098065 | 0.051365 | | Adjusted R-squared | 0.073555*** | 0.025587* | Note: *** Significant at 1% level; ** Significant at 5% level; * Significant at 10% level; Values in parentheses represent standard error.
ACU_COMM_CUT_OFF: underwriting commission cut-off for relevant securities; YLD_CHG_PREV_AUC: difference in 10-year benchmark yield between previous trading day closing of next auction and prior auction closing (in basis points);
YLD_CHG_ PREV_DAY: difference in 10-year benchmark yield between auction day opening and previous day closing (in basis points);
MATURITY_AUC_PAPER: difference in number of years between maturity of the paper being auctioned and the settlement date; and
DISCR_AUC_DUMMY: auction performed under discriminatory method given dummy value of 1 and uniform price auction method given as 0.
Source: RBI staff calculations |
| Table 2: Auction Methodology and Aggression in Bidding | Dependent Variable: SPREAD
Method: Least Squares
Sample: 1 190
Included observations: 190 | | Variable | Coefficient | Std. Error | t-Statistic | Prob. | | C | 0.1819 | 0.0421 | 4.316 | 0.0000 | | YLD_CHG_ PREV_AUC | -0.0019 | 0.0033 | -0.586 | 0.5581 | | YLD_CHG_ PREV_DAY | 0.0138 | 0.0082 | 1.695 | 0.0917 | | ACU_COMM_CUT_OFF | 0.0020 | 0.0020 | 0.996 | 0.3204 | | MATURITY_ AUC_PAPER | 0.0254 | 0.0044 | 5.698 | 0.0000 | | UNIFORM_AUC_DUMMY | -0.2772 | 0.0559 | -4.956 | 0.0000 | | R-squared | 0.263 | Mean dependent var | 0.362 | | Adjusted R-squared | 0.243 | S.D. dependent var | 0.322 | | S.E. of regression | 0.280 | Akaike info criterion | 0.324 | | Sum squared residual | 14.442 | Schwarz criterion | 0.426 | | Log likelihood | -24.794 | Hannan-Quinn criterion | 0.366 | | F-statistic | 13.141 | Durbin-Watson stat | 1.888 | | Prob(F-statistic) | 0.000 | | | Note: UNIFORM_AUC_DUMMY: uniform price auction given dummy value of 1 and auction performed under discriminatory method given as 0
Source: RBI staff calculations. | | 1.52 An analysis of the tenor varying volatility profile of the G-sec yield curve (Chart 1.29) reveals interesting results (Box 1.2). The analysis indicates that the three dominant factors in the evolution of volatility of term structure are: (a) simultaneous yield movements in the same direction across tenors; (b) slope of the term curve; and (c) idiosyncratic tenor specific risks. A one standard deviation (1-SD) shock to these factors leads to flattening of the yield curve. A causality test of the impact of interest rate expectations as embedded in the OIS swap curve indicates a lagged impact of the G-Sec on the OIS. While interest rate expectations affect the G-Sec curve initially, its subsequent shifts show a lagged effect on the OIS curve itself, pointing to interaction between the two curves through hedging behavior of market participants. 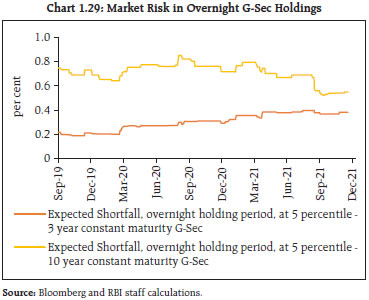
Box 1.2 – Term Structure of Volatility In order to identify the drivers of the yield curve and to understand the interaction of the influence of interest rate expectations - as embedded in the OIS swap curve - on yield curve evolution, a principal component analysis (PCA) is undertaken, entailing identification of latent term structure volatility drivers to explain the underlying volatility17 of the term structure. Since liquidity management operations underwent a shift to accommodation in 2019, this break is also captured in the analysis by using data from January 2019 to November 2021. The results reveal common factors in the G-Sec curve18 and the OIS curve19 (Table 1). The first principal component (PC-1) is by far the most dominant component, explaining between 94 per cent to 96 per cent of volatility in the term structure. The first three components together practically account for the entire volatility of the term structure, irrespective of the underlying curves. PC-1 has positive factor loading across tenors, implying that this component can be deemed to be explaining risk arising out of simultaneous yield movements in the same direction across tenors. The second component (PC-2) has positive factor loadings in the OIS segment for the first three tenors (till 6 months) and a negative coefficient for the rest of the tenor. For the G-Sec par yield curve, the first four tenors of PC-2 (till 1-year) have negative loadings while the remaining tenors have positive loadings. Hence for both the curves, PC-2 can be seen as being indicative of the slope of the term structure. The third component generally seems to define idiosyncratic tenor specific risks. A one standard deviation (1 SD) shock to PC-1 in the G-Sec curve entails a 113 bps increase in yields in the 1-year tenor and an increase of 46 basis points (bps) in the 10-year, implying a bearish flattening of 66 bps following the realisation of the shock. Similarly, a one standard deviation shock to PC-2 in the G-Sec curve (PC-1 and PC-2 being mutually orthogonal, such shocks can happen independently) entails a 2 bps rise in the 1-year yield and a 14 basis point reduction in the 10-year tenor, implying a bullish flattening of 16 bps. Thus, realisation of the interest rate shock scenarios entails a flattening of the yield curve. | Table 1: Principal Component Variance Analysis | | (All numbers in per cent) | | | OIS curve
(Overnight – 5 years) | G-Sec curve
(Overnight – 15 years) | | PC-1 | 94.27 | 96.00 | | PC-1 + PC-2 | 99.73 | 98.44 | | PC-1 + PC-2 + PC-3 | 99.94 | 99.50 | | Source: FIMMDA and staff calculations. | Granger Causality test results indicate that the influence of PC-1 of the OIS curve on the PC-1 of the G-Sec curve shows unidirectional causality running from the OIS curve to the G-Sec curve at a single lag, but the causality becomes bi-directional as the number of lags increases, implying a lagged impact of G-Sec drivers on OIS drivers (Table 2). This also implies the interaction between the two curves through hedging. The PC-2 series is stationary, implying the contemporaneous liquidity and interest rate regimes have little impact (Table 3). | Table 2: Analysis of interaction between movement in G-Sec and OIS Curve | Pairwise Granger Causality Tests
Sample: 1/01/2019 11/16/2021
Lags: 1 | | Null Hypothesis: | Obs | F-Statistic | Prob. | | PC_1_OIS does not Granger Cause G_SEC_PC_1 | 688 | 16.8290 | 5.E-05 | | G_SEC_PC_1 does not Granger Cause PC_1_OIS | | 0.00942 | 0.9227 | Pairwise Granger Causality Tests
Sample: 1/01/2019 11/16/2021
Lags: 2 | | Null Hypothesis: | Obs | F-Statistic | Prob. | | PC_1_OIS does not Granger Cause G_SEC_PC_1 | 686 | 8.36042 | 0.0003 | | G_SEC_PC_1 does not Granger Cause PC_1_OIS | | 5.28576 | 0.0053 | | Source: RBI staff calculations |
| Table 3: Unit Root Analysis of Term Slope Series | Null Hypothesis: PC_2 has a unit root
Exogenous: Constant
Bandwidth: 3 (Newey-West automatic) using Bartlett kernel | Null Hypothesis: PC_2 has a unit root
Exogenous: Constant
Lag Length: 5 (Automatic - based on Modified AIC, maxlag=19) | | | Adj. t-Stat | Prob.* | | t-Statistic | | Phillips-Perron test statistic | -3.471716 | 0.0090 | Elliott-Rothenberg-Stock DF-GLS test statistic | -3.042102 | | Test critical values: | 1% level | -3.439599 | Test critical values: | 1% level | -2.568342 | | | 5% level | -2.865512 | | 5% level | -1.941286 | | | 10% level | -2.568942 | | 10% level | -1.616388 | | *MacKinnon (1996) one-sided p-values. | *MacKinnon (1996) | | Residual variance (no correction) | 0.011242 | | | HAC corrected variance (Bartlett kernel) | 0.012988 | | Source: RBI staff calculations. | | I.2.3 Corporate Sector 1.53 The Indian corporate sector gained strength and resilience in a steady and broad-based expansion through the pandemic. An analysis of key financial parameters of listed non-financial private companies20 indicates improvement in demand conditions. Sales of manufacturing companies increased by 34.0 per cent (y-o-y) in Q2:2021-22. Sales growth for information technology (IT) companies, which had been positive throughout the pandemic, accelerated to 19.5 per cent (Chart 1.30). 1.54 Rising turnover contributed to higher operating profits of manufacturing and IT companies, and their pricing power in terms of operating profit margin and net profit margin remained stable in Q2:2021-22 (Chart 1.31). A disaggregated analysis of operating margins of 1,639 listed private manufacturing companies based on their balance sheet debt shows smaller borrowers21 recorded lower operating margin after the second wave of COVID-19 (Chart 1.32).
1.55 Retained earnings and short-term borrowings accounted for 38 per cent and 43 per cent, respectively, of sources of funds of manufacturing companies during H1:2021-22. Funds mobilised by them were deployed in building up inventories (16.6 per cent) and reducing long term debt (13.6 per cent). Trade receivables and payables increased, and cash holding declined, pointing to pick-up in business activity. 1.56 Deleveraging22 by listed manufacturing companies during 2020-21 was suspended in H1:2021-22, and their cash holdings also moderated from the high levels witnessed during the pandemic (Charts 1.33 a and 1.33 b). Capital expenditure remained muted, as reflected in a decline in the share of fixed assets in total assets (Chart 1.33 c).
I.2.4 External Sector Developments and Foreign Exchange Derivatives Markets 1.57 In an uncertain and volatile global economic environment, India’s external sector has remained stable and viable during the pandemic. A narrowing trade deficit and an increase in net services receipts took the current account balance into a surplus of 0.9 per cent of GDP in Q1:2021-22, as against a deficit of 1.0 per cent in the previous quarter and a surplus of 3.7 per cent a year ago (Chart 1.34). In the financial account, foreign direct investment (FDI) and banking capital recorded large inflows during Q1:2021-22. These developments led to an accretion of foreign exchange reserves to the tune of USD 31.9 billion on a balance of payments (BoP) basis in Q1:2021-22. 1.58 Even as the trade deficit widened in subsequent months on the back of surging import demand, external financial requirements remain well supported. By December 17, 2021 the level of reserves stood at US$ 635.7 billion. 1.59 FDI inflows amounted to US$ 30.5 billion in H1:2021-22 up from US$ 29.2 billion in H1:2020-21. On the other hand, net foreign portfolio investment (FPI) turned sluggish as risk aversion intensified, with expectations of faster policy normalisation and more recently, with the emergence of Omicron. After recording net inflows US$ 7.6 billion during H1:2021-22, net outflows have occurred during Q3:2021-22 so far (Charts 1.35 a and 1.35 b). 1.60 In terms of cross-border banking flows, foreign domiciled banks increased their total outlays into the Indian economy by 3.2 per cent during December 2019 to June 2021 mainly through local currency deployment even as foreign currency denominated deployment declined by 6.8 per cent (Table 1.12).
| Table 1.12 : International Banking Flows to India | | (in USD billion) | | Item | Q2:2021 | Q4:2019 | | Total | International | Local positions in local currencies | Total | International | Local positions in local currencies | | Foreign banks | 278.6 | 136.0 | 142.7 | 269.9 | 145.9 | 124.0 | | France | 27.1 | 20.2 | 6.9 | 20.3 | 13.9 | 6.4 | | Japan | 39.3 | 30.5 | 8.8 | 45.1 | 36.6 | 8.5 | | United Kingdom | 72.6 | 20.5 | 52.1 | 64.7 | 21.0 | 43.7 | | United States | 74.1 | 23.8 | 50.3 | 65.5 | 24.3 | 41.2 | | Source: BIS. | 1.61 Amidst heightened global uncertainty, the USD-INR exchange rate moved sideways, largely immune to changes in global risk perceptions, capital flows to EMEs and monetary policy moves in advanced economies. Implied volatility, reflecting the market’s forward-looking view on exchange rate movements, as also realised volatility have been range-bound (Chart 1.36). The options skew, reflecting the market’s relative bias in valuations, also shows no perceptible directionality up to mid-November 2021. Subsequently, however, the INR has been trading lower till about mid-December, on account of foreign portfolio outflows, a stronger US dollar and uncertainty on the pace of tapering by the US Federal Reserve. Overall, the INR has depreciated by 1.73 per cent since end-June 2021 (up to December 10, 2021) against the US dollar (Chart 1.37). 1.62 Non-deliverable inter-bank USD-INR forward trading volumes broadly tracked onshore inter-bank trades in the recent period; non-deliverable forwards (NDF) client trade volumes remain erratic but low (Chart 1.38). Offshore outstanding forwards of less than 1-month tenor show an uptrend (Chart 1.39).
1.63 Hedging pressures have remained elevated as reflected in the MIFOR-OIS23 spread, which has remained wide in the one-year tenor vis-a-vis the domestic curve, indicating that higher premia are required to be paid to hedge foreign currency exposures (Chart 1.40). While the spread in the 3-year tenor has narrowed, the INR swaption with MIFOR as the floating leg (3-month X 3-year) is off its recent lows, implying participants’ uncertainty about the evolution of 3-year MIFOR rates (Chart 1.41). I.2.5 Domestic Equity Market 1.64 Lifted by the bull run in equity markets across the globe, the Indian equity market surged on strong rallies with intermittent corrections. Among institutional participants in the cash segment, domestic institutional investors (DIIs) were net buyers during April-November 2021, offsetting the pullout by foreign portfolio investors. Mutual funds were the principal drivers; insurance companies were net sellers during this period (Chart 1.42 a and 1.42 b).
1.65 Strong investor interest has driven up price-earnings (P/E) ratios substantially. As on December 13, 2021, the one-year forward P/E ratio for India was 35.1 per cent above its 10-year average, and one of the highest in the world (Chart 1.43). Other valuation metrices like the price-to-book value (P/B) ratio, the market capitalisation to GDP ratio, and the cyclically adjusted P/E ratio or Shiller P/E are also above their historical averages (Table 1.13). This reflects some disconnect between the real economy and equity markets. 1.66 With abnormally higher valuations pushing up volatility, NSE VIX began to rise since September 2021 after touching a low of 11.8 at the end of July 2021. The NSE VIX stood at 16.6 as on December 13, 2021, a tad higher than its pre-COVID level, though it is still lower than its 5-year average of 17.8. 1.67 One of the features of the current rally in the equity market has been the increased participation of retail investors, whose shareholding in companies listed on the National Stock Exchange (NSE) has increased from 6.4 per cent in December 2019 to 7.1 per cent in September 2021, in value terms (Chart 1.44). Significant increase in retail interest was also visible in the form of increased trading on exchanges, participation in IPOs and in other market segments like futures and derivatives. 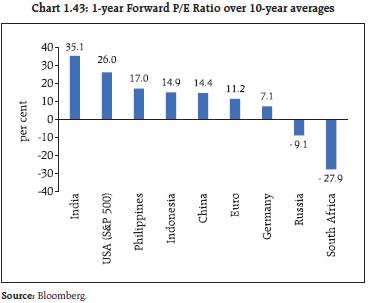
| Table 1.13 : Valuation Metrices | | | Long-Term Average | Current | | Price-to-Book Value (P/B) Ratio | 3.26 | 3.58 | | Market Capitalisation/ GDP ratio | 75.77 | 119.16 | | Shiller Price-Earnings (P/E) Ratio | 26.93 | 38.68 | Note: 1. Long-term average of P/B ratio is calculated as average of annual P/B ratio since 1998-99.
2. Long-term average of Market Capitalisation/GDP ratio is calculated as average of annual Market Capitalisation/GDP ratio since 2012-13. Current Market Capitalisation/GDP ratio pertains to September 30, 2021.
3. Long-term average of Shiller P/E is calculated as average of daily values since April 03, 2017.
Source: BSE and Bloomberg |
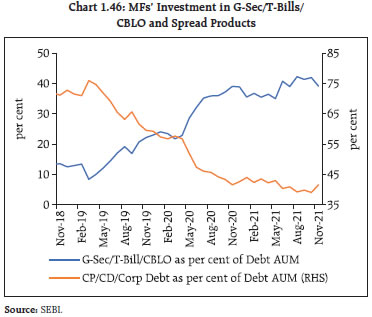
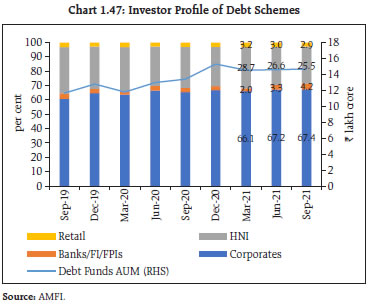
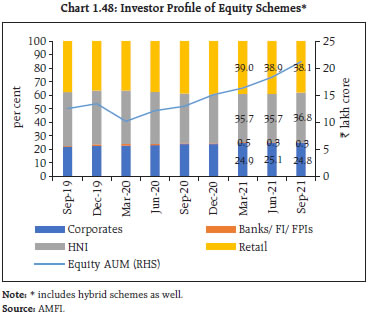
I.2.6 Mutual Funds 1.68 The assets under management (AUM) of open-ended mutual funds have grown steadily since the pandemic shock of March 2020. Given their size, they are of systemic importance (Chart 1.45). 1.69 The proportion of liquid assets held by debt mutual funds (MFs) is at its highest in the period since the failure of M/s Infrastructure Leasing & Financial Services Limited (IL&FS) in mid-2018 (Chart 1.46). While this acts as a bulwark against idiosyncratic fund specific shocks, any systemic shock affecting open ended MFs can have significant spillovers on to the secondary G-Sec segment. 1.70 The investor profile of debt-oriented schemes is dominated by incorporated entities and high net worth individuals (Chart 1.47). The participation of these investors, who are active managers of investment risk, in equity schemes has grown post the COVID-19 outbreak, due to diversion of excess cash as gross returns of liquid funds declined. On the other hand, the share of retail participation in equity schemes of MFs has been declining after December 2020. (Charts 1.48-1.49). 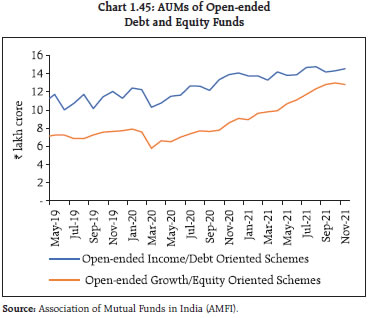
 1.71 While the aggregate corpus of debt funds has risen, corporate bond holdings of mutual funds have trended downwards and the portfolio composition in terms of the ratings mix has moved in favour of better rated corporates (Chart 1.50). Moreover, a comparison of the median valuation of an illustrative 3-year AAA bond in the MF books vis-a-vis Fixed Income Money Market and Derivatives Association of India (FIMMDA) valuation models reveals that mutual fund bond portfolios are being valued conservatively, in general (Chart 1.51). I.2.7 Banking Stability Indicator 1.72 The banking stability indicator (BSI)24, which indicates the changes in underlying conditions and risk factors of SCBs, showed improvement in soundness, asset quality, liquidity and profitability. The efficiency parameter worsened relative to the position in March 2021. Notably, the risk indicator for soundness was the least due to banks reporting high levels of the capital to risk weighted assets ratio (CRAR) as well as Tier I to Tier II ratios. (Chart 1.52).
I.2.8 Bank Credit 1.73 Bank credit conditions are gradually improving - growth (y-o-y) in credit by SCBs rose to 7.1 per cent as on December 3, 2021 as against 5.4 per cent growth a year ago and 5.2 per cent in March 2021. In recent years, growth in wholesale credit (₹5 crore and above) has been lagging (Chart 1.53). Retail credit25, on the other hand, has been generally recording double digit growth, although the pace of growth remains below its pre-COVID level. Housing loans and other personal loans constituted 64 per cent of incremental credit during the last two financial years (Table 1.14). 1.74 The retail led credit growth model is confronting headwinds: first, delinquencies in the consumer finance portfolio have risen, and second, the new-to-credit26 segment, a key driver of consumer credit growth in the pre-pandemic period, is showing a decline in originations27. Analysis of historical data shows that in EMEs, non-performing assets typically peak six to eight quarters after the onset of a severe recession (BIS 2021). 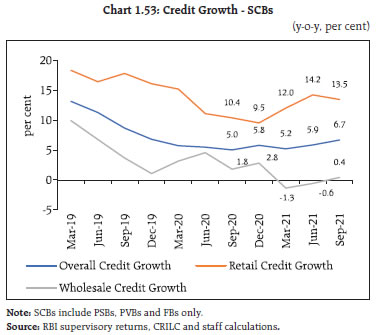
| Table 1.14 : Sectoral Share in Incremental Credit by SCBs | | (per cent) | | | 2019-20 | 2020-21 | | Economic Sector | | a) Agriculture | 1.8 | 21.7 | | b) Industry | 4.7 | -22.1 | | c) Transport operators | -0.4 | 1.1 | | d) Professional and other Services | 8.8 | -1.9 | | e) Personal Loans | 64.1 | 64.4 | | of which, Housing Loan | 30.0 | 31.2 | | f) Trade | 17.9 | 21.8 | | g) Finance | 13.0 | 9.7 | | h) Others | -10.0 | 5.6 | | Total credit | 100.0 | 100.0 | | Organisational Sector | | i) Public Sector | 22.7 | 11.1 | | ii) Private Corporate Sector | -11.7 | -18.2 | | iii) Households Sector - Individuals | 84.5 | 83.1 | | iv) Household Sector – Others than individuals * | 1.0 | 23.4 | | v) Others ** | 3.5 | 0.6 | | Total credit | 100.0 | 100.0 | * including proprietary concerns, partnership firms, Hindu undivided families (HUFs)
** including MFIs, Non-profit institution serving household (NPISHs) and NRIs and cooperative sector
Source: Basic Statistical Returns, RBI. |
| Table 1.15 : Growth in Wholesale Credit to PSUs | | (y-o-y, per cent) | | | Dec-19 | Mar-20 | Jun-20 | Sep-20 | Dec-20 | Mar-21 | Jun-21 | Sep-21 | | | PSU | | PSB | 12.9 | 19.4 | 21.8 | 15.9 | 17.5 | 3.6 | 5.9 | 11.6 | | PVB | 21.7 | 44.3 | 86.7 | 96.0 | 89.1 | 56.6 | 32.9 | 16.7 | | PSBs + PVBs | 13.8 | 21.8 | 27.8 | 23.8 | 25.3 | 9.7 | 9.6 | 12.4 | | | Non-PSU | | PSB | -9.9 | -4.3 | -4.1 | -5.4 | -4.0 | -8.2 | -10.1 | -9.1 | | PVB | 9.4 | -0.9 | -1.2 | -6.1 | -7.4 | -6.0 | -3.4 | -0.8 | | PSBs + PVBs | -3.2 | -3.0 | -3.0 | -5.7 | -5.3 | -7.4 | -7.5 | -5.8 | | Source: CRILC and RBI staff calculations. | I.2.9 Wholesale Bank Credit 1.75 An analysis of the funded amount outstanding (₹5 crore and above)28 shows that credit absorption by public sector units (PSUs) remains robust while non-PSU credit languishes in both public sector banks (PSBs) and private sector banks (PVBs) (Table 1.15). 1.76 The pace of fund mobilisation by the corporate sector (including non-banking financial borrowers) through market instruments has slowed down considerably in H1:2021-22 vis-à-vis a year ago (Table 1.16). Relatively high demand for borrowings through non-convertible debentures (NCDs) reflects efforts to lock in low-cost funding by highly rated corporates in anticipation of normalisation of liquidity conditions. 1.77 Credit extended by PVBs to non-PSU non-financial companies across investment grade ratings is showing signs of recovery, but it is yet to recover in respect of lending by PSBs to other than top rated corporates (Table 1.17). 1.78 In terms of size of banks’ exposure to corporates, a decline is seen in the category of ₹1,000 crore and above while relatively smaller borrowers (with loan size between ₹5 - ₹1000 crore) maintained a sustained appetite for credit (Chart 1.54). | Table 1.16 : Aggregate Mobilisation of Funds | | (₹ ‘000 crore) | | Quarter-end Outstanding Amount under | Mar-20 | Sep-20 | Mar-21 | Sep-21 | | Commercial Paper (CP) | 346 | 362 | 365 | 371 | | Non-Convertible Debentures (NCDs)29 | 2,712 | 2,825 | 3,014 | 3,085 | | Wholesale Credit30 | 5,582 | 5,410 | 5,507 | 5,497 | | Total | 8,640 | 8,597 | 8,886 | 8,953 | | Source: NSDL, Prime Database and CRILC. |
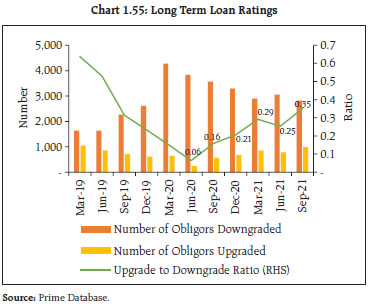
| Table 1.17 : Growth in Wholesale Credit to Non-PSU Non-financial Companies | | (y-o-y, per cent) | | | PVBs | PSBs | | Mar-20 | Sep-20 | Mar-21 | Sep-21 | Mar-20 | Sep-20 | Mar-21 | Sep-21 | | AA and above | 13.64 | -2.01 | -12.07 | 3.70 | 7.22 | -6.04 | -5.74 | 7.17 | | Other Investment Grade | -6.72 | -6.69 | -2.68 | 2.74 | -2.73 | 4.46 | 3.11 | -2.92 | | Below Investment Grade | 5.93 | 0.47 | -7.91 | -11.01 | -13.67 | -9.59 | -9.11 | -17.41 | | Unrated/NA | -7.91 | -9.94 | -6.38 | -3.14 | -12.08 | -12.08 | -13.74 | -12.72 | | Total | -1.28 | -5.68 | -6.81 | -1.33 | -7.88 | -6.60 | -6.96 | -8.78 | | Source: Prime Database, CRILC and RBI staff calculations | 1.79 An examination of the transition in asset quality of a constant sample31 of wholesale performing exposures (non-PSU non-financial companies) between the pre-COVID period (December 2019) and September 2021 shows adverse migration across all special mention account (SMA) categories. A more recent transition between June and September 2021 shows that the adverse transition has considerably slowed down (Tables 1.18-1.19). Overall the pace of ratings upgradation has, however, reduced in H1:2021-22(Chart 1.55). 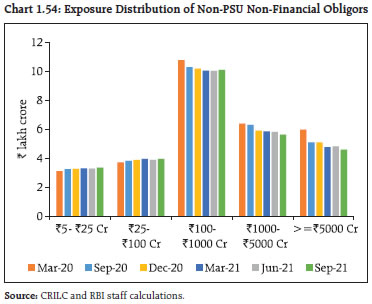
| Table 1.18 : SMA Transition Matrix of Wholesale Portfolios - Non-PSU Non-Financial Obligors , December-19 to September-21 | | Category | Outstanding in December 2019 (₹ crore) | September 2021 | | Growth in exposure over December 2019 (per cent) | Percentage of assets in various cohorts | | 0 dpd | SMA-0 | SMA-1 | SMA-2 | NPA | | 0 dpd | 18,89,192 | 0.35 | 92.9 | 2.9 | 0.8 | 0.6 | 2.8 | | SMA-0 | 1,63,602 | -7.51 | 71.9 | 13.2 | 3.8 | 3.7 | 7.5 | | SMA-1 | 60,775 | -3.58 | 50.1 | 13.7 | 9.6 | 3.8 | 22.7 | | SMA-2 | 55,110 | -13.37 | 32.0 | 4.9 | 6.8 | 21.8 | 34.5 | | Grand Total | 21,68,679 | -0.71 | 88.9 | 3.9 | 1.4 | 1.4 | 4.4 | | Note: dpd – days past due. Source: CRILC and RBI staff calculations. |
| Table 1.19 : SMA Transition Matrix of Wholesale Portfolios - Non-PSU Non-Financial Obligors, June-21 to September-21 | | Category | Outstanding in June 2021 (₹ crore) | September 2021 | | Growth in exposure over June 2021 (per cent) | Percentage of assets in various stages | | 0 dpd | SMA-0 | SMA-1 | SMA-2 | NPA | | 0 dpd | 20,15,944 | -0.03 | 96.7 | 2.1 | 0.4 | 0.2 | 0.6 | | SMA-0 | 1,49,982 | -1.47 | 69.7 | 22.2 | 6.1 | 1.4 | 0.6 | | SMA-1 | 50,356 | -2.61 | 43.1 | 20.2 | 17.5 | 10.4 | 8.8 | | SMA-2 | 52,454 | -3.03 | 39.0 | 4.3 | 10.4 | 35.6 | 10.7 | | Grand Total | 22,68,736 | -0.25 | 92.5 | 3.9 | 1.3 | 1.3 | 1.0 | | Source: CRILC and RBI staff calculations | I.2.10 Credit flows to MSME Sector 1.80 Credit to the MSME segment slowed down (y-o-y) by the end of September 2021 vis-a-vis March 2021. The decline was particularly noticeable in the sub ₹25 crore ticket size across major bank groups (Table 1.20). 1.81 Under the Emergency Credit Line Guarantee Scheme (ECLGS)32, loans amounting to ₹2.82 lakh crore were sanctioned till November 12, 2021, of which ₹2.28 lakh crore was disbursed (₹1.94 lakh crore by SCBs, forming 20.6 per cent of the incremental credit during the period). The draw down under ECLGS 1.0 and 2.0 comprised over 96 per cent of the total guarantees issued (Chart 1.56). 1.82 An analysis of detailed disbursal data reveals that guarantees of value up to ₹1 crore formed 51 per cent of the aggregate guarantees. Sixty-six per cent of the guarantees have been issued to micro, small and medium enterprises (Table 1.21). | Table 1.20 : Bank Credit to MSME Sector | | (y-o-y, per cent) | | | PSB | PVB | PSB+PVB | | Mar-21 | Sep-21 | Mar-21 | Sep-21 | Mar-21 | Sep-21 | | Exposure < 25 crore | 8.08 | 0.20 | 8.04 | 0.38 | 8.06 | 0.28 | | Aggregate MSME Exposure | 0.89 | 1.01 | 9.23 | 2.98 | 4.50 | 1.90 | | Source: RBI supervisory returns and staff calculations. |
| Table 1.21: ECLGS Guarantee Disbursement | | | Number of beneficiaries | Guarantee Amount
(₹ crore) | % Guarantee Amount | | Slab wise | | Below 1 crore | 1,15,57,518 | 133,955 | 50.9 | | 1 - 5 crore | 32,222 | 66,598 | 25.3 | | 5 - 50 crore | 4,915 | 55,781 | 21.2 | | 50 - 500 crore | 86 | 6,299 | 2.4 | | Type of Beneficiaries | | Micro | 1,02,96,333 | 65,771 | 25.0 | | Small | 4,98,509 | 66,3450 | 25.2 | | Medium | 2,60,757 | 42,041 | 16.0 | | Other Business Enterprises | 5,37,069 | 88,829 | 33.8 | Note: Data as on November 12, 2021.
Source: NCGTC. |
1.83 PVBs showed greater proclivity than PSBs for utilising the ECLGS scheme, covering a larger number of beneficiaries (Charts 1.57 a and 1.57 b). 1.84 Borrowers eligible for restructuring under the Reserve Bank’s guidelines of May 05, 2021 and who had availed loans under ECLGS 1.0 of overall tenure of four years, are permitted to avail ECLGS loans of a tenure of five years (i.e., repayment of interest only for the first 24 months with repayment of principal and interest in 36 months thereafter). As on November 12, 2021 a relatively small amount (₹752 crore) was restructured under this category. However, overall restructuring of MSME loans allowed under the Reserve Bank’s May 2021 scheme showed significant offtake (Table 1.22). Moreover, MSME portfolio of PSBs and PVBs indicates accumulation in NPA and SMA-2 categories in September 2021 relative to March 2021 (Table 1.23). Also, the transition of low and medium risk MSME borrowers to the high-risk category remains noteworthy (Table 1.24). | Table 1.22: Bank Group-wise Restructuring of MSME Portfolio | | (₹ crore) | | | Aggregate restructured portfolio | | PSB | PVB | | Restructuring - January 2019 scheme | 26,190 | 2,174 | | Restructuring - February 2020 scheme | 5,860 | 1,364 | | Restructuring - August 2020 scheme | 24,816 | 11,027 | | Restructuring - May 2021 scheme | 23,861 | 18,887 | | Source: RBI supervisory returns and staff calculations |
| Table 1.23: Bank Group-wise SMA distribution of MSME Portfolio | | (per cent) | | | PSBs | PVBs | | 0 days past due | SMA-0 | SMA-1 | SMA-2 | NPA | 0 days past due | SMA-0 | SMA-1 | SMA-2 | NPA | | Mar-21 | 61.2 | 10.2 | 8.4 | 3.4 | 16.8 | 89.4 | 3.8 | 2.4 | 0.8 | 3.6 | | Jun-21 | 60.9 | 10.9 | 4.6 | 4.8 | 18.8 | 86.0 | 5.9 | 2.8 | 1.7 | 3.6 | | Sep-21 | 66.6 | 7.6 | 3.4 | 3.9 | 18.5 | 87.9 | 5.5 | 1.7 | 2.1 | 2.8 | | Source: RBI supervisory returns and staff calculations. | I.2.11 Banks’ Deposit Profile 1.85 The run-off profile of deposits since September 2019 shows that the growth in stable deposits (i.e., deposits with low run-off profile) has lagged that of volatile deposits (Chart 1.58). Private sector banks with CRARs above 18 per cent exhibited higher growth in volatile deposits (Chart 1.59). Deposits by corporates grew at a faster clip than retail deposits, symptomatic of lack of investment appetite among corporates. Operational deposits (viz., generated by clearing, custody and cash management activities, which is a deposit class with favorable run-off rates) contracted across PSBs and new PVBs, and trailed far below the baseline numbers of September 2019, as system liquidity remained in large surplus throughout the period. A development associated with the growth in volatile deposits is a significant accumulation of G-Secs and other high quality liquid assets (HQLAs) across the banking spectrum (Chart 1.60). Table 1.24 : Borrower Transition Matrix
(September 2020 - September 2021) | | (per cent) | | CMR33 as of Sep-20 | CMR as of Sep-21 | | CMR 1-3 | CMR 4-6 | CMR 7-10 | | CMR 1-3 | 67 | 23 | 10 | | CMR 4-6 | 11 | 57 | 32 | | CMR 7-10 | 1 | 10 | 89 | Note: Low Risk (CMR 1-3), Medium Risk (4-6), High Risk (CMR 7-10)
Source: TransUnion CIBIL |
I.2.12 Resolution Analysis 1.86 The Insolvency and Bankruptcy Code (IBC), 2016 represents a significant reform in the process of insolvency resolution in India. An analysis of 60 corporate debtors resolved under the Insolvency and Bankruptcy Code, 2016 between September 2019 and September 2021 shows that (a) the sample median recovery rate was 24.7 per cent and (b) the longer bad loans remain on banks’ balance sheets, the lower is the amount banks succeed in recovering, independent of the type of exposure or borrower (Table 1.25). This implies that reduction in the median gap between NPA identification and Corporate Insolvency Resolution Process (CIRP) commencement may have a pronounced effect on ultimate recovery. 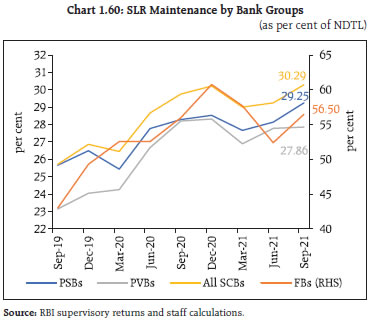 1.87 An analysis of average delays in terms of initiation of insolvency under the IBC34 since impairment shows significant delays in respect of asset classes held by asset reconstruction companies (ARCs) vis-a-vis other classes of creditors, in terms of initiation of insolvency proceedings (Chart 1.61). 1.88 Examination of the one-year transition of substandard and various doubtful categories of large loans shows no meaningful recovery once banking assets are impaired. Hence, to the extent that the provisions of Income Recognition and Asset Classification (IRAC) norms do not incentivise referral for resolution, prospective recovery of assets is impaired since recoveries decline sharply with vintage. This has implications for both PSBs and PVBs which carry impairments of considerable vintage as well as for bad assets transfered to the National Asset Reconstruction Company Limited (NARCL) (Tables 1.26 and 1.27). | Table 1.25 : Recovery Rates and Delay in Various Stages in a Select Sample of Cases Resolved between September 2019 and September 2021 | | Recovery rate (per cent) | Number in the sample | Median gap between NPA identification and commencement of CIRP (years) | Median Gap between commencement of CIRP and approval of resolution plan (years) | | <10 | 13 | 5.3 | 1.6 | | Between 10 and 25 | 17 | 3.3 | 1.7 | | Between 25 and 50 | 22 | 2.9 | 1.6 | | Greater than 50 | 8 | 0.9 | 1.6 | | Overall | 60 | 3.3 | 1.7 | | Source: IBBI, CRILC and RBI staff calculations. |

| Table 1.26 : One-year Transition Rate in Wholesale Substandard and Doubtful Assets | | (per cent) | | | Wholesale Substandard Assets | Wholesale Doubtful Assets | | Mar-18 | Mar-19 | Mar-20 | Mar-18 | Mar-19 | Mar-20 | | Standard | 2.30 | 2.53 | 1.63 | 2.86 | 3.34 | 0.42 | | Non-CDR Standard Restructured | 0.13 | 0.55 | 0.07 | 0.06 | 0.42 | 0.14 | | Substandard | 0.99 | 1.20 | 1.03 | 0.01 | 0.00 | 0.61 | | Substandard Restructured | 0.04 | 0.01 | 0.00 | 0.06 | 0.03 | 0.00 | | Doubtful | 88.71 | 78.86 | 76.45 | 86.54 | 73.40 | 81.41 | | Doubtful Restructured | 1.32 | 0.25 | 1.27 | 2.39 | 2.90 | 1.54 | | Loss | 6.52 | 16.59 | 19.55 | 8.07 | 19.92 | 15.89 | | Source: CRILC and staff calculations. |
| Table 1.27 : NPA Composition* of PSBs and PVBs Combined | | (per cent share in total NPAs) | | | Mar-20 | Jun-20 | Sep-20 | Dec-20 | Mar-21 | Jun-21 | Sep-21 | | Substandard | 12.7 | 11.8 | 8.4 | 4.6 | 12.8 | 10.6 | 11.0 | | Substandard Restructured | 0.6 | 0.4 | 0.3 | 0.1 | 0.3 | 0.7 | 1.2 | | Doubtful (up to 1 year) | 12.7 | 13.7 | 14.4 | 15.4 | 14.2 | 12.3 | 9.0 | | Doubtful (1-3 years) | 25.1 | 22.9 | 20.0 | 21.0 | 21.2 | 21.5 | 20.5 | | Doubtful (over 3 years) | 14.3 | 14.5 | 17.3 | 16.0 | 16.7 | 18.2 | 19.1 | | Doubtful Restructured | 10.2 | 9.6 | 10.5 | 9.9 | 8.9 | 9.5 | 9.4 | | Loss | 24.3 | 27.2 | 29.2 | 33.0 | 25.9 | 27.2 | 29.7 | Note*: For Private Non-Financial Wholesale Obligors.
Source: CRILC and staff calculations. | 1.89 The results of these analyses throw up the following issues: (a) the need for additional provisioning at early stages of impairment to internalise the costs imposed by delay in resolution of assets; (b) need for incentivising all channels of resolution so as to avoid delays and hence prevent erosion in value of assets; (c) need for reviewing provisioning norms in the light of actual recovery related data, including the impact of collateralisation on final recovery; and (d) while a pre-packaged resolution process under Chapter III A of the IBC is an important watershed for speeding up resolution of small assets, the risk of deferral of unviable units at the cost of imperilling ultimate recovery needs to be guarded against. I.2.13 Microfinance Segment 1.90 Aggregate credit growth in the microfinance sector is showing some signs of stabilisation - although outstanding credit to the sector in September 2021 fell below March 2020 levels. The spurt in lending to existing borrowers seen at the onset of COVID-19 did not sustain and credit growth to this segment has started tracking aggregate portfolio growth (Chart 1.62). 1.91 Impairments measured in terms of 30+ dpd (days past due) and 90+ dpd rose following the first wave of the pandemic and escalated further during the second wave (Chart 1.63). While the recent 30+ dpd based impairment of the portfolio appears to have peaked, the 90+ dpd based impairment shows signs of moderation. I.2.14 Non-Banking Financial Companies (NBFCs) 1.92 The NBFC space reveals divergent performances. While investment and credit companies (ICC), the largest segment of NBFCs, showed subdued asset growth, infrastructure finance companies (IFCs) – a segment dominated by PSU NBFCs –decelerated in H1:2021-22. NBFC-MFIs, a category particularly affected by the pandemic, exhibited uneven recovery (Table 1.28). 1.93 Banking sector exposure to private NBFC/HFCs showed contrasting movements during 2021-22 (Chart 1.64 a). Bank lending to private NBFCs recovered in Q2:2021-22 after a steep decline in the preceding quarter. In case of private HFCs, however, banks’ exposure continued to fall sharply after a surge in H2:2020-21. Bank lending to PSU NBFCs and HFCs also reflected more active usage of credit limits by NBFCs (Chart 1.64 b). 
| Table 1.28 : Asset growth of select NBFCs35- A Segmental View | | (Figures in ₹ ‘000 crore unless otherwise stated) | | NBFC category | Asset size | | Mar-20 | Sep-20 | Mar-21 | Growth in Mar-21 (y-o-y, per cent) | Jun-21 | Sep-21 | Growth in Sep-21 over Mar-21 (per cent) | | NBFC -Investment and Credit Company (331) | 1,240.2 | 1,255.3 | 1,308.2 | 5.5 | 1,296.2 | 1,319.7 | 0.9 | | NBFC -Infrastructure Finance Company (8) | 988.3 | 1,058.7 | 1,169.2 | 18.3 | 1,176.8 | 1,204.9 | 3.1 | | NBFC – Micro Finance Company (20) | 36.0 | 35.0 | 40.6 | 13.0 | 38.5 | 42.6 | 4.8 | | NBFC-Infrastructure Debt Fund (4) | 27.4 | 29.1 | 30.4 | 11.0 | 30.6 | 31.5 | 3.5 | | NBFC -Factor (4) | 3.1 | 2.7 | 3.0 | -4.4 | 2.6 | 2.8 | -6.7 | | Grand Total (367) | 2,295.0 | 2,380.8 | 2,551.5 | 11.2 | 2,544.7 | 2,601.4 | 2.0 | Note: Figures in parentheses denote number of companies in each category.
Source: RBI supervisory returns and staff calculations. |
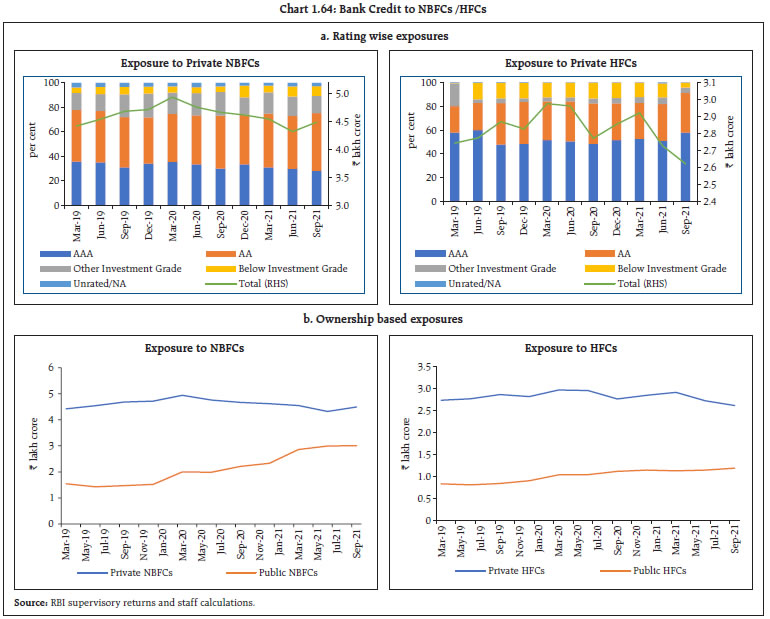 1.94 Private NBFCs’ activities in the money markets were characterised by a significant shortening of maturities and sizeable gross issuances, particularly during June-August 2021 (Chart 1.65). A significant portion of the issuance was by six NBFCs in particular (Table 1.29). A few of these NBFCs also accounted for short term issuances during the period (Table 1.30).
| Table 1.29: Gross CP issuances by select NBFCs | | (₹ crore) | | | Jan-21 | Feb-21 | Mar-21 | Apr-21 | May-21 | Jun-21 | Jul-21 | Aug-21 | Sep-21 | Oct-21 | | NBFC-1 | 8,200 | 950 | 12,500 | 300 | 650 | 4,930 | 18,890 | 8,150 | 1,130 | 350 | | NBFC-2 | 16,390 | 7,605 | 20,410 | | | 7,525 | 54,435 | 33,515 | | | | NBFC-3 | 8,340 | 3,648 | 16,361 | 100 | 105 | 5,030 | 19,545 | 9,668 | 500 | 185 | | NBFC-4 | 600 | 1,000 | 2,500 | | | 1,025 | 2,965 | 1,835 | 600 | | | NBFC-5 | 3,100 | 2,925 | 1,600 | 1,000 | 5,800 | 5,510 | 5,620 | 6,410 | 3,215 | 4,170 | | NBFC-6 | 1,825 | 1,200 | 10,200 | 550 | 78 | 5,925 | 14,700 | 3,960 | | 1,700 | | Source: RBI supervisory returns and staff calculations. |
| Table 1.30 : Weighted average maturity of issuances of select NBFCs | | (in days) | | | Jan-21 | Feb-21 | Mar-21 | Apr-21 | May-21 | Jun-21 | Jul-21 | Aug-21 | Sep-21 | Oct-21 | | NBFC-1 | 16 | 122 | 11 | 90 | 87 | 18 | 11 | 12 | 85 | 245 | | NBFC-2 | 13 | 122 | 7 | | | 7 | 10 | 15 | | | | NBFC-3 | 7 | 10 | 9 | 100 | 365 | 24 | 9 | 12 | 89 | 91 | | NBFC-4 | 7 | 7 | 9 | | | 7 | 7 | 8 | 7 | | | NBFC-5 | 35 | 43 | 23 | 7 | 44 | 52 | 41 | 71 | 95 | 42 | | NBFC-6 | 54 | 67 | 10 | 201 | 364 | 27 | 21 | 89 | | 127 | | Source: RBI supervisory returns and staff calculations. | 1.95 The issuance of short term CPs make NBFCs vulnerable to any disruption in the CP market as the IL&FS related incidents demonstrated in 2019. With a view to estimating the systemic impact of the CP issuances, two approaches can be adopted. Firstly, the aggregate market activity for NBFCs in the instrument can be compared with the gross issuance outstanding in the relevant period. Second, gross outstanding CPs during the period can be compared with the aggregate on-balance sheet liability of the entity, a higher share implying more dependence on this volatile segment of funding. In July 2021, aggregate issuance by NBFCs 1, 2 and 3 comprised 52 per cent of the aggregate issuance, signifying high dependence of these NBFCs on CP markets. Moreover, considerable synchronisation in accumulation of exposures was seen during June-August 2021, making the sector as a whole significantly dependent on the normal functioning of this segment. For NBFCs 1, 2 and 3, intra-month CP exposures in July 2021 constituted a significant proportion of on-balance sheet liabilities (Table 1.31). 1.96 For the three NBFCs for which the structural liquidity of the near month bucket is available, gross maximum CP related outflows36 in a week during the month of July 2021 was significantly large relative to the projected 1-month outflows (Table 1.32). Any smoothening of such exposures for reporting of structural liquidity positions in various buckets to supervisors at the end of the month may understate the risk that the balance sheet is exposed to. | Table 1.31 : Share of CP Outstanding in Aggregate Liability of Select NBFCs | | | Maximum Intra month CP outstanding (July-21), ₹ crore | Outstanding CP as a proportion of total on balance sheet liability (June-21), per cent | | NBFC-1 | 9,810 | 25.9 | | NBFC-2 | 24,980 | 30.8 | | NBFC-3 | 9,763 | 24.3 | | Source: RBI supervisory returns and staff calculations. |
| Table 1.32: Intra-month CP Related Outflows | | | Actual intra month 0 - 7 days outflow as % of projected 1-month outflow in Structural Liquidity Statement on June-2021 | | NBFC-1 | 178.6 | | NBFC-2 | 197.7 | | NBFC-3 | 167.5 | | Source: RBI supervisory returns and staff calculations. |
I.2.15 Consumer Credit 1.97 The overall demand in consumer credit, as reflected in inquiry volumes37, has recovered following the dip on account of the second wave. The upturn is led by demand for personal loan and credit card segments while demand from other product categories show signs of stabilization. Lending activity across all lender categories, barring PSBs, shows signs of accelerated credit growth after the second wave. Growth in credit active consumers38 has, however, moderated consistently since September 2020 (Charts 1.66-1.68). 1.98 Inquiry volumes by risk39 tier show leapfrogging of credit demand from sub-prime consumers, particularly after the second wave (Chart 1.69). The distribution by risk across lender categories shows particular improvement in customer mix in the NBFC segment (Table 1.33). While PSBs show a disproportionate size of below prime borrowers in the consumer credit mix, their recent originations in the segment have shown a bias away from the segment (Table 1.34). 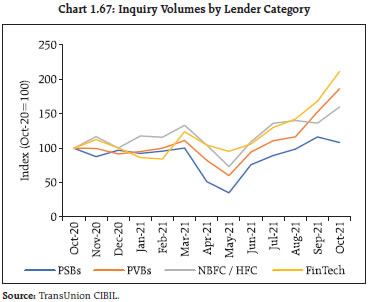
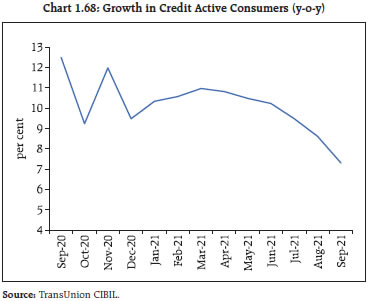 1.99 Impairment in consumer credit, measured in terms of the proportion of the portfolio at 90 days past due or beyond, shows signs of stabilisation after the pandemic, but at a fairly higher level for PSBs, relative to other lender categories (Table 1.35). Delinquency levels in terms of product types point to a general deterioration across product category levels in September 2021 relative to September 2020, with the credit card segment being the only exception. General lending standards in the industry have been tightened across lender category levels, leading to a drop in approval rates (Chart 1.70) as also moderation in the growth of balances (Chart 1.71). 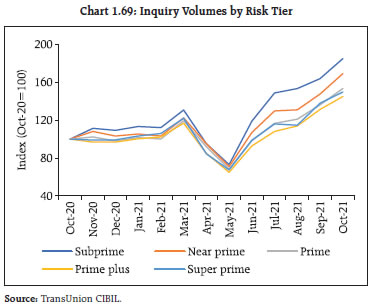
| Table 1.33: Consumer Distribution by Risk Tier and Lender Category | | (as a per cent of credit active consumers) | | Score Band | Select NBFCs40 (24) | All NBFCs | All PSBs | All PVBs | Industry | | Sep-20 | Sep-21 | Sep-20 | Sep-21 | Sep-20 | Sep-21 | Sep-20 | Sep-21 | Sep-20 | Sep-21 | | Subprime | 28.2 | 29.7 | 31.0 | 33.8 | 29.7 | 32.7 | 16.3 | 19.3 | 27.2 | 29.9 | | Near prime | 28.5 | 21.3 | 28.7 | 21.8 | 27.6 | 25.1 | 19.5 | 16.5 | 25.5 | 21.6 | | Prime | 28.4 | 33.1 | 28.2 | 31.4 | 27.7 | 25.6 | 33.2 | 32.5 | 28.8 | 28.4 | | Prime plus | 13.6 | 14.3 | 11.0 | 11.8 | 11.1 | 12.1 | 21.4 | 21.3 | 13.6 | 14.6 | | Super prime | 1.4 | 1.6 | 1.1 | 1.3 | 3.9 | 4.6 | 9.7 | 10.4 | 5.0 | 5.6 | | Total | 100.0 | 100.0 | 100.0 | 100.0 | 100.0 | 100.0 | 100.0 | 100.0 | 100.0 | 100.0 | | Below Prime | 56.6 | 51.1 | 59.7 | 55.6 | 57.3 | 57.8 | 35.8 | 35.9 | 52.7 | 51.4 | | Source: TransUnion CIBIL. |
Table 1.34 : PSB Origination by Risk Tier
(as a % of origination volumes) | | Risk Tier | Q3 2020 | Q3 2021 | | Subprime | 11.2 | 9.4 | | Near prime | 20.6 | 19.0 | | Prime | 36.4 | 40.9 | | Prime plus | 12.9 | 15.5 | | Super prime | 4.3 | 6.7 | | New To Credit | 14.6 | 8.5 | | Total | 100.0 | 100.0 | | Source: TransUnion CIBIL. |
| Table 1.35: Delinquency Levels in Aggregate Consumer Credit across all Product Categories | | (per cent) | | | PSB | PVB | NBFC / HFC | FinTech | | Sep-20 | 5.48 | 1.56 | 2.53 | 1.82 | | Oct-20 | 5.38 | 1.55 | 2.45 | 1.94 | | Nov-20 | 5.10 | 1.93 | 2.90 | 2.87 | | Dec-20 | 4.94 | 2.49 | 3.39 | 5.88 | | Jan-21 | 4.87 | 2.66 | 3.76 | 6.60 | | Feb-21 | 4.54 | 2.61 | 3.43 | 6.22 | | Mar-21 | 4.89 | 2.01 | 3.04 | 3.14 | | Apr-21 | 4.92 | 2.03 | 3.95 | 3.56 | | May-21 | 5.69 | 2.48 | 5.09 | 4.69 | | Jun-21 | 5.88 | 2.67 | 4.59 | 3.70 | | Jul-21 | 5.60 | 2.80 | 4.58 | 4.74 | | Aug-21 | 5.54 | 2.66 | 4.21 | 4.93 | | Sep-21 | 5.03 | 2.23 | 3.77 | 4.56 | Note: (1) based on 90 days past due balances.
(2) TransUnion CIBIL’s FinTech category comprises of NBFCs registered with RBI and active in digital lending category as also peer to peer lending platforms.
Source: TransUnion CIBIL | 1.100 Such migrations across major product categories across three periods - September 2019/20; June 2020/21; and September 2020/21 – reveal that adverse migration into riskier categories remains significant relative to September 2019/20. In respect of better rated categories, such migrations have, however, stabilised or are better relative to the pre-pandemic period, underscoring the asymmetric nature of the impact across risk categories (Table 1.36). 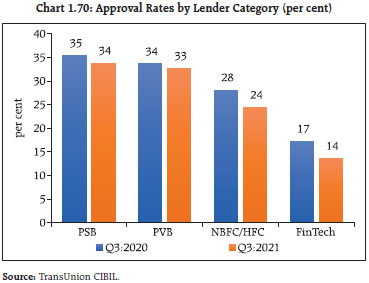
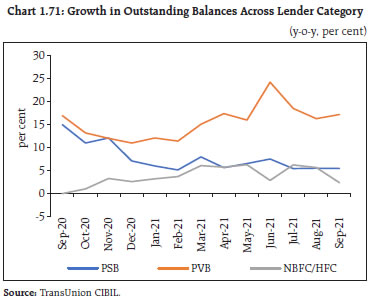
| Table 1.36 : Score Migration41 for Risk Categories (per cent) | | | Subprime | Near prime | Prime | Prime plus | Super prime | Score tier downgrade | Score tier upgrade | | Live Borrowers - Score Movement (Sep 2019 to Sep 2020) | | | Risk tier - Sep 2020 | | | | Risk tier - Sep 2019 | Subprime | 61.1 | 25.9 | 10.9 | 1.7 | 0.4 | 0.0 | 38.9 | | Near prime | 19.3 | 33.9 | 36.2 | 8.9 | 1.7 | 19.3 | 46.8 | | Prime | 8.0 | 17.5 | 47.9 | 22.5 | 4.0 | 25.6 | 26.5 | | Prime plus | 3.8 | 9.9 | 29.5 | 46.4 | 10.4 | 43.2 | 10.4 | | Super prime | 2.3 | 7.3 | 17.7 | 21.2 | 51.5 | 48.5 | 0.0 | | Live Borrowers - Score Movement (Jun 2020 to Jun 2021) | | | Risk tier - June 2021 | | Risk tier - June 2020 | Subprime | 71.3 | 17.2 | 8.9 | 2.0 | 0.6 | 0.0 | 28.7 | | Near prime | 28.3 | 29.1 | 31.0 | 9.5 | 2.1 | 28.3 | 42.6 | | Prime | 12.1 | 17.0 | 43.0 | 23.8 | 4.2 | 29.1 | 28.0 | | Prime plus | 6.4 | 10.7 | 25.5 | 46.4 | 11.0 | 42.6 | 11.0 | | Super prime | 3.1 | 7.6 | 16.6 | 21.4 | 51.4 | 48.6 | 0.0 | | Live Borrowers - Score Movement (Sep 2020 to Sep 2021) | | | Risk tier - Sep 2021 | | Risk tier - Sep 2020 | Subprime | 68.0 | 18.7 | 10.3 | 2.4 | 0.7 | 0.0 | 32.0 | | Near prime | 25.0 | 30.0 | 32.7 | 10.0 | 2.3 | 25.0 | 45.0 | | Prime | 9.7 | 16.1 | 44.1 | 25.6 | 4.6 | 25.8 | 30.1 | | Prime plus | 4.3 | 9.3 | 24.8 | 49.6 | 11.9 | 38.4 | 11.9 | | Super prime | 2.5 | 6.6 | 16.8 | 21.4 | 52.6 | 47.4 | 0.0 | | Source: TransUnion CIBIL. | I.2.16 Housing Market 1.101 The housing market is regaining momentum. House sales witnessed green shoots of recovery during Q2:2021-22, following a prolonged period of negative growth. Support measures adopted by government to boost the housing sector, a low interest rate environment and improved consumer confidence in the sector pushed up demand, along with a steep increase in new house launches during the last four quarters (Chart 1.72). New launches, especially in the affordable low-ticket segments, rose sharply and higher priced segments grew in terms of sales. Unsold inventory rose with new launches, but robust sales helped to bring down the inventory overhang during Q2:2021-22 (Chart 1.73). I.2.17 Systemic Risk Survey42 1.102 In the November 2021 round of the Systemic Risk Survey (SRS), respondents perceived all broad categories of risks to the financial system - global, macroeconomic, financial market, institutional and general - as ‘medium’ in magnitude but rated global risks and financial market risks as comparatively higher than the rest. Among the components of the five broad risk categories, respondents viewed commodity prices, domestic inflation, equity price volatility, cyber risk, credit growth and asset quality as the major risk factors. Risk perceptions on global growth, current account deficit, interest rates, liquidity, terrorism and climate change increased, although they remained in the medium risk category. 1.103 Over half of the respondents envisage improvement in the prospects of the Indian banking sector in the next one year, with over 80 per cent expecting pick up in credit demand in the next three months. Forty-three per cent of the respondents also expected asset quality of the banking system to improve marginally in the next three months.
1.104 Majority of the respondents felt that the Indian economy will recover completely from the fallout of the COVID-19 pandemic in a span of 1-2 years; sectors such as tourism and hospitality, aviation, automobiles, MSMEs, real estate, retail trade and entertainment could, however, exhibit slower recovery over the next one year. Summary and Outlook 1.105 Globally, sovereign debt has ballooned as governments extended wide ranging fiscal support to tide their countries through the pandemic. This is likely to have a long-term impact on fiscal sustainability and crimp the policy space available for extended support should the Omicron variant prove to have a destabilizing effect on the economy. 1.106 The global macrofinancial outlook appears rather uncertain as systemically important economies start tightening their monetary policy stances faster than previously announced. The spillovers of such measures across asset classes and cross-border flows are likely to lead to volatility in EMEs. Policymakers in the latter will confront the challenge of calibrating their domestic policy responses to smoothen the impact of such spillovers as their economies simultaneously cope with the fallout of newer COVID-19 variants. 1.107 Domestically, the recovery that was interrupted by the second wave of the pandemic regained ground with easing of localised restrictions, aided by rapid progress of vaccination. Financial conditions remain conducive, engendered by the Reserve Bank’s liquidity operations that ensure large liquidity surpluses in the system. In turn, this has enabled the smooth passage of the government’s market borrowing programme. At the same time, the formal sector has gained strength and resilience, aided by the improvement in demand. Bank credit growth is showing signs of gradual recovery, although flow of credit to lesser rated corporates continues to be tepid. Signs of incipient stress in micro, small and medium enterprises (MSME) as also in the micro finance segment call for close monitoring of their portfolios.
|