Amid economic, financial and political shocks, global macrofinancial risks have increased and the outlook is highly uncertain. Despite international spillovers and a challenging global environment, the Indian economy is navigating a path of recovery. In the Indian financial system, healthier balance sheets are enabling a robust recovery of credit flows even as profitability is improving. Introduction 1.1 Since the June 2022 issue of the Financial Stability Report (FSR), the global economic outlook has deteriorated further. Risks to financial stability have become accentuated as central banks have aggressively front-loaded monetary policy tightening synchronously across countries and have given hawkish forward guidance. International organisations, including the International Monetary Fund (IMF), the World Bank (WB) and the Organisation for Economic Co-operation and Development (OECD) have downgraded their global growth projections relative to their previous revisions (Chart 1.1). 1.2 The outlook for 2023 is even bleaker, with global growth expected to fall to 2.7 per cent, with both advanced economies (AEs) and emerging market and developing economies (EMDEs) forecast to experience significant output slowdown. Global trade volume is also expected to decelerate from 10.1 per cent in 2021 to 4.3 per cent in 2022, with EMDEs bearing the brunt. Inflation is forecast to rise to 8.8 per cent in 2022, with both headline and core inflation staying well above targets in AEs and EMDEs (Chart 1.2 a and b).
1.3 The uncertainty surrounding the outlook is at exceptionally elevated levels. According to the IMF, there is a 25 per cent chance of global growth falling below 2.0 per cent in 2023. 1.4 For EMDEs and especially, frontier economies, limited policy space and vulnerability to external shocks due to rising debt distress translate into daunting challenges in managing elevated levels of food and energy prices, shortages of key food and energy staples, emergence of different coronavirus variants, especially in countries where vaccination rates are low, currency depreciation, and surge in capital outflows in a period of rising borrowing costs. The scars from these shocks are likely to be long lasting, with persistent output losses and reduced economic potential (Chart 1.3). 1.5 The Indian economy has been consolidating a recovery interrupted by waves of the pandemic on the back of a robust revival of agriculture and services, stable corporate performance, in spite of the incidence of rising input costs, business and consumer optimism, and supported by a sound financial system. This innate resilience has helped the economy to withstand extraordinary external shocks, especially prolonged geo-political hostilities. Nevertheless, it remains vulnerable to formidable global headwinds, which act as a drag on the domestic economic recovery. 1.6 Real gross domestic product (GDP) growth is placed at 9.7 per cent (y-o-y) in H1:2022-23 (13.7 per cent and 4.7 per cent in H1 and H2 of 2021-22, respectively). This improvement is driven by personal consumption and gross fixed capital formation, which offset the negative contribution of net exports. The strengthening of the recovery in Q3:2022-23 is reflected in high-frequency indicators, especially those relating to the contact intensive sectors. India’s purchasing managers’ indices (PMI) for both manufacturing and services outperformed regional and global indices in October and November. Similarly, other indicators such as motor vehicle registration, passenger traffic, consumption of steel, cement and petroleum point to improvement in domestic economic activity. 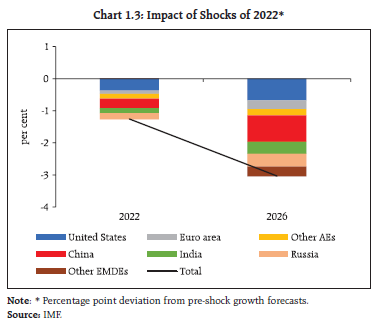 1.7 On the other hand, the slowdown in global growth and the stronger US dollar (USD) are exacerbating pressures on net exports. India’s merchandise exports after falling to a 20-month low in October 2022, have recovered moderately. The rising share of services exports and robust inflows of remittances provide an offset to the widening merchandise trade deficit. The steady net inflows of foreign direct investment and the resumption of portfolio flows since July 2022 indicate that the CAD will be comfortably financed. 1.8 Headline consumer price index (CPI) inflation after remaining above the upper tolerance band of the inflation target range since January 2022, has moderated. While this outcome reflects a series of shocks to food and energy prices, the persistence and broadening of core inflation may continue to exert pressure on inflation going forward. Front-loaded monetary policy actions are expected to bring inflation into the tolerance band and closer to the target while anchoring inflation expectations. I.1 Global Backdrop I.1.1 Macrofinancial Development and Outlook 1.9 Global financial conditions have tightened substantially in the wake of monetary policy actions by central banks and elevated levels of uncertainty (Chart 1.4 a and b). Recently, however, the financial conditions have moderated. 1.10 With central banks emphasising their resolve to restore price stability, nominal yields on sovereign bonds have risen sharply (Chart 1.5 a). In the United States (US), the treasury yield curve has inverted since July 2022, with 2-year and 10-year treasury yields rising by 348 basis points (bps) and 197 bps, respectively (as on December 14, 2022) since end-December 2021. Yields on sovereign bonds in both the Euro area and the United Kingdom (UK) also surged (Chart 1.5 b).
1.11 Equities have fallen sharply (Chart 1.6). Corporate bond spreads have materially widened and distress in the corporate bond market is on the rise, especially down the rating scale (Chart 1.7 a and b). The tightening of financial conditions has resulted in negative returns for almost all asset classes (Table 1.1).
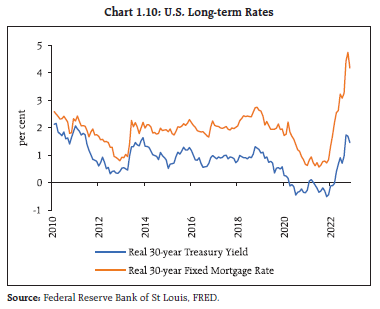
1.12 In tandem, volatility across market segments has risen (Chart 1.8 a and b). Signs of stress in short-term dollar funding markets have also emerged, with cross-currency basis swap spreads for the Japanese Yen (JPY) and the Euro widening to their highest levels since the March 2020 turmoil in financial markets with the onset of the pandemic. Basis swap spreads, however, have narrowed in recent period (Chart 1.9). 1.13 The impact of tightening of financial conditions is also reflected in the sharp rise in real yields on 30-year US treasury and 30-year fixed-rate mortgages (Chart 1.10). 1.14 Financial conditions are interacting with pre-existing vulnerabilities and amplifying market dysfunction. In turn, this is forcing central banks into conflicting positions of having to intervene to ease liquidity strains to preserve financial stability, whilst maintaining a tight monetary policy stance. In the UK, the gilt market witnessed excessive volatility due to the announcement of fiscal measures to support the economy, which raised concerns about unfunded borrowings and fiscal health. As highly leveraged pension funds faced mark-to-market losses and large-scale sell-offs became imminent with material risks to financial stability, the Bank of England (BoE) had to undertake targeted purchases of long-term government bonds for a temporary period. Meanwhile, the European Central Bank announced the establishment of a transmission protection instrument (TPI) to mitigate sovereign bond fragmentation risk in member states and ensure effective transmission of monetary policy. In this phase of monetary policy tightening and liquidity normalisation, the need for central banks to effectively communicate the distinction between operations aimed at preserving financial stability and those that signal the broad direction of monetary policy has become challenging. 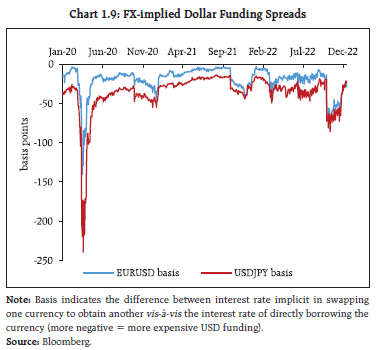
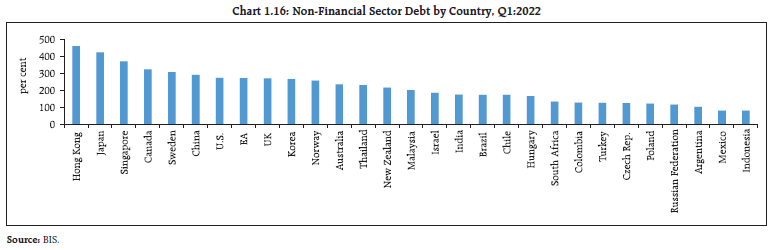
 1.15 Against the backdrop of growing uncertainty about the economic outlook, the tightening of global financial conditions, the upsurge in market volatility and sporadic sell-offs in asset markets have heightened macro-financial risks globally. Future shocks, if any, may exacerbate existing financial system vulnerabilities. I.1.2 Other Global Macrofinancial Risks 1.16 With financial conditions continuing to tighten and the economic outlook uncertain, the balance of macrofinancial risks is skewed to the downside. Debt stress, monetary tightening risks to financial stability, currency volatility, turmoil in crypto assets market and growth of open-ended funds are some of the major risks that can potentially undermine global financial stability. A. Debt Stress 1.17 According to the IMF, global debt after witnessing the largest one-year increase of 29 percentage points of GDP in 2020, fell 10 percentage points of GDP in 20211. Global debt to GDP ratio, however, remained 19 percentage points above pre-pandemic levels. In USD terms, global debt has risen steadily and now stands at a record-high of US $235 trillion. As central banks raise interest rates to combat inflation, raising borrowing costs for both the public and private sectors, high debt vulnerabilities need to be managed. Debt distress is particularly worrisome in low-income emerging nations where pandemic scars are more pronounced and sovereign spreads are sharply rising. 1.18 The cost-of-living crisis in several countries has brought the focus of attention on the limited fiscal policy space available to prevent or mitigate resulting welfare losses in view of elevated debt levels and rapidly rising borrowing costs. According to the IMF, global government debt2 is projected at 91 per cent of GDP in 2022, 7.5 per cent above the pre-pandemic level (Chart 1.11). Going forward, fiscal deficits are projected to reach 3.6 per cent of GDP in AEs and 6.2 per cent in emerging market economies (EMEs), 1.1 and 2.2 percentage points, respectively, above their 2017-19 average (Chart 1.12 and 1.13). 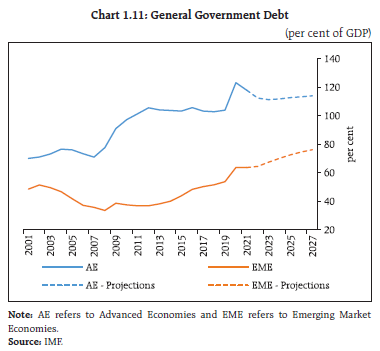 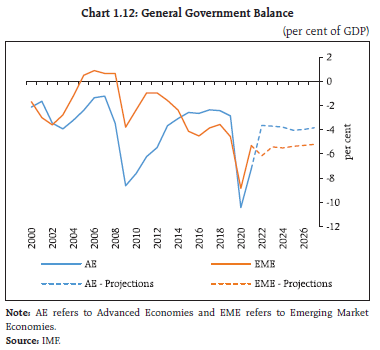 1.19 At the same time, market value of non-financial sector debt (governments, non-financial corporates and households) had reached very high levels during the COVID-19 pandemic (Chart 1.14), emerging as a source of vulnerability, especially in a tightening monetary policy cycle (Chart 1.15). In many economies, private-sector debt is more than government debt (Table 1.2). AEs have a higher share of non-financial sector debt (Chart 1.16). According to the Financial Stability Board (FSB), debt servicing may become a problem if average interest rates rose at the same rate as they did during the Global Financial Crisis (GFC) and incomes decline by 3 per cent3. For many EMEs with debt levels already at distressed levels, the pressure is likely to intensify even further as their currencies depreciate against the USD and borrowing costs rise.
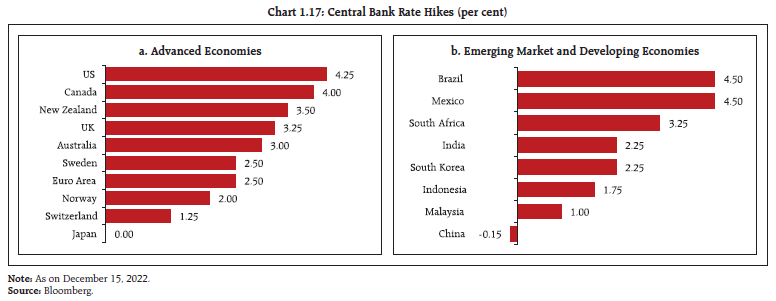
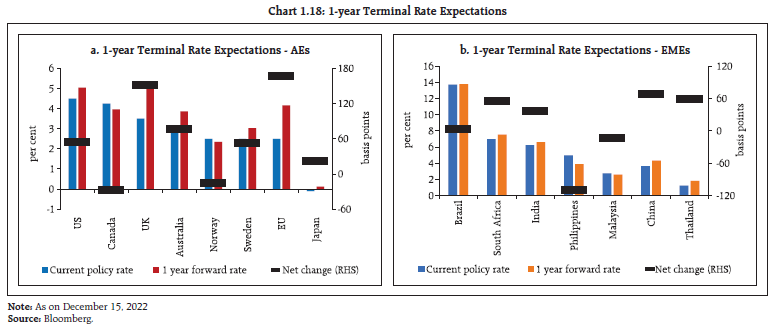
B. Monetary Tightening Risks to Financial Stability 1.20 The aggressive tightening of monetary policy is likely to continue over the next one year (Chart 1.17 and 1.18). The current tightening phase has two characteristics that stand out historically. First, it is the most synchronised in the previous 50 years. Second, policy rate increases are happening twice as quickly as they did previously. The front-loaded and faster-than-usual pace of tightening has consequences for financial stability as it is interacting with financial system vulnerabilities through multiple channels. | Table 1.2: Global Non-Financial Sector Debt Q1:2022 | | per cent of GDP | | | Total Non-Financial Sector | Government | Private | Private | | House-hold | Non-Financial Corporates | | Global | 261 | 95 | 166 | 65 | 101 | | Developed | 281 | 114 | 167 | 74 | 93 | | US | 275 | 117 | 158 | 77 | 81 | | Euro Area | 273 | 103 | 169 | 59 | 110 | | UK | 271 | 118 | 153 | 85 | 68 | | Japan | 425 | 238 | 186 | 69 | 117 | | Emerging | 230 | 67 | 163 | 51 | 113 | | China | 292 | 73 | 218 | 61 | 157 | | India | 176 | 85 | 91 | 37 | 54 | | Korea | 268 | 47 | 221 | 105 | 115 | | Russia | 118 | 17 | 100 | 22 | 79 | | Turkey | 127 | 41 | 86 | 13 | 73 | | South Africa | 135 | 69 | 66 | 34 | 32 | | Brazil | 175 | 90 | 85 | 34 | 51 | | Mexico | 82 | 42 | 41 | 16 | 24 | | Source: BIS. |
 1.21 Riskier assets often sell-off when financial conditions tighten in response to interest rate hikes by central banks leading to market dislocation and obstruction to the flow of credit to the real economy. With non-banking financial institutions expanding their footprint, markets have become more vulnerable to such episodes, as was witnessed in the March 2020 market turmoil. Second, in recent years, there has been a substantial rise in debt levels among both private borrowers and governments, with attendent debt servicing costs. This is more pronounced for EMEs with dollar-denominated debt, which gets amplified by the sharp appreciation of the USD. Third, in many economies, the ratio of housing prices to incomes are substantially higher than in past tightening cycles. Finally, financial stability may also be endangered by tightening financial conditions and ensuing losses to financial institutions due to deterioration in asset quality, which could prompt them to reduce risk and tighten lending standards. This, in turn, could hinder economic growth. 1.22 Calibrating the pace and size of monetary tightening is a challenge as central banks respond to evolving domestic challenges, which reflect country-specific variations. The impact on financial conditions has been quick and sizable, with the potential to amplify pre-existing vulnerabilities in the financial system and pose risks to financial stability. While the fortification of bank balance sheets as part of the post-GFC regulatory reforms has improved their resilience, hidden leverages as revealed in the case of pension funds in the UK may overwhelm these buffers and endanger systemic stability in an interconnected financial system where banks are counterparties to non-bank financial intermediaries. Quantitative tightening by central banks may exacerbate liquidity strains. Monetary tightening will also impact central bank balance sheets. As they raise interest rates rapidly, they may incur losses as interest rates they pay on their liabilities continue to rise, while rates earned on their assets (securities) remain relatively fixed (Chart 1.19). The implication of likely losses for central banks has multiple dimensions in terms of their ability to conduct independent monetary policy, transfer surpluses to the Government and losses, if any, to the taxpayer4. C. Currency Volatility 1.23 Large exchange rate fluctuations have been triggered by global shocks and spillovers, and monetary policy actions to keep inflation under control. The USD, in particular, has strengthened sharply against currencies of both advanced and emerging market economies (Chart 1.20 a and b). 1.24 Changes in terms of trade have been a major driver of recent exchange rate movements. Countries that have experienced worsening terms of trade, especially those that are heavily dependent on energy imports, have also seen larger depreciations of their currencies than commodity exporters (Chart 1.21). This has coincided with an improvement in the U.S. terms of trade as it has become a net exporter of energy.
1.25 The divergent pace of monetary policy tightening across nations has been another important driver influencing currency movements. Larger depreciations against the USD have typically been correlated with policy rate differentials vis-à-vis the US (Chart 1.22). 1.26 The impact of a stronger USD on global economic conditions has been significant5, as it is the most widely used currency in terms of trade invoicing and financing, funding currency in global capital markets and cross-border payments (Chart 1.23). The 2022 Bank for International Settlements (BIS) Triennial Survey of Foreign Exchange and Over-the-counter (OTC) Derivatives Markets shows continued dominance of the USD in global currency trade, with the USD on one side of 88 per cent of all trades.
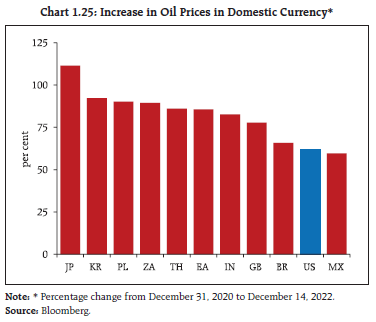
1.27 An increase in the value of the USD also tends to increase inflation by driving up import prices particularly of commodities which are invoiced in the USD. In fact, in a departure from past episodes, elevated commodity prices have coincided with USD appreciation (Chart 1.24). 1.28 Commodity prices have risen considerably more in local currencies. This has compounded the inflationary effects of rising commodity prices, with second order effects on prices and wages (Chart 1.25). A stronger USD also tightens trade credit conditions and strains global value chains6. 1.29 From EMEs’ perspective, a stronger USD has led to capital outflows and increased debt servicing costs on dollar-denominated debt (Chart 1.26). Historically, economic downturns in EMEs are associated with USD appreciation shocks in view of less developed and shallow financial markets and weak balance sheets7. 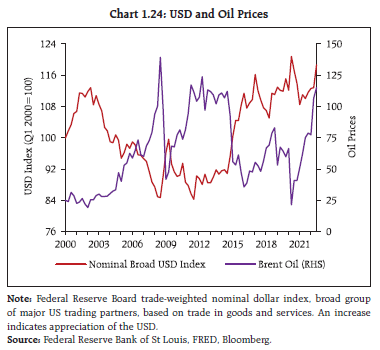
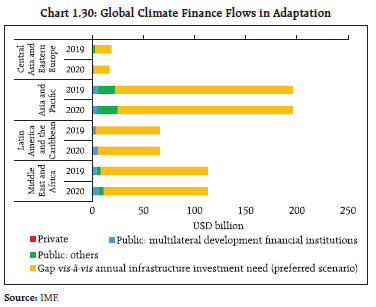
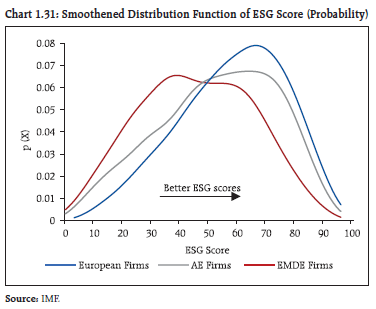
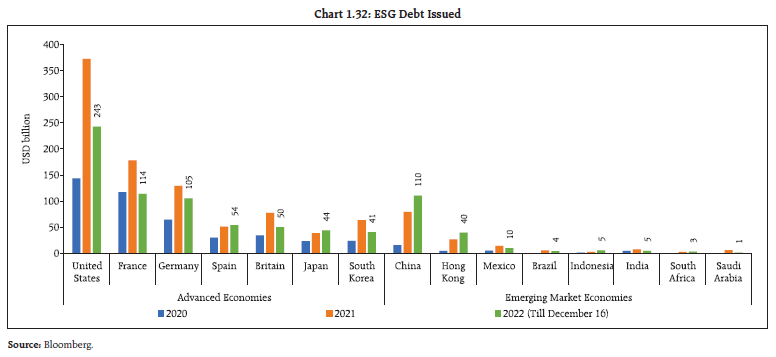
1.30 The BIS in its December 2022 quarterly review estimates that US $80 trillion of dollar debt is “missing” in the sense that they form FX swaps, forwards and currency swaps, which are reported off-balance sheet8. Out of this stunning size of missing dollar obligations, banks’ exposure was US $52 trillion and that of non-banks was half of that, US $26 trillion. Moreover, this US $26 trillion debt is probably held by firms outside the U.S. and for whom the USD is a foreign currency. The BIS review also highlights that according to new data from the 2022 BIS Triennial Survey, settlement risk is present in roughly a third of deliverable FX turnover, which may have systemic consequences. D. Banking Sector Resilience 1.31 Despite a hostile global financial environment, the banking system has remained resilient with adequate capital buffers and moderate levels of non-performing loans. An improvement in profitability in H1:2022 was driven by higher net interest income, given that the initial impact of rising interest rates on investment portfolios was limited. Marked-to-market losses may, however, have exacerbated in H2:2022 (Chart 1.27). 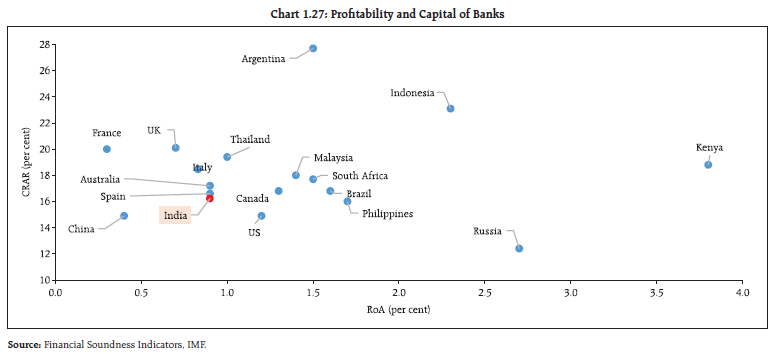 1.32 A stress test conducted by the IMF for banks in 29 economies - 24 AEs and 5 EMEs, including India – with combined banking sector assets accounting for 70 per cent of global banking assets suggests that, at the aggregate level, the global banking sector generally remains resilient to pandemic shocks. Their common equity tier 1 (CET1) capital ratios will decline by 2.5 percentage points for AE banks and 5.5 percentage points for EME banks under a severe downturn scenario (Chart 1.28 a). Most banks in AEs would remain resilient but up to 29 per cent of EME banks could breach the minimum capital requirements (CET1 ratio below the 4.5 per cent)9 (Chart 1.28 b). E. Climate Finance 1.33 Climate risks are rising across the globe as drought, flooding, summer heat waves and harsh winters are increasing in severity and becoming more frequent in both southern and northern hemisphere. Economies are coordinating and working towards an ambitious plan that accelerates both mitigation and adaptation efforts to combat the threat of climate change. A key plank of these efforts is to scale up climate financing in coming years for mitigation finance, i.e., reducing greenhouse gas emissions, and adaptation finance, which is needed to adapt to adverse effects of climate change. Since two-thirds of worldwide greenhouse gas emissions come from EMDEs, and many of them are extremely vulnerable to climate risks, their need for climate financing is substantial. 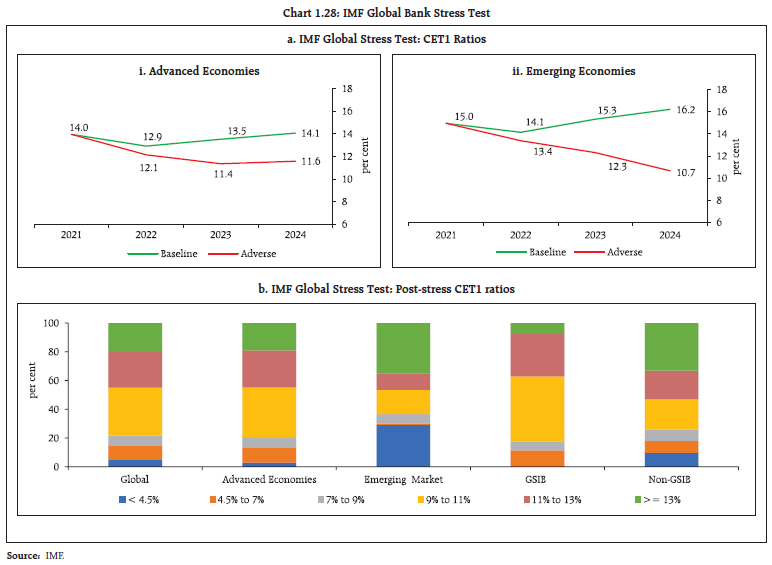 1.34 According to the International Energy Agency (IEA), EMDEs must expand their investments in clean energy to US $1 trillion annually by 2030, if they are to remain on course to reach net-zero greenhouse gas emissions by 205010. Furthermore, their estimated annual adaptation financing need ranges from US $160 billion to US $340 billion by 2030 and US $315 billion to US $565 billion by 2050, with adaptation finance gap in these economies five to ten times more than existing global adaptation finance flows11. In the face of significant climate finance needs, underinvestment could increase financial stability risks by increasing exposure to climate-related financial risks (Charts 1.29 and 1.30). 1.35 With public finance at stretched levels in the wake of the pandemic, private finance is key to meeting climate financing needs in EMDEs. Scaling up private climate finance, however, faces many challenges. Lack of depth in domestic capital markets, low returns, information asymmetry about investment benefits in the absence of data and disclosures, and higher credit risk are some of the main reasons deterring investor interest. Though environmental, social, and governance (ESG) investment is growing, low ESG scores of firms in EMDEs compared to their counterparts in AEs are hampering allocation of institutional funds to EMDE assets12 (Charts 1.31 and 1.32). 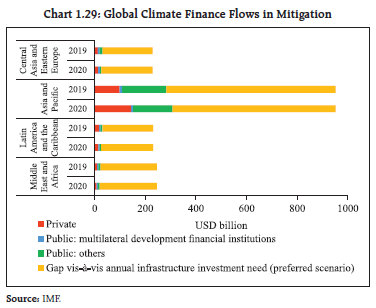
  1.36 To reduce the mismatch between supply and demand for climate finance in EMDEs, both public and private sectors have important roles to play. The private sector needs to develop innovative financing instruments. According to the IMF, outcome-based instruments such as sustainability-linked bonds will be particularly suitable for EMDEs as they can be linked to emission reduction targets. Similarly, de-risking private investments by using blended finance that combines public and private funds can also be used to scale up private capital13. F. Open-ended Investment Funds14 1.37 Open-ended investment funds (OEFs) have grown rapidly since the GFC, with their total net assets at US $41 trillion in Q1:2022, representing almost a fifth of the assets in the non-bank financial sector15 (Chart 1.33). 1.38 The expansion of the OEF sector reflects the growing shift in financial intermediation away from banks and toward non-bank financial institutions. Tightening of banking regulations post-GFC and deleveraging of bank balance sheets have also contributed to this shift. Their increasing importance in the functioning of asset markets poses potential financial stability risks through amplification of volatility and fire-sales, especially when market liquidity declines. OEFs faced massive redemption pressures in the March 2020 market turmoil when financial conditions tightened (Chart 1.34). This, in turn, led to asset market dysfunction and substantial reduction in liquidity, forcing central banks to intervene to restore normal market functioning. 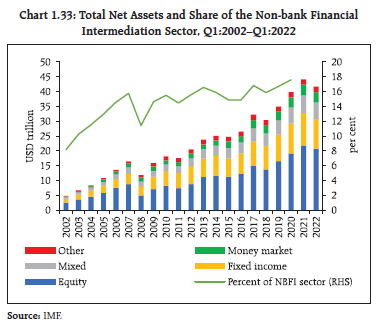 1.39 Financial stability risks arising from non-bank financial institutions warrant policy solutions that reduce vulnerabilities ex ante by lowering the risk of investor runs. Their global operations and potential adverse cross-border spillover effects also necessitate greater international regulatory coordination. G. Crypto Assets Market, Stablecoins and Decentralised Finance (DeFi) 1.40 The collapse and bankruptcy of the crypto exchange FTX and subsequent sell-off in crypto assets market have highlighted the inherent vulnerabilities in the crypto ecosystem. Recently, Binance, the largest crypto exchange has also prohibited withdrawals of stablecoins on its platform. The implosion of FTX was preceded by failure of TerraUSD/Luna, an algorithmic stablecoin, a run on Celsius, a crypto lender, and bankruptcy of Three Arrows Capital, a cryptocurrency hedge fund. 1.41 The turmoil has provided several insights16. First, crypto assets are highly volatile. The price of Bitcoin has decreased by 74 per cent (as on December 14, 2022) from its peak in November 2021. Other crypto assets have also experienced similar falls in prices and heightened volatility (Chart 1.35 and Table 1.3).
| Table 1.3: Key Cryptocurrency Prices and Indices | | | Current Market Cap (USD) | Current Price (USD) | Q-o-Q change (per cent) | Y-o-Y change (per cent) | | Bitcoin | 342.9 Bn | 17826.8 | (12.4) | (62.4) | | Ethereum | 159.4 Bn | 1323.1 | (17.4) | (65.3) | | DeFi Index | 38.3 Mn | 68.2 | (19.1) | (70.2) | Note: Updated on December 14, 2022.
Source: Bloomberg and CoinMarketCap. | 1.42 In addition, crypto assets also exhibit high correlations with equities. Furthermore, contrary to claims that they are an alternative source of value due to inflation hedging benefits17, crypto assets value has fallen even as inflation rose (Chart 1.36 a and b). 1.43 Second, the collapse of TerraUSD/Luna is a reminder of how so-called stablecoins that promise to maintain a stable value relative to fiat currency are subject to classic confidence runs. Finally, failure of FTX and Celsius reveals that crypto exchanges and trading platforms were carrying out different functions such as lending, brokerage, clearing and settlement that have different risks without appropriate governance structures. This exposed them to credit, market and liquidity risks disproportionate to what was necessary to discharge their essential functions18. Leverage is a constant theme across the crypto ecosystem, making failures rapid and losses huge and sudden. A recent BIS study notes that rising prices of crypto assets is a major driver of crypto adoption, especially among younger segment of the population.19 1.44 Although crypto assets market remains volatile, there have not yet been any spillovers onto the stability of the formal financial system. The accumulated experience, however, suggests that they form an unstable ecosystem and there is growing evidence that they remain highly concentrated and interconnected. To address potential future financial stability risks and to protect consumers and investors, it is important to arrive at a common approach to crypto assets. In this context, various options are being considered internationally. One option is to apply the same-risk- same-regulatory-outcome principle and subject them to the same regulation applicable to traditional financial intermediaries and exchanges. Another option is to prohibit crypto assets since their real-life use cases are next to negligible. The challenge is that different countries have different legal systems and individual rights vis-à-vis state powers. A third option is to let it implode and make it systemically irrelevant as the underlying instability and riskiness will ultimately prevent the sector from growing20. The third option, however, is fraught with risks as the sector may become more interconnected with mainstream finance and divert financing away from traditional finance with broader effect on the real economy. Regulating new technology and business models after they have grown to a systemic level is challenging. To promote responsible innovation and to mitigate financial stability risks in crypto ecosystem, it is vital for policymakers to design an appropriate policy approach. In this context, under India’s G20 presidency, one of the priorities is to develop a framework for global regulation, including the possibility of prohibition, of unbacked crypto assets, stablecoins and DeFi. 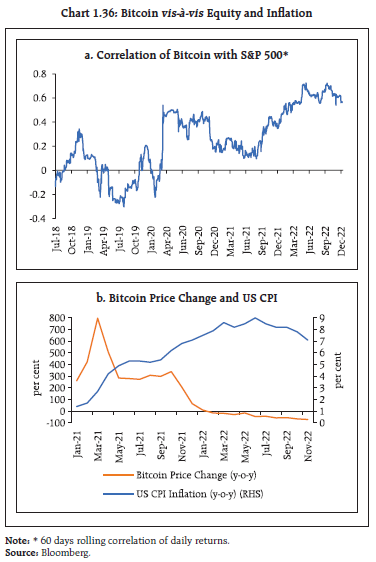 H. Commodity Markets 1.45 Improved supply conditions and slowing global demand since the release of the last FSR in June 2022 has brought down global prices of non-energy commodities below their pre-Russia-Ukraine war levels and energy prices have also moderated after August 2022. Concomitantly, there has been a fall in freight rates and easing of supply-side bottlenecks (Chart 1.37). 1.46 In many economies, however, currency depreciations have kept commodity prices in local-currency term at still elevated levels and much above their averages over the last five years (Chart 1.38 a and b). For poorer economies, this is a double blow as commodity-driven inflation is likely to precipitate a humanitarian crisis.
1.47 After expected increases of 60 per cent in 202221, energy prices are projected to fall in 2023 and 2024 driven by slower global growth, weaker demand for natural gas and climate transition (Chart 1.39). Nevertheless, they are expected to remain volatile in view of geopolitical stresses and lower strategic reserves in many countries, with second-order effects such as increased electricity and transportation expenses. 1.48 The food price index of the Food and Agriculture Organisation (FAO) recorded a sequential (m-o-m) decline for the eighth successive month in November 2022 (Chart 1.40). It is projected to fall further in 2023, supported by a higher-than-anticipated global wheat harvest, stable rice market supply, and the restart of grain exports from Ukraine22. There are, however, downside risks to this forecast as the war may continue to disrupt supplies and adverse weather patterns may emerge. According to the World Bank, over 200 million people are expected to experience acute food insecurity in 2022. 1.49 Financialisaton of commodities (Chart 1.41) has increased the linkages between commodity traders, banks and central counterparties (CCPs). The share of derivatives activity and intermediation is clustered among large commodity firms and concentration is also rising for banks that provide short-term credit to commodities traders and clearing services, with financial stability implications. 1.50 Banks’ exposure to leveraged commodities traders can increase their lending and intraday exposures in times of stress, due to demand for liquidity, to meet margin calls. In case they are unwilling to meet demand for credit, commodities traders would be forced to unwind their positions, which would exacerbate market volatility. Moreover, banks’ role as CCP clearing members will make it difficult for commodities firms to hedge in derivatives markets and to post margins at CCPs. As few firms dominate commodities derivatives markets, disruption in any of the larger firm/s could increase volatility and lower market liquidity for commodities derivatives.
I. Central Bank Digital Currencies 1.51 Accelerated digitalisation, supported by technological innovation, and spread of private-sector digital ventures, have led to the proliferation of initiatives to launch central bank digital currencies (CBDCs) (Chart 1.42). The experiments from front-runners to subsequent movers are offering valuable lessons about challenges to the introduction of CBDC. 1.52 CBDCs have financial stability and monetary policy implications. There is still animated debate around potential impact of a CBDC on banking (dis) intermediation. Four key factors are important23. First, depending upon market power of banks in deposit markets, the entry of a CBDC that directly competes with bank deposits may result in higher deposit rates. Second, the effect of CBDC on bank disintermediation will depend on the interest rate offered on CBDCs, which, if high enough, can cause bank disintermediation. The market power of banks will determine the direction of intermediation when rates are in an intermediate range. Third, a CBDC would have negligible effect on intermediation if banks can replace any lost retail deposits with wholesale funding, which is especially important for larger banks. Finally, the degree of bank disintermediation may be limited by restrictions placed on the amount of CBDC that users may hold, transact, or earn interest on. 1.53 There are a few lessons emerging from CBDC experiments so far24. First, in introducing a CBDC, it is necessary to balance trade-offs between several objectives while choosing the appropriate technology. These trade-offs consist of design choices including centralised versus decentralised ledger systems; choice between privacy and compliance; and stability and innovation. Second, developing a successful CBDC is more challenging than initially thought of, as two opposing forces are at play: being “too successful” and driving away private payment options or “being not successful enough” and failing to generate enough demand25. Finally, private-public collaborations for CBDCs may be essential as it will help in putting in place appropriate governance for the division of labour, costs, and authority. 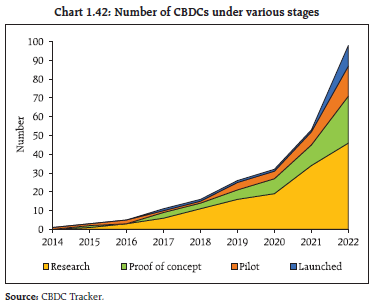 1.54 More international cooperation and experience sharing is necessary to ensure interoperability of CBDCs, establish global standards, enhance cross-border usage and better understand consequent macrofinancial implications. I.2 Domestic Macrofinancial Risks 1.55 The resilience of the domestic financial system is being reflected in healthy balance sheet of banks, stronger capital levels of non-bank financial companies (NBFCs) and robust growth in assets under management (AUM) of domestic mutual funds. Despite significant global spillovers, asset quality, profitability, capital and liquidity buffers in the Indian banking system provide comfort. Gross non-performing assets (GNPA) of banks have maintained a declining trend. The ratio of GNPA to gross advances fell from 5.9 per cent in March 2022 to 5.7 per cent in June 2022 and further to 5.0 per cent in September 2022, which has facilitated broad based expansion in bank credit. Lending by NBFCs is also on the rise. I.2.1 Corporate Sector 1.56 Private non-financial companies recorded strong sales growth during H1:2022-23, driven by steady recovery in demand conditions as well as the rise in prices especially for petroleum companies. Both nominal and real sales growth (y-o-y) exceeded their pre-pandemic two-year average levels (Chart 1.43 a and b). In the services sector, information technology (IT) companies sustained a broadening growth trajectory, and non-IT services companies recorded robust sales growth (Chart 1.43 c and d). 1.57 In Q2:2022-23, there appears to be a loss of momentum in corporate earnings, mainly due to rising expenditure boosted by input costs outpacing revenue growth, an increase in interest payments and other expenses. While the operating profit margin moderated for non-IT services companies, it remained steady for IT companies even as staff cost of the latter rose by 24.1 per cent during Q2:2022-23 (Chart 1.44).
1.58 Corporate sector leverage, as reflected in debt-to-equity and debt-to-asset ratios, have been increasing gradually from pandemic lows (Chart 1.45 a). The share of cash holdings (including balances with banks and highly liquid investments) in total assets declined during H1:2022-23 but remains well above its pre-pandemic level (Chart 1.45 b). On the other hand, the share of fixed assets in total assets remained subdued and at the level observed during H2:2021-22, awaiting the upturn of a new private investment cycle. 1.59 Debt serviceability, as measured by interest coverage ratio (ICR)26, remained well above one for both manufacturing and IT firms, while it stood marginally lower than unity for non-IT services firms (Chart 1.46).
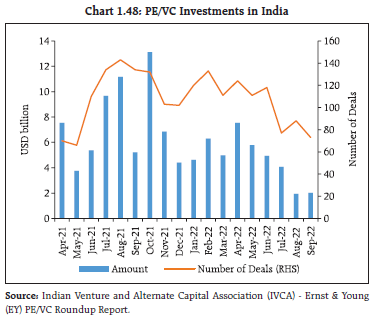
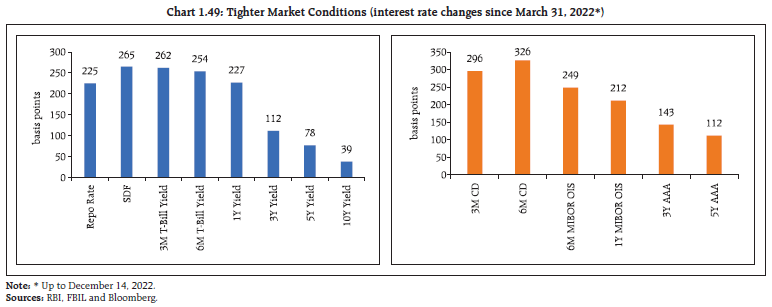
1.60 With moderation in overseas issuances and declining investments by private equity (PE) / venture capital (VC), the financing needs of the corporate sector are increasingly being met through domestic resources. (Chart 1.47 and 1.48). As funds raised from the primary segment of domestic equity markets declined during FY 2022-23, reliance on bank credit for funding regular operations and capacity expansion is increasing. I.2.2 Money Markets, Government Securities and Corporate Bond Markets 1.61 Domestic financial conditions have tightened in response to the focus of the monetary policy stance on withdrawal of accommodation to ensure that inflation remains within the target going forward, while supporting growth. Money market rates and short-term bond yields have hardened in tandem with policy rate increases. The passthrough to long-term rates has improved but remains incomplete (Chart 1.49). The average daily absorption under the liquidity adjustment facility (LAF) has declined from ₹7.8 lakh crore in April 2022 to ₹3.8 lakh crore in June-July 2022 and further to ₹1.4 lakh crore in November 2022 (Chart 1.50). Day-to-day movements in government cash balances also influence the intermittent changes in liquidity conditions, including on some days when the overnight rates breach the repo rate. 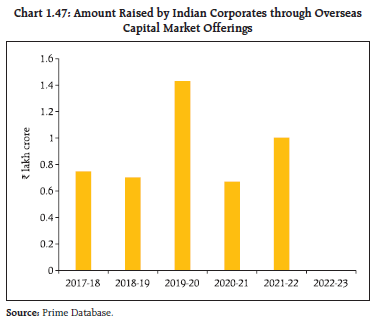
 1.62 The government securities (G-sec) yield curve flattened (Chart 1.51 a and b) as the short-end of the yield curve rose substantially in response to monetary policy actions while the long-end of the curve rose at a much lower pace as pressures from augmented supplies of paper eased and a stable inflation and growth outlook has taken hold. The net G-sec supply is expected at around ₹ 4.8 lakh crore in H2:2022-23 vis-à-vis ₹ 2.9 lakh crore a year ago. 1.63 In line with the increase in policy rates and sovereign yields, corporate bond yields have also risen, and spreads have widened for lower-rated bonds (AA and BBB-). Among institutions, spreads of bonds issued by NBFCs and non-financial corporates rose moderately (Chart 1.52 a and b).
1.64 A comparison of rating-wise median yield spreads of listed non-convertible debentures (NCDs) at the time of primary issuance and in secondary market trading showed that the spread over benchmark yield of 3-year G-sec narrowed across all rating categories during the first half of 2022-23 on a year-on-year basis (Charts 1.53 a and b). The median yield spread of traded NCDs, however, rose for all rating categories except AA+ during Q2:2022-23 compared to Q1:2022-23. 1.65 Private placement continues to dominate corporate bond issuances. NBFCs, Housing Finance Companies (HFCs) and Public-Sector Undertakings (PSUs) accounted for 73 per cent of the total listed bonds / debentures. (Chart 1.54).
1.66 Of the total public issuances of corporate bonds, 70 per cent were subscribed by residents (Chart 1.55a). Nearly two thirds were privately placed with banks and body corporates (Chart 1.55b). I.2.3 Government Finance 1.67 Reverting to its path on fiscal consolidation, the Union government aims to bring down gross fiscal deficit (GFD) to 6.4 per cent of GDP in 2022-23 from 6.7 per cent in the previous year (Table 1.4). During the current year so far (up to October 2022), the GFD has been contained at 45.6 per cent of budget estimates for the full year on the back of buoyant tax collections, even as growth in capital expenditure remained robust. Goods and Services Tax (GST) collections surpassed ₹1.4 lakh crore for the ninth consecutive month and stood at ₹1.46 lakh crore in November 2022 (Chart 1.56). | Table 1.4: Central Government Finances - Key Deficit Indicators | | (per cent of GDP at current market prices) | | Item | 2020-21 | 2021-22 (PA) | 2022-23 (BE) | | Revenue Deficit | 7.3 | 4.4 | 3.8 | | Gross Fiscal Deficit | 9.2 | 6.7 | 6.4 | | Primary Deficit | 5.7 | 3.3 | 2.8 | Note: PA: Provisional accounts; BE: Budget estimates.
Source: Union Budget, 2022-23; and Controller General of Accounts (CGA). | 1.68 Interest payments of the central government, which amounted to 3.4 per cent of GDP in 2021-22, are slated to rise to 3.6 per cent of GDP in 2022-23 (BE). During April-October 2022-23, interest payments increased by 19.9 per cent (y-o-y), surpassing the growth in revenue receipts27 of 7.1 per cent. During 2022-23 so far (till October 2022), the weighted average yield of G-sec issuances was 7.31 percent, which was 103 bps higher than in 2021-22 (6.28 per cent). 1.69 Despite the increase in the debt to GDP ratio {increase from 48.9 per cent in 2018-19 to 60.2 per cent in 2022-23 (BE) for the central government}, higher redemption pressures (Chart 1.57 a and b) and rise in yields, the interest rate-growth rate differential (r-g) remains favourable due to higher nominal growth vis-a-vis nominal interest rate, easing any intertemporal budget constraint in servicing debt. 1.70 State governments’ finances improved in 2021-22 as they budgeted to regain the fiscal space lost during the pandemic. In 2021-22, their combined gross fiscal deficit ratio was much lower at 2.7 per cent of gross state domestic product (GSDP) than the revised estimate of 3.6 per cent. This has been achieved on the back of higher-than-expected growth in both tax and non-tax revenues, even as expenditure remained robust. For 2022-23, states have budgeted for a consolidated GFD-GSDP ratio of 3.3 per cent, which lies within the indicative target of 4 per cent28 set by the 15th Finance Commission (Table 1.5).
| Table 1.5: States’ Key Deficit Indicators | | Deficit Indicator | (As per cent of GSDP) | | 2020-21 | 2021-22 (RE) | 2021-22 (PA) | 2022-23 (BE) | | Revenue Deficit | 1.8 | 0.9 | 0.4 | 0.4 | | Gross Fiscal Deficit | 3.8 | 3.6 | 2.7 | 3.3 | | Primary Deficit | 2.0 | 1.9 | 1.1 | 1.5 | Note: PA: Provisional accounts; BE: Budget estimates; RE: Revised estimates.
Data pertains to 29 States/ UTs.
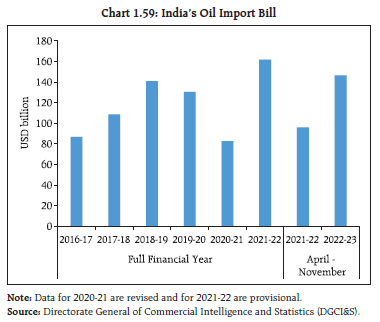
Source: Budget document of State governments. | 1.71 Notwithstanding the gains from fiscal consolidation, there are concerns about rising subsidies announced by many states. The 15th Finance Commission’s report has also flagged the issue of rising share of subsidies in some of the states’ revenue expenditures (FC-XV Report)29. After contracting in 2019-20, states’ expenditure on subsidies has grown by 12.9 per cent and 11.2 per cent during 2020-21 and 2021-22, respectively. Commensurately, the share of subsidies in their total revenue expenditure has also risen from 7.8 per cent in 2019-20 to 8.2 per cent in 2021-22. The rising expenditure on non-merit subsidies may raise the share of committed expenditure in states’ spending, constraining the fiscal space available for developmental and capital spending. I.2.4 External Sector Developments and Foreign Exchange Markets 1.72 India’s external sector is facing strong global headwinds from rising risks of global slowdown, still elevated commodity prices and volatility in capital flows. While the moderation in external demand has pulled merchandise exports into contraction in October 2022, the terms of trade shock has kept imports on a rising scale. 1.73 This resulted in a widening of the merchandise trade deficit to US $198.3 billion during April-November 2022 as compared with US $115.4 billion in the corresponding period last year. Despite some reversal in commodity prices alongside a fall in global freight rates from historic highs, the worsening outlook for exports may continue to exercise pressure on trade and current account balance (Chart 1.58 a and b). 1.74 The rising oil import bill which reflects a structural dependence on imported energy has limited the scope of policy manoeuvrability (Chart 1.59). India’s share in global crude oil consumption has increased from 3.0 per cent in 2000 to 3.8 per cent in 2010 and further to 5.2 per cent in 202130. In fact, of the increase in global petroleum demand by 2 million barrels per day in 2022, one-fifth is accounted for by India. India is a price taker in respect of crude oil, and the recent depreciation of the Indian Rupee (INR) against the USD – the currency of denomination of international crude oil prices – has amplified the pressure on imports. 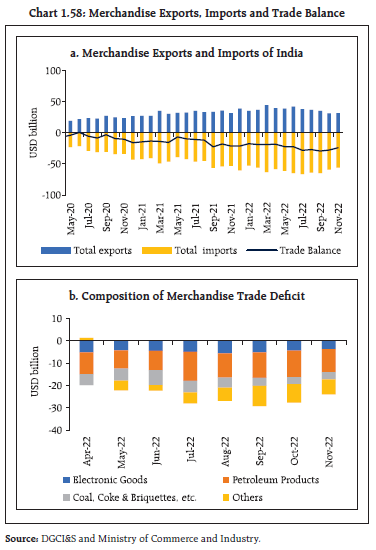
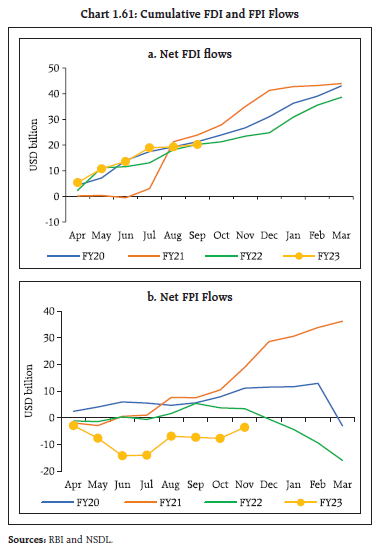
 1.75 India’s CAD widened to 4.4 per cent of GDP in Q2:2022-23 from 2.2 per cent of GDP in the previous quarter and 1.2 per cent in 2021-22. The rise in CAD was primarily on account of the widening of merchandise trade deficit reflecting the impact of slowing global demand on exports, even as growth in services exports and remittances remained robust. 1.76 Net capital flows led by foreign portfolio investment (FPI) (US $6.5 billion), foreign direct investment (FDI) (US $6.4 billion) and trade credit (US $5.1 billion) fell short of the funding requirements of CAD, resulting in a depletion of foreign exchange reserves to the tune of US $30.4 billion on a balance of payments (BoP) basis during Q2:2022-23 (Chart 1.60). During Q3:2022-23 (up to December 16, 2022), foreign exchange reserves increased by US $30.8 billion from US $532.7 billion as on September 30, 2022. 1.77 During 2022-23 so far, net FDI at US $22.7 billion remains above its level a year ago. FPI inflows amounted to US $11.6 billion in July-December (till December 14, 2022) and narrowed the net outflows for the financial year so far to US $2.7 billion due to heavy outflows during April-June 2022 (Chart 1.61 a and b and Table 1.6). Net inflows from external commercial borrowings (ECBs) turned negative on account of repayments while non-resident deposits picked up from their levels a year ago. 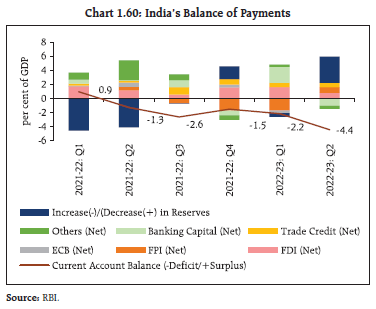
 | Table 1.6: Net Capital Flows | | (USD billion) | | Component | Fiscal year so far | Financial year (Apr-Mar) | | Period | 2022-23 | 2021-22 | 2021-22 | 2020-21 | | 1. FDI (Net) | Apr-Oct | 22.7 | 21.3 | 38.6 | 44.0 | | 2. FPI (Net) | Apr-Nov | -3.2 | 2.7 | -14.1 | 38.7 | | 2a Equity | Apr-Nov | -3.3 | -1.8 | -15.6 | 38.8 | | 2b Debt | Apr-Nov | 0.2 | 4.5 | 1.5 | -0.1 | | 3. ECB to India (net) | Apr-Nov | -5.9 | 4.2 | 7.4 | 0.2 | | 4. Non-Resident Deposits (net) | Apr-Oct | 4.9 | 3.3 | 3.2 | 7.4 | Note: Data on FPI for 2022-23 (Apr-Nov) and corresponding period previous year have been sourced from NSDL, whereas data for 2021-22 and 2020-21 are based on BoP.
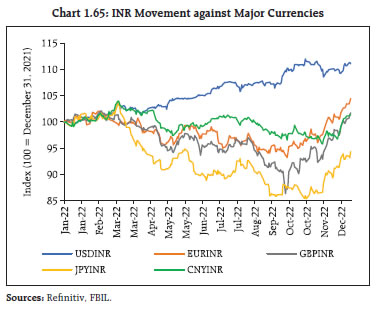
Source: RBI and NSDL. | 1.78 India’s foreign exchange reserves amounted to US $563.5 billion as on December 16, 2022, providing strong buffers against global spillovers (Chart 1.62). 1.79 Of the decline in reserves by US $75 billion in 2022-23 (as on end-September, 2022), about 66.0 per cent can be attributed to valuation losses as the USD strengthened and yields on treasuries and other sovereign bonds rose (Chart 1.63 a and b). 1.80 India’s external debt stood at US $610.5 billion at end-September 2022, with short-term debt (on residual maturity basis) constituting 45.0 per cent. Over time, the share of dollar-denominated debt has been falling, while that of rupee-denominated debt has gone up (Chart 1.64), highlighting the diversification underway. 1.81 Among capital flows, the weighted average maturity of ECBs in H1:2022-23 elongated to 5.6 years (4.9 years in H1:2021-22), reflecting lower roll-over risk. ECBs are primarily denominated in four major currencies, viz., USD (81.4 per cent), Euro (4.5 per cent), JPY (4.4 per cent) and the INR (8.7 per cent). A predominant component of ECB loans is hedged, while some part is guaranteed by the Government of India and a portion of the unhedged ECBs retain natural hedges where the borrower’s earnings are in foreign currency (Table 1.7). 1.82 During CY:2022 (up to December 14), the INR depreciated by 10.0 per cent against the USD, 4.2 per cent against the Euro, 1.7 per cent against the Pound sterling and 1.3 per cent against the Chinese yuan but appreciated by 6.0 per cent against the Japanese yen. Meanwhile, the US dollar index has appreciated by 8.5 per cent (Chart 1.65). | Table 1.7: ECB Loans | | (USD million) | | Description | (As on Sep-2022) | | A. ECB – Total outstanding | 173,487 | | B. ECB – INR denominated | 15,109 | | C. ECB – FDI Companies’ borrowings from foreign parent | 28,426 | | Of which: | | | (a) INR denominated | 10,790 | | (b) FCY denominated | 17,636 | | D. ECB – Non-Rupee and non-FDI [= A-B-C(b)] | 140,742 | | Of which: | | | (a) Public sector companies | 53,163 | | (b) Private companies and others | 87,580 | | E. Hedging details of non-Rupee non-FDI ECBs (i.e., D above) | 61,589 | | (1) Hedging declared on registration from April 2019 | 44,695 | | Of which: | | | (a) Public sector companies | 8,800 | | (b) Private companies and others | 35,895 | | (2) Other past loans reported hedged by borrowers | 17,164 | | Of which: | | | (c) Public sector companies | 6,786 | | (d) Private companies and others | 10,378 | | F. ECB – Unhedged {D-(E1+E2)} | 78,884 | | G. Share of unhedged non-INR non-FDI ECB {(F)/(A)*100} | 45 | | Source: RBI. |
 1.83 Since mid-October the INR has recovered from the bouts of volatility experienced in the earlier part of the year and has been trading close to its long-term trend (Chart 1.66). 1.84 Notwithstanding the intermittent corrections due to excessive volatility in global financial markets, the INR remains stable relative to peers (Charts 1.67 a and b). 1.85 Measures of volatility, such as the 1-month at-the-money implied volatility of the USD-INR option and Risk reversal31, which rose sharply as the war in Ukraine began, have subsequently declined (Chart 1.68 a and b). 1.86 Forward premia have softened across tenors. The one-year forward premium, which reflects hedging costs for firms, declined from 4.6 per cent at end-December 2021 to 3.0 per cent at end-June 2022 and further to 2.0 per cent as on December 14, 2022 (Chart 1.69). I.2.5 Equity Markets 1.87 Volatile shifts in risk sentiment in response to global spillovers have battered equities in major markets worldwide. During CY:2022 so far (December 14, 2022), the S&P 500 index fell by 16.4 per cent, the DAX 40 index by 9.0 per cent and the MSCI Emerging Market index by 21.0 per cent. In stark contrast, the Nifty 50 index rose by 8.5 per cent on the back of strong domestic fundamentals, strong sales growth by domestic companies, the resumption of portfolio investments from abroad and continued support from domestic institutional investors (Chart 1.70 a and b). 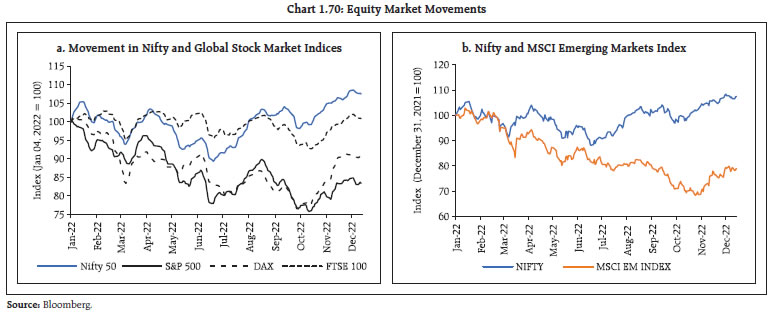 1.88 During April-June 2022, accentuated risk-off sentiments in response to global geopolitical and financial developments had triggered large scale FPI outflows. With the return of renewed appetite for Indian assets, FPIs brought in US $11.6 billion into Indian equities during July-December (up to December 14, 2022) reducing cumulative net outflows during the financial year to US $2.7 billion (Chart 1.71). Volatile FPI flows may have been one of the factors causing wide swings in market conditions, with the volatility index – NSE VIX, moving in a range of 16 to 32 during CY:2022, as against its normal period average of around 15.7 (five-year pre-COVID average between January 2015 to December 2019). 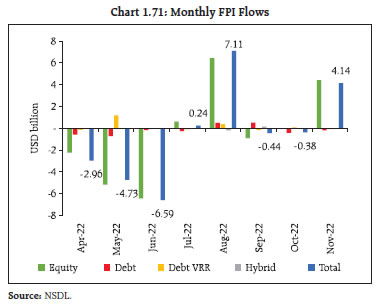 1.89 Inflows from domestic institutional investors (banks, mutual funds, insurance companies and National Pension System) counterbalanced the impact of FPI movements. During 2022-23 (up to November 2022), net domestic institutional investment (DII) inflows (excluding mutual funds) stood at ₹27,578 crore. The positive trend in mutual funds’ net investment in equities continued as they invested ₹1.21 lakh crore in 2022-23 (till November 2022), following on from their net investment of ₹1.90 lakh crore in 2021-22 (Chart 1.72). The offsetting nature of DII makes Indian equity markets relatively less susceptible to large scale and volatile movements driven by FPI flows. 1.90 Taken together, the sum of FPI and net DII (including mutual funds) increased from ₹0.84 lakh crore in 2019-20 to ₹1.23 lakh crore in 2021-22. During 2022-23 (up to November 2022) the combined net investment of FPI and DII stood at ₹1,25,984 crore (Chart 1.73). 1.91 Total net investment by individual investors including clients and Non-Resident Indians (NRIs), declined to ₹13,551 crore during April-November 2022-23 from ₹59,992 crore a year ago (Chart 1.74). 1.92 Total demat accounts (as reported by the depositories NSDL and CDSL)32 went up from 3.95 crore in January 2020 to 10.61 crore in November 2022. There has also been a steady increase in inflows into mutual funds through systemic investment plans (SIPs) (Chart 1.75 a and b). 1.93 While India’s macroeconomic prospects and earnings forecast are stronger than those of the rest of the world, Indian equity market valuations are still high (Chart 1.76). Both the 12-month trailing price-to-earnings (P/E) ratio and market capitalisation to GDP are above their long-term historical averages. The 12-month forward P/E is among the highest relative to both AEs and EMEs. 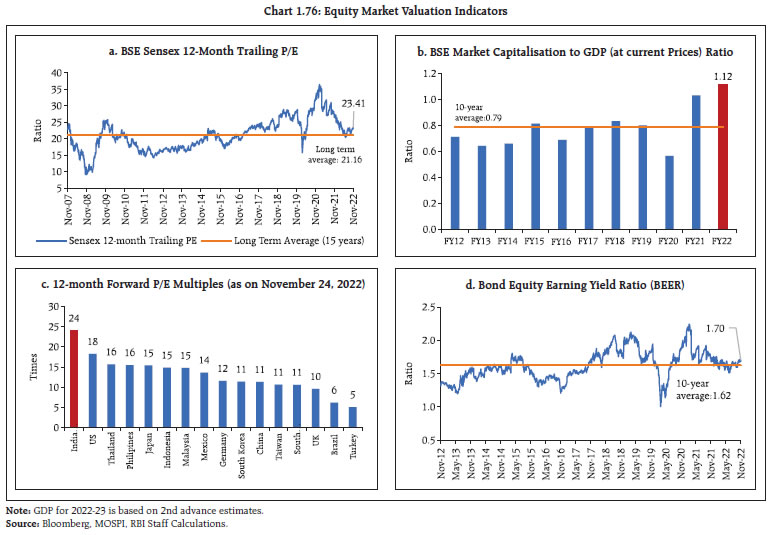
| Table 1.8: Assets under Management of the Domestic Mutual Fund Industry | | ₹ crore | | As on | B30 AUM | T30 AUM | Industry AUM | | Equity | Non-Equity | Total | Equity | Non-Equity | Total | Equity | Non-Equity | Total | | Jun 30, 2022 | 3,62,090 | 2,56,628 | 6,18,718 | 10,33,835 | 19,11,537 | 29,45,372 | 13,95,925 | 21,68,165 | 35,64,090 | | Oct 31, 2022 | 4,29,988 | 2,80,964 | 7,10,952 | 12,04,642 | 20,34,729 | 32,39,371 | 16,34,630 | 23,15,693 | 39,50,323 | | Nov 30, 2022 | 4,40,174 | 2,83,568 | 7,23,742 | 12,29,866 | 20,83,953 | 33,13,819 | 16,70,040 | 23,67,521 | 40,37,561 | Note: T30 refers to the top 30 geographical locations in India and B30 refers to the locations beyond the top 30 cities.
Source: SEBI. | I.2.6 Mutual Funds 1.94 AUM of the domestic mutual fund industry, excluding domestic fund of funds (FoF), went up by 13.3 per cent between June-November 2022 to a high of ₹40.4 trillion. The AUM of cities that are beyond the top 30, i.e., B30 cities33 also witnessed a rise of 19 per cent during the same period, led by increased awareness about mutual funds and ease of transactions through digitisation (Table 1.8). 1.95 There was a 21.1 per cent rise in the AUM of equity-oriented schemes across all categories. Exchange traded funds and index funds also witnessed sizable net inflows. Open-ended debt-oriented schemes barring liquid funds, gilt funds and long duration funds witnessed net outflows (Table 1.9 and Chart 1.77 a and b).
| Table 1.9: Trends in Resource Mobilisation by Mutual Funds | | ₹ crore | | Months | Jun-22 | Jul-22 | Aug-22 | Sep-22 | Oct-22 | Nov-22 | | Debt Oriented Schemes | | Net Inflow/ Outflow of Funds | -96,301 | 5,487 | 50,576 | -66,630 | -2,820 | 7,030 | | Assets under Management | 12,51,614 | 12,64,664 | 13,23,006 | 12,60,182 | 12,63,380 | 12,79,026 | | Equity Oriented Schemes | | Net Inflow/ Outflow of Funds | 15,480 | 8,883 | 5,942 | 14,077 | 9,253 | 2,224 | | Assets under Management | 12,92,390 | 14,22,446 | 14,84,950 | 14,70,743 | 15,29,344 | 15,65,102 | | Total | | Net Inflow/ Outflow of Funds | -69,853 | 23,605 | 65,077 | -41,404 | 14,047 | 13,264 | | Assets under Management | 35,64,090 | 37,74,803 | 39,33,878 | 38,42,351 | 39,50,323 | 40,37,561 | | Source: SEBI. | 1.96 Reflecting risk averse sentiment among investors and their preference for short term liquidity, the share of AUM of overnight mutual funds in the total AUM of open-ended debt schemes has risen from 6.1 per cent in November 2021 to 8.2 per cent in November 2022 (Chart 1.78). 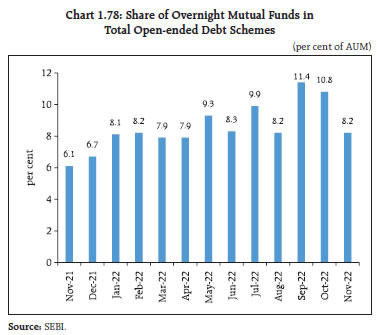 1.97 Open-ended debt funds are susceptible to liquidity shocks and can potentially amplify market stress. To mitigate the risk and to enhance the risk management framework for mutual funds, the Securities and Exchange Board of India (SEBI) has prescribed various norms for asset management companies (AMCs) with respect to holding of liquid assets in open-ended debt schemes and has mandated stress testing of such schemes. Moreover, with a view to ensure fairness in treatment of investors in mutual fund schemes, particularly during market dislocation, the SEBI has introduced a swing pricing framework for open-ended debt-oriented mutual fund schemes, which enables them to change their net asset values in accordance with the activities of redeeming investors, so that they cover trading costs. 1.98 Though the average liquid asset holdings, comprising cash, government securities, treasury bills and repo in government securities by open-ended debt schemes (except overnight funds, liquid funds, gilt funds and gilt funds with 10-year constant duration) went down to 29.8 per cent of AUM of open-ended debt schemes at the end of November 2022 from 34.7 per cent a year ago, they remain significantly higher than the minimum 10 per cent prescribed by the SEBI (Chart 1.79). 1.99 Disaggregated analysis shows that a similar tendency is observed in respect of open-ended debt schemes that invest in debt and money market instruments with Macaulay duration of less than twelve months. Both corporate bond funds that invest primarily in AAA-rated corporate bonds and banking, and PSU funds that predominantly invest in debt instruments of banks, public sector undertakings and public financial institutions experienced an increase in liquid asset holdings (Chart 1.80 a and b). 1.100 Regulatory measures taken by the SEBI since the March 2020 market turmoil have ensured that open-ended debt schemes did not face similar prolonged liquidity stress or volatility in response to extreme events (Chart 1.81 and Chart 1.82 a and b). On the role of open-ended funds in amplifying stress in asset markets as one of the important financial stability risks, appropriate guardrails have been set up to protect these entities from stress and to ensure adequate liquidity.
I.2.7 Alternative Investment Funds 1.101 Funds mobilisation by alternative investment funds (AIFs) has increased consistently over the years in terms of both commitments raised and investments made. The cumulative investments made by Category-I, Category-II and Category-III AIFs34 increased by 8.3 per cent, 10.5 per cent and 7.1 per cent, respectively, in Q1:2022-23 (Chart 1.83). 1.102 AIFs offer relatively higher return to their investors through investments in assets that are less correlated with traditional investments like traded stocks and bonds. They deploy bulk of their funds in unlisted equities and debt instruments, including securitised products (Chart 1.84). 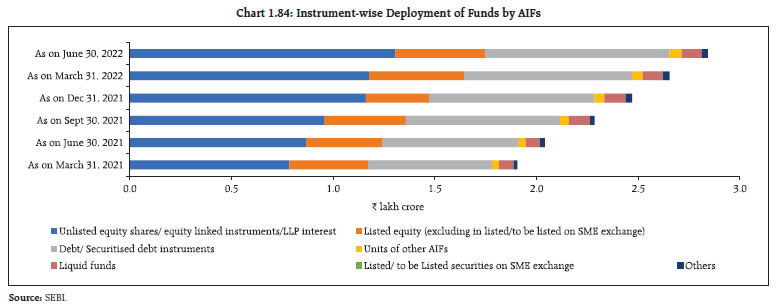 1.103 The AIF ecosystem has been consolidating in the country on the back of increasing investor interest and simultaneous development of a robust regulatory framework. Their activities need close monitoring across venture capital funds, SME funds, real estate funds, private equity funds, funds for distressed assets and hedge funds. Their remuneration policies, extent of financial leverage and risk management practices can potentially pose systemic risks. In this context, the SEBI has recently amended the SEBI (AIF) Regulations, 2012, to ensure that the assets and liabilities of each scheme are segregated and ringfenced from those of other schemes. Furthermore, bank accounts and securities accounts of each scheme are also segregated and ringfenced from those of other schemes. I.2.8 Central Counterparties (CCPs) 1.104 After the global financial crisis of 2007-09, regulators across most jurisdictions formulated regulations to implement robust standards for derivatives regulation. It is also seen that the legislations governing financial market infrastructures (FMIs), like CCPs, enacted in some advanced jurisdictions have incorporated provisions that give them an extra-territorial reach. Such regulations, if implemented by all jurisdictions, can create a parallel maze of laws with overlapping requirements or restrictions and show a lack of trust in the capabilities and quality of oversight exercised by the host regulators. Such unilateral actions can lead to disruption in local markets and undermine domestic financial stability. 1.105 Moreover, such actions will hamper the ability of banks and custodians to participate in forex, government securities, equities, debt and derivative markets where local mandates of compulsory central clearing will be militated, leading to disruption in markets and adverse impact on business interests of these entities. Potential inefficiencies get introduced in the system with a possible domino effect when liquidity gets ‘trapped’ on the back of gross settlement of large positions. With the withdrawal of CCP recognition, once a large bank moves from a direct participant to an indirect one, it also introduces an element of systemic risk as the concerned large bank operates without access to central bank funding windows. Disruptions can lead to instability in market conduct, as also impact the clearing members by way of higher capital requirements, increased margin requirements, enhanced credit risk and lack of multilateral netting benefit. This will result in reinventing the wheel as consensus was built in developing Principles for Financial Market Infrastructures (PFMIs), which are standards accrued out of painstaking efforts and brought out by the global standard setting bodies. 1.106 To prevent the possible implications and resolve the logjam, there has been continuous engagement and positive dialogue between the relevant stakeholders {including the European Securities and Markets Authority (ESMA) and the European Commission}. The discussions still continue, so as to arrive at a mutually acceptable arrangement, which duly recognises the territorial independence of the host regulator. In the undesirable event of a possible market disruption, however, remedial measures by way of possible alternate arrangements are under deliberation with the entities likely to be impacted. I.2.9 Banking Stability Indicator 1.107 The state of the banking system is reflected in the banking stability indicator (BSI)35. During H1:2022-23, an increase in profitability driven by rising net interest margin and an upgrade in asset quality and efficiency ratios contributed to improvement in the BSI. Although there was some weakening in soundness as measured by capital ratios and liquidity risk in terms of the liquidity coverage ratio (LCR), the banking system has sufficient capital and liquidity buffers relative to the regulatory minimum (Chart 1.85 and 1.86).
I.2.10 Banking System 1.108 After remaining in single digits for three years, bank credit growth (y-o-y) by scheduled commercial banks (SCBs) reached a high of 17.5 per cent in September 2022, a rate last recorded in December 2011. Retail credit has been recording relatively high growth in recent years but wholesale credit36 has turned a corner with a growth (y-o-y) of 17.7 per cent (Chart 1.87). Notably, loan books of public sector banks (PSBs) grew at their fastest pace since September 2013. Lending by private sector banks (PVBs), on the other hand, continued to outpace that of PSB counterparts (Chart 1.88 a and b).
| Table 1.10: Growth in Wholesale Credit | | (y-o-y; per cent) | | | PSU | Non-PSU | | Mar-21 | Sep-21 | Mar-22 | Sep-22 | Mar-21 | Sep-21 | Mar-22 | Sep-22 | | PSB | 5.4 | 11.9 | 15.1 | 22.6 | -9.0 | -9.1 | 0.0 | 9.7 | | PVB | 60.0 | 20.1 | 9.0 | 20.2 | -6.1 | -1.2 | 13.5 | 20.6 | | PSB+PVB | 11.7 | 13.1 | 14.1 | 22.2 | -7.7 | -6.0 | 5.4 | 14.2 | | Source: RBI supervisory returns and staff calculations. | 1.109 A granular analysis of bank credit to companies37, which accounts for 86 per cent of total funded amounts extended to wholesale borrowers38, indicates that government owned companies (PSUs) remained at the vanguard of credit growth during the COVID-19 period. In more recent years, the pace of lending to private (non-PSU) companies has picked up (Table 1.10). The rise was also accompanied by a shift in funding away from market borrowings (9.1 per cent; y-o-y) (Table 1.11). 1.110 Size-wise disaggregation of wholesale credit to private non-financial companies indicates robust growth in loans up to ₹5,000 crore, especially for the ₹1,000-5,000 crore bucket. Growth in larger sized loans (>₹ 5000 crore bucket), however, remained tepid (Chart 1.89). Long-term ratings also show an improving profile (Chart 1.90).
| Table 1.11: Aggregate Mobilisation of Funds | | ₹ lakh crore | | Outstanding Amount (Quarter-End) | Mar-20 | Sep-20 | Mar-21 | Sep-21 | Mar-22 | Sep-22 | | Commercial Paper (CP) | 345 | 362 | 364 | 371 | 352 | 401 | | Corporate Bonds | 3254 | 3406 | 3613 | 3701 | 4017 | 4030 | | ECB | 1242 | 1210 | 1238 | 1285 | 1350 | 1414 | | Wholesale Borrowings | 5582 | 5410 | 5507 | 5492 | 6079 | 6747 | | Total | 10423 | 10388 | 10722 | 10849 | 11798 | 12592 | | Source: RBI, SEBI and NSDL. | 1.111 The incremental credit-deposit (CD) ratio rose sharply both on annual (122.0 per cent, y-o-y) and half-yearly basis (172.5 per cent; September 2022 over March 2022) (Chart 1.91 a and b). The current high credit growth, however, is on a low base of the previous couple of years. Moreover, accumulation of deposits in the past few years has enabled banks to fund the growing credit demand. 1.112 Banks have also been drawing down their high-quality-liquid assets (HQLAs) to fund credit growth. This brought down the overall LCR from a high of 173.0 per cent in September 2020 to 135.6 per cent, which remains comfortably above the regulatory prescription of 100 per cent. The LCR of PVBs has fallen more than that of PSBs and foreign banks (FBs) (Chart 1.92 a and b). 1.113 A study of household financial savings indicates that there has been some diversification away from bank deposits to small savings, provident funds and other investment avenues during 2021-22 in search of returns (Chart 1.93 a and b). 1.114 Consequently, banks have been sourcing funds from other legal entity customers (e.g., MFs, insurance companies), non-financial corporates and public-sector undertakings, which have higher run-off factors than for retail deposits (Chart 1.94 and 1.95). This may impede banks flexibility to create lendable resources out of certain types of liabilities as they necessitate maintaining higher levels of HQLAs.
1.115 Level-1 assets, which essentially consist of government securities, dominate HQLAs, whereas retails deposits with run-off factors ranging from 5-10 per cent account for the major share of net outflows (Chart 1.96 a and b). 1.116 Asset quality of the banking system continued to improve: the gross non-performing asset (GNPA) ratio declined sequentially for wholesale advances and for retail loans (Chart 1.97 a). In line with the acceleration in credit growth, risk-weighted assets (RWAs) have grown, which indicates improvement in banks’ risk appetite on better economic prospects (Chart 1.97 b). 1.117 The GNPA ratio stood at 5.0 per cent in September 2022, down from 5.7 per cent a quarter ago. Reduction in slippages or fresh accretions to NPAs was a major contributor to the reduction in overall NPAs (Chart 1.98 a, b and c). The declining tendency in the GNPA ratio is likely to continue - under the baseline scenario of the stress testing framework, it is projected to fall further to 4.9 per cent in September 2023. 1.118 With the rise in risk-weighted assets, capital levels have reduced: both CRAR and CET1 ratios have declined, though they remain well above regulatory requirements (Chart 1.99 a and b). I.2.11 Non-Banking Financial Companies (NBFCs) 1.119 NBFCs sector has recovered strongly in the wake of the second wave of COVID-19, with asset quality showing a continuous improvement. The GNPA ratio of the sector (excluding core investment companies) fell from 6.9 per cent in June 2021 to 5.1 per cent in September 2022. Special mention accounts (SMAs), however, increased from 8.5 per cent of total advances in December 2021 to 10.8 per cent in September 2022. Pockets of stress are observed in select NBFC cohorts, viz., NBFC-Investment and Credit Companies (GNPA ratio of 6.9 per cent) and NBFC-Factor (GNPA ratio of 6.8 per cent) (Table 1.12). The revised clarification with respect to asset classification, which came into effect from October 1, 2022, mandates that all NBFCs are required to collect the entire arrears to upgrade an NPA. Asset classification would start exactly from the overdue date, unlike the present practice of starting 90 days from the end of the month in which the account becomes overdue. These regulatory refinements could impact the sector’s assessment of asset quality in the near term. | Table 1.12: Asset Quality Ratios across NBFC Categories | | (per cent) | | | GNPA | SMA-0 | SMA-1 | SMA-2 | | GNPA | SMA-0 | SMA-1 | SMA-2 | | NBFC – Micro Finance Company (2.6%) | Mar-21 | 5.4 | 2.3 | 1.7 | 1.0 | NBFC – Infrastructure Finance Company (42.4%) | Mar-21 | 3.9 | 5.2 | 1.9 | 2.4 | | Jun-21 | 6.1 | 8.8 | 4.4 | 2.4 | Jun-21 | 3.8 | 3.0 | 0.1 | 6.9 | | Sep-21 | 5.9 | 4.4 | 2.2 | 1.4 | Sep-21 | 3.8 | 1.9 | 0.0 | 10.9 | | Dec-21 | 5.7 | 2.4 | 2.1 | 1.4 | Dec-21 | 4.0 | 0.2 | 0.0 | 3.3 | | Mar-22 | 5.5 | 1.5 | 1.2 | 1.1 | Mar-22 | 3.4 | 2.5 | 2.2 | 2.1 | | Jun-22 | 4.8 | 1.7 | 1.4 | 1.4 | Jun-22 | 3.4 | 6.9 | 1.1 | 5.4 | | Sep-22 | 4.7 | 1.4 | 1.6 | 1.8 | Sep-22 | 3.1 | 2.8 | 0.1 | 8.4 | | NBFC - Factor (0.1%) | Mar-21 | 25.0 | 13.7 | 1.7 | 1.7 | NBFC – Infrastructure Debt Fund (1.1 %) | Mar-21 | 0.4 | 0.0 | 0.1 | 1.7 | | Jun-21 | 29.2 | 14.2 | 2.2 | 2.7 | Jun-21 | 0.4 | 0.0 | 0.0 | 0.6 | | Sep-21 | 26.0 | 13.8 | 1.5 | 1.1 | Sep-21 | 0.4 | 0.0 | 0.0 | 0.6 | | Dec-21 | 27.1 | 13.6 | 2.3 | 0.0 | Dec-21 | 0.8 | 0.6 | 0.1 | 0.0 | | Mar-22 | 22.0 | 11.7 | 1.3 | 0.0 | Mar-22 | 0.3 | 0.0 | 0.1 | 0.4 | | Jun-22 | 9.5 | 13.3 | 3.6 | 0.5 | Jun-22 | 0.4 | 0.0 | 0.0 | 0.1 | | Sep-22 | 6.8 | 10.7 | 2.1 | 0.9 | Sep-22 | 0.4 | 0.0 | 0.1 | 0.0 | | NBFC – Investment and Credit Company (53.7 %) | Mar-21 | 8.0 | 7.5 | 3.2 | 3.1 | Total | Mar-21 | 6.1 | 6.3 | 2.6 | 2.7 | | Jun-21 | 9.6 | 8.2 | 4.5 | 3.9 | Jun-21 | 6.9 | 5.8 | 2.5 | 5.1 | | Sep-21 | 9.0 | 7.2 | 3.9 | 3.3 | Sep-21 | 6.5 | 4.7 | 2.1 | 6.5 | | Dec-21 | 9.0 | 6.6 | 3.5 | 2.9 | Dec-21 | 6.6 | 3.6 | 1.9 | 3.0 | | Mar-22 | 7.7 | 5.8 | 3.3 | 2.2 | Mar-22 | 5.7 | 4.2 | 2.7 | 2.1 | | Jun-22 | 7.1 | 6.3 | 3.0 | 2.2 | Jun-22 | 5.4 | 6.4 | 2.1 | 3.5 | | Sep-22 | 6.9 | 5.9 | 2.8 | 2.2 | Sep-22 | 5.1 | 4.4 | 1.6 | 4.8 | Note: 1. Number in parenthesis indicates percentage share of each category of NBFC to total advances of NBFCs as on September 30, 2022.
2. Based on data for NBFC-D, NBFC-ND-SI and NBFC-ND (excluding Core Investment Companies) as of November 28, 2022 which are provisional.
Source: RBI Supervisory Returns. | I.2.12 Credit flows to the MSME Sector 1.120 The micro, small and medium enterprise (MSME) sector, which was buffeted by the pandemic, turned around in H2:2021-22 and sustained this momentum in H1:2022-23. Lending by PVBs grew strongly, whereas PSBs recorded a relatively moderate growth (Chart 1.100). Sustained credit growth to this sector could be attributed to credit extended under the Emergency Credit Line Guarantee Scheme (ECLGS), broad-based recovery in domestic demand, higher working capital requirements and regulatory modifications in the definition of MSMEs39. 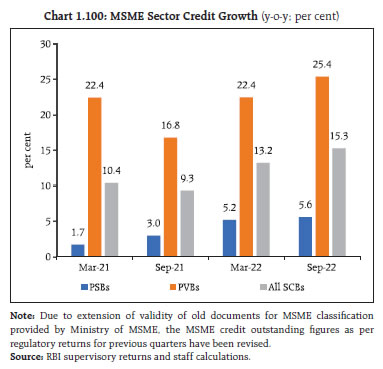
1.121 The overall GNPA ratio (PSBs and PVBs) in the MSME sector fell from 9.3 per cent in March 2022 to 7.7 per cent in September 2022. Asset quality of advances below ₹25 crore, which are usually vulnerable to asset quality concerns, improved in September 2022 vis-à-vis March 2022. Regulatory forbearance and restructuring schemes introduced since 2018 came to an end. As on September 30, 2022, the share of restructured loans in the MSME portfolio of SCBs stood at 5.21 per cent compared to 5.31 per cent as on March 31, 202240 (Table 1.13). | Table 1.13: MSME Restructuring Schemes41 | | Bank Group | Outstanding Balance in Restructured Account (₹ crore) as on | | March 31, 2022 | September 30, 2022 | | PSBs | 77,338 | 78,117 | | PVBs | 28,767 | 29,068 | | FBs | 624 | 675 | | All SCBs | 1,06,728 | 1,07,859 | | Percentage share in MSME Portfolio | 5.31 | 5.21 | Note: Data as reported by PSBs, PVBs and four major foreign banks
Source: RBI supervisory returns and staff calculations. | 1.122 The ECLGS was pivotal in providing support and additional liquidity for business entities to tide over COVID-19. Under the ECLGS, an amount of ₹2.82 lakh crore has been disbursed till September 30, 2022, of which SCBs have disbursed ₹2.46 lakh crore, with predominant share of disbursals under the ECLGS 1.0 (Chart 1.101). The major sectors availing the ECLGS were services and traders, which were among the most impacted by the pandemic (Chart 1.102).
1.123 PVBs utilised the ECLGS more than PSBs, with the amount disbursed to repeat borrowers of PVBs almost double that of PSBs (Chart 1.103 a and b, Table 1.14). 1.124 Disaggregated analysis of borrowers availing the ECLGS indicates that majority of the smaller borrowers belonged to the micro enterprises category (Chart 1.104 a). On the other hand, in terms of quantum of disbursal, about a third was availed by businesses other than micro, small and medium enterprises, indicating the broad nature of stress related to the pandemic (Chart 1.104 b).
| Table 1.14: Average Ticket Size of ECLGS Borrowers | | Category of Lending Institution | Borrower Type | Average Ticket Size
(in ₹ lakh) | | PSB | Fresh Borrowers | 3.6 | | Repeat Borrowers | 18.2 | | PVB | Fresh Borrowers | 1.5 | | Repeat Borrowers | 47.5 | | FB | Fresh Borrowers | 57.4 | | Repeat Borrowers | 80.3 | | NBFC | Fresh Borrowers | 1.9 | | Repeat Borrowers | 8.7 | | Source: NCGTC. | 1.125 A similar picture emerges when disbursements are bucketed as per loan size (Chart 1.105 a and b). 1.126 The September 2022 position of the ECLGS lending indicates that distress continues in the MSME sector, with one-sixth of accounts that availed funds under the ECLGS turning NPA (Chart 1.106). 1.127 Even though the micro enterprises segment availed a quarter of loans disbursed under the ECLGS, their share in overall NPAs stood much higher (Chart 1.107 a and b). 1.128 Sector-wise analysis of NPAs indicate that services and trade, which formed one-third of the ECLGS disbursements, remain stressed with little more than half of the total delinquency under the ECLGS (Chart 1.108). I.2.13 Microfinance Segment 1.129 Credit to the microfinance sector is growing at a steady pace, with all types of lenders recording stable loan growth. NBFCs, which were permitted to extend microfinance loans up to 25 per cent of their assets from their earlier limit of 10 per cent under the revised regulations42, saw robust growth, with their share in new loans more than doubling on a y-o-y basis. (Chart 1.109 a, b and c). 1.130 Overall delinquency in the microfinance segment, measured in terms of 90+ days past due (dpd) increased, led by banks. For other types of lenders, impairment has either moderated or declined. Similarly, credit at risk of slippage, measured by 30+dpd, fell for all categories of lenders (Chart 1.110 a and b). I.2.14 Consumer Credit 1.131 Consumer credit, which has been the major driver of bank credit in recent years is showing signs of moderation based on inquiry volumes43, with the volume of inquiries for all categories of loans falling in October 2022 although they remain above pre-pandemic levels (Chart 1.111). 1.132 FinTech platforms, which have experienced robust inquiry volumes since the second wave of the pandemic, also saw growth stabilising (Chart 1.112). 1.133 Inquiry volumes by risk tier show that loan demand from prime and below prime consumers has increased at a faster pace than that from higher-rated consumers (Chart 1.113). 1.134 The quality of incremental credit has improved, with the share of lower rated borrowers44 declining at the overall industry level. Alongside, PSBs’ origination profile has also improved (Chart 1.114 a, b and c). 1.135 Impairment in consumer credit, measured in terms of the proportion of the portfolio at 90 days past due or beyond, has also shown improvement, with delinquency levels across lenders stabilising at lower levels (Table 1.15). The increase in policy rates and impact of pass through on overall asset quality, however, requires closer monitoring, specifically for mortgages. I.2.15 Housing Market 1.136 As central banks around the globe aggressively tighten monetary policy, rising mortgage rates and tighter lending standards could weigh on house prices in 2023. Housing prices have already started decelerating in major advanced and emerging economies (Chart 1.115).
| Table 1.15: Delinquency Levels in Aggregate Consumer Credit across all Product Categories | | (per cent) | | | PSB | PVB | NBFC / HFC | FinTech | | Sep-21 | 4.8 | 2.4 | 3.6 | 4.6 | | Oct-21 | 5.1 | 2.1 | 3.9 | 4.1 | | Nov-21 | 5.0 | 2.0 | 3.4 | 4.0 | | Dec-21 | 4.8 | 2.1 | 3.2 | 3.2 | | Jan-22 | 4.9 | 2.3 | 3.2 | 3.1 | | Feb-22 | 4.7 | 2.0 | 3.0 | 2.6 | | Mar-22 | 4.5 | 1.7 | 2.3 | 2.2 | | Apr-22 | 4.6 | 1.4 | 2.6 | 2.2 | | May-22 | 4.6 | 1.5 | 2.5 | 2.1 | | Jun-22 | 4.5 | 1.6 | 2.2 | 2.0 | | Jul-22 | 4.5 | 1.9 | 2.1 | 2.0 | | Aug-22 | 4.4 | 1.7 | 2.1 | 2.0 | | Sep-22 | 4.3 | 1.5 | 1.8 | 2.0 | Note: based on 90 days past due balances.
Source: TransUnion CIBIL. | 1.137 The all-India house price index (HPI) increased by 4.5 per cent (y-o-y) in Q2:2022-23 from 3.5 per cent (y-o-y) in the previous quarter. On a sequential basis, house prices recorded marginal increase of 0.4 per cent. 1.138 A recovery in housing prices was reflected in an upturn in housing market activity in H1:2022-23 in the form of a preference for investment in real estate and residential units. As a result, housing sales have increased, and new launches have further expanded, reflecting stable housing demand for both investment and end-uses (Chart 1.116 a). Overall, the decline in unsold inventory and strong sales momentum resulted in lowering of inventory overhang although it varies across house sizes (Chart 1.116 b). I.2.16 Financial System Stress Indicator 1.139 The FSR regularly publishes a banking stability map to assess the stability of the banking sector. In order to expand the coverage to other segments of the financial sector, an attempt has been made to compile a single comprehensive indicator called the financial system stress indicator (FSSI) to monitor the aggregate stress level in the Indian financial system. FSSI aims to (a) help identifying periods of stress; (b) assess the intensity and duration of stress in the financial system; and (c) gauge the ability of financial markets and intermediaries to withstand shocks and imbalances (Box 1.1). Box 1.1: Financial System Stress Indicator The Financial System Stress Indicator (FSSI) features risk factors pertaining to five financial market segments - equity, foreign exchange, money, government debt and corporate debt markets and three groups of financial intermediary segments - banks, NBFCs and AMC-MFs (Chatterjee et. al, 2017, Hollo et. al, 2012 and Louzis et. al, 2012). It also features a real sector component encompassing select real sector variables that have a bearing on financial stability due to their strong interlinkages with financial sector. In all, 39 risk factors spread across nine markets/sectors are considered (Table 1). Risk factors are normalised by the min-max method45 by converting into variables which are unit-free, measured on an ordinal scale between zero and unity. The transformed risk factors for each market/sector are aggregated using equal weights into a sub-indicator ‘yi‘ representing the ith market/sector. The composite FSSI is computed by aggregating the sub-indicators again based on the equal-variance weighted average method, where the weight ‘wi‘ of each sub-indicator ‘yi‘ is inversely proportional to its sample standard deviation ‘si‘, and is determined as, The composite FSSI is obtained as, Higher value of FSSI would indicate more stress. Empirical estimates indicate that FSSI has tracked major stress events which impacted the Indian financial system in the past. The intensity of financial stress was the highest during the taper tantrum in 2013, followed by the global financial crisis period. In more recent times, heightened stress can be observed during the collapse of M/s Infrastructure Leasing and Financial Services (ILFS) Ltd in 2018 as well as during the first wave of the COVID-19 pandemic in 2020 (Chart 1). The onset of the Russia-Ukraine war triggered a spurt in systemic financial stress, although at a level milder than that witnessed during the first wave of the pandemic. Financial institutions such as banks and NBFCs as well as AMC-MFs remain resilient. | Table 1: Risk factors constituting each component of FSSI | | Equity Market | 1. Difference between NIFTY 50 monthly returns and its maximum over a two-year rolling window
2. NIFTY 50 Market capitalisation-to-GDP ratio
3. NSE-VIX Index
4. Net Equity FPI flows | | Government Debt Market | 5. Realised volatility in 10-year G-sec yield
6. Term Spread: Spread between 10-year G-sec yield and 3-month T-Bill rate
7. Increase in the 10-year G-sec yield compared to the minimum over a two-year rolling window
8. Net Debt FPI flows | | Forex Market | 9. Difference between rupee dollar exchange rate and its maximum over a two-year rolling window.
10. M-o-M appreciation/depreciation of rupee dollar exchange rate
11. GARCH (1,1) volatility of rupee dollar exchange rate
12. Difference between 3-month forward premia and its historical maximum. | | Money/ Short Term Market | 13. Spread between weighted average call rate and weighted average market repo rate
14. Spread between 3-month CD rate and 3-month T-Bill rate
15. Spread between 3-month non-NBFC CP rate and 3-month T-Bill rate
16. Realised volatility of 3-month CP rate
17. Spread between 3-month OIS rate and 3-month T-Bill rate | | Corporate Bond Market | 18. Yield spread between 3-year AAA corporate bonds and 3-year G-sec
19. Difference between 3-year BBB and 3-year AAA corporate bond yield
20. Difference between 3-year BBB corporate bond yield and its maximum | | Banking Sector | SCBs | 21. CRAR (SCBs)
22. RoA (SCBs)
23. LCR (SCBs)
24. Cost-to-Income (SCBs)
25. Stressed Assets Ratio (SCBs)
26. Banking Beta: cov(r,m)/var(m), over 2-year moving window.
r= Bank NIFTY y-o-y, m= NIFTY 50 y-o-y | | UCBs | 27. GNPA ratio (UCBs)
28. CRAR (UCBs)
29. RoA (UCBs) | | NBFC Sector | 30. GNPA ratio
31. CRAR
32. RoA
33. Spread between 3-month NBFC CP rate and 3-month T-Bill rate | | AMC-MF Sector | 34. Mutual fund redemptions: (y-o-y)
35. Mutual fund net inflows | | Real Sector | 36. GDP growth
37. CPI inflation
38. Current account balance as a share of GDP
39. Gross fiscal deficit as a share of GDP |
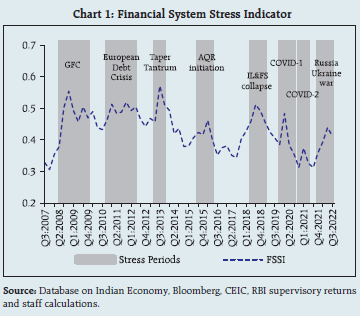 In the government and corporate bond markets; stress increased during September 2022. Stress in the forex market was arrested but stress in the real sector became accentuated. Stress in equity market remained subdued and in the money market, stress was mild (Chart 2). References: 1. Chatterjee, S., Chiu, C. W. J., Hacioglu Hoke, S., and Duprey, T. (2017). A financial stress index for the United Kingdom. Working Paper No. 697, Bank of England. 2. Hollo, D., Kremer, M., and Lo Duca, M. (2012). CISS - A composite indicator of systemic stress in the financial system. 3. Louzis, D. P., and Vouldis, A. T. (2012). A methodology for constructing a financial systemic stress index: An application to Greece. Economic Modelling, 29(4), 1228-1241. | I.2.17 Systemic Risk Survey46 1.140 In the latest round of the Systemic Risk Survey, risks from global spillovers and financial market volatility rose further and remained in the ‘high’ risk category. Respondents cited monetary policy tightening in advanced economies, geopolitical risks, global growth uncertainty and funding risk as the major drivers of global risks. The rise in financial market risk was due to tightening of financial conditions. Institutional risks and general risks remained in the ‘medium’ risk category, though respondents mentioned risks from crypto assets and climate change are on the rise. Macroeconomic uncertainty moderated and remained in the ‘medium’ risk category. A decline in risk perception about domestic inflation, capital outflows, fiscal deficit and sovereign credit rating resulted in moderation in overall macroeconomic risks. Despite global headwinds posing risks to domestic macro-financial conditions, the impact of external sector developments remained moderate as more than half of the respondents perceived it to have medium impact. Almost all surveyed respondents expect medium to very high probability of a global recession in 2023. 1.141 According to more than half of the respondents, the stability of the Indian banking sector remains intact and prospects over a one-year horizon have improved. Around three-fourth of the respondents expect either marginal improvement in banking sector asset quality over the next six months or it to remain unchanged. Nearly two-thirds of respondents perceive improvement in credit prospects over the next six months on the back of recovery in economic activity, rising demand for credit by corporates, an upturn in the investment cycle, strengthening of business sentiments, increased demand for working capital loans, higher public investment in the infrastructure sector and export promoting production linked incentive (PLI) scheme by the Government. 1.142 Over the years, the Systemic Risk Survey (SRS) respondents’ qualitative views on systemic risks have worked well as proxies to gauge risk perceptions about the macrofinancial system (Box 1.2). Box 1.2: Systemic risk surveys and Macrofinancial Trends The Reserve Bank’s bi-annual systemic risk survey (SRS) captures the qualitative perceptions of market participants and other stakeholders on key sources of systemic risk to the Indian financial system emanating from both global and domestic macro-financial developments. 22 rounds of SRS have been conducted since it was first introduced during October-November 2011. The SRS respondents’ qualitative views on systemic risks are proxies for sentiments (or risk perceptions) in the macro-financial system and, by aggregating their responses in various SRS rounds, this exercise juxtaposes systemic risk indicators against relevant macro-financial indicators to gauge their economic significance. The long-term movements in the SRS responses underscore the role of global shocks in firming up respondents’ perceptions of systemic risks in India. Global risks, macroeconomic risks and financial market risks have strong correlation and concordance, especially since 2016 (Chart 1). At the disaggregated level, global and macroeconomic risks contributed around half of aggregate systemic risks. The rising influence of global factors on domestic financial market conditions is reflected in increasing synchrony in the movements between financial market risks and global risk (correlation coefficient of 0.65). Based on a concordance index47 of direction (Harding and Pagan, 2002), aggregate systemic risk is found to have strong concordance with macroeconomic risks (0.81), followed by global risks (0.76) and financial market risks (0.67). Aggregate systemic risk, which is an average of five risk groups, exhibited a positive correlation (0.53) with other risk indicators, such as, India VIX and to a lesser extent, with the volatility index of the Chicago Board Options Exchange (CBOE), reflecting its value as an alternative indicator for capturing financial market uncertainty (Chart 2a). Macroeconomic risks are found to be negatively correlated (-0.37) with GDP growth (Chart 2b). 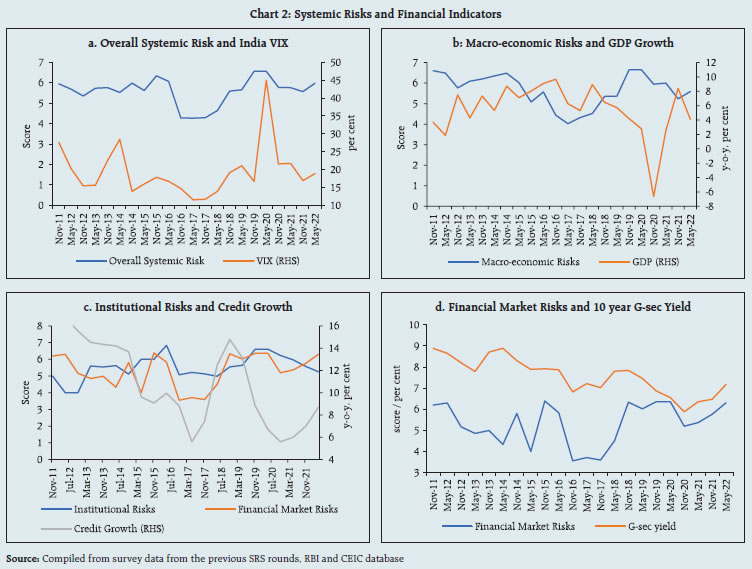 Bank credit growth is negatively correlated (-0.55) with institutional risks, with the concordance index of 0.48. Bank credit growth has a weak positive correlation and high concordance (0.81) with financial market risks, which may be attributable to the substitution effect between bank lending and debt instruments during stressed financial market conditions (Chart 2c). Although the correlation between G-sec yields and financial market risk perceptions is weak (0.06), concordance in direction between the two is found to be high as they move together 81 per cent of the time in response to common influence such as inflation, and global and domestic liquidity conditions (Chart 2d). Banking sector steadiness is assessed through the Z-score48: a higher value implies a lower probability of default/insolvency and vice versa. The Z-score is found to be negatively correlated (-0.28) with institutional risk perception, with the concordance index at 0.43 (Chart 3). In sum, SRS respondents’ feedback indicates that global systemic shocks remain the major drivers of systemic risks in India. Global risks, macroeconomic risks and financial market risks record strong co-movements. References 1. Harding, Don, and Adrian Pagan (2002), “A Comparison of two Business Cycle Dating Methods,” Journal of Economic Dynamics and Control: 27, 1681-690. 2. Reserve Bank of India: Financial Stability Report (various issues). | Summary and Outlook 1.143 Risks are tilted to the downside for the global economy, with financial stability implications. EMEs face even greater risks as they confront rising borrowing costs, debt distress, elevated levels of inflation, volatile commodity prices, currency depreciation and capital outflows. Preserving macroeconomic stability in this challenging environment will require safeguarding the domestic economy and the financial system through actions that mitigate build-up of vulnerabilities and help smooth financial market adjustments. 1.144 Despite this challenging global environment and ensuing headwinds, the Indian economy and the domestic financial system remain resilient. The banking system is stable on the back of improving profitability and asset quality, with adequate levels of capital and liquidity buffers. Prudential regulations and improving domestic economic prospects have shored up the financials of the non-banking sector. Domestic financial markets remain choppy due to heightened uncertainty and volatility in global markets. Preserving macroeconomic and financial stability in the current environment assumes importance to support the recovery, ensure financial stability and bolster India’s long-term potential.
|