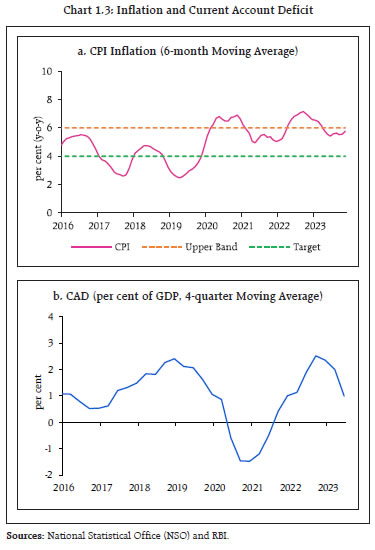
Global macrofinancial conditions remain exposed to risks from slowing growth prospects, increasing geopolitical hostilities and high debt levels and tighter financial conditions. Despite a gloomy global environment, the Indian economy has strengthened on the back of strong fundamentals and a stable financial system, with sound balance sheets of financial institutions supporting the funding needs of the growing economy. Introduction 1.1 Since the June 2023 issue of the Financial Stability Report (FSR), global economy has been in high flux as market expectations shifted from possible recession to ‘higher for longer’ interest rate to soft landing, amidst heightened geopolitical tensions and volatility in commodity prices. Economic activity is taking divergent paths and has turned uneven across regions. The moderation in inflation from its mid-2022 peak has been interrupted by successive shocks, with core inflation staying elevated across economies. More recently, market expectations have shifted towards an imminent turn in the monetary policy tightening and hawkish pauses are increasingly being expected to give way to rate cuts. Nonetheless, elevated levels of stock of both public and private sector debt and rising servicing costs pose debt sustainability and fiscal risks, and global banks face potential valuation losses in their bond portfolios. Overall, global financial stability risks remain elevated as market participants recalibrate their outlook based on incoming data, with sharp realignment in expectations and resultant repricing of financial assets.  1.2 The International Monetary Fund (IMF) has projected1 that global growth would decline to 3.0 per cent in 2023 and 2.9 per cent in 2024, below the pre-pandemic (2000–19) average of 3.8 per cent (Chart 1.1). This moderation in growth momentum is expected to be accompanied by a sharp deceleration in world trade growth, which is projected to fall from 5.1 per cent in 2022 to 0.9 per cent in 2023. Although it is projected to recover to 3.5 per cent in 2024, it would still be below its average growth of 4.9 per cent during 2000-19. 1.3 Inflation trajectories have also turned divergent across economies dispelling the synchronicity in monetary policy among central banks (Chart 1.2). 1.4 The effects of relatively tighter financial conditions are increasingly being felt in rising debt servicing costs and falling savings of households and small businesses. In some AEs, banks have large exposure to commercial real estate (CRE), which is showing signs of impairment in view of higher interest cost co-existent with falling prices, especially for office space. Tight monetary conditions have also affected the profitability of (a) non-bank financial intermediaries (NBFIs) that use leverage to profit from arbitrage opportunities and (b) funds that offer daily liquidity. 1.5 Despite facing successive shocks and large global spillovers, India remains one of the fastest growing major economies in the world, underpinned by sound macroeconomic fundamentals and buffers. The growth momentum remains strong on the back of robust domestic consumption, high public capital expenditure, a recent upturn in private investment and strong exports of services. Real GDP increased by 7.7 per cent in H1:2023-24 and remains on track to expand by 7.0 per cent in FY:2023-24. High frequency indicators support this forecast: despite some recent moderation, purchasing managers’ indices (PMIs) for both manufacturing and services sectors remain in expansion terrain and prospects for future activity remain bright. Equity markets are rallying supported by improved valuations and have generally outperformed those in other major peers. Balance sheets of non-financial private corporate entities remain healthy with strong profit margins, as savings on input costs compensated for subdued sales. Global headwinds pose the main risks to the outlook for the Indian economy, although macroeconomic stability is anchored by moderating inflation, ongoing fiscal consolidation and a modest current account deficit (CAD). Headline inflation, which rose to 7.4 per cent in July 2023 declined to 5.6 per cent by November 2023, easing into the Reserve Bank’s tolerance band (Chart 1.3 a). Core inflation moderated to a 44-month low of 4.1 per cent. The CAD has averaged 1.0 per cent of GDP over the first half of 2023-24 and is expected to remain viable and fully financed (Chart 1.3 b). 
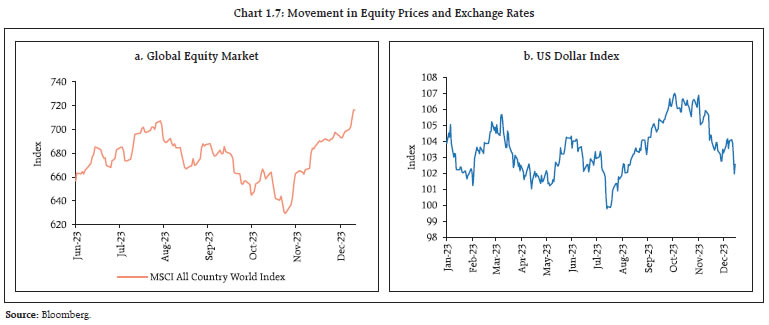
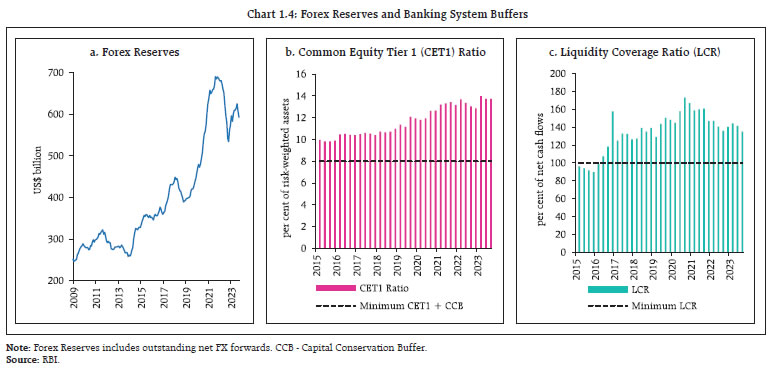 1.6 Buffers in the form of foreign exchange reserves, and capital and liquidity in the banking system provide self-insurance against global spillovers (Chart 1.4 a, b and c). 1.7 The resilience of the domestic financial system has been underpinned by robust balance sheets characterised by adequate capital and liquidity buffers and strong earnings (Chart 1.5). 1.8 Healthy balance sheets have enabled banks to maintain a strong and broad-based credit expansion. Non-bank financial companies (NBFCs) have also partaken in extending credit to support economic activity. The strength of the financial system augurs well for maintaining financial stability and strong and sustainable growth. I.1 Global Backdrop I.1.1. Macrofinancial Development and Outlook 1.9 At the close of 2023, the global economy is negotiating formidable headwinds from (a) geopolitical conflicts in the world’s biggest grain and oil supplying regions; (b) geo-economic fragmentation; (c) relatively tighter financial conditions; (d) large fiscal imbalances and elevated public debt and (e) heightened uncertainty on the evolving economic outlook. Consequently, volatility has risen in certain segments of financial markets (Chart 1.6 a and b). 1.10 The future trajectory of monetary policy remains contingent upon the trials of the last mile to be traversed in aligning inflation with targets. Markets nervously gyrate on release of every incoming data as exemplified in movements in equity prices and exchange rates (Chart 1.7 a and b). 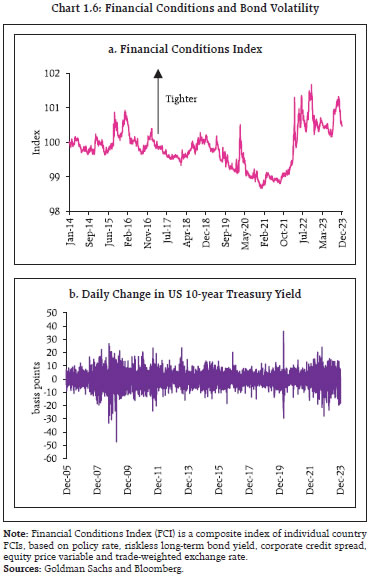
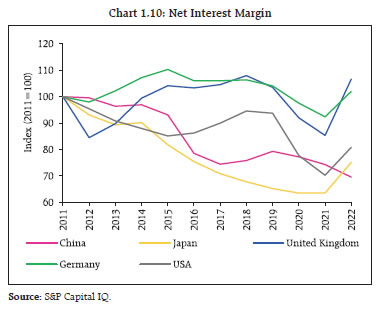
 1.11 Financial stability challenges have become accentuated in light of these developments. While swift and effective resolution measures by authorities prevented the acute banking stress of March 2023 from spreading to other segments of the financial system and contained cross-border contagion as well as spillovers to the real economy, the global banking system is expected to remain under pressure due to higher funding costs, valuation losses on investments and potential loan losses due to heavier debt burdens on borrowers. Sudden and sharp movements in market prices could create stress in the less regulated NBFI sector, where the build-up of leverage is keeping policy authorities on guard, especially hidden leverage due to the use of derivatives and other off-balance sheet exposures2. I.1.2 Other Global Macrofinancial Risks 1.12 In the wake of the aggressive and synchronised monetary tightening that has dominated 2022 and 2023, multiple sources of macrofinancial vulnerabilities have surfaced that tilt the balance of global financial stability risks to the downside. Going forward, interest rate risk exposures, large public debt, bond market vulnerabilities, financing of climate transition in emerging markets and developing economies (EMDEs), geo-economic fragmentation and realignment of supply chains are the key near-term and medium-term challenges. A. Interest Rate Risk Exposures 1.13 Corporates and households have so far displayed resilience to the current rate tightening cycle. Financial buffers built during the pandemic, a relatively lower share of variable rate debt and elongation of debt maturities have mitigated the impact of rate increases and helped them service their debts. Given the lags in monetary policy transmission, interest rate risks tend to materialise over several quarters in financing costs. As regards the non-financial corporate sector, it is staring at an imminent debt maturity wall in coming years even as corporate spreads have moderated (Chart 1.8 a and b). The total number of corporate bond defaults worldwide increased to 118 in September 2023, almost double the amount on a year-on-year basis and far higher than the typical average for this time of the year (101)3.  1.14 A prolonged period of high interest rates is also expected to test the resilience of the banking sector, where revaluation of assets is once again becoming a concern similar to the turmoil in March 2023 (Chart 1.9). 1.15 Rising interest rates have benefitted banks and improved their net interest margins (NIM), as the transmission to yield on assets has been faster than that to the cost of funds (Chart 1.10). Nevertheless, as the rate cycle approaches its peak, banks’ profitability is expected to come under pressure due to rising valuation losses, increasing risks for asset quality and tempering of credit growth. 1.16 Another concern relates to the possibility of decline in value of underlying property assets, especially for CRE lending by banks. Preference among businesses to lessen office footprints, the penchant of employees for remote working and cost-cutting exercises have put downward pressure on CRE prices. In a higher interest rate regime with lower than trend economic growth, banks could, therefore, see impairment in their CRE portfolios (Chart 1.11 a, b and c). 
 1.17 According to the IMF’s enhanced global stress tests4, the global banking system remains resilient on an aggregate level but there is a substantial tail of weak banks5 that is expected to experience large valuation losses in investments and debilitation of loan loss provisions. Under this stress testing framework, an adverse scenario that assumes persistent inflation and more monetary tightening may cause 215 banks representing 42 per cent of global bank assets, especially from AEs and China, to remain weak6 (Chart 1.12 a and b). 1.18 The relative strength of the US dollar against other currencies and escalating geopolitical tensions pose several challenges for EMDEs such as capital outflows, tighter financial conditions, widening bond spreads and loss of competitiveness of global trade in goods and services due to terms of trade erosion (Chart 1.13 a and b).
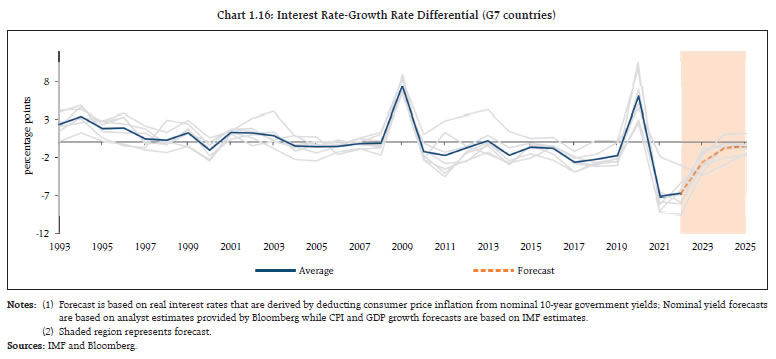
B. Public Debt 1.19 Both AEs and EMDEs have to contend with high public debt-to-GDP ratio as it stays much above the pre-pandemic levels (Chart 1.14 a and b). Global public debt is expected to reach to 93 per cent of world GDP in 2023 and is projected to grow by one percentage point every year to reach nearly 100 per cent of GDP by the year 2030. Within this unabated expansion, public debt is projected to reach 116.3 and 78.1 per cent of GDP for AEs and EMDEs, respectively, by 20287. 1.20 Public debt and its servicing pose concern because maintenance of persistent primary surpluses has become difficult in the face of slowing growth (Chart 1.15). Interest rate-growth rate differentials are also narrowing in an environment of slowing growth (Chart 1.16). Moreover, aging population, climate finance needs, and defence spending in response to escalating geopolitical tensions require substantial public resources, posing major challenges for fiscal consolidation. It is estimated that age-related expenditures in the absence of fiscal consolidation would push public debt above 200 per cent and 150 per cent of GDP in AEs and EMEs, respectively by 2050, even if interest rates remain below growth rates (Chart 1.17 a and b). Furthermore, additional spending incurred towards climate finance and defence expenditure can lead up to 50 per cent increase in public debt by 20508. 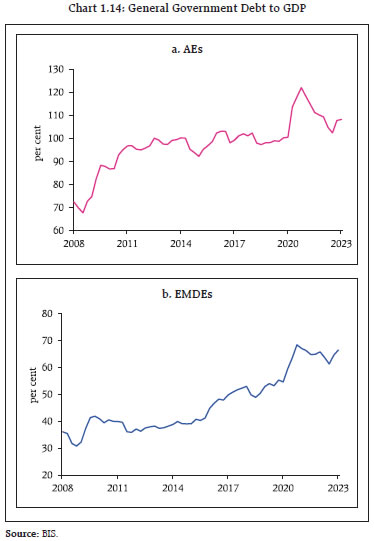
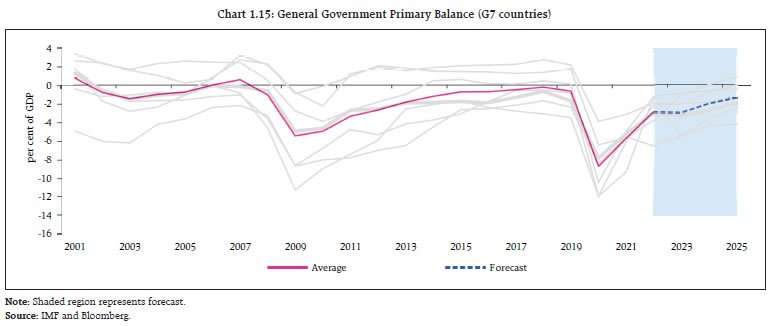
 1.21 While country-specific factors will determine market outcomes, it is likely that high interest rates will put pressure on government balances, especially the roll-over of maturing debt, as investors also price higher term premiums for bearing duration risk. 1.22 High public debt is an even larger problem for EMDEs in view of higher debt servicing costs. While larger EMDEs are able to access the market and raise debt, other countries, which face a high risk of distress, are either losing access to market financing or defaulting. Low-income countries face significant refinancing risk as 20 per cent of their debt is due within one year and 42 per cent within three years9. C. Bond Market Vulnerabilities in AEs 1.23 During the last two decades, global bond markets have grown from around US$ 40 trillion at the start of the millennium to US$ 152 trillion by the end of 2022. Alongside, NBFIs have overtaken traditional banks in asset size (Chart 1.18 a and b). In tandem, vulnerabilities in bond markets have also increased, driven by surge in hidden leverage among NBFIs, withdrawal of banks and primary dealers from their traditional role of market makers and a decrease in overall liquidity in government bond markets. 1.24 The rising profile of NBFIs in bond markets poses several challenges with implications for systemic stability. For instance, in March 2020, the US treasury market was impacted by losses of hedge funds, which had taken large and hidden positions in treasuries through derivatives. In September 2022, the actions of pension funds engaged in so-called liability-driven investment (LDI) strategies led to sharp fall in gilt prices in the UK. In both instances, central banks had to intervene to stabilise the markets. 1.25 Recent developments indicate that hedge funds are increasing their exposure to cash-futures basis trade, which involves a long Treasury cash position, a short Treasury futures position, and borrowing in the repo market to finance the trade10 - the same trade that contributed to massive losses in March 2020. These trades enable hedge funds to arbitrage between underlying bonds and futures. The counterparties to these trades are asset managers like pension funds who prefer buying treasury futures instead of bonds to match the duration of their assets and liabilities as it requires less cash upfront. These trades enable both hedge funds and asset managers to increase exposure of treasury bonds through leverage. More importantly, since arbitrage differences are small, hedge funds must run large positions to earn a meaningful return. As of December 2022, hedge funds borrowed US$ 553 billion in repo borrowing to fund treasury bond purchases as against total capital of US$ 9.9 billion, with effective leverage of 56 to 111. Recent data show that both repo borrowing and basis trade positions have grown beyond their previous peaks in 2019 (Chart 1.19 a and b). Since these positions are highly leveraged and are exposed to both changes in futures and repo margins, they impose a financial stability vulnerability. 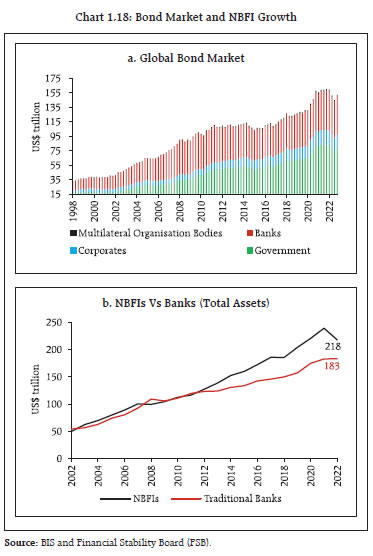 1.26 According to the Financial Stability Board (FSB)12, the full extent of NBFIs leverage is difficult to assess as hedge funds, family offices and pension funds are taking on excess leverage through ‘synthetic’ positions. This poses financial stability concerns as liquidity demands from leveraged positions, which are exposed to margin calls on derivative trades and volatility in underlying assets, have the potential to amplify shocks. As the FSB’s recent report on non-bank financial intermediation shows, the size of the sector in 2022 witnessed first notable decrease since 2009 due to the impact of higher interest rate on their asset valuations13. 1.27 Structural vulnerabilities in the US treasuries market, which is the largest and most liquid government bond market, have increased as banks that acted as market makers no longer perform that role. New entrants such as NBFIs and other market participants have not stepped in to fill the void. Since 2007, the total size of primary dealer balance sheets has decreased by a factor of roughly four for every US dollar of outstanding treasury securities14. This has reduced liquidity in treasuries markets and similar trends are seen in other AE bond markets (Chart 1.20). Reduced liquidity in an environment of heavy sovereign debt raising is likely to impart bouts of volatility in bond markets.
D. Geo-economic Fragmentation 1.28 The widening fractures in the global economic order pose macrofinancial risks in different forms such as trade barriers, disruption in capital flows, ruptures in commodity markets, technological decoupling and migration restrictions which are threatening to reverse the benefits of global integration (Chart 1.21). 1.29 The number of new trade barriers have roughly tripled since 2019 to reach nearly 3,000 in 2022 from nearly 300 a decade ago15. Meanwhile, global flows of goods and services have tapered (Chart 1.22 a and b). It is estimated that the cost of trade restrictions alone on global output will range from 0.2 per cent in a limited fragmentation scenario to 7.0 per cent under severe conditions16. Going forward, measures adopted by certain countries, such as carbon border tax, would further deepen economic fragmentation. 1.30 Foreign direct investment (FDI) is also increasingly being determined by geopolitical alignments and inward-looking production strategies. FDI flows as a share of GDP have been moderating; in 2022, global FDI flows declined by 5 per cent17 with a dip in cross-border merger and acquisition (M&A) flows (Chart 1.23 a and b).
1.31 Commodity markets are particularly vulnerable to fragmentation due to their inherently high production concentration, low price elasticity of supply, low substitutability and complex supply chains. Trade interventions in commodities have been rising as well, especially in minerals and agricultural commodities (Chart 1.24). 1.32 These disruptions have contributed to supply shocks, high price volatility, widening price differentials across markets, and a decrease in commodity sector FDI activity (Chart 1.25 a and b). EMDEs are particularly vulnerable to commodity market fragmentation, with long-term output losses expected to exceed two per cent of their GDP18.
E. Climate Finance 1.33 Financing needs for climate change mitigation are large: the International Energy Agency (IEA) estimates that around US$ 5 trillion in yearly global gross investments will be required by 2030 to achieve net zero greenhouse gas emissions by 2050 (Chart 1.26 a). EMDEs, which face important challenges in attracting private capital and have limited fiscal space, need about 40 per cent of these investments so that climate mitigation investments increase to 12 per cent of total investments by 2030 from the 2020 level of 3 per cent19 (Chart 1.26 b). 1.34 Private finance is critical for EMDEs to meet their climate investment requirements for both mitigation and adaptation. Estimates show that public investments will not be sufficient to meet climate investment needs and the share of private capital has to more than double from the current level of 40 per cent by 203020 (Chart 1.27). Risk-return profile of climate projects, however, are not amenable to private capital at scale and public sector participation can help de-risk such projects. Therefore, public-private partnership is essential to mobilise finance to meet the growing climate investment needs. 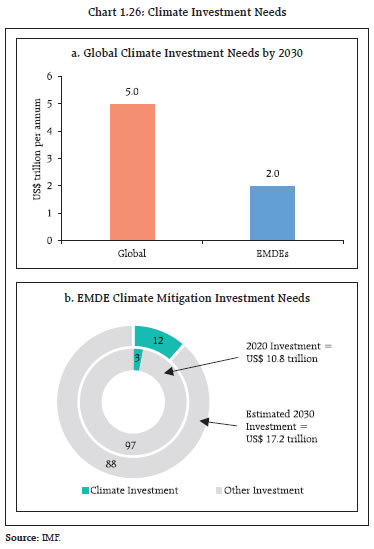 1.35 Attracting private capital, however, is hard for EMDEs due to multiple constraints: lack of an investment-grade sovereign rating for many of them, stringent environmental, social, and governance (ESG) regulations by their counterparts in AEs, investor concerns about risk-return profiles of investments, policy uncertainty, shallow capital markets, regulatory challenges and management of foreign exchange risk21. Green, Social and Sustainability (GSS) bond issuance dipped in 2022 amidst challenging financing conditions in global markets. In terms of issuance currency, US Dollar (USD) and Euro constituted 71 per cent of total bond issuance. For the few select investment-grade EMDEs that can access this market, 42 per cent of bonds were issued in Chinese Yuan (CNY) while Euro and US dollar issuance constituted only 35 per cent (Chart 1.28 a and b). 1.36 In order to build an attractive private investment climate and generate private capital flows to EMDEs, public-private collaboration and sound financial sector policies are vital. Taxonomies, disclosure requirements and suitability and appropriateness standards for GSS financial instruments are critical in this regard. The G-20 Independent Expert Group has suggested an increase in annual spending by multilateral development banks (MDBs) by US$ 3 trillion by 2030, including US$ 1.8 trillion for additional climate action, and US$ 1.2 trillion for achieving other sustainable development goals (SDGs).
F. Commodity Markets 1.37 The recent moderation in commodity prices faces challenges from the conflict in the Middle East and global polarisation, even though their impact has so far been muted (Chart 1.29). Escalation or widening of conflict could flare up these prices, especially those of crude oil. 1.38 Supply chain disruptions, which rose during the COVID-19 pandemic and Russia-Ukraine war, have eased substantially with the global supply chain pressure index (GSCPI)22 falling to a 26-year low, driven by a sharp reduction in transportation costs. (Chart 1.30). 1.39 Oil prices rose between June and October 2023, driven by cuts in oil production by OPEC+ member countries and the conflict in West Asia. Prices have fallen sharply thereafter as waning global demand and increase in stockpiles outweighed production cuts and the conflict in West Asia has not been allowed to broaden. Futures prices, however, remain above June 2023 levels (Chart 1.31). 1.40 Historical evidence suggests that military conflicts in the region often create substantial supply disruptions leading to spike in oil prices and increased volatility (Chart 1.32 a and b). Depending on the degree of disruption, crude oil prices could increase by 75 per cent above the baseline in a severe scenario (Chart 1.33).
1.41 The food price index of the Food and Agriculture Organisation (FAO) has been moderating since mid-2022, declining by 10.7 per cent (y-o-y) in November 2023 (Chart 1.34). Agricultural prices are projected to fall by 7 per cent in 2023 and a further 2 per cent in 2024 and 2025 owing to ample supplies23. 1.42 On balance, the limited impact of war in the Middle East on commodity prices reflects improved supply-demand balance. Additionally, the impact of El Nino on agricultural production remains to be fully reflected. G. Cybersecurity 1.43 The financial sector has always been an early adopter of technological innovations while managing exposures to information technology (IT) disruption risk by building redundancies in the underlying IT architecture and through robust business recovery processes. Nevertheless, they have to take into account the fact that financial markets could, at times, get quickly impacted by entity-level disruptions from system failures, inadequate processes and human errors. 1.44 The IT environment in financial institutions has undergone significant changes. Remote working has expanded the access points and internet exposures to internal systems. Adoption of cloud technologies in place of on-premises data centers and third-party dependencies have further added complexities to traditional security structures and aggravated data-leak exposures. 1.45 The number of common vulnerabilities and exposures (CVEs) detected in IT security have risen in India too, which significantly adds to financial sector vulnerabilities (Table 1.1). The recent episode of disruption in the world’s largest treasury market due to ransomware attack faced by a participant is one in a string of these catastrophic events. 1.46 The evolution of the cyber threat landscape has been rapid. Entry-level cyberattack such as distributed denial of service (DDoS) has given way to more sophisticated ransomware attacks, which cause substantial financial and reputational consequences to organisations, in addition to business disruptions. Furthermore, supply chain attacks and zero-day vulnerabilities have potential for causing disruptions simultaneously across many institutions using the affected software/ services. The potential of state-sponsored cyberattacks on financial systems and critical information infrastructure for causing disruptions cannot be underestimated. The use of artificial intelligence (AI) in cyberattack and availability of “as a service” offerings for cybercrime have added to the efficiency of attack vectors and to the scale of looming cyber threats. Inter-connections among financial institutions, common and high degree of dependencies from third party service providers, volume, and speed of transactions due to increased adoption of application programming interfaces (APIs) and innovative and invasive technologies are some of the major factors that make the impact from cyberattacks a plausible scenario from a systemic perspective. | Table 1.1: Security Incidents Handled by CERT-In | | Security Incidents | Incidents during January-October, 2023 | | Phishing | 711 | | Unauthorised Network Scanning/Probing | 4,39,431 | | Vulnerable Services | 7,18,548 | | Virus/ Malicious code | 1,44,950 | | Website Defacements | 9,820 | | Website Intrusion Malware Propagation | 967 | | Others | 5,679 | | Total | 13,20,106 | | Sources: Indian Computer Emergency Response Team (CERT-In), Ministry of Electronics and Information Technology. | I.2 Domestic Macrofinancial Risks 1.47 The Indian economy has been successfully navigating the challenge of balancing macrofinancial stability and growth in a period of turbulent global spillovers, new shocks and heightened uncertainties. Strong macroeconomic fundamentals and buffers have supported the resumption of growth alongside price and financial stability. Domestic tailwinds such as easing inflation, improvements in demand conditions, moderation in fiscal and current account deficits, stable financial markets and sound buffers in the form of sizeable forex reserves, high capital and liquidity ratio in financial institutions, healthy corporate balance sheets, and a robust financial system are helping the economy to deal with global headwinds, geo-economic fragmentation and heightened geopolitical tensions. Banks and NBFCs, bolstered by improved balance sheets, are catalysing economic growth and meeting the productive needs of the economy. Overall, domestic macrofinancial risks have declined and proactive and prudent policies have improved macroeconomic resilience. I.2.1 Domestic Growth and Inflation 1.48 In India, real GDP grew by 7.6 per cent in Q2:2023-24, buoyed by strong consumption and investment growth that offset the drag from a decline in exports (Chart 1.35) 1.49 Nonetheless, spillover effects from the slowdown in world trade, tighter global financial conditions, increasing fragmentation and geopolitical strife remain contingent risks to external demand. On the domestic side, the impact of El Niño conditions could present a challenge to agricultural output and food prices. 1.50 While decline in global commodity prices and effective domestic supply management could help moderate food inflation, the impact of higher rural inflation relative to the urban sector, as witnessed in the recent months, could have more pronounced impact on rural demand (Chart 1.36). 1.51 Headline inflation, which peaked at 7.4 per cent in July 2023 on the back of volatile food prices, is progressively aligning with the medium-term target of 4 per cent. It has eased to 5.6 per cent in November 2023 but remains susceptible to food price shocks. Meanwhile, core inflation (i.e., consumer price Index (CPI) excluding food and fuel) is exhibiting a sustained disinflation, easing to 4.1 per cent in November 2023 – its lowest level since March 2020 (Chart 1.37 a and b). 
 1.52 The Indian basket of crude oil prices which was moderating for more than a year, trended upwards during July-October 2023 before a decline in recent months (Chart 1.38 a). Continuation of production cuts by OPEC+25 alongside mounting uncertainties stemming from the conflict in West Asia could keep prices volatile in the near term and pose risk to the inflation outlook. An oil price surge of 10 per cent from the baseline of US$ 85 per barrel could weaken domestic growth by 15 basis points and increase inflation by 30 basis points26. The declining oil intensity of GDP (i.e., the volume of oil consumed per unit of GDP) could, however, offset the impact of the oil price shock (Chart 1.38 b). I.2.2 External Sector and Foreign Exchange Market 1.53 External sector resilience has been a key contributing factor in improving domestic macroeconomic stability. Despite overlapping global shocks, the trade deficit improved from US$ 189.2 billion in April-November 2022 to US$ 166.4 billion in April-November 2023 and the current account deficit (CAD) remains eminently manageable. Strong services exports and remittances are lending stability and sustainability (Chart 1.39 a and b).
1.54 The evolution of the trade balance would depend on (a) the impact of the slowdown in global demand on merchandise exports; and (b) the trajectory of imports, given strong domestic demand and volatile oil prices stemming from geopolitical conflicts (Chart 1.40). 1.55 In a volatile global economic environment, India continued to attract steady capital inflows. During the current fiscal year so far (upto December 20, 2023), net inflows of foreign portfolio investments (FPI) were US$ 30.6 billion as against net outflows of US$ 3.3 billion during the same period last year (Table 1.2). The inclusion of Indian government securities in the JP Morgan Global Bond Index - Emerging Markets from June 2024 could augur well for the outlook for capital flows to India. External commercial borrowings (ECB) and non-resident deposits have also registered net inflows in 2023-24. Foreign direct investment (FDI), however, remained subdued, reflecting the global retrenchment of these flows as well as an uptick in repatriations of FDI from India. Overall, the increase in FPI, ECB and non-resident deposit inflows are expected to offset the decline in FDI and support the financing of the CAD. 
| Table 1.2: Capital Flows | | (US$ billion) | | Component | Financial Year so Far | Financial Year (Apr-Mar) | | Period | 2023-24 | 2022-23 | 2022-23 | 2021-22 | | FDI (net) | April-October | 10.4 | 20.8 | 28.0 | 38.6 | | FPI to India (net) | April-December | 30.6 | -3.3 | -4.8 | -14.1 | | ECB to India (net) | April-October | 3.9 | -4.2 | -4.1 | 7.4 | | Non-Resident Deposits (net) | April-October | 6.1 | 3.1 | 9.0 | 3.2 | Note: Data on FPI for financial year so far is up to December 20, 2023, sourced from NSDL. Figures for full financial years 2022-23 and 2021-22 are based on BoP.
Sources: RBI and NSDL. |
1.56 Reflecting these developments, there was an accretion to the foreign exchange reserves to the tune of US$ 27.0 billion on a balance of payments (BoP) basis during H1:2023-24 (Chart 1.41). 1.57 External vulnerability indicators continue to show improvement: foreign exchange reserves of US$ 616.0 billion as on December 15, 2023, are sufficient to cover about ten months of actual imports (on a BoP basis) for 2022-23; external debt moderated to 18.6 per cent of GDP in June 2023; and the share of short-term debt (with original maturity of up to one year) in total external debt declined to 19.6 per cent in June 2023 (Chart 1.42).
1.58 The stability of the exchange rate has helped in absorbing external shocks and mitigating the impact of global spillovers on domestic macroeconomic and financial stability (Chart 1.43 a and b). 1.59 Exchange rate stability is also reflected in steady fall in implied volatility derived from option prices and compression of onshore-offshore spreads (Chart 1.44 a and b). I.2.3 Corporate Sector 1.60 Material improvement in the balance sheets of listed non-financial corporates (NFCs) and their high profitability have been supported by business and financial restructuring over the years. The NFC debt to GDP ratio in India is lower than AE and EMDE peers since 2011-12 (Chart 1.45 a and b).
1.61 There are multiple factors that have contributed to the relative stability of NFCs in the current tightening cycle: First, corporates entered the current cycle with robust financials. Second, relative to AEs, the size and length of monetary tightening in India has been moderate. Third, low level of debt in their corporate capital structure allows Indian NFCs to operate with low interest expenses, which has also moderated in Q2:2023-24 (Chart 1.46 a and b). Finally, interest-coverage ratio (ICR) of listed private NFCs has improved, supported by strong operating profit (Chart 1.47 a and b). 
 1.62 Overall, despite the lagged impact of monetary tightening on funding costs, the debt service ratio of NFCs in India has declined by 1.3 percentage points from its mean level (between 2007 and 2023). This, alongside lower leverage augurs well for NFCs’ ability to mitigate the impact of interest rate risks on their financials (Chart 1.48 a and b). Capital investment by listed private NFCs improved further: the share of fixed asset to total assets has improved to 34.6 per cent in H1:2023-24 from 33.6 per cent in H1 of the previous year. 1.63 Despite increase in interest burden, the debt share of NFCs with ICR below unity, an indicator of a firm’s financial vulnerability, is on a decline, helped by improving profitability. Moreover, the share of sales of such firms in aggregate sales is low, particularly in the manufacturing and IT sectors, indicating that the sub-unity ICR group is dominated by smaller firms (Table 1.3 and 1.4).
| Table 1.3: Debt Share of Firms Below/ Above ICR Threshold Values | | Items | 2016-17 | 2017-18 | 2018-19 | 2019-20 | 2020-21 | 2021-22 | 2022-23 | H1: 2023-24 | | No of Companies | 3,238 | 3,231 | 3,205 | 3,163 | 3,103 | 2,963 | 2,990 | 2,880 | | ICR <=1 (per cent) | 35.5 | 34.2 | 34.1 | 37.6 | 34.7 | 32.6 | 21.0 | 21.9 | | 1 < ICR <= 4 (per cent) | 34.8 | 34.3 | 27.6 | 25.2 | 31.5 | 15.2 | 27.9 | 30.5 | | ICR > 4 (per cent) | 29.6 | 31.5 | 38.3 | 37.2 | 33.8 | 52.2 | 51.2 | 47.6 | | Sources: Capitaline and RBI staff calculations. | 1.64 The improvement in corporate sector health is also seen in rating decisions of major credit rating agencies (CRAs). Total number of downgrades as a ratio of total number of ratings (upgrades + downgrades + stable) across three major credit rating agencies (viz., ICRA, CRISIL and CARE) remained stable or declined in Q1 and Q2 of 2023-24 relative to the corresponding quarters of 2022-23. This ratio, which touched a peak of 20.3 per cent during Q1:2020-21, is at a low of 0.4 per cent at the end of Q2:2023-24. Moreover, across the three CRAs, the total number of upgrades and number of ratings remaining stable have increased, while the number of downgrades has decreased in the first two quarters of 2023-24 relative to corresponding quarters of 2022-23. (Chart 1.49 a, b and c). | Table 1.4: Sectoral Share in Sales of Companies with ICR<=1 | | (per cent) | | Year | Manufacturing | IT | Non-IT services | Aggregate | | 2020-21 | 6.8 | 3.0 | 44.1 | 10.5 | | 2021-22 | 5.5 | 1.6 | 36.5 | 9.3 | | 2022-23 | 3.5 | 1.3 | 22.5 | 5.5 | Sources: Capitaline and RBI staff calculations. |
1.65 The key risk to the outlook is the relatively subdued revenues, including volumes (Chart 1.50 a, b, c and d). Sales growth (y-o-y) of information technology (IT) companies has come down to 5.9 per cent after nine consecutive quarters of double digit growth. Also, IT majors have significantly lowered their guidance on revenue growth. 1.66 Though the rising profile of short-term debt in total borrowings appears as a potential risk from redemption pressures in 2024 and 2025, its share in corporate balance sheets remains low. Healthy balance sheets and stable financial conditions provide additional comfort (Chart 1.51 a and b). I.2.4 Government Finance 1.67 India’s fiscal position is improving on the back of ongoing fiscal consolidation, strong tax revenue and improved quality of expenditure (Table 1.5). Following a sharp increase during the pandemic, the gross fiscal deficit (GFD) of the central government has been on a declining trend and is expected to meet the medium-term target of 4.5 per cent of GDP by 2025-26. 1.68 Gross tax revenue recorded a growth of 14.0 per cent during April-October 2023-24, with direct taxes registering a year-on-year growth of 23.9 per cent. Increased compliance, higher advance tax collections and widening of the tax base have contributed to the robust growth in tax revenue. Indirect taxes recorded a growth of 3.6 per cent, as growth in goods and services tax (GST) and customs revenues outweighed the contraction in excise duties. The average monthly GST collection during April-November 2023-24 was ₹1.67 lakh crore as compared with ₹1.49 lakh crore during April-November 2022-23. 1.69 The quality of expenditure has shown a marked improvement - capital outlay, i.e., capital expenditure excluding loans and advances is projected to increase to 2.8 per cent of GDP in 2023-24 from 1.6 per cent in 2020-21. During April-October 2023-24, capital outlay increased by 28.6 per cent (y-o-y) and helped to reduce the revenue expenditure to capital outlay (RECO) ratio to 3.9 from 4.8 during April-October 2022-23. 1.70 The debt-to-GDP ratio of the Central Government is projected to fall from 62.8 per cent in 2020-21 to 57.4 per cent in 2023-24. Meanwhile, the debt service burden is estimated to remain high (Chart 1.52). 1.71 States’ GFD stood at 2.8 per cent in 2022-23, lower than the budget estimates of 3.2 per cent. A sharp decline in revenue deficits has been the primary driver of this fiscal consolidation. For 2023-24, States have budgeted a GFD-GDP ratio of 3.1 per cent, well within the Centre’s limit of 3.5 per cent (Table 1.6). | Table 1.5: Central Government - Key Deficit Indicators | | (per cent of GDP) | | Deficit Indicators | 2020-21 | 2021-22 | 2022-23 (PA) | 2023-24 (BE) | | Gross Fiscal Deficit | 9.2 | 6.8 | 6.4 | 5.9 | | Primary Deficit | 5.7 | 3.3 | 3.0 | 2.3 | | Revenue Deficit | 7.3 | 4.4 | 3.9 | 2.9 | Note: PA- Provisional Accounts; BE – Budget Estimates.
Sources: CGA and Union Budget Documents. |
| Table 1.6: State Government - Key Deficit Indicators | | (per cent of GDP) | | Deficit Indicators | 2020-21 | 2021-22 | 2022-23 (PA) | 2023-24 (BE) | | Revenue Deficit | 1.9 | 0.4 | 0.3 | 0.1 | | Gross Fiscal Deficit | 4.1 | 2.8 | 2.8 | 3.1 | | Primary Deficit | 2.1 | 1 | 1.2 | 1.4 | Note: PA: Provisional Accounts; BE: Budget Estimates.
Source: Budget document of States; and CAG. | 1.72 Alongside steady fiscal consolidation, States have taken steps to improve the quality of expenditure in favour of capital expenditure. Capital outlay is projected to increase to 2.9 per cent of GDP in 2023-24 from 2.1 per cent of GDP in 2020-21. The expansion of capital expenditure is aided by the ‘Scheme for Special Assistance to States for Capital Investment’ provided by the Central Government under which financial assistance was provided to the States in the form of 50-year interest free loans. Overall, RECO ratio of States is budgeted to improve to 5.0 per cent in 2023-24 (PA) from 6.0 per cent in the previous year. The rise in capital expenditure by both the Centre and States (Chart 1.53) is expected to improve potential growth and crowd-in private capital. 1.73 States’ Debt-to-GDP ratio fell to 27.5 per cent by end-March 2023 from the pandemic high of 31 per cent of GDP. Their debt servicing burden has also moderated since the pandemic (Chart 1.54). 1.74 Notwithstanding these efforts, States’ outstanding liabilities are still higher than 20 per cent of gross state domestic product (GSDP) – the limit recommended by the FRBM Review Committee (2018). For some of the larger States, debt ratios have exceeded 35 per cent of GSDP, which may pose redemption pressure in the medium term. Furthermore, the announcements of reversal to the old pension scheme (OPS) by some States could affect their ability to undertake developmental and capital expenditure.
1.75 India’s general government debt and deficit are projected to remain higher than the global averages (Chart 1.55 a, b and c). I.2.5 Household Finance 1.76 Gross household financial savings, which had surged to 15.4 per cent of GDP in 2020-21 (pandemic peak year), supported by large precautionary savings, fell to 11.1 per cent in 2021-22 and further to 10.9 per cent in 2022-23, reverting to its pre-pandemic trend (viz., an average of 11.0 per cent during 2011-12 to 2019-20). In terms of absolute levels, gross household financial savings expanded by 13.9 per cent year-on-year during 2022-23. Household net financial savings (HNFS), however, fell sharply to 5.1 per cent of GDP in 2022-23 from 11.5 per cent in 2020-21, well below its long-run annual average of 7.0-7.5 per cent. The fall in HNFS was driven by a rapid rise in financial liabilities from 3.8 per cent of GDP in 2021-22 to 5.8 per cent in 2022-23 even as financial assets moderated only marginally to 10.9 per cent in 2022-23 from 11.1 per cent in 2021-22 (Chart 1.56). 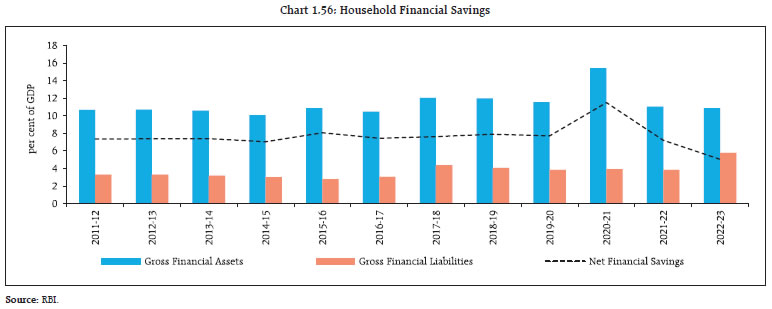 1.77 The increase in financial liabilities was driven by a steep rise in borrowings from financial institutions, with a large part in physical assets creation (mortgages and vehicles). Thus, the overall savings of households may still hold steady with a compositional shift in favour of physical savings. This would directly add to gross capital formation, supporting an upturn in private investment cycle and, eventually, the prospects for growth. Moreover, recent data show that HNFS rose to 7.0 per cent of GDP in Q4:2022-23 from 4.0 per cent of GDP in the previous quarter, indicating normalisation of HNFS towards the pre-pandemic long-term trend. 1.78 Household debt moderated to 37.6 per cent of GDP in March 2023 from its peak level of 39.2 per cent in March 2021 (Chart 1.57). Despite the recent increase in financial liabilities, household debt in India is much lower than in other EMEs and, therefore, the risk of defaults due to greater exposure of higher mortgage payments and floating rate interest is limited in India. Thus, the current level of household debt in India does not pose systemic concern (Box 1.1). 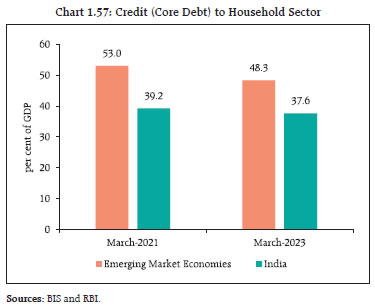
Box 1.1: Household Debt Sustainability The recent tightening cycle of monetary policy has resulted in rising mortgage rates and tighter lending standards, portending concerns for household debt levels. The experience of the global financial crisis suggests that high household debt levels can be a source of financial vulnerability and contribute to prolonged recession (Mian and Sufi, 2010). India’s household debt27 to GDP ratio is one of the lowest in the world, as also the debt service ratio (DSR) (Chart 1). Nonetheless, unanticipated income shocks triggering defaults and sensitivity to interest rate changes are risks to household debt that can have macroeconomic and financial stability implications (Lombardi et al, 2017). Historical data show a negative correlation between triennial changes in household debt and consumption growth (Chart 2 a and b) because of rising debt repayment obligations.
To prevent the build-up of systemic risk, it is important to assess the sustainable household debt level that is consistent with debt servicing cost as measured by the DSR. The DSR is estimated at the system level as follows: where D28 denotes the total stock of debt, Y29 denotes the gross disposable income of households, i denotes the effective interest rate on stock of debt and s denotes the average remaining maturity in years (Drehmann et al, 2015). In order to ascertain the effective interest rate and average remaining maturity, retail loan data from a survey of 12 major scheduled commercial banks comprising about 80 per cent of the retail loan portfolio at the system level were considered. The weighted average effective rate of interest stood at 9.7 per cent in March 2023 and residual maturity of retail loans was 12.7 years on the existing stock of debt (credit from banks and other financial institutions). Accordingly, the DSR of Indian households is estimated at 6.7 per cent at end-March 2023 (Chart 3). Sensitivity analysis is attempted under two different scenarios. In the first scenario, the DSR is increased to 8.5 per cent, based on the maximum rise in the DSR of advanced economies witnessed during the global financial crisis30. In this scenario, the household debt to GDP ratio increases to 48.0 per cent from 37.6 per cent in March 2023. In the second scenario, a sharp decline in gross disposable income due to an unanticipated income shock31 is considered, keeping other variables unchanged, the household debt to GDP increases to 47.9 per cent. The debt to gross disposable income of households (GDIH) ratio increased to 60.8 per cent in both the scenarios (Chart 4). India’s household debt to GDP remains below the average of 48.3 per cent for EMEs under both scenarios.
References: 1. Marco Lombardi, Madhusudan Mohanty and Ilhyock Shim (2017), “The real effects of household debt in the short and long run”. BIS Working Papers No 607. 2. Mian, A and A Sufi (2010), “Household leverage and the recession of 2007 to 2009”, NBER Working Paper, 15896. 3. Drehmann M, A Illes, M Juselius and M Santos (2015), “How much income is used for debt payments? A new database for debt service ratios”, BIS Quarterly Review, September. | I.2.6 Money and Capital Markets 1.79 Domestic financial conditions have remained conducive for growth amidst improving consumer and business confidence and rising corporate profitability. Movements in money market rates and bond yields have displayed two phases in the current tightening cycle. During the first phase - from April 2022 to February 2023 - when policy rates were tightened by 250 bps, short-term rates moved in tandem with the policy rate while transmission to long-term rates was less complete. In the second phase - from March 2023 to November 2023 - when there was a pause in the policy rate, both short-term and long-term money and bond market rates have eased though they remain elevated (Chart 1.58). 1.80 Liquidity conditions have evolved in line with the monetary policy stance. After the decision in May 2023 to withdraw ₹2000 denomination banknotes from circulation, banking system liquidity rose for a brief period. Proactive intervention through imposition of an incremental cash reserve ratio (I-CRR) of 10 per cent and fine-tuning operations helped modulate liquidity (Chart 1.59 a). Consequently, operating target of monetary policy, i.e., weighted-average call rate (WACR), has largely remained within the policy corridor (Chart 1.59 b).
1.81 With short-term rates rising faster than long-term rates, the sovereign yield curve flattened in the initial phase of the monetary tightening cycle, reverting thereafter to an upward sloping curve on the improving outlook for growth and anchoring of inflation expectations (Chart 1.60 a and b). 1.82 India’s inclusion in the JP Morgan Global Bond Index - Emerging Markets is expected to increase bond market liquidity, widen the investor base and improve price discovery. Bond index inclusion typically results in benchmark-driven investments32, providing access to a larger and more diverse pool of external investments and paving the way for increased flow of foreign investments into government securities under the fully accessible route (FAR) (Chart 1.61 a and b).
1.83 Due to procyclicality, benchmark-driven investments are generally prone to external shocks and could pose vulnerabilities: they are about three to five times more sensitive to global risk factors than the traditional measures of portfolio flows33. 1.84 Corporate bond spreads have declined across institutions and rating categories, suggesting that interest rates may be approaching or at their peak in the current cycle (Chart 1.62 a). The median spreads of listed non-convertible debentures (NCDs) over the yield of the 3-year government security benchmark have also declined for all rating grades in both primary and secondary market segments (Chart 1.62 b and c).
1.85 NBFCs, including housing finance companies (HFCs) and public sector undertakings (PSUs), remained the major corporate bond issuers, forming more than two-thirds of total listed bonds and debentures. Nearly three per cent of the corporate bond issuances were in the form of public issues during Apr-Nov 2023 (Chart 1.63 a and b). 1.86 Banks and body corporates accounted for nearly 61 per cent of total subscription of corporate bonds. Subscription to public issues was dominated by residents (Chart 1.64 a and b). 1.87 Domestic equity markets have been outperforming their emerging market peers in both local currency and U.S. dollar terms on the back of improving macroeconomic fundamentals, healthy and profitable corporate balance sheets, robust earnings outlook and stable financial conditions. During the current fiscal year so far (up to December 15, 2023), the benchmark Nifty 50 index posted returns of 23.5 per cent, with market capitalisation surging to US$ 4 trillion, making India’s stock market the fifth biggest in the world (Chart 1.65).
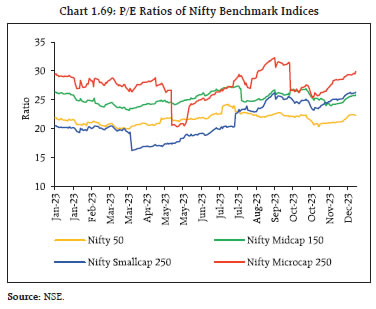
1.88 Higher returns in the domestic equity market have also been associated with low volatility in terms of both implied volatility based on option prices and realised volatility (Chart 1.66 a and b). 1.89 After being net sellers of Indian equities to the tune of US$ 8.1 billion in 2022-23, foreign institutional investors (FIIs) made net investments of US$ 11.9 billion during April-November 2023, even as domestic institutional investors, including mutual funds, continued to provide support as net buyers (Chart 1.67).
| Table 1.7: Trailing and Forward P/E Ratios | | Indices | Trailing P/E | Forward P/E | | June 2023 | September 2023 | June 2023 | September 2023 | | Nifty 50 | 22.4 | 22.2 | 20.2 | 21.9 | | Nifty 500 | 23.5 | 23.5 | 21.6 | 23.2 | | MSCI EM | 13.6 | 14.1 | 12.1 | 11.6 | | MSCI World | 20.3 | 19.5 | 17.0 | 16.1 | | Sources: Bloomberg, Refinitiv and MSCI. | 1.90 A higher price-to-earnings (P/E) ratio vis-à-vis global markets indicates overvaluation in the Indian equity market; although robust earnings growth in the next 12 months is also being priced in (Table 1.7). 1.91 Three important developments in the Indian equity market performance require close monitoring. First, compared to the rally in the benchmark Nifty 50 index that represents the largest firms, the rallies in the mid-cap, small-cap and micro-cap indices were significantly larger. During April-October 2023, the return on Nifty Microcap Index was more than five times that on Nifty 50 (Chart 1.68). Over a three-year horizon, the performance divergence between Nifty 50 and other indices is even sharper (Table 1.8). 1.92 In addition to the higher valuation among scrips in the mid-cap and small-cap segments relative to the large-cap firms, a substantial share of them (69 per cent in mid-cap and 70 per cent in small-cap) were trading with P/E ratios higher than those of their corresponding benchmark indices (Table 1.9; Charts 1.69 and 1.70 a and b). | Table 1.8: Nifty Benchmark Indices Return | | (per cent) | | CAGR | Nifty 50 | Nifty Mid-cap 150 | Nifty Small-cap 250 | Nifty Micro-cap 250 | | 1-year | 7 | 32 | 37 | 58 | | 2-years | 9 | 19 | 18 | 35 | | 3-years | 16 | 29 | 33 | 52 | Note: Data as on November 30, 2023.
Source: NSE. |
| Table 1.9: Category-wise Scrip Level P/E Ratio | | Category | P/E of Corresponding Benchmark Indices | Scrips with P/E higher than P/E of Benchmark Index
(per cent) | | Large Cap | 22.7 | 68 | | Mid Cap | 26.8 | 69 | | Small Cap | 24.5 | 70 | | Micro Cap | 26.6 | 61 | Note: (1) Data as on September 30, 2023.
(2) Categorisation of stocks is based on AMFI classification of stocks as on June 2023 which takes into account Average Market Capitalisation of listed companies across NSE, BSE and MSEI during the six months ended 30 June 2023; Large Cap: Stocks ranking 1st -100th, Mid Cap: Stocks ranking 101st -250th, Small Cap: Stocks ranking 251st -500th, Micro Cap: Stocks ranking 501st -750th;
(3) Scrips having negative/ zero PE have not been considered.
Source: NSE. |
 1.93 Second, in recent years there is a sharp rise in individual investors’ participation in the equity market, primarily in shares of smaller firms. In contrast to institutional investors, individuals’ investments in listed companies excluding Nifty 500 is steadily increasing (Chart 1.71 a and b); at end-September 2023 they owned 48 per cent of the floating stock of these firms. 1.94 Individual investors’ appetite for investments in smaller firms is also augmented by mutual funds (MFs). Mid-cap and small-cap schemes of MFs have seen rapid increase in net inflows even as large-cap schemes witnessed net outflows (Chart 1.72 a and b).
1.95 Between June 2020 and September 2023, MFs’ share in free float market capitalisation of micro-cap stocks went up from 10.7 per cent to 15.9 per cent, which is the highest amongst all categories of shareholders (Table 1.10). 1.96 Third, equity derivatives trading volumes are increasing, with a sharp rise in individual investors’ participation in that segment. The attractiveness of options as derivatives lies in the embedded leverage, which allows traders to take exposure with little upfront cash. The number of active derivatives traders went up nearly six times from 2018-19 levels to 6.9 million by end of October 2023. Moreover, like derivatives market in other countries, there is a growing interest in shorter-duration options, which enables manifold increase in traders’ leverage, as option premiums are relatively low. Nevertheless, the required margins have not shown any significant variation (Table 1.11). Moreover, these margins are levied and collected at the client level, which helps in mitigating over-leveraged speculation in the securities market. In addition, margins charged by Indian stock exchanges are higher than those charged by global peers: the initial margin charged by NSE on NIFTY option contracts is 11 per cent (even on the last day of expiry) as against 5 per cent on NIFTY at SGX. | Table 1.10: Category-wise Stock Holdings by Mutual Funds | | (per cent) | | Stock Ranking* | End-June 2020 | End-September 2023 | | 1st -100th | 14.9 | 16.9 | | 101st -250th | 22.0 | 22.0 | | 251st -500th | 18.2 | 19.2 | | 501st -750th | 10.7 | 15.9 | | 751st onwards | 3.9 | 4.6 | | All Listed | 15.1 | 17.6 | Note: (1) * Stock Ranking in terms of NSE Full Market Capitalisation.
(2) Data consists of all NSE listed stocks.
Source: NSE. |
| Table 1.11: Margin Requirements for Writing Options at NSE | | Date | NIFTY Underlying Value at BOD (Index) | Value (₹) | Strike Price (Index) | Margin Required for Writing 1 Contract for Last Day of Expiry (₹) | Margin Required for Writing 1 Contract for Last Day of Expiry (per cent) | Margin Required for Writing 1 Contract for Monthly Expiry (May/November) as on the Expiry Day of 2nd Week (₹) | Margin Required for Writing 1 Contract for Monthly Expiry (May/November) as on the Expiry Day of 2nd Week (per cent) | Net Option Value (for Last Day of Expiry) for Buyers (₹) | Net Option Value (for Monthly Expiry) for Buyers (₹) | | 11-Nov-21 | 18017.2 | 1351290 | 18000 | 107100 | 8 | 103900 | 8 | 3683 | 11333 | | 12-May-22 | 16167.1 | 1212533 | 16150 | 101050 | 8 | 100300 | 8 | 4983 | 14313 | | 10-Nov-22 | 18157.0 | 907850 | 18150 | 104350 | 11 | 103050 | 11 | 3355 | 12385 | | 11-May-23 | 18315.1 | 915755 | 18300 | 103350 | 11 | 100650 | 11 | 2863 | 9003 | | 9-Nov-23 | 19443.5 | 972175 | 19400 | 110900 | 11 | 110000 | 11 | 3055 | 11503 | | Source: NSE. | 1.97 Empirical evidence shows that 9 out of 10 traders in the derivatives segment incurred losses and the average loss per active trader was ₹50,000 in 2021-2234. In this context, the SEBI has introduced “Risk Disclosures” with respect to trading in the equity derivatives segment with a view to empowering the investors with detailed information about the risks associated with trading in equity derivatives segment and, thereby, facilitating informed decision making. I.2.7 Mutual Funds 1.98 Backed by the rise in households’ participation, the domestic mutual fund industry experienced robust growth. Total assets under management (AUM) rose by 21 per cent (y-o-y) in September 2023, when it touched its all-time high (Table 1.12). 1.99 In the current fiscal year till November 2023, both equity-oriented and debt-oriented open-ended schemes received net inflows; the AUM of equity-oriented open-ended schemes grew by 34 per cent, with small-cap funds receiving the highest inflows. Debt-oriented schemes’ AUM grew by 15 per cent, with investors preferring liquid and money market funds (Chart 1.73 a and b). 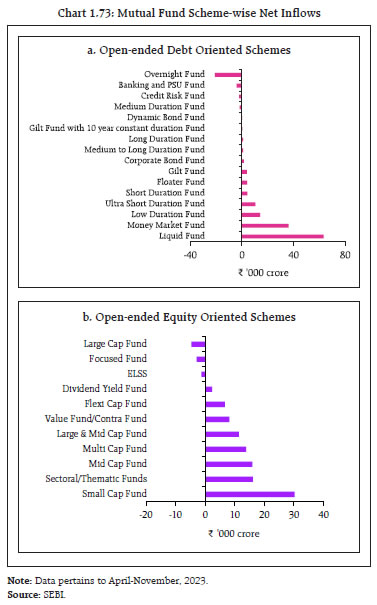
| Table 1.12: Assets under Management of the Domestic Mutual Fund Industry | | (₹ lakh crore) | | As on | B30 AUM | T30 AUM | Industry AUM | | Equity | Non-Equity | Total | Equity | Non-Equity | Total | Equity | Non-Equity | Total | | Apr 30, 2023 | 4,47,424 | 2,93,354 | 7,40,778 | 12,44,404 | 21,76,640 | 34,21,044 | 16,91,828 | 24,69,994 | 41,61,822 | | Jun 30, 2023 | 4,92,805 | 3,02,406 | 7,95,211 | 13,62,612 | 22,81,365 | 36,43,976 | 18,55,417 | 25,83,771 | 44,39,187 | | Sep 30, 2023 | 5,37,790 | 3,22,668 | 8,60,457 | 14,89,083 | 23,08,214 | 37,97,298 | 20,26,873 | 26,30,882 | 46,57,755 | Note: T30 refers to the top 30 geographical locations in India and B30 refers to the locations beyond the top 30 cities.
Source: SEBI. | 1.100 Systematic Investment Plans (SIPs) offered by MFs have been contributing to financialisation of savings by encouraging investors to make periodic small-amount investments. As on November 30, 2023, investments made through SIPs formed 19 per cent of the total AUM of the domestic mutual fund industry (Chart 1.74). I.2.8 Alternative Investment Funds 1.101 Globally, AUM of private capital is estimated to have more than doubled from US$ 9.7 trillion in 2012 to US$ 22.6 trillion by the end of 202235. Alternative investment funds (AIFs) – one of the many forms of private capital – have grown consistently in India, raising about ₹3.7 lakh crore of funds by the end of June 2023. Their investments have also risen, with the investments of the three different types of AIFs, viz., Category I, II and III, growing at CAGRs of 25 per cent, 49 per cent and 30 per cent, respectively from 2012. Through their intermediation role they perform a useful economic function by providing alternate sources of funding. AIFs, like other private credit vehicles, however, are, subject to lesser regulation compared to banks and NBFCs. 1.102 The sharp growth in AIFs and the evolving regulatory framework for these entities necessitate a closer look at potential risks they pose for financial stability, including: (a) growing interlinkages of AIFs with traditional segments such as banks, NBFCs and asset management companies (AMCs) in terms of sponsor relationships, exposures to each other and common investor base, entailing spillover risks as well as reputation risk for banks and NBFCs, and loss of confidence; (b) regulatory arbitrage due to gaps in existing regulatory architecture for AIFs vis-à-vis banks/ NBFCs, which could potentially give rise to concerns relating inter alia to evergreening. In particular, AIFs with ‘priority distribution model’ are being set up to potentially aid in evergreening of stressed assets of some financial institutions/regulated lenders. As an interim measure, the SEBI had directed schemes of AIFs, which have adopted aforesaid priority distribution model, not to accept any fresh commitment or make investment in a new investee company; (c) potential for non-residents, through investment in units of AIFs, to invest in domestic markets without adhering to extant laws and regulations for non-resident investment in domestic markets; and (d) limited disclosure requirements, making effective monitoring and identification of risks challenging. 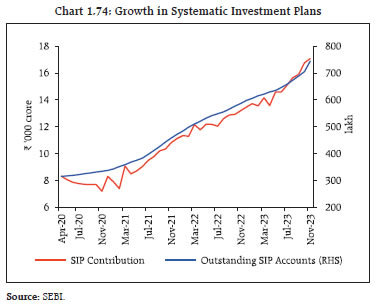 1.103 AIFs currently form a small portion of the Indian financial system, but their rapid growth and growing interlinkages with banks/ NBFCs warrant close monitoring of these entities and development of a sound regulatory framework to reduce spillovers and transmission of risks to the broader financial system. It is in this context that measures have been taken by the Reserve Bank recently (a) to prevent regulated entities (REs) from making investments in any scheme of AIFs with downstream investments either directly or indirectly in a debtor company of the RE; (b) liquidate RE’s investment in an AIF scheme, in which RE is already an investor, within 30 days from the date of such downstream investment by the AIFs or make 100 per cent provision on such investments; and (c) subject investment by REs in the subordinated units of any AIF scheme with a ‘priority distribution model’ to full deduction from RE’s capital funds. These are aimed at addressing concerns relating to substitution of direct loan exposures with indirect exposures through investments in AIFs (See section III.3.2 for details). I.2.9 Banking Stability Indicator 1.104 The banking stability indicator (BSI)36, which provides an overall assessment of the health of the domestic banking system, remained robust during H1:2023-24. Aided by declining levels of NPAs and restructured assets, the asset quality indicator improved further, and record return-on-assets (RoA) and healthy net interest margin (NIM) enhanced the profitability indicator. Efficiency indicator weakened due to increase in cost to income ratio. Although there was a marginal weakening of soundness and liquidity indicators due to increase in risk-weighted assets and a decline in the liquidity coverage ratio (LCR) respectively, the banking system has adequate capital and liquidity relative to the regulatory minimum (Chart 1.75). I.2.10 Banking System 1.105 The domestic banking system remains resilient, bolstered by strong buffers, robust earnings and the ongoing strengthening of balance sheets. The capital to risk-weighted asset ratio (CRAR) at end-September 2023 remained high at 16.8 per cent vis-à-vis the regulatory minimum of 11.5 per cent (including capital conservation buffer) while the common equity tier 1 (CET1) ratio, which represents the highest quality of regulatory capital, stood at 13.7 per cent as against the regulatory requirement of 8 per cent (including capital conservation buffer) (Chart 1.76 a and b).
1.106 Both coincident and leading indicators of asset quality, i.e., the gross non-performing assets (GNPA) ratio37 and the special mention accounts - 2 (SMA-2)38 ratio, respectively, have fallen to multi-year lows of 3.2 per cent and 0.9 per cent, even as improved provisioning drove the net non-performing assets (NNPA) ratio to a multi-decadal low of 0.8 per cent (Chart 1.77). 1.107 Healthy interest margins, strong credit demand and lower impairments have boosted net interest income (NII) of the banking system through the course of the current monetary policy tightening cycle, and strengthened earnings as reflected in RoA and RoE, which rose to 1.2 per cent and 12.9 per cent, respectively, in September 2023 from historical lows of (-) 0.2 per cent and (-) 2.2 per cent, respectively, in March 2018 (Chart 1.78 a, b and c).
1.108 Further gains in earnings could, however, be moderated by rising cost of funds for banks - the average cost of funds39 of SCBs have risen by 80 basis points (bps) - from 4.4 per cent during Q4:2022-23 to 5.2 per cent in Q2:2023-24. 1.109 Healthier balance sheets have facilitated broad-based expansion in lending by banks. Bank credit growth continues to outpace deposit growth on the back of sustained momentum of demand (Chart 1.79 a and b). 1.110 A longer-term analysis indicates the tendency of bank credit and deposit growth to converge though they diverge frequently in the short-term (Chart 1.80). An error correction model suggests that around 8 per cent of any divergence between credit and deposit growth is eliminated every month40. Consequently, the incremental credit-deposit (CD) ratio has fallen to 96.2 per cent by December 01, 2023 from a peak of 133.8 per cent on November 04, 2022. 1.111 Recent quarters have witnessed some moderation in the build-up of excessive credit momentum as measured by the credit-to-GDP gap (i.e., the difference between the credit-to-GDP ratio and its long-term trend) to (-) 8.8 per cent in Q4:2022-23 from (-) 12.4 per cent in Q1:2022-23. The quarterly average credit growth at 15.5 per cent is still below the threshold level of 16-18 per cent (Chart 1.81). 1.112 Monetary policy transmission to bank lending and deposit rates has been stronger in this cycle compared to previous cycles (Chart 1.82 a and b). 1.113 The distribution of outstanding loans across interest rates buckets also reflects faster transmission. The share of total outstanding loans in the interest rate range of more than 9 per cent rose from 30.7 per cent in March 2022 to 57.8 per cent in September 2023, whereas outstanding loans with interest rates less than 9 per cent declined from 69.3 per cent to 42.2 per cent (Chart 1.83). 1.114 In recent times, bank credit has undergone compositional shifts, with an increasing proportion of credit going to services and the retail sector. Over the past two years, banks and NBFCs have seen rapid and persistent growth in retail loans41, especially unsecured lending. Between September 2021 to September 2023, banks’ retail loans grew at a compound annual growth rate (CAGR) of 25.5 per cent, which exceeded the headline credit growth of 18.6 per cent. Consequently, the share of retail lending in gross advances increased from 37.7 per cent in September 2021 to 42.2 per cent in September 202342. Alongside, unsecured retail lending grew by 27.0 per cent during the same period, taking its share in total retail lending to 23.3 per cent (9.83 per cent of total gross advances of the banks). 
 1.115 Despite the sharp growth in retail lending, underlying asset quality has improved. The GNPA ratio of total retail advances improved to 1.6 per cent in September 2023 from 2.0 per cent in September 2022, whereas the SMA (1+2) ratio rose marginally from 2.7 per cent to 2.8 per cent. The GNPA ratio of unsecured retail advances improved to 2.0 per cent in September 2023 from 2.5 per cent a year ago. 1.116 A related development, which has facilitated rapid growth in retail loans, is bank lending to NBFCs, which constituted 9.9 per cent of total bank credit (end-June 2023). Bank lending to NBFCs increased at a CAGR of 26.3 per cent during the past two years (i.e., from June 2021 to June 2023), well above the growth of 14.8 per cent in overall bank credit (Chart 1.84 a and b). Such lending is, however, mostly limited to top-rated NBFCs with close to 80 per cent of credit given to those with AA-rating and above43. 1.117 Although there are no imminent signs of stress in the retail credit segment, its rapid growth amidst the disinflationary monetary policy stance raises concerns in terms of procyclicality of lending and higher debt servicing costs (Chart 1.85). 1.118 As banks and NBFCs have entered into various co-lending models with divergent underwriting practices and banks have been the major lender to NBFCs, rising interconnectedness raises risks emanating from cross-sectional dimensions. Furthermore, there are few outlier banks that have substantial SMA (1+2) ratios even as retail portfolios are witnessing rapid growth (Chart 1.86). Accordingly, the Reserve Bank took proactive regulatory measures, such as increase in risk weights on certain segments of consumer credit by banks and NBFCs as well as bank credit to NBFCs, along with a strengthening of credit standards in respect of various sub-segments under consumer credit, to prevent build-up of risks and spillover to the wider financial system. 
 1.119 The decision to increase risk weights is both stability enhancing and credit positive. First, banks and NBFCs will be required to allocate higher capital for unsecured retail loans, which will improve their loss-absorbing buffers; and second, it will dampen growth exuberance among lenders and improve credit quality. Adjusting for increase in risk weights, the CRAR of the banking system (PSBs + PVBs) is estimated to decline by 71 bps to 16.0 per cent and CET1 may fall by 58 bps to 13.2 per cent. The impact, however, varies among banks (Chart 1.87). 1.120 A prolonged period of high interest rates could test the resilience of the banking sector, through valuation losses in their investment portfolios. Banks hold 63.6 per cent of their investments in the held-to-maturity (HTM) category44, which are not marked to market. An assessment of unrealised losses on securities held in the HTM portfolio shows that losses have reduced relative to the March 2023 position, and the impact on their CET1 ratio is limited for most banks45. The median impact of unrealised losses on the CET1 ratio of select banks is 62 bps, with 5 per cent of banks registering a sizeable impact of 160 bps or more (Chart 1.88). 1.121 A key takeaway from the March 2023 banking turmoil in some economies is that banks remain vulnerable to loss of confidence and consequent deposit runs even with high levels of capital and liquidity buffers. Accordingly, alternative metrics such as (i) the ratio of uninsured deposits to total deposits; (ii) the ‘super’ CET1 ratio, which considers the unrealised losses on HTM securities; (iii) the runnable deposit ratio; and (iv) the liquid asset ratio that excludes HTM securities, are useful indicators of banking system vulnerabilities46. Application of these metrics on Indian banks shows that (a) banks that have a higher ratio of uninsured deposits also have a sufficiently higher ‘super’ CET1 ratio; and (b) while the runnable deposit ratio is low compared to banks that failed in March 202347, the liquid asset ratio is also low as the share of HTM securities is high (Chart 1.89 a and b). 
 1.122 Historically, movements in bank lending to agricultural activity are found to be strongly related with performance of the sector. Weak growth in agriculture is associated with a rise in non-performing assets (NPAs) in agricultural loans with a lag of 4-6 quarters. NPAs in the agriculture sector remain at elevated levels despite the recent decline (Chart 1.90 a and b). 
 1.123 The rapid credit expansion among small finance banks (SFBs) - which grew at an annualised rate of 23.2 per cent in September 2023 - is being funded by high reliance on bulk deposits51. The growth (y-o-y) in bulk deposits (63.3 per cent) led overall deposit growth (31.3 per cent) in September 2023, whereas current and savings account (CASA) grew only at 4.0 per cent. Their share of bulk deposits is high (Chart 1.91 a and b), even though at the aggregate level, their balance sheet size is relatively small compared to other private sector banks. Accordingly, SFBs’ cost of funds and lending rates at 7.1 per cent and 14.3 per cent, respectively, are 1.4 percentage points and 5.0 percentage points higher than their private sector counterparts. 1.124 SFBs are growing their retail loans portfolio at a brisk pace: at double the pace of SCBs, although from a lower base. Though their retail GNPA ratio is low at 2.3 per cent, more than a third of their retail loan portfolio remains unsecured (Chart 1.92 a and b).
I.2.11 Non-Banking Financial Companies (NBFCs) 1.125 The NBFC sector has increased its footprint in financial intermediation, and this has been associated with a rise in connectedness with the traditional banking system. Substantial capital buffers, improving asset quality and robust earnings have increased the resilience of the NBFC sector: the CRAR at 27.6 per cent in September 2023 remains well above the regulatory minimum of 15 per cent; the GNPA ratio has declined from a high of 7.2 per cent in December 2021 to 4.6 per cent in September 2023; and NIM and RoA stood at 5.1 per cent and 2.9 per cent, respectively, in September 2023 (Chart 1.93 a). Healthy balance sheets have enabled NBFCs to consistently expand credit, which grew from 8.9 per cent (y-o-y) in September 2021 to 20.8 per cent in September 2023 (y-o-y) (Chart 1.93 b).  1.126 There is significant heterogeneity within the NBFC sector, which makes systemic risk identification and monitoring a challenging task. Broadly, two classifications, viz., NBFC - Investment and Credit Companies (NBFC-ICCs) and NBFC - Infrastructure Finance Companies (NBFC-IFCs), which account for 95 per cent of the NBFC sector’s advances, have significant dependence on bank borrowings, which constituted 41.1 per cent of total borrowings {including subscriptions to debentures and commercial papers (CPs)} at the system level as at end-September 2023. The corresponding shares were 48.1 per cent and 29.5 per cent for NBFC-ICCs and NBFC-IFCs, respectively (Table 1.13 and 1.14). | Table 1.13: Sources of Borrowing – NBFCs (excluding CICs52) | | (percentage share) | | | Sep-21 | Mar-22 | Sep-22 | Mar-23 | Sep-23 | | Debentures (excluding portion subscribed by Banks) | 35.9 | 33.4 | 32.3 | 31.3 | 31.0 | | Borrowings from Banks (including subscription to Debentures and CPs) | 37.0 | 40.1 | 41.4 | 41.4 | 41.1 | | Borrowings from Financial Institutions | 2.3 | 2.6 | 2.7 | 2.9 | 3.1 | | Intercorporate Borrowings | 3.6 | 3.4 | 3.6 | 3.4 | 3.3 | | Commercial Paper (excluding portion subscribed by Banks) | 2.6 | 2.0 | 2.1 | 2.1 | 2.8 | | Borrowing from Government | 0.8 | 0.7 | 0.7 | 0.6 | 0.6 | | Subordinated Debts | 2.9 | 2.7 | 2.6 | 2.3 | 2.1 | | Other Borrowings | 14.9 | 15.0 | 14.7 | 15.9 | 16.0 | | Source: RBI supervisory returns. |
| Table 1.14: Share of Bank Borrowing – NBFC-ICC and NBFC-IFC | | (per cent) | | | Sep-21 | Mar-22 | Sep-22 | Mar-23 | Jun-23 | Sep-23 | | NBFC-ICC | 44.1 | 46.2 | 47.3 | 47.0 | 46.0 | 48.1 | | NBFC-IFC | 27.5 | 31.3 | 32.2 | 31.5 | 32.9 | 29.5 | Note: Share of bank borrowing as a per cent of their respective total borrowings (including subscription to debentures and CPs).
Source: RBI supervisory returns. | 1.127 The asset side of the balance sheets of these two categories of NBFCs present different risk profiles. While NBFC-ICCs focus on retail lending, NBFC-IFCs predominantly lend to the industrial sector (Chart 1.94 a and b). 1.128 Between September 2021 and September 2023, retail lending by NBFCs grew at a CAGR of 25.2 per cent as against a growth of 15.7 per cent in their gross credit. As at end-September 2023, NBFC-ICCs’ share was 90.1 per cent of total retail credit, with NBFC-MFIs accounting for the remaining 9.9 per cent. Consumer loans, on which risk weights were increased recently53, formed 44.7 per cent of the incremental retail loan growth over the last one year (Table 1.15). Moreover, share of unsecured loans in the NBFC sector rose from 24.6 per cent in March 2020 to 31.9 per cent in September 2023 and grew at a CAGR of 20.7 per cent.  1.129 NBFC-IFCs had a share of 75.1 per cent in gross industrial credit by the NBFC sector, with the top ten sectors accounting for 83 per cent of their large loans. NBFC-IFCs have become particularly sensitive to stress in the power sector, which forms two-thirds of their large exposures (electricity generation at 36.2 per cent; electricity distribution at 25.7 per cent; and others at 3.2 per cent). Overdues of loss-making power distribution companies (DISCOMs), despite recent decline, could also add stress to the electricity general companies. | Table 1.15: NBFC Retail Lending | | (per cent) | | | Mar-22 | Sep-22 | Mar-23 | Sep-23 | Mar-23 | Sep-23 | Mar-23 | Sep-23 | | Share in Retail Lending | Share in Retail Lending | Share in Retail Lending | Share in Retail Lending | Y-o-Y Growth | Weighted Contribution to Growth
(percentage share) | | Retail Loans | | | | | 25.8 | 32.5 | | | | Housing Loans | 2.8 | 2.9 | 3.1 | 3.3 | 39.3 | 46.9 | 4.2 | 4.5 | | Consumer Durables | 3.0 | 3.0 | 3.0 | 3.2 | 27.2 | 40.1 | 3.1 | 3.9 | | Credit Card Receivables | 3.9 | 4.4 | 4.2 | 4.1 | 34.5 | 22.6 | 5.2 | 3.2 | | Vehicle/ Auto Loan | 40.0 | 38.5 | 36.5 | 36.2 | 14.6 | 22.7 | 22.7 | 28.7 | | Education Loan | 1.7 | 2.2 | 2.4 | 3.0 | 79.0 | 79.9 | 5.2 | 5.8 | | Advances against Shares/ Bonds etc. | 1.6 | 1.6 | 1.3 | 1.5 | 7.9 | 28.7 | 0.5 | 1.5 | | Other Retail Loans | 47.1 | 47.4 | 49.5 | 48.6 | 32.2 | 33.6 | 59.1 | 52.3 | Note: Data as on December 15, 2023.
Sources: RBI supervisory returns and staff calculations. | 1.130 Thus, the growing interconnectedness between banks and NBFCs through the funding route and idiosyncratic risks posed by different types of NBFCs could potentially increase contagion risk for banks (Box 1.2). Moreover, as the stress test results in Chapter 2 of this report show, a weaker tail of NBFCs remain vulnerable to liquidity risks under hypothetical adverse scenarios. Box 1.2: Resilience of Banking System to Contagion Risk from NBFC Sector Growing bank-NBFC interlinkages could be a source of systemic risk as vulnerabilities in the NBFC sector could amplify financial system stress and spillovers to the banking system. Bank lending to NBFCs grew by 70.7 per cent during September 2020 to September 2023, which far exceeded the growth of 50.2 per cent in aggregate bank credit. Moreover, bilateral exposures between banks and NBFCs show that most of the NBFCs have a net borrowing position with banks (Chart 1 a). In a simulation exercise, scenarios assume simultaneous default of top 3 and top 5 NBFCs, which have the potential to cause maximum solvency losses to the banking system. The results show that the solvency losses of the banking system under such hypothetical shocks have been on a rising trajectory since September 2021, co-moving with the increasing exposure of banks to the NBFC sector (Chart 1 b).
The impact of losses on capital was subsequently adjusted by assuming a recovery rate of 20 per cent. The results show that, despite the contagion effect, both CET1 ratio and CRAR of the banking system will remain above the regulatory minimum as there are ample capital buffers (Chart 2 a and b). A weak tail of banks with lesser buffers could, however, see their capital levels falling below the regulatory minimum (Chart 3 a and b). Overall, the banking system remains resilient to contagion risk from the NBFC sector. The presence of weak tail of banks and growing interlinkages between banks and NBFCs, however, necessitate both nimble and proactive regulatory and supervisory monitoring and actions that prevent build-up of systemic risk and shore up capital buffers of weak banks to improve their resilience. | I.2.12 Micro, Small and Medium Enterprises (MSME)54 1.131 Both public and private sector banks increased their lending to the MSME sector in H1:2023-24 (Chart 1.95). The strong growth, despite the expiry of the Emergency Credit Line Guarantee Scheme (ECLGS), introduced during the COVID-19 pandemic, points to the underlying growth momentum of the sector. 1.132 The quality of the MSME portfolio of SCBs improved further, with GNPA declining to 4.7 per cent in September 2023 from 6.8 per cent in March 2023 and 7.7 per cent in September 2022. SMA-2 accounts, however, rose slightly to 1.7 per cent in September 2023 from 0.9 per cent in March 2023. Sector-wise analysis of NPAs of loans extended under the ECLGS indicates that services and trade, which formed a third of the ECLGS disbursements, remained stressed and accounted for nearly half of the total delinquencies. The overall GNPA of loans extended under the ECLGS rose to 6.5 per cent in September 2023 from 5.5 per cent in March 2023 (Chart 1.96). I.2.13 Microfinance 1.133 Credit to the microfinance sector grew rapidly at 33.7 per cent (y-o-y) in quarter-ended September 2023, with both banks and non-bank lenders recording double digit growth. NBFC-MFIs continue to dominate the sector, followed by banks, which together account for 71.5 per cent of total lending to the microfinance segment since the review of microfinance regulatory norms in March 202255. NBFC-MFIs and other NBFCs continue to see robust credit expansion, with their combined lending increasing by 43.8 per cent in the last one year. Alongside, SFBs’ lending to the sector also recorded over 50 per cent growth (Chart 1.97). 1.134 Delinquency in the microfinance segment, measured in terms of 90+ days past due (dpd), presents a mixed picture. While delinquency levels rose for banks, they fell for other lenders. On the other hand, the portfolio at risk of slippage, measured by 31-89 dpd, increased marginally at the aggregate level, though it improved for banks and NBFCs (Chart 1.98 a and b).
I.2.14 Consumer Credit 1.135 Consumer credit gained momentum in Q2:2023-24, with inquiry volumes increasing across product categories. Credit card and personal loan categories witnessed maximum inquiries (Chart 1.99). 1.136 The quality of incremental credit has improved, with the share of lower-rated borrowers56 declining at the overall industry level as well as at the bank group level. Similarly, portfolio performance continues to improve, with declining levels of delinquencies across lender groups (Chart 1.100 a and b). 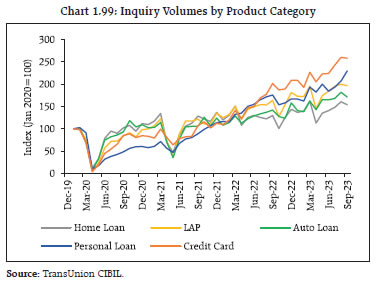 1.137 Notwithstanding the low level of delinquencies, there are some signs of risk build up in consumer credit. First, the transition matrix for consumer loans and personal loans showed an increase in their risk profiling, with downgrades exceeding upgrades. Second, relatively high vintage delinquency57 of personal loans (8.2 per cent) indicates declining standards of underwriting. Third, 42.7 per cent of customers availing consumption loans58 already had three live loans at the time of origination and 30.4 per cent of customers have availed more than three loans in the last six months. Fourth, 7.3 per cent of customers availing a personal loan below ₹50,000 had at least one overdue personal loan. I.2.15 Housing Sector 1.138 The all-India House Price Index (HPI) moderated to 3.4 per cent in Q2:2023-24 from 5.1 per cent in the previous quarter and 4.5 per cent a year ago. On a sequential (q-o-q) basis, the all-India HPI contracted by 1.2 per cent, reflecting some normalisation of prices after the uptick in the post-pandemic period. Moderation in house prices and rentals reflects lower demand pressures in the housing market (Chart 1.101 a). With the slowing momentum in house price growth in Q2:2023-24, prices are moving close to their trend and the house price gap has turned marginally negative (Chart 1.101 b). 1.139 After witnessing deceleration in Q1:2023-24, both sales and new project launches picked up in Q2:2023-24. Consequently, inventory overhang declined during the same quarter (Chart 1.102). 1.140 Housing loan growth remained flat. Commercial real estate (CRE) loans, however, witnessed a pick-up from a low base. Despite the tightening of mortgage rates, NPAs in the housing sector remain relatively stable (Chart 1.103 a and b).
I.2.16 Financial System Stress Indicator59 1.141 The Financial System Stress Indicator (FSSI), a comprehensive indicator of the aggregate stress level in the Indian financial system, showed easing of stress in the Indian financial system during the first two quarters of 2023-24. The decline in stress level was broad-based across financial markets and financial institutions. The major contributor to the fall in the FSSI was the equity market, which saw higher net foreign portfolio inflows, better performance, and lower implied volatility. Stress in the government debt market has also receded significantly, driven by fall in yields and volatility. Money market stress reduced as spreads between rates on short-term money market instruments such as CPs, certificates of deposit (CDs) and treasury bill rates narrowed. Low volatility in the exchange rate and forward premia contributed to easing of stress in the forex market. Improving asset quality and profitability contributed to reduction in stress in banking and NBFC sectors, whereas growing mutual fund inflows helped ease stress among AMCs (Chart 1.104 and 1.105). 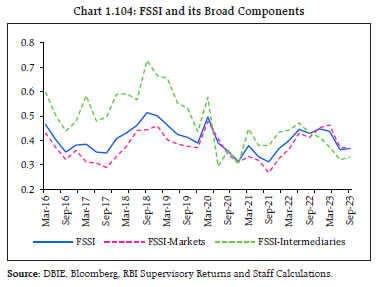
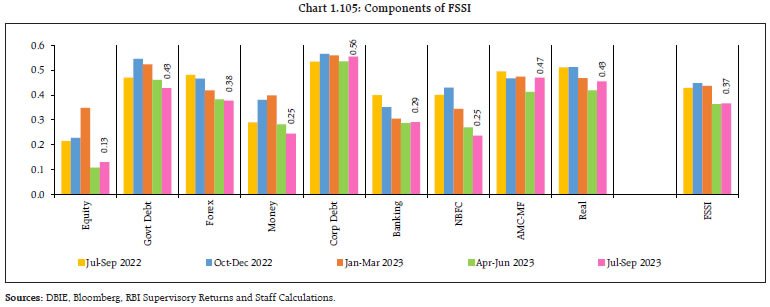 I.2.17 Systemic Risk Survey 1.142 The systemic risk survey conducted among financial sector professionals and academicians in November 2023 showed that risk perceptions across major categories of risk have either receded or remained unchanged, except macroeconomic risks. Risks from global spillovers receded but continued to remain in the ‘high’ risk category. The major drivers of global risks such as global growth, banking turmoil and risk emanating from monetary tightening in advanced economies were perceived to have moderated, except commodity price risk. Macroeconomic risks witnessed a marginal uptick but remained in the ‘medium’ risk category. Among drivers of financial market risks, interest rate risk was gauged to have moderated. Cyber risk, a key component of institutional risk, increased marginally and moved up to the ‘high’ risk category. 1.143 Panelists felt that going forward, tightening of global financial conditions and increase in commodity prices, particularly crude oil, remain major risks (Chart 1.106). About one-fourth of the respondents reported that their confidence in the stability of the global financial system has declined over the last six months. In contrast, for over 95 per cent of the respondents, confidence in the stability of the Indian financial system either increased or remained unchanged. 80 per cent of them perceived that geopolitical events in West Asia will have low to medium impact on the global economy and financial markets and 60 per cent of them perceived that tightening of global financial conditions may have a minor impact on the Indian financial markets. 1.144 Underlining the resilience and strength of the Indian banking sector, about 80 per cent of the respondents assessed that the prospects of the Indian banking sector have either improved or remained unchanged over a one-year horizon. About 83 per cent of them expected either improvement or no change in banking sector asset quality over the next six months due to better growth prospects, improvement in credit profile of corporates and better underwriting standards of banks. Similarly, about 62 per cent of the respondents expected credit demand to either improve or remain unchanged over the next six months due to higher corporate demand, improvement in manufacturing sector activity and higher public investment in infrastructure. Summary and Outlook 1.145 The global economy is confronting multiple challenges of low growth prospects, large public debt, geo-economic fragmentation, and elevated though receding levels of inflation. Risks to near-term global growth outlook remain tilted to the downside. The global financial system displays more resilience since the March 2023 banking turmoil, but financial stability could be tested if monetary policy remains tight for longer than anticipated and growth slows further. 1.146 Despite a challenging global backdrop, the Indian economy is exhibiting sustained momentum and resilience. The domestic financial system remains sound and is bolstered by the improving health of financial institutions. Pre-emptive regulatory measures taken recently are expected to moderate the build-up of stress emanating from rising unsecured loans and rapid growth in consumer credit. Global spillovers, rising interconnectedness in the domestic financial sector and the increasing role of NBFCs in the provision of financial services remain contingent risks. Banking capital, regulatory prudence and strong balance sheets, however, should ensure that the domestic banking system is well positioned to withstand shocks and support the productive needs of the economy.
|