The global financial system remains resilient and financial conditions stable despite an uncertain and challenging backdrop marked by last mile disinflation process, elevated public debt, geopolitical tensions and economic fragmentation. The Indian economy and the financial system, on the other hand, strengthened by solid macroeconomic fundamentals and healthy balance sheets of financial institutions, are exhibiting robust growth and greater resilience. Introduction 1.1 Since the December 2023 issue of the Financial Stability Report (FSR), the global financial system has shown remarkable resilience, weathering the halting progress in the last mile of disinflation, financial stability risks stirred up by higher for longer stance of monetary policy and bouts of volatility unsettling financial markets on incoming data. As market expectations about the future course of monetary policy re-aligned with policy guidance, financial conditions have stabilised and risks of a hard landing have receded. Nonetheless, financial stability risks remain significant in the context of diverging economic conditions across geographies, stretched asset valuations amidst flux in volatility fear gauges, high levels of global debt and commercial real estate strains. Prolonged geopolitical tensions and potential shocks to logistics and supply chains remain a clear and present threat with spillovers to commodity prices, the ongoing disinflation and eventually to the global economic outlook. 1.2 Against this backdrop, the International Monetary Fund (IMF) has projected1 global growth to remain steady at 3.2 per cent in 2024 as in 2023, 0.3 percentage points higher than in its October 2023 World Economic Outlook update (Chart 1.1 a). The World Bank, on the other hand, projects global growth to be lower at 2.6 per cent in 2024 (Chart 1.1 b).
1.3 The goal of bringing inflation down to targets remains the key focus of monetary policy authorities the world over, although headwinds are being encountered from sticky services inflation, elections across half the world’s population, and the recent firming up of commodity prices, besides persisting geopolitical tensions (Chart 1.2 a and b). 1.4 In this uncertain international economic and financial environment, the Indian economy is exhibiting resilience and remains the fastest growing major economy. Moreover, India’s contribution to global growth is rising and currently stands at 18.5 per cent in 2023-242. 1.5 Real GDP growth is on a rising trajectory, supported by macroeconomic and financial stability. Inflation is moderating, albeit at an uneven pace, fiscal consolidation is underway and the external sector position is improving in spite of global spillovers. The domestic financial system is well buffered with strong capital and liquidity ratios, declining levels of asset impairment and rising profitability (Charts 1.3, 1.4, 1.5 a, b and c).
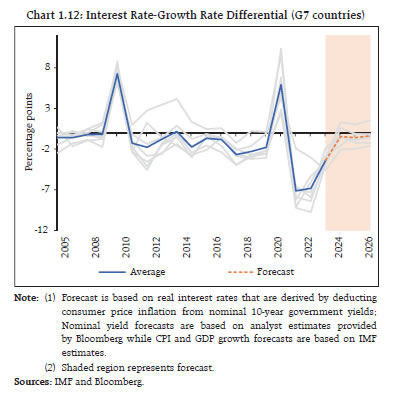
1.6 India’s financial system is bank dominated and, therefore, sound health of the banking system is a sine qua non for preserving financial stability. Banks’ balance sheets are consistently improving, with multi-year low non-performing asset (NPA) ratios, higher provisioning, stronger capital positions and robust earnings (Chart 1.6). In turn, these developments are catalysing a broad-based and sustained credit expansion. I.1 Global Backdrop I.1.1. Macrofinancial Development and Outlook 1.7 A key feature of the evolving global economic outlook has been the recent alignment between market expectations and policy stances. The resilience of growth has allayed fears of hard landing and pushed out expectations of early interest rate cuts in response to central banks’ discomfort about inflation remaining elevated relative to targets persistently; more recently, policy paths are increasingly expected to diverge as macroeconomic conditions move disparately in different regions of the world (Chart 1.7). 1.8 Financial conditions remain stable, with equity markets scaling new highs and credit spreads narrowing. Volatility has largely remained subdued but intermittent reversals have signalled unease in investor perceptions around potential flux (Chart 1.8 a and b). 1.9 The pace of balance sheet reduction of AE central banks has been measured so far even as they reassess banks’ liquidity requirements in the context of ongoing quantitative tightening and fiscal developments (Chart 1.9). 1.10 According to the IMF, the medium-term outlook3 is characterised by weak productivity and retreat in globalisation and global growth is expected to decline by more than a percentage point by the end of 2020s compared to the pre-pandemic average (Chart 1.10). Risks from geo-economic fragmentation and elevated debt call for closer global coordination of policy actions in order to secure and preserve macroeconomic and financial stability. I.1.2. Global Macrofinancial Risks 1.11 While several near-term risks have receded, the global financial system continues to face heightened uncertainty surrounding the outer-term outlook for both financial markets and financial institutions. These shadows are cast by elevated levels of public debt, stretched asset valuations, stress in the commercial real estate (CRE) sector, risks in private credit and cyber risk in addition to the persistence of geopolitical risks. A. Elevated Public Debt 1.12 The frenetic expansion of global public debt in recent years has accentuated concerns about its sustainability. These worries are exacerbated by elevated interest rates and rollover risks for many overburdened economies. Global public debt has increased to 93.2 per cent of GDP by end-20234 - nine percentage points above its pre-pandemic level – bloated by pandemic-era expansionary fiscal policies, post-pandemic supportive measures such as tax breaks and subsidies. The rollback of supportive measures has also been slow. Worryingly, the two largest economies in the world, viz., the U.S. and China, are leading the increase in global debt (Chart 1.11 a and b). 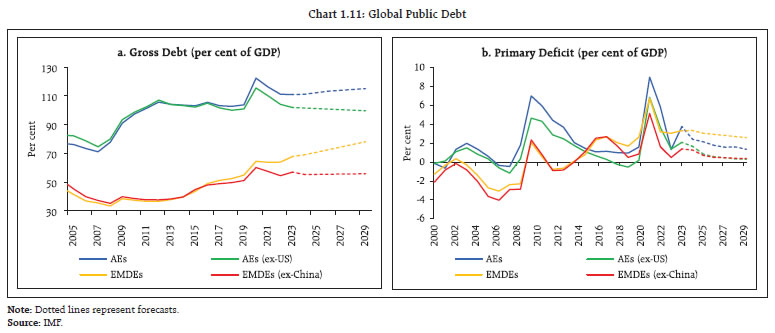 1.13 The narrowing of the interest rate – economic growth rate differential against the backdrop of elevated interest rates and slowing growth is undermining debt sustainability (Chart 1.12). With several countries holding national elections in 2024, any related surge in government spending and widening of fiscal deficits may exacerbate the debt overhang, alongside costs associated with geopolitical tensions and green transition.
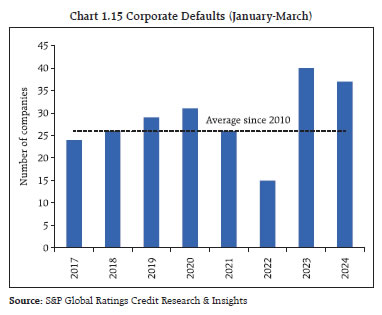
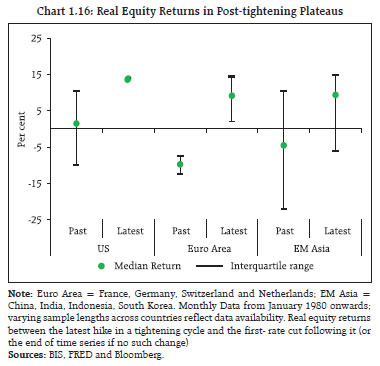
 1.14 The threat of a looming debt crisis cannot be overemphasised. Fiscal consolidation took a backseat in 2023 as global fiscal deficit increased to 5.5 per cent of GDP on an average – a rise of 1.6 percentage points from the previous year. At the same time, high debt levels and narrowing interest-growth differentials have pushed debt-stabilising primary deficit lower by 2 percentage points of GDP on an average in advanced and emerging market economies5. Alongside mounting public debt, private debt also remains elevated. At US$ 251.4 trillion, global debt stood at 239.9 per cent of GDP, with public debt at US$ 97.7 trillion and private debt at US$ 153.7 trillion as at end-20236. We are in a debt supercycle with significant long-term structural imbalances7, which makes the financial system susceptible to frequent disruptions and overall macroeconomic instability. 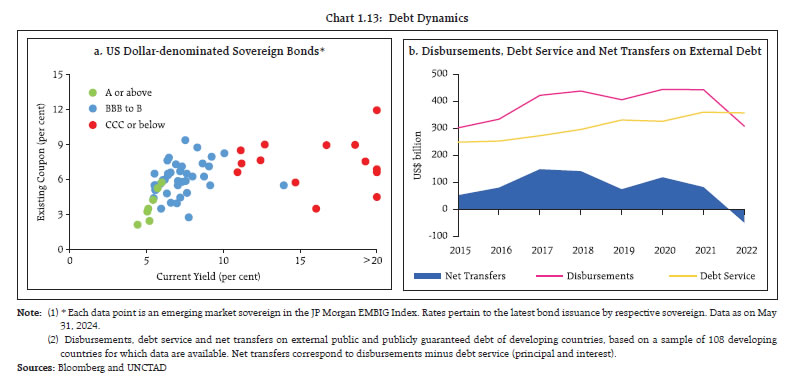 1.15 The sharp rise in global public debt, especially among the two largest economies, poses significant spillover risks to EMEs, where low income and low-rated countries are particularly vulnerable. Surging interest rates have caused 18 sovereign defaults in 10 developing countries in the last three years alone, surpassing the total for the preceding two decades and interest payments have quadrupled in the past decade8. Meanwhile, according to the IMF, nine low-income countries are presently in debt distress, and an additional 25 countries are at high risk of debt distress9. These economies face higher refinancing costs and elevated interest rates forcing them to make difficult choices in terms of servicing debt or making investments in health, education and infrastructure (Chart 1.13 a and b). 1.16 Coexistence of high debt levels and elevated interest rates can feed a vicious cycle of financial instability through impairment of government and private-sector balance sheets. For emerging and low-income countries, this poses challenges to their developmental prospects and their fight against hunger and disease, portending social unrest and conflict-related welfare losses. Global institutions and lenders need to consider measures to enable such borrowers to calibrate fiscal consolidation by considering country-specific circumstances. B. Stretched Asset Valuations 1.17 Since the December 2023 FSR, financial markets have remained buoyant and generally risk-on. Equity markets and bond yields have rallied, volatility has declined and corporate bond spreads have narrowed (Chart 1.14 a, b and c). A sharp increase in prices of relatively riskier assets has followed in the wake of the exceptionally rapid monetary tightening. While stocks have been supported by strong earnings, with price-to-earnings (P/E) ratios close to historical averages, the narrowing of corporate spreads have coincided with rising episodes of corporate defaults (Chart 1.15). The average correlation among equities, bonds, credit and commodity indices is higher than the historical 90th percentile10 in both AEs and EMEs. The latest monetary policy cycle has witnessed a departure from past patterns when monetary tightening was associated with risk-off sentiment and decline in prices of riskier assets (Chart 1.16). To the extent valuations are stretched, sudden shocks could precipitate stress that spreads contagiously across financial market segments through correlated sell-offs and band-wagon effects. Moreover, the growing importance of the role of non-bank institutions in financial intermediation and higher and hidden leverage could amplify stress even further in the face of large shocks, leading to materialisation of debt vulnerabilities and rise in credit losses. 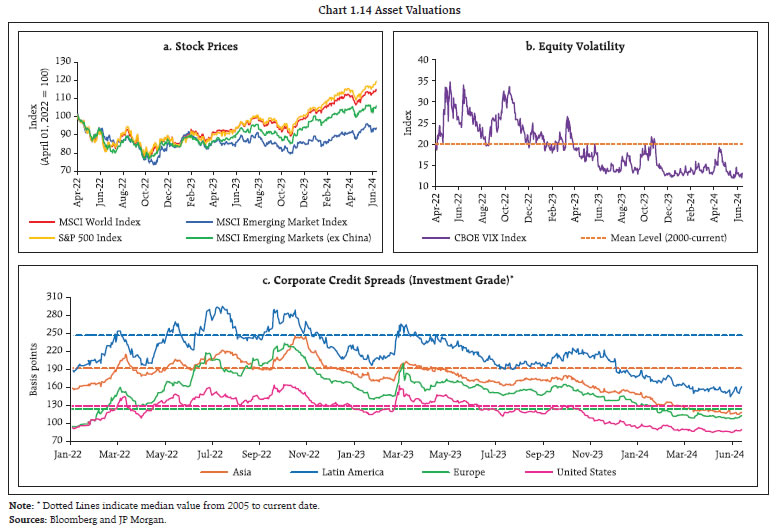
 1.18 Stretched asset valuations have been co-terminous with a strong US dollar (USD) as market expectations have gravitated towards prospects of higher interest rates in the US than in other economies. Moreover, the unrelenting strength of the USD is being bolstered by currencies such as Japanese Yen dropping to historic lows and sustained downward pressures on other currencies (Chart 1.17). 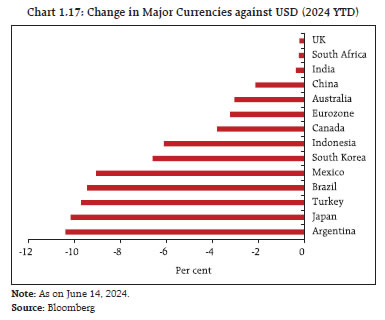 1.19 Besides interest rate differentials and currency depreciations, risks to the global economy, especially the EMEs, are being transmitted through multiple channels. First, commodity prices and the USD are moving in tandem in a break from their historical inverse behaviour11 (Chart 1.18). This can compound inflationary pressures for EMEs, especially commodity importers, dampening consumer spending, investment and economic growth. Second, the strong USD can increase debt service costs and prompt rating downgrades, limiting their access to global capital markets. Third, capital flows could become even more volatile. C. Stress in the Commercial Real Estate Sector 1.20 Commercial real estate (CRE) prices have declined sharply across countries. According to the IMF, CRE prices fell by 12 per cent globally in real terms over the past year12 with the sector also remaining vulnerable to higher vacancy rates and rising financing costs. CRE loans account for a substantial share of all bank loans in many countries and banks exhibit high sensitivity to expected and unexpected CRE losses, as reflected in relatively high CRE coverage ratios13 (Chart 1.19 a and b). Importantly, CRE exposures are concentrated in small and medium sized banks while large and global systemically important banks (GSIBs) have little exposure (Chart 1.19 c). 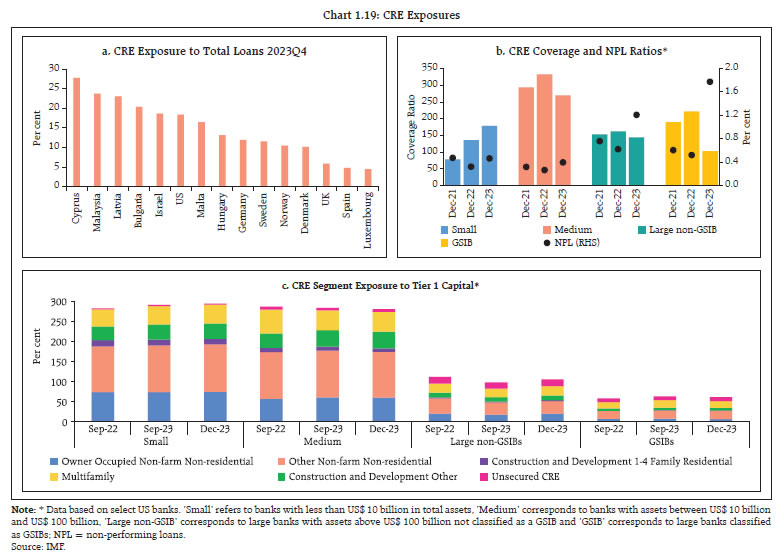 1.21 Increasingly, bank profitability and market valuations are interacting in multiple ways14. Short sellers have been targeting banks with large CRE exposure, as evident from the sharp fall in stock prices of a few banks that declared losses on their CRE portfolios. The resulting erosion of investor confidence makes it difficult for these banks to access funding markets which, in turn, undermines their resilience, especially if CRE prices decline further or outlier banks announce large losses. Another source of contagion stems from large exposure of non-bank financial institutions (NBFIs) to the CRE sector and their interlinkages with the banking system with potential knock-on effects on the broader banking system (Chart 1.20 a and b). D. Geopolitical Risks 1.22 The recent flaring of military conflicts and their disruptive persistence has heightened the focus on risks to the global economy from geopolitical tensions, especially from their transmission through trade, inflation and confidence channels. Potential threats to financial stability stem from volatility imparted to capital flows and asset prices, dampening of investor sentiment, unsettled financial markets and strains on balance sheets of financial institutions through deterioration in asset quality and profitability15. 1.23 The geopolitical risk index (GPRI)16 - constructed by counting the number of newspaper articles related to adverse geopolitical events as a share of the total number of newspaper articles at a monthly frequency - has spiked alongside sharp increases in trade restrictions and financial sanctions, reversing the gains from several decades of global economic integration. Inevitably, these developments portend strains to the international monetary system, undermining the efficiency of the global payment system (Chart 1.21 a and b). 1.24 Episodes of geopolitical tensions have generally been associated with spikes in crude oil prices and disruptions in supply conditions, which could interact with other channels and amplify stress on the real economy and the financial system (Chart 1.22).
E. Risks stemming from Private Credit 1.25 Private credit, which is essentially provided by non-bank lenders to corporates on a bilateral basis, has grown four-fold over the last ten years, emerging as a major source of corporate financing among middle-market firms that have low or negative earnings, high leverage, and lack of high-quality collateral (Chart 1.23 a and b). Private credit offers flexibility, quick execution and greater confidentiality. From a lender’s perspective, returns on these investments, though riskier, are consistently superior during prolonged period of low interest rates, attracting investors to these types of investments. 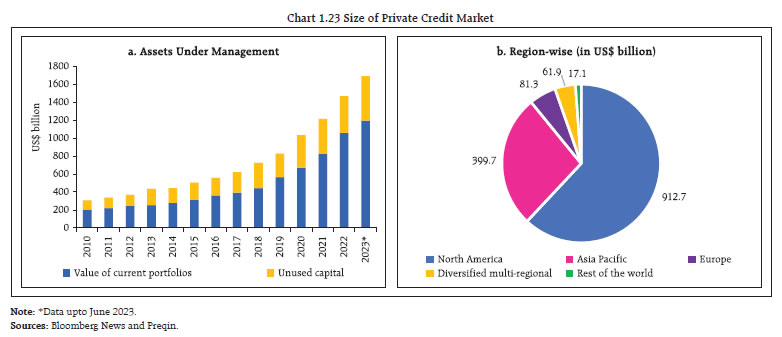 1.26 Private credit is not constrained by financing from banks that are subject to prudential regulation and supervisory oversight, or finance raised in capital markets subject to market discipline and price discovery. The rapid growth of private credit, increasing interconnectedness with banks and NBFIs and opacity can create vulnerabilities that could become systemic. The key dimensions through which these risks could be propagated are17: 1) riskier borrowers than counterparts in traditional lending spaces who could generate outsized losses; 2) investors, particularly insurance companies and pension funds, who could experience large capital losses with systemic implications; 3) private credit structures are becoming complex, adding multiple layers of leverage; 4) liquidity risks amplified by growing retail presence and higher redemption rights; and 5) interconnectedness with other segments of financial system. Banks are increasingly accessing private credit market in ways that allow them to manage regulatory costs and generate fee-based income whereas insurers and pension funds are increasing their exposure to less-liquid investments. Meanwhile, private equity (PE) firms are increasing their ownership stakes in life insurance companies and banks are originating their own private credit deals using minority stakes in private debt funds and business development companies. Data gaps also pose a challenge in monitoring of developments. Finally, private credit is yet to be tested in a credit cycle downturn and sharp losses could lead to a loss of confidence in the asset class as a whole. F. Cyber Risk 1.27 With increasing digitalisation of financial services, the recurring intensity of cyberattacks has dominated financial stability concerns. The disruptions range from security bypasses and information disclosure to denial of services. The number of publicly reported cyberattacks has been rising globally at an alarming pace, with the share of attacks in the financial domain increasing at a rapid pace (Chart 1.24 a). Ransomware crypto payments, business email compromises and cost of data breaches surged to a new high during 2023. The financial sector has reported over 20,000 cyber intrusions and digital attacks, which resulted in losses amounting to US$ 20 billion over the last 20 years18. Furthermore, cyberattacks are found to swell during periods of political and economic uncertainty such as geopolitical tensions, with disruptive consequences (Chart 1.24 b). 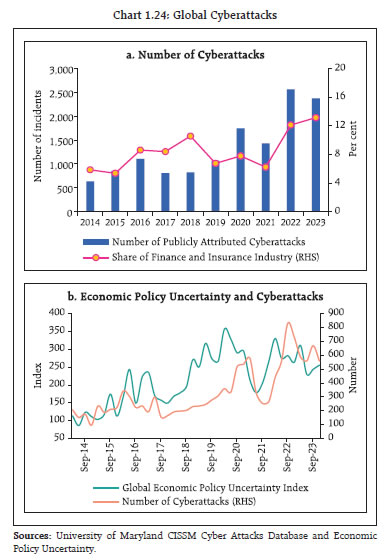
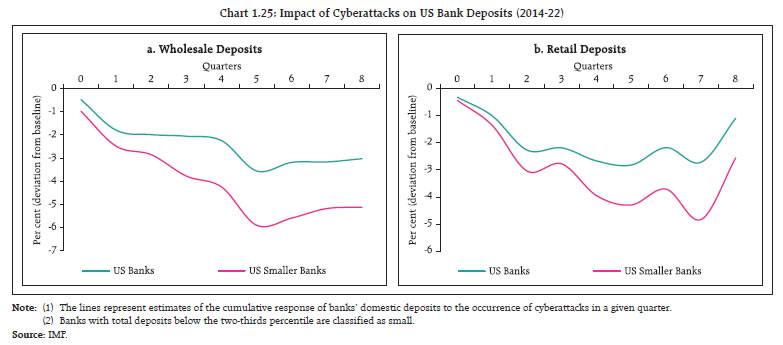 1.28 In extreme cases, spillovers from cyberattacks can cause “cyber runs” in terms of affecting the efficiency of payment systems and bank deposit flows, with smaller banks being particularly vulnerable (Chart 1.25 a and b). 1.29 Automated programming interfaces (APIs) that have facilitated the rise of Fintech and open banking have supported new revenue streams as well as improved customer experience, but they are becoming preferred cyber abuse targets. Cyber incidents can have systemic impact if financial market infrastructure is disrupted. In the recent past, multiple incidents involving payment and settlement systems have led to significant disruptions in interbank transactions and payment failures19. Dependence of financial institutions on artificial intelligence (AI) and third-party information technology (IT) also have associated risks that could intensify in tightly interconnected institutions. In face of these challenges, regular vulnerability checks at all levels remain a prerequisite. As disruptions from cyberattacks spread instantaneously across related products and connected parties, countermeasures require real-time monitoring and response capabilities using automated algorithms for identifying anomalous events, with collective action and sharing of critical intelligence measures becoming vital. I.2 Domestic Macrofinancial Risks 1.30 In this uncertain global economic environment, the Indian economy is poised to sustain resilient growth anchored by macroeconomic and financial stability, and a rising contribution to global growth as the fastest growing major economy of the world. Furthermore, unlike other jurisdictions, India’s economic performance is underpinned by domestic demand. Sizeable foreign exchange reserves, high capital and liquidity buffers in the banking system and stronger and cleaner balance sheets of banks, non-banks and corporates provide bulwarks against global shocks. I.2.1 Domestic Growth and Inflation 1.31 Real GDP rose by 8.2 per cent in 2023-2420, up from 7.0 per cent in the previous year, despite muted private and government final consumption and external demand conditions acting as a drag (Chart 1.26). For 2024-25, the India Meteorological Department (IMD) has projected the south-west monsoon season rainfall in the country at 106 per cent of the long-period average (LPA) in 2024. World trade volume is also expected to recover as per the IMF’s assessment, potentially easing the constraint from net exports. The Monetary Policy Committee (MPC) has projected real GDP to grow by 7.2 per cent during 2024-2521. 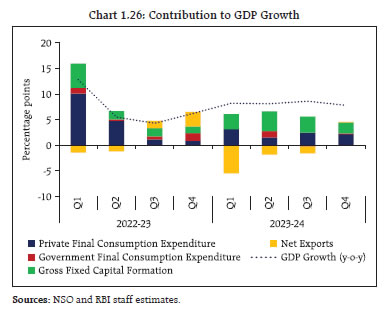 1.32 There are several positives in the near-term economic outlook. First, domestic demand conditions are strengthening, and business optimism is at its highest among major economies of the world. Second, the government’s sustained focus on capital expenditure should crowd-in more private investment through multiplier effects. Third, firms are utilising high profits to augment investible resources while bringing down leverage. Fourth, real estate activity is gathering pace which, alongside public investment on infrastructure, is driving a construction activity cycle. Fifth, exports of services are rising, and their prospects remain bright. Finally, credit growth is deepening, supported by healthier bank balance sheets. 1.33 Downside risks to this outlook stem from global slowdown and spillovers, geopolitical risks and their impact on supply conditions and commodity prices, slack in the rural economy and uncertainties related to weather conditions. 1.34 Headline consumer price index (CPI) inflation is descending to the medium-term target of 4 per cent. It eased to 4.7 per cent in May 2024 from 5.7 per cent in December 2023 but its near-term trajectory remains vulnerable to volatile food prices. Food inflation edged up to 7.9 per cent in May 2024 from 7.6 per cent in January 2024; however, the projection of a above normal south-west monsoon in 2024 augurs well for the upcoming kharif season and can ease pressures on food prices. In contrast, core inflation (i.e., CPI excluding food and fuel) is witnessing a sustained decline - it eased to 3.0 per cent in May 2024, its lowest level in the current CPI series (Chart 1.27). Commodity prices volatility emanating from frequent bouts of geopolitical conflicts alongside the incidence of climate shocks poses risks to the inflation outlook. I.2.2 External Sector 1.35 The resilience of the external sector has supported India’s overall macroeconomic stability. The merchandise trade deficit narrowed to US$ 238.3 billion in 2023-24 from US$ 264.9 billion in the previous year. Both exports and imports recorded positive growth (y-o-y) during the January-March 2024 quarter, which was a turnaround from declines during April-December 2023. Movements in merchandise trade have been largely influenced by the global demand slowdown, with adverse price effects even as volumes registered expansion across major export categories. 1.36 Going forward, the outlook for merchandise trade would be conditioned by the strength of global demand, movements in commodity prices and freight costs, supply chain pressures, especially in major trading routes. Traffic on the Suez Canal – which is crucial for India’s trade with European and North African markets – has more than halved since the Red Sea crisis, forcing rerouting of ships via Cape of Good Hope and increase in transit times as well as concentration of ships on certain critical ports (Chart 1.28). 1.37 The moderation in trade deficit alongside sustained buoyancy in services exports and remittances have led to current account surplus of 0.6 per cent of GDP at current market prices in Q4:2023-24 (Chart 1.29 a, b, c and d). 1.38 In an uncertain global economic and financial environment, India remains an attractive investment destination. During 2023-24, net inflows of foreign portfolio investments (FPI) to India, both debt and equity, recorded a sharp turnaround, reaching its second-highest level ever at US$ 44.6 billion (BoP basis). During the current fiscal year so far (up to June 12, 2024), FPI flows were negative at (-) US$ 3.9 billion. External commercial borrowings (ECB) flows (net of principal repayments and intercompany borrowings) turned positive in 2023-24 from net outflows in the previous year. Also, both rupee-denominated and foreign currency denominated non-resident deposit schemes recorded inflows throughout 2023-24. Foreign direct investment (FDI) flows moderated, partly due to a rise in repatriations from India (Table 1.1). 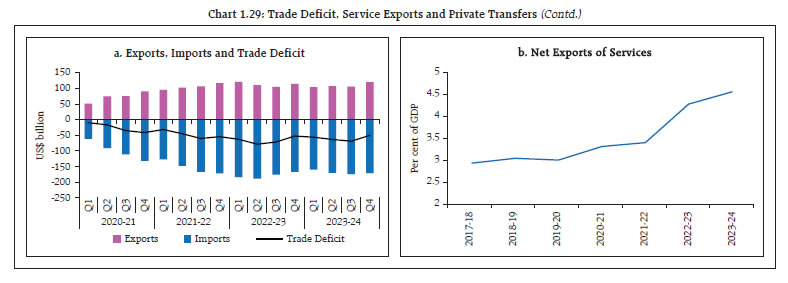 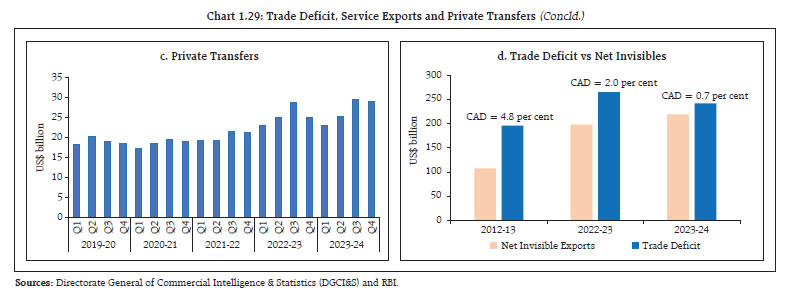
| Table 1.1: Capital Flows | | (US$ billion) | | Component | Financial year so far | Financial Year | | Period | 2024-25 | 2023-24 | 2023-24 | 2022-23 | | FDI (net) | April | 4.0 | 2.8 | 9.8 | 28.0 | | FPI (net) | April-June | -3.9 | 9.0 | 44.6 | -4.8 | | ECB (net) | April | -0.1 | 1.9 | 3.8 | -4.1 | | Non-resident Deposits (net) | April | 1.1 | -0.2 | 14.7 | 9.0 | Note: Data on FPI for financial year so far (June 12, 2024) and corresponding previous year period have been sourced from NSDL, whereas data for full year is based on BoP.
Sources: RBI and NSDL. | 1.39 There has been a rise in both international liabilities and assets and, as a corollary, the build-up of foreign exchange reserves has strong interlinkages with net capital flows to India. In an increasing global interest rate cycle, the servicing cost of debt liabilities and investment income outflows have been rising. Overall, capital flows are expected to remain strong, supported by macroeconomic stability and the positive economic outlook (Chart 1.30). The inclusion of Indian government securities in the JP Morgan Global Bond Index - Emerging Markets from June 2024 and in the Bloomberg Emerging Market Local Currency Government Index from January 2025 also augurs well for the outlook for debt capital flows to India. 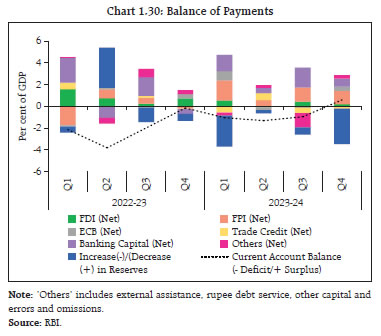
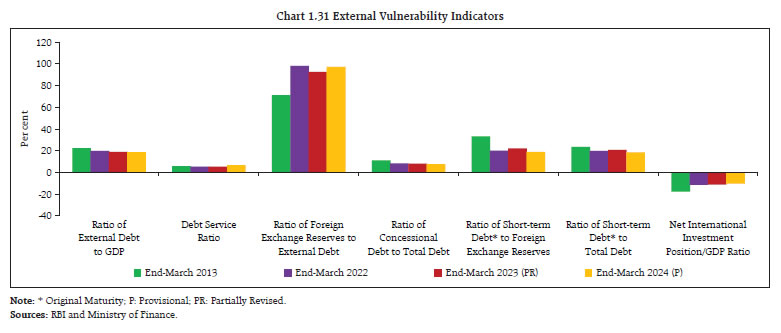 1.40 External vulnerability indicators continue to show improvement: foreign exchange reserves of US$ 652.9 billion as on June 14, 2024 is sufficient to cover over ten months of projected imports for 2024-25; external debt moderated to 18.7 per cent of GDP in March 2024; and the share of short-term debt (with original maturity of up to one year) in total external debt declined to 18.5 per cent in March 2024 (Chart 1.31). I.2.3 Foreign Exchange Market 1.41 The domestic foreign exchange market has remained relatively stable lending support to overall macroeconomic stability in a period of strengthening of the USD against other currencies and bouts of volatility in international foreign exchange markets. The stability of the Indian rupee (INR) is reflected in a variety of indicators ranging from movement in real effective exchange rates,the exchange market pressure (EMP) index22 as well as volatility indicators such as implied volatility derived from option prices and onshore-offshore spreads (Chart 1.32 a, b, c and 1.33 a, b). I.2.4 Corporate Sector 1.42 Corporate sector resilience has been bolstered by strengthening balance sheets and steady earnings. Increased capitalisation of profits has augmented equity of non-financial corporates (NFCs) and supported deleveraging. This is reflected in declining debt-to-equity and NFC debt-to-GDP ratios relative to AE and EME peers (Chart 1.34 a, b and c).
1.43 Among listed private corporates, sales growth diverged across manufacturing firms, information technology (IT) firms and non-IT services firms, and operating profit margins moderated across the major sectors during Q4:2023-24, with sales of manufacturing companies increasing (y-o-y) by 6.1 per cent and those of IT firms moderating to 3.1 per cent in Q4:2022-23 (Chart 1.35 a, b, c and 1.36).
1.44 Despite the rise in interest rates, NFCs are exhibiting stability in key financial indicators. Their interest expenses have increased modestly, but lower leverage has contributed to a stable interest coverage ratio (ICR)23. Moreover, their debt service ratio24 remains below its mean level (between 2007 and 2023), despite 169 bps increase in weighted average lending rates on fresh rupee loans between March 2022 and December 2023 (Chart 1.37 a, b and c). 1.45 Overall, the debt share of NFCs with ICR below unity, a key indicator of a firm’s financial vulnerability, continued to decline (Table 1.2 and 1.3).
| Table 1.2: Debt Share* of Firms Below/ Above ICR Threshold Values | | Items | 2016-17 | 2017-18 | 2018-19 | 2019-20 | 2020-21 | 2021-22 | 2022-23 | 2023-24 | | No. of Companies | 3,238 | 3,231 | 3,205 | 3,163 | 3,103 | 2,963 | 2,990 | 3,073 | | ICR <=1 (per cent) | 35.5 | 34.2 | 34.1 | 37.6 | 34.7 | 32.6 | 21.0 | 18.0 | | 1 < ICR <= 4 (per cent) | 34.8 | 34.3 | 27.6 | 25.2 | 31.5 | 15.2 | 27.9 | 33.3 | | ICR > 4 (per cent) | 29.6 | 31.5 | 38.3 | 37.2 | 33.8 | 52.2 | 51.2 | 48.7 | Note: * Debt includes total liabilities less total equity.
Sources: Capitaline and RBI staff calculations. |
| Table 1.3: Sectoral Share in Sales of Companies with ICR<=1 | | (per cent) | | Year | Manufacturing | IT | Non-IT services | Aggregate | | 2020-21 | 6.8 | 3.0 | 44.1 | 10.5 | | 2021-22 | 5.5 | 1.6 | 36.5 | 9.3 | | 2022-23 | 3.5 | 1.3 | 22.5 | 5.5 | | 2023-24 | 2.8 | 2.0 | 12.2 | 4.0 | | Source: Capitaline and RBI staff calculations. | 1.46 The healthy credit profile of listed companies is also reflected in the rating actions of major credit rating agencies (CRAs). While credit upgrades have remained high in 2023-24 across three major credit rating agencies (ICRA, CRISIL and CARE), downgrades have also edged up moderately in H2:2023-24 (Chart 1.38). I.2.5 Government Finance 1.47 Fiscal consolidation, buoyant tax collections and improvement in the quality of spending have been the distinguishing features of the Union Government’s fiscal position. As per the provisional accounts (PA), the gross fiscal deficit (GFD) was 5.6 per cent of GDP in 2023-24 as against the budget estimates (BE) of 5.9 per cent. Gross tax collections posted double digit growth, driven up by direct tax collections. On the expenditure side, the strategy remained geared towards growth-inducing capital expenditure; growth in revenue expenditure remained muted at 1.2 per cent (Table 1.4). 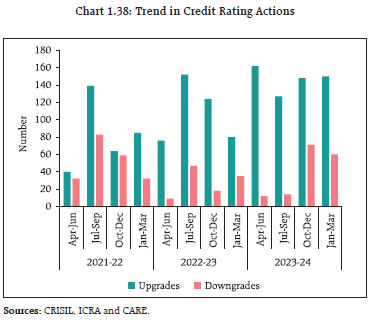
| Table 1.4: Fiscal Indicators – Central Government | | Fiscal Indicators | Amount (₹ crore) | Growth Rate (per cent) | | 2023-24(PA) | 2024-25(BE) | 2023-24(PA) | 2024-25(BE) | | 1. Gross Tax Revenue | 34,64,792 | 38,30,796 | 13.4 | 10.6 | | Direct Tax Revenue | 19,56,645 | 21,98,830 | 17.9 | 12.4 | | Indirect Tax Revenue | 15,08,147 | 16,31,966 | 8.2 | 8.2 | | 2. Tax Revenue (Net) | 23,26,524 | 26,01,574 | 10.9 | 11.8 | | 3. Total Non-Debt Receipts | 27,88,872 | 30,80,275 | 13.6 | 10.4 | | 3. Total Expenditure | 44,42,542 | 47,65,768 | 5.9 | 7.3 | | Revenue Expenditure | 34,94,036 | 36,54,657 | 1.2 | 4.6 | | Capital Expenditure | 9,48,506 | 11,11,111 | 28.2 | 17.1 | | 4. Fiscal Deficit | 16,53,670 | 16,85,494 | -4.8 | 1.9 | | 5. Revenue Deficit | 7,65,624 | 6,53,383 | -28.4 | -14.7 | | 6. Primary Deficit | 5,89,799 | 4,95,054 | -27.1 | -16.1 | Note: PA: Provisional Accounts; BE: Budget Estimate.
Sources: Union Budget Documents and Controller General of Accounts (CGA). |
| Table 1.5: Central Government Finances - Key Deficit Indicators | | (per cent of GDP) | | Item | 2020-21 | 2021-22 | 2022-23 | 2023-24 (PA) | 2024-25 (BE) | | Revenue Deficit | 7.3 | 4.4 | 4.0 | 2.6 | 2.0 | | Gross Fiscal Deficit | 9.2 | 6.7 | 6.4 | 5.6 | 5.1 | | Primary Deficit | 5.7 | 3.3 | 3.0 | 2.0 | 1.5 | Note: PA: Provisional Accounts; BE: Budget Estimate.
Sources: Union Budget Documents and CGA. | 1.48 All major deficit indicators of the Union Government are projected to show further improvement (Table 1.5). The GFD is pegged at 5.1 per cent of GDP in 2024-25 (BE), 46 basis points lower than in 2023-24 (PA). Ongoing improvement in the quality of fiscal adjustment is also reflected in the declining revenue expenditure to capital outlay (RECO) ratio (Chart 1.39 a). Alongside, the share of borrowings directed towards growth-inducing capital outlay has increased from 47.6 per cent in 2023-24 (PA) to 55.7 per cent in 2024-25 (BE). Consequently, the central government’s debt is projected to fall to 57.1 per cent of GDP in 2024-25 (BE) from 58.4 per cent of GDP a year ago, further consolidating public finances (Chart 1.39 b). 1.49 The states’ combined GFD-GSDP ratio for 2024-25 is budgeted at 3.0 per cent, unchanged from the level in 2023-24 (PA) (Table 1.6). The increase in their capital expenditure has improved the quality of spending, as reflected in the RECO ratio and the share of capital outlay in total expenditure (COTE) (Chart 1.40 a). Alongside, states’ debt-to-GDP ratio declined to 27.6 per cent by March 2024 from the pandemic high of 31.0 per cent of GDP in March 2021. The ratio of interest payments to revenue receipts has also moderated (Chart 1.40 b). | Table 1.6: State Government Finances: Key Deficit Indicators | | (per cent of GSDP) | | Item | 2022-23 | 2023-24(PA) | 2024-25 (BE) | | Revenue Deficit | 0.2 | 0.2 | 0.2 | | Gross Fiscal Deficit | 2.7 | 3.0 | 3.0 | | Primary Deficit | 1.0 | 1.4 | 1.3 | Note: (1) Data for 2022-23 and 2023-24 (PA) pertain to 31 States/ UTs and for 2024-25 (BE) pertain to 27 States/UTs. Data for 2023-24 (PA) and 2024-25 (BE) is taken as a per cent of GSDP.
(2) PA: Provisional Accounts; BE: Budget Estimate.
Source: Budget documents of the States; and Comptroller and Auditor General of India. |
1.50 Although India’s general government debt and deficit are higher than peer EMDEs, they are projected to continue to decline over the medium-term (Chart 1.41 a and b). 1.51 Debt dynamics exhibit sustainability due to robust economic growth and lower primary deficits as a direct consequence of fiscal consolidation. The interest rate-growth rate differential (r-g) remains favourable, which augurs well for debt sustainability (Chart 1.42 a). Growth-inducing expenditures such as spending on social and physical infrastructure, climate mitigation, digitalisation and skilling the labour force can further improve productivity, outweigh short-run costs, yield long-term growth dividends and lead to a substantial decline in the debt-to-GDP ratio in the medium-term25 (Chart 1.42 b).
I.2.6 Household Finance 1.52 India’s gross savings rate stood at 29.7 per cent of gross national disposable income (GNDI) in 2022-23, with households being the primary savers and forming 60.9 per cent of aggregate savings (10-year average for 2013-2022 stood at 63.7 per cent). For the household sector, savings in physical assets has been the dominant and rising component. The share of net financial savings in total household savings has been declining: it stood at 28.5 per cent in 2022-23, from an average of 39.8 per cent during 2013-2022. Combined with the rise in financial liabilities, net financial savings also declined to 5.3 per cent of GDP during 2022-23 from an average of 8.0 per cent during 2013-2022 (Chart 1.43 and 1.44). 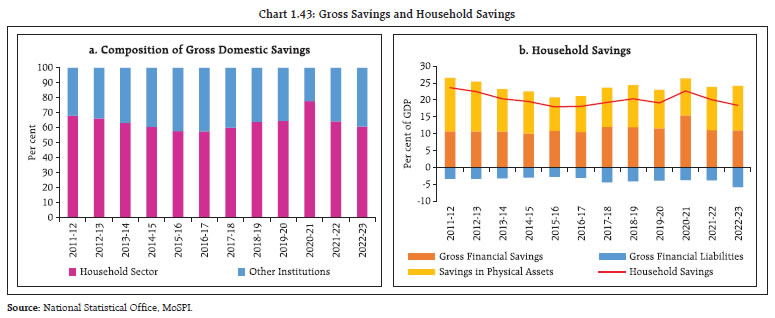
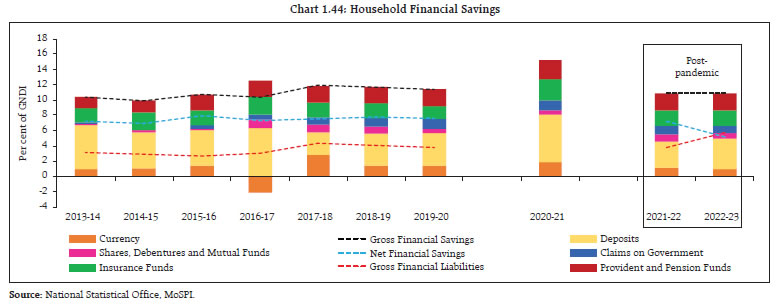 1.53 The sharp rise in household financial savings during the pandemic (51.7 per cent of total household savings in 2020-21) has been drawn down subsequently, as in many other economies, and shifted towards physical assets. Alongside, households are also diversifying their financial savings, allocating more to non-banks and capital markets. 1.54 Financial liabilities of households have risen in the post-pandemic period, as reflected in the surge in retail loan growth for financing both consumption and investment. Alongside, agricultural and business loans have also grown. Notably, more than two-thirds of borrowers are of prime and above credit quality (Chart 1.45 a and b). 1.55 At 40.1 per cent of GDP26, the stock of household debt in India is relatively low when compared to other EMEs, but in relation to GDP per capita, it is comparatively high (Chart 1.46 a and b). With overall household savings declining to 18.4 per cent of GDP in FY:2022-23 from an average of 20.0 per cent of GDP over 2013-2022, and coupled with an increasing trend in financial liabilities, household debt warrants close monitoring from a financial stability perspective.
I.2.7 Money and Capital Markets 1.56 Domestic financial conditions have generally eased since the December FSR, in line with the movements in system liquidity. This is reflected in the easing of money market rates and government securities yields (Chart 1.47 a and b). The weighted average call rate (WACR) generally remained within the policy corridor (Chart 1.47 c).
1.57 Money market spreads narrowed after spiking during January-March 2024, reflecting movements in system liquidity and mutual fund investment patterns. The widening of commercial paper (CP) spreads and subsequent narrowing was primarily driven by mutual fund investments, the main investors in the CP market with an average share of 82 per cent between June 2020 – December 202327. Movements in certificate of deposit (CD) spreads were driven by evolving shifts in banking system liquidity (Chart 1.48 a and b). | Table 1.7: Autonomous Drivers of Banking System Liquidity | | (Amount in ₹ crore) | | Year | 2023-24 | 2024-25* | | Autonomous Drivers of Liquidity | 26,577 | -2,95,569 | | 1. Currency in Circulation | -1,32,749 | -76,120 | | 2. GoI Cash Balances | -2,20,848 | -2,14,198 | | 3. Net Forex Activity of RBI | 3,39,528 | -4,901 | | 4. Excess Reserves | 40,646 | -350 | Note: (1) * Updated till June 09, 2024.
(2) Positive figure denotes increase in banking system liquidity and negative figure denotes decrease in banking system liquidity.
Source: RBI. | 1.58 Among the autonomous drivers of system liquidity, the large changes in government cash balances have been the dominant driver in the recent period as reflected in a high negative correlation (Table 1.7 and Chart 1.49). 1.59 The sovereign yield curve has bull flattened (i.e., long-terms rates fell faster than short-term rates), supported by improving fiscal dynamics, anchoring of inflation expectations and positive sentiments in response to inclusion of Indian government securities in global bond indices29. As a result, the average term spread in the G-sec market (10-year minus 91-day Treasury Bills) narrowed to just 16 bps during January-May 2024 from 35 bps during July-December 2023. Changes in term premiums have been the dominant factor in movements in long-term bond yields, with short-term rates remaining stable (Chart 1.50 a, b and c).
1.60 Between October 2023 and March 2024, corporate bond spreads and those of listed non-convertible debentures (NCDs) over the yield of 3-year benchmark government securities widened marginally across institutions and rating categories (Chart 1.51 a, b and c). 1.61 NBFCs, public sector undertakings (PSUs) and body corporates were the major issuers of corporate bonds, together accounting for nearly three fourths of total issuances. Private placement was the preferred mode of raising funds. Among the investing entities, banks and body corporates held nearly 60 per cent of the total issuances (Chart 1.52 a, b and c). 1.62 Supported by strong macroeconomic fundamentals, healthy corporate balance sheets, robust earnings outlook, stable financial conditions and sustained inflows into domestic mutual funds, the Indian equity market has been consistently outperforming its EME peers. During 2023-24, the Nifty 50 index yielded 28.6 per cent returns in local currency (26.8 per cent in USD terms). Contemporaneously, the MSCI India index posted a return of 35.5 per cent, higher than the MSCI-Emerging Markets index return of 23.2 per cent. Price-to-earnings (P/E) ratios also rose sharply (Chart 1.53 a and b). 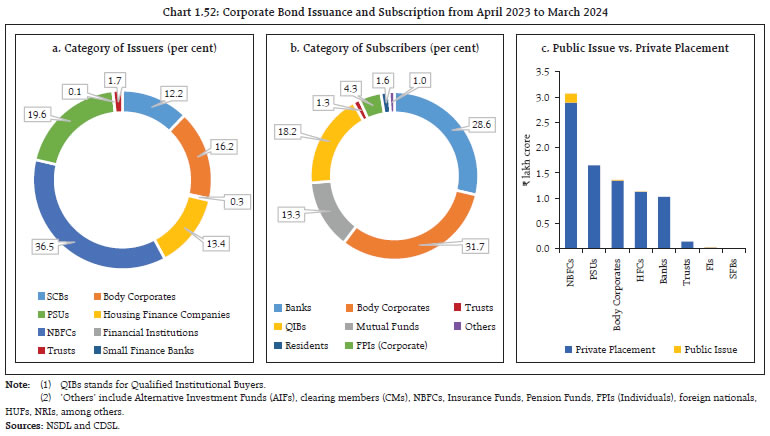
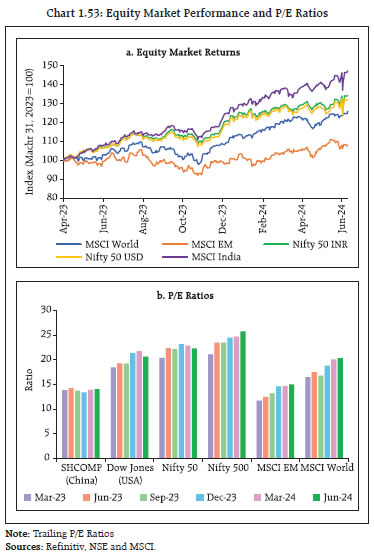
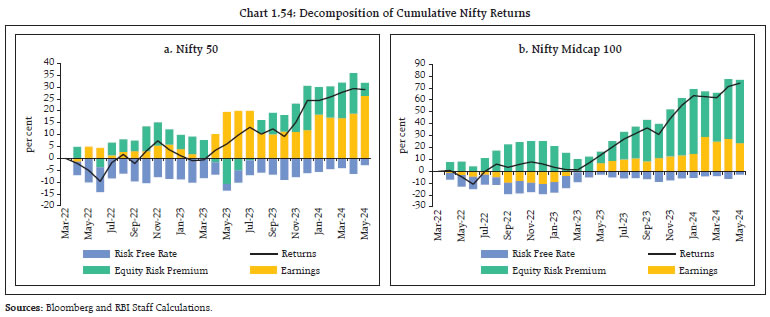 1.63 A standard discounted cash flow model suggests that the rise in the overall Nifty 50 index since March 2022 appears to have been driven mainly by improved earnings projections and to a lesser extent by investors’ risk appetite (declining equity risk premium). Extending the model to analyse the returns on midcap index shows that investors’ higher risk appetite is the major driver of returns when compared to improved earnings projections (Chart 1.54 a and b). 1.64 Equity market volatility has mostly remained lower than that of global indices in terms of both implied volatility based on option prices and realised volatility, except in June 2024 when it spiked in response to general election results (Chart 1.55 a and b). 1.65 Midcap, smallcap and microcap stocks have logged higher returns than Nifty 50 stocks during 2023-24. Consequently, their P/E ratios have also risen sharply (Chart 1.56 a and b and Table 1.8).
| Table 1.8: Returns of Nifty Benchmark Indices | | (per cent) | | CAGR | Nifty 50 | Nifty Midcap 150 | Nifty Smallcap 250 | Nifty Microcap 250 | | 1-year | 29 | 56 | 63 | 85 | | 2-years | 13 | 26 | 23 | 37 | | 3-years | 15 | 25 | 28 | 42 | Note: CAGR w.r.t. March 31, 2024.
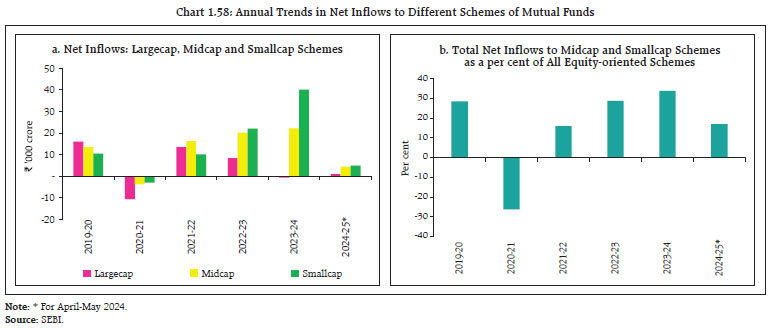
Source: NSE. | 1.66 Analysis of a longer time series of 12-month forward P/E ratios shows that while Nifty 50 and Nifty smallcap 100 are trading close to their historical averages since 2019, Nifty midcap 100 is trading one standard deviation above its historical average (Chart 1.57 a, b and c). 1.67 The rise in prices and valuations of these stocks was driven by a sharp increase in net inflows to midcap and smallcap mutual fund (MF) schemes. Smallcap MF schemes saw net inflows of ₹40,189 crore during 2023-24, even as largecap schemes witnessed net outflows. In 2024-25 so far, all three schemes received net inflows (Chart 1.58 a and b). 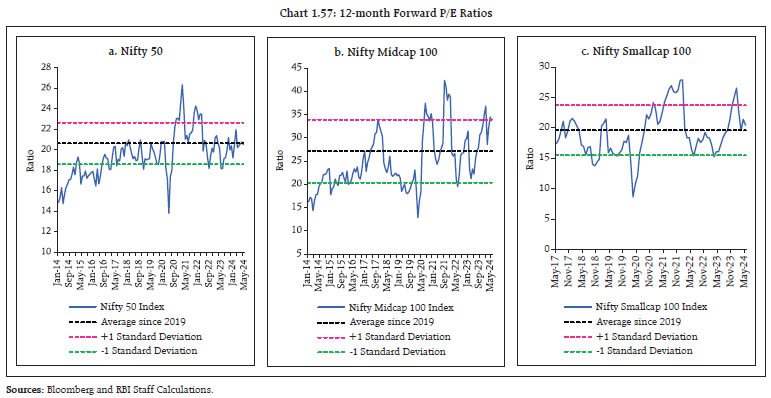
 1.68 The rapid rate at which midcap and smallcap stocks have been rising over the past year and the increase in inflows to MF schemes targeted at these segments have elicited concerns about froth in some pockets of the market. The Association of Mutual Funds in India (AMFI), in consultation with the Securities and Exchange Board of India (SEBI), mandated all Asset Management Companies (AMCs) to disclose risk parameters, viz., time taken to liquidate 25 per cent and 50 per cent of the portfolio, asset and liability side concentration, standard deviation, portfolio beta, portfolio trailing P/E ratio and portfolio turnover ratio of these schemes. As per the disclosure for May 2024, the number of days to liquidate 25 per cent of the portfolio for the top 5 schemes ranged from 4 to 13 days in midcap schemes and 12 to 36 days in smallcap schemes (Table 1.9). 1.69 The equity derivatives segment has been witnessing growing participation from retail investors in recent years. It has gone up by 42.8 per cent from 65.0 lakh during 2022-23 to 95.7 lakh during 2023-24. While trading volumes in derivatives segment has seen exponential growth over the years in notional terms, the trading volumes when measured by the premium turnover, has witnessed a linear growth pattern. The ratio of premium turnover to cash market has remained steady over the last 3 years (Table 1.10). | Table 1.9: Summary of Risk Parameters of Midcap and Smallcap MF Schemes | | | | Midcap Schemes | Smallcap Schemes | | February 2024 | March 2024 | April 2024 | May 2024 | February 2024 | March 2024 | April 2024 | May 2024 | | No. of days to liquidate 25 per cent of portfolio- Range for top 5 schemes w.r.t. AUM | 4 to 17 | 4 to 15 | 4 to 14 | 4 to 13 | 11 to 30 | 10 to 29 | 11 to 27 | 12 to 36 | | Concentration-Assets side (AUM held in per cent)* | Largecap | 13.5 | 14.2 | 14.1 | 14.0 | 6.9 | 7.1 | 6.8 | 6.9 | | Midcap | 65.0 | 65.5 | 67.9 | 68.1 | 11.5 | 11.4 | 12.0 | 11.9 | | Smallcap | 14.2 | 13.7 | 14.9 | 14.8 | 72.7 | 72.6 | 76.4 | 76.4 | | Cash | 3.8 | 3.7 | 3.1 | 3.0 | 6.0 | 5.8 | 5.6 | 5.5 | Note: *Largecap, Midcap and Smallcap are as per AMFI classification.
Source: SEBI. |
| Table 1.10: Derivatives to Cash Ratio | | FY | Derivatives to Cash (notional) Ratio | Derivatives to Cash (premium) Ratio | | 2021-22 | 98 | 2.03 | | 2022-23 | 269 | 2.82 | | 2023-24 | 405 | 2.24 | | Source: SEBI. | 1.70 Globally due to the existence of dark pools, Alternative Trading Systems, and Systematic Internalisers (SI), not all trades get transacted on stock exchanges. In India, these trading facilities are not permitted. Therefore, it may not be appropriate to compare the derivatives to cash market turnover ratio in India with that of global peers. 1.71 Equity derivatives market can improve price discovery and enhance market liquidity in underlying cash markets. It, however, is also associated with higher risks. Since derivatives are more complex than the underlying, investor protection is a key regulatory imperative. A SEBI research published in January 2023 showed that 89 per cent of individual participants in Equity Futures and Options (F&O) lost money in the segment during Fiscal Year 2018-19 and Fiscal Year 2021-22. As part of enhanced customer disclosure, inter alia, brokerages are now also required to disclose this statistic to their clients before they initiate any trade. Moreover, to mitigate risks the regulator follows a conservative approach in the areas of margining, setting of open interest limits, and in the management of clearing and settlement risks. The risk architecture is also unique in India with clearing corporations required to ensure margins are maintained at an individual participant level, and not just at a clearing member level. 1.72 Nevertheless, the rapid rise in F&O volumes in recent years could pose several challenges: retail investors could be impacted by sudden movements in markets without proper risk management and this could have knock-on effects on cash market; rise in popularity of shorter-duration options in indices with few stocks and high volatility could amplify leverage; and preference among investors to reduce holding period and shift from one instrument to another searching for immediate expiries could intensify volatility. Therefore, it is imperative to closely monitor risks emerging from this segment and initiate appropriate and proactive policy response. Accordingly, the SEBI has instituted an Expert Working Group, under the Secondary Markets Advisory Committee, to review F&O markets from both an investor protection and overall systemic risk management perspective. 1.73 The SEBI is also in the process of reviewing the corpus of the Settlement Guarantee Fund (SGF), stress testing methodologies and scenarios for computation of core SGF to build a more resilient settlement system to meet contingencies arising due to failure to honour obligations by any member of a stock exchange. 1.74 FPI inflows to Indian capital markets rose sharply during 2023-24. After being net sellers to the tune of US$ 5.5 billion (equity- US$ 5.1 billion, debt- US$ 0.4 billion) in 2022-23, foreign portfolio investors made second highest recorded net investments of US$ 41.0 billion in 2023-24 in equity (US$ 25.3 billion), debt (US$ 14.2 billion) and hybrid (US$ 1.5 billion) segments. FPI flows, however, turned negative with net outflows of US$ 3.9 billion in the current financial year so far (up to June 12, 2024). On the other hand, domestic investors remain bullish on Indian equities and provide support to the market even during periods of sharp FPI outflows (Chart 1.60 and 1.61). Despite strong FPI flows to India, persistent geopolitical conflicts have emerged as a new source of risk (Box 1.1). 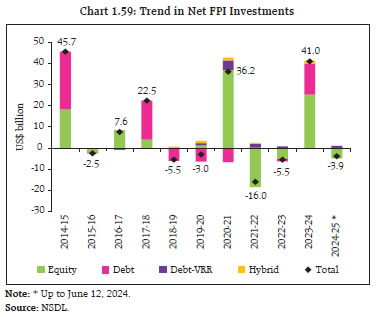

Box 1.1: Geopolitical Uncertainties: Effect on Portfolio Flows and Exchange Rate Volatility Geopolitical tensions threaten financial stability through the financial channel (IMF, 2023), leading to increased asset price volatility and prompting investors to seek safer havens (Table 1). An analysis for the period January 2010 – March 2024 suggests that net FPI inflows to Indian equities have remained lower during months of high geopolitical uncertainty, as measured by the geopolitical risk (GPR) index (Caldara and Iacoviello, 2022) than during other months (Table 2). In fact, the distribution of FPI flows during high and low geopolitical risk periods exhibits a fat left tail, indicating a higher likelihood of outflows from Indian equity markets (Chart 1). The effect of geopolitical uncertainties can be estimated by using a quantile regression framework (Patra et al., 2022) as follows:
| Table 1: Immediate Impact of Geopolitical Incidents | | Early peak period of Geopolitical Incidents | Cumulative FPI Equity flows
(US$ million) | Return on Sensex
(per cent) | | Russian-Ukraine conflict (February 24, 2022 – March 9, 2022) | -6,969.7 | -4.5 | | Hamas-Israel conflict (October 7, 2023 – October 12, 2023) | -247.2 | 0.6 | | Iran-Israel conflict (April 12, 2024 – April 18, 2024) | -2,229.1 | -3.4 | Note: (1) Dates in parentheses correspond to immediate periods of FPI outflows following a geopolitical incident.
(2) Negative sign indicates FPI outflows.
Source: Bloomberg and RBI Staff calculations. |
| Table 2: FPI flows and Level of Geopolitical Risk | | Geopolitical Risk Index | Average monthly FPI flows (net) into Indian equity market (US$ million) | | Low | 1,126.7 | | High | 409.5 | Note: GPR index is normalised to a value of 100 (average) in the 2000-09 decade, so that a reading of 200, for instance, indicates that newspaper mentions of rising geopolitical risk in that month were twice as frequent as they were during the 2000s. Therefore, we classify GPR values above 100 as ‘high’ and those less than or equal to 100 as ‘low’.
Source: NSDL and Statista Database. |
The effect of geopolitical risks on FPI inflows is significant across all quantiles, amplifying exchange rate volatility in periods when it is already high. The findings underline the risk-return trade-off in portfolio adjustments by foreign investors in response to geopolitical risks – investors balance their risk appetite between risk-adjusted and risk-free returns (Chart 2). In sum, geopolitical uncertainties increase volatility in FPI flows and exchange rates in the Indian context. Reference: 1. Caldara, Dario and Matteo Iacoviello (2022), ‘Measuring Geopolitical Risk’, American Economic Review, April, 112(4), pp.1194-1225. 2. Caldara, Dario, Sarah Conlisk, Matteo Iacoviello, and Maddie Penn (2023), ‘Do Geopolitical Risks Raise or Lower Inflation?’, Federal Reserve Board. 3. International Monetary Fund (2023), ‘Global Financial Stability Report’, April. 4. Kastner, G. and S.Fruhwirth-Schnatter, S. (2014), ‘Ancillarity-sufficiency interweaving strategy (ASIS) for boosting MCMC estimation of stochastic volatility models’, Computational Statistics and Data Analysis, Vol. 76, 408–423 5. Patra, Michael, Harendra Kumar Behera and Silu Muduli (2022), ‘Capital Flows at Risk: India’s Experience’, Reserve Bank of India Bulletin, June 2022. |
| Table 1.11: AUMs of the Domestic Mutual Fund Industry | | (in ₹ crore) | | As on | B30 AUM | T30 AUM | Industry AUM | | Equity | Non-Equity | Total | Equity | Non-Equity | Total | Equity | Non-Equity | Total | | Mar 31, 2023 | 4,28,396 | 2,81,797 | 7,10,193 | 11,93,975 | 20,37,863 | 32,31,838 | 16,22,371 | 23,19,660 | 39,42,031 | | Sep 30, 2023 | 5,37,789 | 3,22,668 | 8,60,457 | 14,89,083 | 23,08,214 | 37,97,298 | 20,26,873 | 26,30,882 | 46,57,755 | | Mar 31, 2024 | 6,66,594 | 3,48,394 | 10,14,988 | 18,30,140 | 24,95,067 | 43,25,207 | 24,96,734 | 28,43,461 | 53,40,195 | | Apr 30, 2024 | 7,00,607 | 3,66,884 | 10,67,490 | 19,28,312 | 27,30,096 | 46,58,408 | 26,28,919 | 30,96,980 | 57,25,898 | | May 30, 2024 | 7,23,024 | 3,76,944 | 10,99,967 | 19,78,071 | 28,13,122 | 47,91,193 | 27,01,094 | 31,90,066 | 58,91,161 | Note: T30 refers to the top 30 geographical locations in India and B30 refers to the locations beyond the top 30 cities.
Source: SEBI. | I.2.8 Mutual Funds 1.75 Bolstered by increasing participation of households, the assets under management (AUM) of the mutual fund (MF) industry grew by 35.5 per cent during 2023-24. This sharp growth has been primarily driven by inflows into equity-oriented schemes (Table 1.11). 1.76 Disaggregated analysis of flows into different schemes shows that within open-ended equity schemes, cumulative inflows during December 2023 to May 2024 into sectoral / thematic funds has more than tripled over inflows during April to November 2023 on the back of sector specific stocks. On the other hand, the AUM of debt schemes grew at a slower pace (Chart 1.61 a and b). 1.77 MFs’ systematic investment plans (SIPs) have played a key role in the financialisation of savings. The number of outstanding SIP accounts as well as gross SIP contributions are consistently rising. The investments made through SIPs formed 19.6 per cent of the total AUM of the domestic mutual fund industry (Chart 1.62).
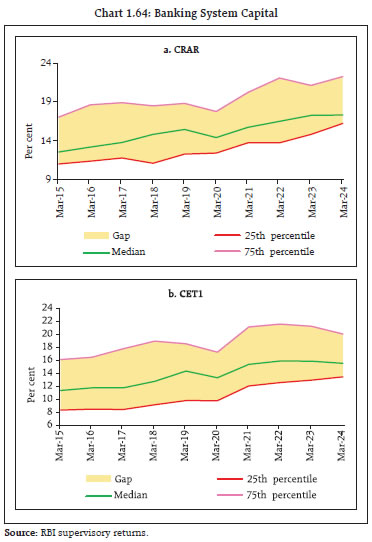
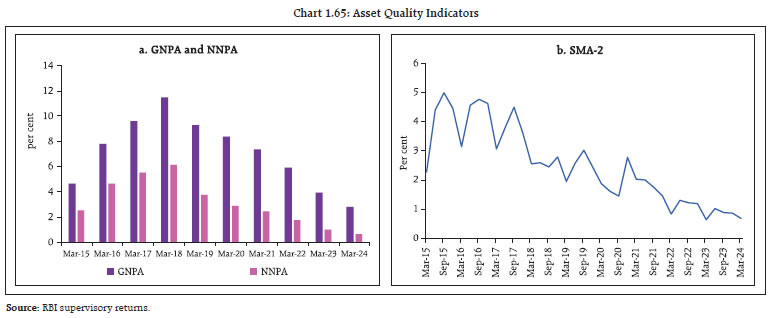
I.2.9 Banking Stability Indicator 1.78 The banking stability indicator (BSI) provides a comprehensive assessment of the health of the domestic banking system. The BSI shows that overall stability of the banking system improved on the back of stronger capital levels, higher earnings, and decline in the stock of NPAs, including restructured assets (Chart 1.63). Profitability indicators (viz., RoA, RoE and NIM) remained strong in March 2024 despite a marginal decline relative to the September 2023 position. Efficiency indicators weakened because of increase in staff costs and the cost-to-income ratio. Liquidity coverage ratio (LCR) fell marginally, although the banking system has substantial liquidity buffers relative to the regulatory minimum. I.2.10 Banking System 1.79 Capitalising on robust macroeconomic fundamentals and strong consumer and business confidence, Indian banks improved their asset quality, shored up earnings and augmented capital buffers. Their capital to risk-weighted asset ratio (CRAR) and common equity tier 1 (CET1) ratio stayed well above the regulatory minimum, despite increase in risk weights on certain segments of consumer credit by banks as well as on bank credit to NBFCs in November 2023 (Chart 1.64 a and b). Asset quality improved further, with the gross non-performing assets (GNPA) ratio and net non-performing assets (NNPA) ratio falling to multi-year lows of 2.8 per cent and 0.6 per cent, respectively. The special mention accounts – 2 (SMA-2) ratio, which is a leading indicator of asset quality, is also showing relatively low levels of future impairment (Chart 1.65 a and b). 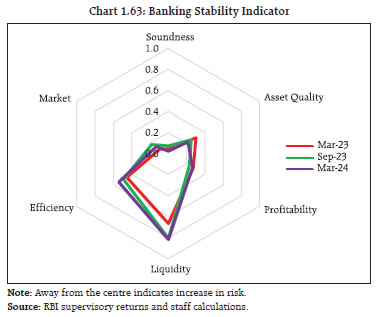
 1.80 Amidst a lengthy monetary tightening cycle, banking sector profitability has also been bolstered by high net interest margins (NIMs) and strong credit demand. The return on assets (RoA) and return on equity (RoE) remained strong at 1.3 per cent and 13.8 per cent, respectively, in March 202431 (Chart 1.66 a and b). 1.81 With strong loan demand, credit grew at a robust pace driven by momentum even as favourable base effect is waning (Chart 1.67 a and b). 1.82 The growing gap between credit and deposit growth is reflected in a rising credit-deposit (C-D) ratio, which has been on the ascent since September 2021 to peak at 78.8 per cent in December 2023 before moderating to 76.8 per cent at end-March 2024. The C-D ratio of private sector banks (PVBs) has been particularly high - over three fourths of the banks with C-D ratios above 75 per cent are PVBs (Chart 1.68 a and b). 1.83 With credit growing at a brisk pace and outpacing nominal GDP growth for seven consecutive quarters, the credit-GDP gap (i.e. the difference between the credit-GDP ratio and its long-term trend) has sharply narrowed to (-) 2.1 per cent in Q3:2023-24 from (-) 7.4 per cent Q3:2022-23 (Chart 1.69 a and b).
1.84 Despite the divergence in credit and deposit growth, elevated C-D ratio and narrowing credit-GDP gap, credit growth at 16.1 per cent as on May 31, 2024 (net of merger of an HFC with a bank) remains sustainable and within the range of 16-18 per cent beyond which it may lead to higher impairments32. 1.85 There have been episodes of credit and deposit growth divergence persisting for 2 to 4 years (Chart 1.70). A decomposition of seasonally adjusted aggregate deposits (deflated by CPI) into their trend and cyclical components using turning point analysis shows that the average duration of these cycles is 41 months33. Moreover, in this cycle, the merger of a large HFC with a bank has exacerbated the credit and deposit growth divergence34 (Chart 1.71). In addition, Granger causality shows that credit growth precedes deposit growth35. Convergence has been mostly achieved through a sharp fall in credit growth (Table 1.12). 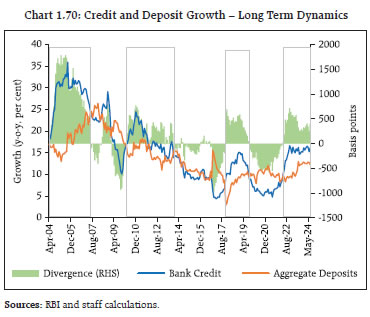
| Table 1.12: Credit and Deposit – Divergence and Convergence | | Identifying Period | Credit Growth | Deposit Growth | | Start Month | End Month | Number of Months | Average Growth Gap: Credit Deposit (bps) | Peak of Credit Growth during that period (y-o-y; per cent) | Credit Growth after 12 months after end month (y-o-y; per cent) | Change in Credit Growth (bps) | Deposit Growth in the month when credit growth peaked (y-o-y; per cent) | Deposit Growth after 12 months after end month (y-o-y; per cent) | Change in Deposit Growth (bps) | | Apr-04 | Jun-07 | 39 | 1071 | 36 | 26 | -961 | 20 | 22 | 232 | | Apr-10 | Oct-13 | 43 | 332 | 24 | 11 | -1382 | 17 | 11 | -555 | | Nov-17 | Aug-19 | 22 | 432 | 15 | 6 | -958 | 9 | 11 | 173 | | Apr-22 | May-24 | 26 | 408 | 17 | | | 13 | | | | Source: RBI and staff calculations. | 1.86 In the current cycle, the C-D ratio is close to its peak after adjusting for reserve requirements {viz., cash reserve ratio (CRR) and statutory liquidity ratio (SLR)} (Chart 1.72 and Table 1.13). 1.87 The LCR of banks declined from 135.7 per cent to 130.3 per cent between September 2023 and March 2024. Notably, the LCR of PVBs stood at 126.9 per cent in March 2024 after dipping to 118.8 in Q3:2023-24. Also, banks’ C-D ratio is found to be negatively correlated to their excess SLR holdings (Chart 1.73 a and b). | Table 1.13: C-D Ratio and Ratio of Loanable Funds | | Start Month | End Month | Peak C-D Ratio | Average Ratio of Loanable Funds during the Period | | Apr-04 | Jun-07 | 74.0 | 69.6 | | Apr-10 | Oct-13 | 78.3 | 71.1 | | Nov-17 | Aug-19 | 78.6 | 76.7 | | Apr-22 | May-24 | 78.1 | 77.5 | | Source: RBI and staff calculations. |
1.88 The share of retail and service sectors in total bank credit has been rising for over two decades. During April 2022 and March 2024, bank lending to the retail sector grew at a CAGR of 25.2 per cent and lending to services - which includes bank lending to NBFCs - grew at 22.4 per cent, far exceeding overall credit growth of 16.4 per cent. Accordingly, regulatory measures were taken by the RBI to curb high loan growth in certain retail segments. As a result, sequential growth (q-o-q) in retail lending fell from 4.4 per cent in Q1:2023-24 to 2.9 per cent in Q4:2023-24. 1.89 The underlying asset quality of retail loans has improved: the GNPA ratio in this category declined from a high of 2.1 per cent in June 2022 to 1.2 per cent in March 2024. The SMA (1+2) ratio, which is a leading indicator of incipient stress, has also declined from 3.0 per cent to 2.6 per cent over this period. Importantly, asset quality of unsecured retail lending is also showing improvement, with GNPA ratio at 1.5 per cent and SMA (1+2) ratio at 2.1 per cent compared to 1.6 per cent and 2.3 per cent, respectively, a year ago. Nonetheless, in respect of PVBs, the share of slippage from retail loans (excluding housing loans) in overall fresh accretion to NPAs is increasing. It formed 40.0 per cent of fresh accretion to NPAs in 2023-24, even as the share of these loans in total advances is 21.3 per cent (Chart 1.74 a and b). 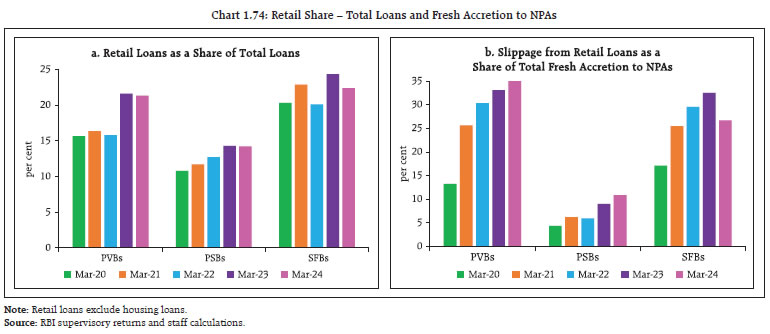 1.90 Growth in bank lending to NBFCs was another area of concern, which prompted the Reserve Bank to take regulatory measures in November 2023 as interlinkages could be a potential source of systemic risk. Measures taken in November 2023 are coming to fruition - as bank lending to NBFCs has also declined to 9.4 per cent of total bank credit as of end-April 2024, down from its peak of 10.0 per cent in June 2023. Moreover, growth (y-o-y) in bank lending to NBFCs has also moderated from 18.9 per cent in November 2023 to 14.6 per cent in April 2024 (Chart 1.75 a and b). 1.91 Banks held 64.6 per cent of their investments in the held-to-maturity (HTM) category36, which is not subject to mark-to-market valuation; however, elevated interest rates continued to affect the fair value of banks’ investments portfolio. Unrealised losses37 on securities held within the HTM portfolio, showed a reduction in March 2024 compared to September 2023. The impact on their CET1 ratio also remains limited. The median impact of unrealised losses on the CET1 ratio of select banks stands at 29 basis points, with 5 per cent of banks recording a substantial impact of 95 basis points or more (Chart 1.76). I.2.11 Non-Banking Financial Companies (NBFCs)38 1.92 The pace of growth of advances by NBFCs moderated during H2:2023-24, reflecting the impact of regulatory prescription of higher risk weights on NBFC lending to certain categories of consumer credit and bank lending to NBFCs. On an incremental basis, bank lending to NBFCs declined in H2:2023-24 even as the latter’s overall cost of funds increased (Chart 1.77 a, b and c). 1.93 Overall, the NBFC sector maintained large capital buffers boosted by improving asset quality and robust earnings. Despite a 79 bps decline during H2:2023-24, the capital ratio of NBFCs (CRAR of 26.6 per cent) remains well above the regulatory minimum of 15 per cent. Their NIMs have remained in the range of 4.2-4.8 per cent since mid-2022, which is well above the pre-pandemic trend, notwithstanding a fall of 27 bps to 4.5 per cent in March 2024. Their profitability improved further with the RoA at 3.3 per cent during Q4:2023-24. The asset quality of NBFCs continued to improve and the GNPA ratio reached a new low of 4.0 per cent40 (Chart 1.78).
1.94 Retail lending by NBFCs recorded some moderation in growth (half year-on-half year) to 14.8 per cent in March 2024 from 16.6 per cent in March 2023. The share of unsecured loans41 extended by the NBFC sector fell from 32.2 per cent of total loans to 22.9 per cent over this period (Chart 1.79 a and b).
1.95 A few NBFCs with low capital buffers are growing at a rapid pace, warranting close monitoring from a systemic stability perspective as they could morph into a tail risk (Chart 1.80).
1.96 During H2:2023-24, there was an improvement in the resilience of banks to potential contagion shocks from the NBFC sector, measured in terms of solvency losses due to hypothetical failure of a few large NBFCs (Chart 1.81). I.2.12 Consumer Credit 1.97 Consumer credit – a major driver of banking business over the last decade – remained robust during H2:2023-24. Credit inquiry volumes differed across product categories: while inquiries for housing loans and loans against property categories rose, volumes in auto loans, credit card and personal loan categories moderated (Chart 1.82). 1.98 Even as inquiry volumes remain robust, the impact of increase in risk weights on certain segments of consumer credit pulled down the rate of growth in overall consumer credit, especially personal loans and credit cards (Table 1.14).
| Table 1.14: Growth in Outstanding Balances by Product Type | | (y-o-y; per cent) | | | March 2023 | March 2024 | | Home Loans | 17.6 | 14.7 | | LAPs | 23.1 | 23.9 | | Auto Loans | 27.0 | 23.1 | | Personal Loans | 31.0 | 23.6 | | Credit Cards | 34.9 | 30.0 | | Source: TransUnion CIBIL. | 1.99 Overall asset quality of outstanding credit showed an improvement, except personal loans. Credit card asset quality broadly remained the same. Delinquency levels remain low across product categories, with the share of low-rated borrowers42 in incremental credit continuing to decline (Chart 1.83 a and b). Delinquency levels have diminished across financial institutions (Chart 1.83 c). 1.100 In the consumer credit segment, there are a few concerns that require close monitoring. First, delinquency levels among borrowers with personal loans below ₹50,00044 remain high. In particular, NBFC-Fintech lenders, which have the highest share in sanctioned and outstanding amounts, also have the second highest delinquency levels, only below that of small finance banks (Chart 1.84). 1.101 Second, vintage delinquency45, which is a measure of slippage, remains relatively high in personal loans at 8.2 per cent. Third, little more than a half of the borrowers in this segment have three live loans at the time of origination and more than one-third of the borrowers have availed more than three loans in the last six months. I.2.13 Housing Sector 1.102 The all-India House Price Index (HPI) rose by 4.1 per cent (y-o-y) in Q4:2023-24 as against 3.8 per cent in the previous quarter and 4.6 per cent a year ago. On a sequential basis, the all-India HPI increased by 0.9 per cent in Q4:2023-24, with expansion witnessed in eight out of ten major cities (Chart 1.85).
1.103 The city-wise behaviour of house prices varied widely, underscoring the importance of idiosyncratic local factors. After witnessing a moderate pace of growth in Q1:2023-24, residential real estate sales increased in subsequent quarters. During 2023-24, housing sales maintained a strong performance for the second consecutive year in the latest monetary policy tightening cycle. Consequently, unsold inventory overhang declined; growth (y-o-y) in new launches also declined in Q4:2023-24, reflecting a high base (Chart 1.86). 1.104 Housing loan growth remained steady. CRE loans accelerated further on a low base, although they form only 2.7 per cent of the banking system’s gross advances. Despite hardening of mortgage rates, delinquencies in the residential and CRE loans moderated. India does not suffer the stress in the CRE sector witnessed in other economies, and such exposures form a relatively smaller share of Tier-I capital of Indian banks (Chart 1.87 a, b and c).
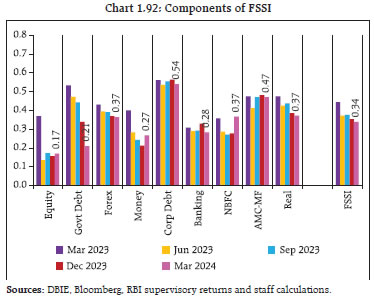
I.2.14 Cyber Risk 1.105 With rapid adoption of digital infrastructure and rising internet penetration, cyber risk is emerging as a key financial system vulnerability. The number of publicly attributed cyberattacks have risen in India (Chart 1.88 a and b). Cyber risk is identified as a key source of systemic vulnerability in the RBI’s systemic risk survey (SRS) and was placed under the ‘high risk’ category in eight out of ten previous half-yearly surveys. 1.106 In response to the rising threat of cyber risks, efforts on spreading awareness related to cyber security are also gaining momentum (Chart 1.89 a). Alongside, banks and other financial institutions are beefing up their cyber security frameworks, cyber security audits and other information system management aspects to mitigate cyber risks. This is also reflected in the surge in cyber-related mentions in the annual reports of financial institutions (Chart 1.89 b). 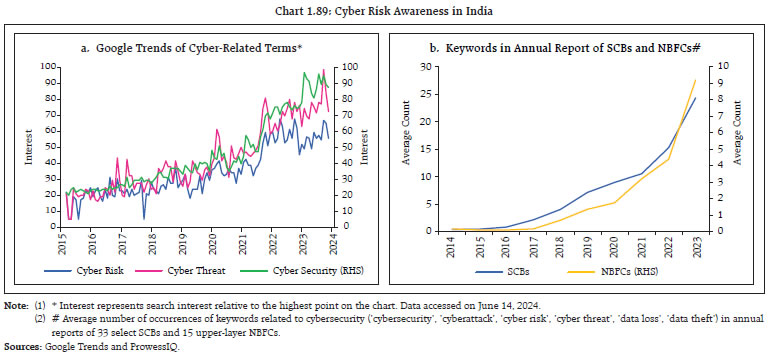 1.107 Analysis of cyber incidents46 reported by regulated entities (REs)47 to the Reserve Bank shows that 69 per cent of incidents were reported by SCBs, 19 per cent by UCBs and 12 per cent by NBFCs. UCBs had the highest share of incidents (41 per cent) in higher risk categories amongst all REs (Chart 1.90 a). Among the types of cyber incidents reported, social engineering incidents constituted the largest share. Incidents relating to data leakage, application security and ransomware attacks are rapidly rising. Most of these incidents involve threat actors leaking REs’ data such as card data, customers’ KYC details, and KYC documents on the dark web, social media or public platforms for sale (Chart 1.90 b). 1.108 Another source of risk emerges from dependence on common IT service providers among REs. These include, but not limited to, cloud service providers, payment switch providers and data centre providers. A major cyber incident in these IT service providers may propagate and adversely impact multiple REs simultaneously, threatening systemic stability. To monitor and mitigate this risk, the Reserve Bank had issued directions48 on outsourcing of IT services, which stipulate that REs should report cyber incidents within six hours of detection by third-party service providers. 1.109 Rising threat of cyber risk and increasing adoption of financial services by customers through digital channels makes it imperative for REs to ensure robustness and high security in their IT systems and controls to ensure operational resilience. Information systems and infrastructure should be able to support business functions seamlessly and ensure availability across all service delivery channels. This has been a critical part of the increased supervisory focus of the Reserve Bank and supervisory actions have been taken on REs where significant lacunae have been observed, especially in terms of downtime (leading to customer service disruption) of digital financial services. I.2.15 Financial System Stress Indicator 1.110 The financial system stress indicator (FSSI), a comprehensive indicator of the aggregate stress levels in the Indian financial system, indicated gradual easing of stress during H2:2023-24. The decline in stress indicators has been broad-based, except for the NBFC and money market segments. The decline in government debt market stress was the primary contributor to the improvement in the overall FSSI, aided by fall in long term yields as well as volatility and higher net foreign portfolio debt inflows. Meanwhile, declining volatility and rangebound movement in the exchange rate reduced stress level in the foreign exchange market. Money market stress indicators inched up as tight liquidity in the banking system led to higher interest rates on money market instruments (e.g., CPs and CDs). The banking system stress indicator remained subdued, supported by improving soundness. The real sector stress indicator moderated further on the back of sound macroeconomic fundamentals. Stress indicators for the NBFC sector rose as their capital ratios dipped and spreads on their borrowing costs increased (Chart 1.91 and 1.92). I.2.16 Systemic Risk Survey 1.111 The latest systemic risk survey (SRS) conducted in May 2024 showed that external experts remain confident of stability in the domestic financial system, with all major risk groups in the ‘medium’ risk category. Respondents felt that risks from global spillovers and macroeconomic risk have receded. There were no changes in their assessment of risks emerging from financial markets and institutions from the previous survey round. Among drivers of financial market risk, foreign exchange rate risk and liquidity risk were gauged to have moderated while risk emanating from equity price volatility was perceived to have moved from the ‘medium’ to the ‘high’ risk category. Interest rate risk also inched up. Around one-third of respondents expressed an increase in confidence in the Indian financial system and around 20 per cent of them reported higher confidence in the stability of the global financial system from the previous survey round. 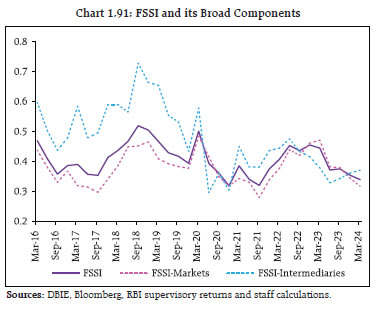
 1.112 Underscoring the resilience and strength of the Indian banking sector, nearly 90 per cent of the respondents assessed better or similar prospects for the Indian banking sector over a one-year horizon. Nearly 26 per cent of the survey participants expect asset quality to further improve. Almost 48 per cent of the respondents assessed that demand for credit would improve, supported by higher GDP growth, government spending, pickup in manufacturing sector activity and growing demand from real estate and infrastructure sectors. 1.113 The survey participants assessed geopolitical risks, tightening of global financial conditions and capital outflows and exchange rate pressures as major near-term risks (Chart 1.93). Nearly three-fourths of the panellists expected that the Indian economy will be impacted somewhat or to a limited extent in H2:2024 from ‘higher for longer’ policy rate stances of central banks. Half of the experts perceived that the increase in credit growth witnessed in the last two years is ‘somewhat sustainable’ and another 27 per cent assessed it to be ‘largely sustainable’. Some of the respondents, however, expressed concerns over consumer loan quality, cost of funds and asset quality. Summary and Outlook 1.114 The global financial system remains resilient, despite successive high impact shocks and the challenges stemming from uncertain growth prospects, high public debt and geopolitical conflicts. Near-term global macrofinancial risks have receded, helped by progress in lowering inflation and the ongoing economic recovery. The last mile of disinflation, however, remains complex and delay in aligning inflation to target could unmoor investor expectations, tighten financial conditions and worsen existing fragilities. 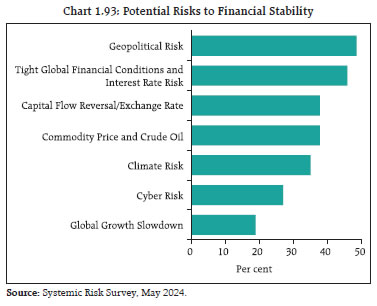 1.115 Amidst an uncertain and challenging global backdrop, the Indian economy is displaying steady growth and has been a significant contributor to global growth. Economic resilience and improved prospects are anchored by macroeconomic stability. Bolstered by a healthy banking system, the domestic financial system remains stable and supportive of real activity. Global spillovers remain a key near-term vulnerability. Overall, strong macroeconomic fundamentals and financial system soundness augur well for sustaining the growth momentum and withstanding global shocks.
|