Global financial markets seem to have largely internalised tapering in the Federal Reserve’s bond purchase programme
and the focus has shifted to the likely path of policy interest rate in advanced economies (AEs), particularly the US.
In the recent period, emerging market and developing economies (EMDEs) experienced a significant spillover of
changes in the monetary policy stance in AEs. Against this backdrop, growth-inflation dynamics seem to have turned
less favourable for EMDEs increasing their vulnerability to spillovers from AEs.
Domestically, with political stability returning, the next level of reforms, better policy implementation and initiation
of steps to address supply side constraints will help revive the investment cycle and moderate inflation expectations.
External sector risks have receded because of timely policy interventions, although there is a need to work towards
reducing structural current account imbalances. Another concern is the dominance of stock market activity by
foreign institutional investors. Balancing fiscal restraint with a boost to capital spending, especially for developing
infrastructure will be a major challenge which can be partly addressed by creating a better environment for the
private sector.
In domestic financial markets, active management of liquidity by the Reserve Bank should ensure adequate flow
of credit to the productive sectors. The Securities and Exchange Board of India (SEBI) has taken several measures
to tackle volatility in the markets.
Global Backdrop
1.1. Volatility unleashed by the initial indications
of tapering of the Federal Reserve’s (Fed) bond
purchase programme about a year ago has subdued.
The adverse impact of increased volatility was
particularly severe in many emerging financial
markets including India. Consequently, tougher
monetary, fiscal and macro-prudential policy decisions
in emerging market and developing economies
(EMDEs) served to restore stability and confidence.
With tapering being largely internalised by the
financial markets, the focus has now shifted to the
path of policy interest rates in advanced economies
(AEs). In the US, inflation1 is below the policy goal
while the unemployment rate fell to below 6.5 per
cent in the recent period. However, declining labour
force participation rates suggest considerable slack in
labour markets. Further, US GDP contracted in Q1
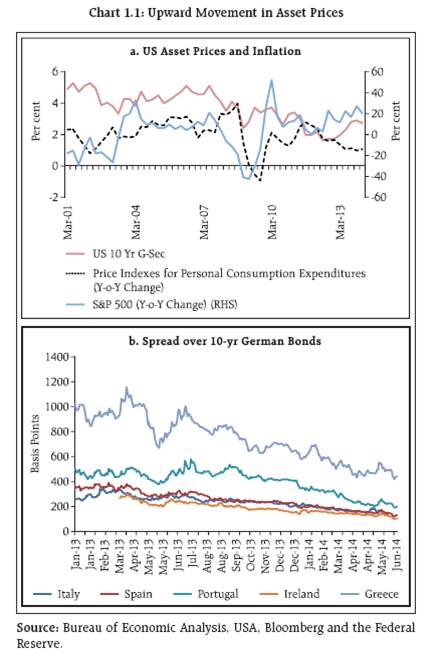
2014 though it is expected to improve in subsequent quarters. The situation is no better in the Euro area
where fears of deflation have raised questions about
the monetary policy stance. Asset prices have risen
in these economies (Charts 1.1a and 1.1b). In a radical
move to avoid deflation, the European Central Bank
(ECB), cut its deposit rate from zero to -0.10 per cent
and its main refinancing rate to 0.15 per cent from
0.25 per cent recently. ECB’s policy move along with
the quantitative and qualitative easing (QQE) in Japan,
may reduce the impact of the Fed’s tapering on global
liquidity.
1.2. With regard to other risks, moderation in
China’s growth is evident as its economy seems to be
shifting from an investment led model to a more
sustainable growth path with a gradual transition to
a more market based economy. Geo-political risks
emanating in Iraq, Eastern Europe and in Asia Pacific
may have implications for global energy prices and
trade. Against this backdrop, EMDEs need to be more
alert to ward off possible spillovers.
The Case for Monetary Policy Coordination
1.3. With the eventual removal of policy
accommodation in the AEs, better global policy
coordination could reduce unexpected spillovers and
improve trust which may be essential for future
coordination. In the absence of global policy
coordination, cooperation and global safety nets,
EMDEs may have to resort to less than optimal policy
options such as strong macro-prudential measures
including capital controls and reserve accumulation.
With their enormous clout, countries whose
currencies serve as reserve assets can induce negative
externalities on EMDEs through changes in their
monetary policies. While policy coordination has been
initiated in the context of global trade, Globally
Systemically Important Banks (G-SIBs) and other
regulatory areas to stem negative externalities, policy
cooperation/coordination is yet to be recognised in
the context of reducing spillovers from changes in
monetary policy especially with respect to AEs.
Domestic Scenario
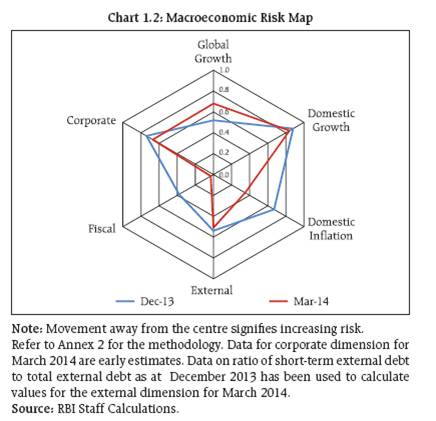
1.4. The risks being faced by the Indian economy
receded between December 2013 and March 2014
(Chart 1.2) following, among other developments, a
series of policy measures. In particular, India
tightened its monetary policy as an immediate
measure to shield against volatility emanating from
Fed’s intention to taper its bond purchase programme.
These measures were augmented by policies aimed
at attracting capital flows and overseas borrowings,
particularly the window for banks to swap their fresh
foreign currency non-resident (FCNR(B)) dollar funds
with Reserve Bank bolstered reserves. Policy measures
taken to curb gold imports helped in reducing the
current account deficit (CAD). Formation of a stable
government at the centre has ameliorated political
risk and has led to expectations of better policy
coordination and implementation which has had a
positive impact on the markets. Going forward, in
general the risks that the Indian economy is facing
are expected to fall. However, in comparison to the recent past, there could be some deterioration on the
current account and fiscal deficit fronts.
 Low Growth-High Inflation
1.5. The growth-inflation setting in India was
adverse for seven of the last eight quarters with below
5 per cent GDP growth and high CPI inflation (Chart
1.3a). Persistent high inflation can alter inflation
expectations permanently and may lead to
disintermediation in the economy with resultant
adverse effects on financial savings, investment and
growth. High inflation can also interfere with the
financial sector’s ability to allocate resources
effectively as price uncertainty can alter inflation
expectations, which can significantly increase risk
premia in financial transactions. Formation of a stable
government and the expectation that the new
government will address supply side constraints will
have a positive impact on inflationary expectations.
Although CPI inflation (combined) moderated during
the last quarter of 2013-14, inflation in CPI excluding
the food and fuel segments was persistent at around
8 per cent (Chart 1.3b). In this context, the efforts to
stabilise the economy through monetary policy
interventions needs to be complimented by
appropriate fiscal policy measures.
1.6. GDP growth was marginally higher during
2013-14 than it was in 2012-13 though it continued
to be sub-5 per cent for the second consecutive year.
This largely reflected a contraction in the industrial
sector even as agricultural growth improved due to
the good monsoon while the services sector remained
unchanged (Table 1.1). Increase in growth of index
of industrial production (IIP) during April 2014 and
improvement in export performance during May 2014
point towards recovery in growth. Easing of domestic
supply bottlenecks and progress on the implementation
of stalled projects that have already been cleared
should further improve the growth outlook.
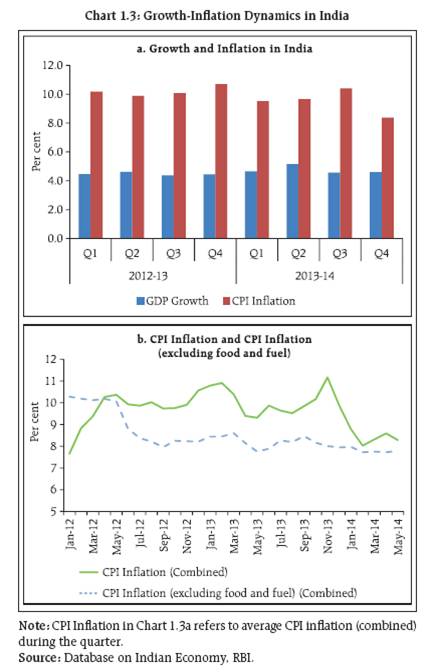
Table 1.1: Real GDP Growth-Supply Side (per cent) |
|
2012-13 |
2013-14 |
Q1 |
Q2 |
Q3 |
Q4 |
Q1 |
Q2 |
Q3 |
Q4 |
I. Agriculture, forestry & fishing |
1.8 |
1.8 |
0.8 |
1.6 |
4.0 |
5.0 |
3.7 |
6.3 |
II. Industry |
-0.6 |
0.1 |
2.0 |
2.0 |
-0.9 |
1.8 |
-0.9 |
-0.5 |
(i) Mining & quarrying |
-1.1 |
-0.1 |
-2.0 |
-4.8 |
-3.9 |
0.0 |
-1.2 |
-0.4 |
(ii) Manufacturing |
-1.1 |
0.0 |
2.5 |
3.0 |
-1.2 |
1.3 |
-1.5 |
-1.4 |
(iii) Electricity, gas & water supply |
4.2 |
1.3 |
2.6 |
0.9 |
3.8 |
7.8 |
5.0 |
7.2 |
III. Services |
6.7 |
6.5 |
6.1 |
5.8 |
6.5 |
6.1 |
6.4 |
5.8 |
(i) Construction |
2.8 |
-1.9 |
1.0 |
2.4 |
1.1 |
4.4 |
0.6 |
0.7 |
(ii) Trade, hotels, transport & communication |
4.0 |
5.6 |
5.9 |
4.8 |
1.6 |
3.6 |
2.9 |
3.9 |
(iii) Financing, insurance, real estate and business services |
11.7 |
10.6 |
10.2 |
11.2 |
12.9 |
12.1 |
14.1 |
12.4 |
(iv) Community, social & personal services |
7.6 |
7.4 |
4.0 |
2.8 |
10.6 |
3.6 |
5.7 |
3.3 |
( IV) GDP at factor cost |
4.5 |
4.6 |
4.4 |
4.4 |
4.7 |
5.2 |
4.6 |
4.6 |
Source: Central Statistics Office. |
Savings and Investments
1.7. Low domestic growth and high inflation
continue to have an adverse effect on saving-investment
dynamics. While households’ financial
savings (which include bank deposits) as per cent of
GDP have been falling, expenditure on valuables2
(which includes gold) has risen over the last few years
though it declined in 2013-14 (Chart 1.4). This trend
reflects financial disintermediation with households
switching away from financial savings to valuables
mainly gold. High inflation and the consequent low
real rate of return on financial assets may force savers
to assume excessive risks in their search for yield.
1.8. Gross capital formation (GCF) declined for the
second consecutive year in 2012-13. This decline was
led by the private corporate sector adversely impacting
the growth prospects of the economy (Chart 1.5).
Efficient disintermediation through fund raising
activities in the Indian capital markets, particularly
via public issues, was low in recent years (Chart 1.6)
given the subdued investment climate. The Securities
and Exchange Board of India (SEBI) has proposed
significant measures to revitalise the primary market,
which include changes in minimum dilution norms
for initial public offers (IPOs), minimum public share
holding for public sector undertakings, investment bucket for anchor investors and eligibility criteria for
‘offer for sale’ in an IPO, among others. A number of issues have been hindering the development of the
corporate bond market in India (Box 1.1).
Box 1.1: The Corporate Bond Market in India
The corporate bond market in India saw a growth in
issuances during the last five years. However, the
development of the corporate bond market in India has
lagged behind in comparison with the G-Sec market owing
to many structural factors. While primary issuances have
been significant, most of these are accounted for by public
sector financial institutions and are usually issued on a
private placement basis to institutional investors. The
secondary market has not developed commensurately
and market liquidity has been very low. Dormancy in the
Indian corporate bond market is attributed to a range of
factors.
Traditionally, the Indian financial system has been
dominated by banks with corporates relying more on loan
financing as compared to bond financing. Corporates
consider loan financing easier, less rigorous and
operationally more flexible, especially cash credits3. Banks
also find loan financing more convenient as they do not
need to mark-to-market (MTM) the loans vis-à-vis the
bonds. Further, banks prefer loan financing because it
provides them a greater degree of control and monitoring
over the performance of specific projects/activities of
corporate borrowers unlike bond financing where banks
have to rely on public disclosures of the financials by
corporates. Another major bottleneck in the growth of
secondary market liquidity is the large number of small
size bond issuances. Consolidation of corporate bond
issues through re-issuances may be needed to improve
market functioning. Internationally, insurance companies
are among the largest participants in the corporate bond
market. However, in India, institutional investors like
insurance companies, pension funds and the Employees’
Provident Fund Organisation (EPFO) which have large
assets under their management still have several
constraints in the nature of investment mandates
resulting in their limited participation in the corporate
bond market. Since pension funds and insurance
companies have to provide safe and guaranteed returns,
they prefer government securities. Further, unavailability
of the credit risk transfer mechanism in the corporate
bond market also works as a deterrent.
Though credit default swaps (CDS) have been introduced
in India, there is negligible activity in the market. One of the major constraints in this regard is the restriction on
the netting of the MTM position against the same
counterparty in the context of capital adequacy and
exposure norms. Without netting, trades in CDS have
become highly capital-intensive as banks and primary
dealers (PDs) have to provide higher capital charges on a
gross basis even if they act as market makers and have a
‘positive’ and ‘negative’ position against the same
counterparty. Netting has not been allowed by the Reserve
Bank due to lack of legal clarity. The absence of robust
bankruptcy laws is also reckoned as one of the major
reasons for low levels of investor interest in corporate
bonds. The current system of dissemination of
information in the corporate debt market is not robust.
There is no information on company-wise issuance data,
‘option’ availability, outstanding amount and rating,
among other relevant information, at one place. However,
of late, SEBI has mandated that both the depositories viz.
National Securities Depositary Limited (NSDL) and
Central Depository Services (India) Limited (CDSL) jointly
create, host, maintain and disseminate a centralised
database of corporate bonds/debentures. Other measures
taken by SEBI are aimed at according standardisation to
corporate bonds, improving transparency and bringing
them in line with dated government securities.
The success of order matching trading platform negotiated
dealing system-order matching (NDS-OM) in the G-Sec
market can act as a guide for setting up an order matching
trading platform for the corporate bond market. SEBI has
advised stock exchanges to start a separate anonymous
trading platform like NDS-OM. Though NSE has
introduced such a platform the trading volumes have
been negligible. Due to lack of central counterparty (CCP)
facility, market participants have not shown an interest
in routing transactions through the trading platform and
instead prefer to execute trades in the over the counter
(OTC) environment. Further, different state governments
charge different stamp duty on corporate bonds. Further,
there is a need for uniformity in stamp duty across all
states for bond issuance or re-issuances, debt assignment
and pass through certificates, for development of
corporate bond market.
Fiscal Constraints
1.9. The fiscal consolidation process, which had
resumed in 2012-13 through mid-year course
corrective measures, was continued in 2013-14 (PA).
With the growth slowdown affecting tax collections,
particularly indirect tax collections, and market
conditions not being conducive for meeting
disinvestment targets, the recent reduction in fiscal
defecit was mainly achieved through a sharp cutback
in ‘plan’ expenditure and higher receipts of non-tax
revenues that may not be recurring in nature. While
the need for fiscal consolidation cannot be over-emphasised,
it is important to ensure that its quality
is not compromised (Chart 1.7). It might be challenging,
but a fine balance needs to be struck between
containing the fiscal deficit on the one hand and
making investments in infrastructure to boost growth
on the other.
1.10. The net market borrowing of the central
government for 2014-15 has been budgeted at `4,573
billion, which is lower than the revised estimates at
`4,689 billion during the last fiscal year. Besides the
fiscal outlook, other factors including private credit
off-take, capital flows and the interest rate cycle
impact the government market borrowing programme.
A planned reduction in deficits and in the government’s
market borrowing will leave more resources for the
private sector.
Liquidity Conditions
1.11. The Reserve Bank capped borrowings by banks
from the liquidity adjustment facility (LAF) window
in July 2013 (Chart 1.8a). One of the objectives of
capping borrowings from LAF and of introducing term
repos was to reduce banks’ reliance on Reserve Bank’s
overnight liquidity facilities and to shift the remaining
eligible liquidity support to term segments with a
view to promoting the development of the term
money market and providing greater flexibility to
banks in managing their reserve requirements. Money
market activity (excluding Reserve Bank’s participation)
is captured in Chart 1.8b. Liquidity stress increased between mid July 2013-end October 2013 after banks’
borrowings from the overnight LAF were capped by
the Reserve Bank leading them to borrow from the
marginal standing facility (MSF) window. With the
introduction of RBI’s term repo window, the liquidity
stress fell and call rates have more or less remained
within the policy rate corridor (Chart 1.8c).
External Sector
1.12. India’s CAD at 4.7 per cent of GDP in 2012-13
deteriorated substantially mainly because of an
increase in trade deficit due to a slowdown in major
trade partner economies, inadequate pass-through of
higher global oil prices and a sharp rise in demand
for precious metals like gold and silver. Modest
recovery in key partner economies and the depreciation
of the rupee helped India boost its exports in 2013-14
and robust demand for software exports also
improved earnings from invisibles. With a fall in gold
imports mainly due to restrictions, the trade balance
improved during 2013-14 (Chart 1.9a). Thus, the
current account which had been under stress since
2011-12 was brought to a sustainable level during
2013-14 and CAD fell from 4.7 per cent during 2012-
13 to 1.7 per cent during 2013-14. This along with
strong capital inflows, particularly NRI deposits
(Chart 1.9b), brought stability to the external front.
Reduction in CAD, improvement in capital inflows,
accretion to foreign exchanges reserves and stability
of the exchange rate improved the external sector’s
resilience.
1.13. Recent bullish sentiments in domestic stock
markets seem to have been largely supported by
foreign institutional investors (FIIs) (Charts 1.10a
and 1.10b).
Corporate Sector Performance
1.14. There has been some improvement in the
performance of the corporate sector in the half year
ending March 2014 when compared to the previous
half year (Chart 1.11)4. Improvement is witnessed
in the profitability, leverage, sustainability and
turnover dimensions.
1.15. ‘Construction’, ‘electricity generation and
supply’ and ‘iron & steel’ are the major industries
burdened with interest expenses along with high
leverage (Chart 1.12). Further, ‘textiles’, ‘transport,
storage & telecommunications’ also show relatively
high burden of interest payments and leverage5.
Sector/Industry Analysis – Select Indicators
1.16. Leverage of Indian corporates increased across
major sectors/industries during 2010-11 and 2012-13
(Chart 1.13 i.a)6. Within manufacturing sector, ‘iron & steel’ and ‘textiles’ had relatively higher leverage.
In the services sector, ‘transportation’ was burdened
with higher leverage mainly on account of air
transport companies (Chart 1.13 i.b).
1.17. The interest coverage ratio9, which
reflects the ability of corporates to service borrowings
with the present level of profits fell across sectors
(Chart 1.13 ii.a) with mining & quarrying experiencing
the sharpest decline. Within the manufacturing
sector, ‘motor vehicles & transport equipment’, ‘nonelectrical
equipments’ and ‘electrical equipments’
industries witnessed a considerable fall in the interest
coverage ratio (Chart 1.13 ii.b).
1.18. Stress was also visible in the declining
operating profit margins10 of Indian corporates. All
sectors witnessed declining operating profit margins
(Chart 1.13 iii.a), with mining & quarrying experiencing
relatively larger decline. Industries such as ‘real
estate’ and ‘non-electrical equipments’ experienced
sizeable fall in their operating profit margins
(Chart 1.13 iii.b).
|