During 2019-20, scheduled commercial banks (SCBs) registered a robust performance characterised by improved asset quality, stronger capital and provision buffers, and return to profitability after a gap of two years. These improvements continued in H1:2020-21 even in the face of the pandemic, aided by the moratorium, the standstill in asset classification and restrictions on dividend pay-outs. While the Insolvency and Bankruptcy Code (IBC) remained the dominant mode of recovery, recovery rate of the Securitisation and Reconstruction of Financial Assets and Enforcement of Securities Interest Act, 2002 (SARFAESI) channel also improved. Going forward, with gradual rollback of policy measures, deterioration in asset quality may pose challenges, although build-up of buffers like COVID-19 provisions and capital raising from market may help alleviate the stress. 1. Introduction IV.1 In 2019-20, India’s commercial banking sector consolidated the gains achieved after the turnaround in 2018-19. Financial performance was shored up in H1:2020-21 by the moratorium and the standstill in asset classification. The overhang of stressed assets declined, and fresh slippages were reined in. With improvement in margins and recoveries of delinquent loans, the banking system turned profitable after a gap of two years. At the same time, capital buffers were strengthened, partly aided by recapitalisation of public sector banks (PSBs) and capital raising in the market. The immediate impact of lockdowns on the financial performance of commercial banks was mitigated through timely policy actions by the Reserve Bank. Going forward, although the risks to the banking sector remain tilted upwards, much hinges around the pace and spread of the economic recovery that is gradually gaining traction in H2:2020:21. IV.2 Against this background, this chapter discusses the balance sheet developments in respect of 97 scheduled commercial banks (SCBs) during 2019-20 and H1:2020-21, based on annual accounts1 of banks and off-site supervisory returns in Section 2. This is followed by an assessment of their financial performance and state of financial soundness in Sections 3 and 4, respectively. Sections 5 to 11 cover issues relating to sectoral deployment of credit, ownership patterns, corporate governance practices, foreign banks’ operations in India and overseas operations of Indian banks, payment system developments, consumer protection and financial inclusion. Developments related to regional rural banks (RRBs), local area banks (LABs), small finance banks (SFBs) and payments banks (PBs) have been analysed in Sections 12 to 15 separately. The concluding section highlights the major issues emerging from the analysis and offers suggestions on the way forward. 2. Balance Sheet Analysis IV.3 The consolidated balance sheet of SCBs has grown in H1:2020-21 after a deceleration in 2019-20 on account of subdued economic activity, deleveraging of corporate balance sheets and muted business sentiment impacting credit supply (Table IV.1). On the liabilities side, slowdown in deposit growth contributed to banks’ financial weakness (Chart IV.1). The recovery in 2020-21 (so far) has been driven by investments and deposit growth in spite of the COVID-19 pandemic. | Table IV.1: Consolidated Balance Sheet of Scheduled Commercial Banks | | (At end-March) | | (Amount in ₹ crore) | | Item | Public Sector Banks | Private Sector Banks | Foreign Banks | Small Finance Banks # | Payments Banks | All SCBs | | 2019 | 2020 | 2019 | 2020 | 2019 | 2020 | 2019 | 2020 | 2019 | 2020 | 2019 | 2020 | | 1. Capital | 51,060 | 72,040 | 21,344 | 26,866 | 77,809 | 85,710 | 4,213 | 5,151 | - | 1,035 | 1,54,427 | 1,90,802 | | 2. Reserves and Surplus | 5,46,066 | 5,80,886 | 5,27,665 | 5,82,425 | 96,979 | 1,08,987 | 5,821 | 11,047 | - | -461 | 11,76,531 | 12,82,884 | | 3. Deposits | 84,86,215 | 90,48,420 | 37,70,013 | 41,59,044 | 5,81,238 | 6,84,289 | 49,178 | 82,488 | - | 855 | 1,28,86,643 | 1,39,75,095 | | 3.1. Demand Deposits | 5,52,461 | 5,71,383 | 5,17,356 | 5,47,521 | 1,71,907 | 2,17,874 | 1,955 | 2,381 | - | 8 | 12,43,679 | 13,39,167 | | 3.2. Savings Bank Deposits | 27,99,445 | 30,41,902 | 10,45,648 | 11,72,739 | 59,459 | 70,007 | 7,245 | 10,284 | - | 847 | 39,11,797 | 42,95,779 | | 3.3. Term Deposits | 51,34,309 | 54,35,134 | 22,07,008 | 24,38,784 | 3,49,872 | 3,96,408 | 39,978 | 69,823 | - | - | 77,31,167 | 83,40,149 | | 4. Borrowings | 7,61,612 | 7,09,780 | 7,75,324 | 8,27,575 | 1,51,367 | 1,28,687 | 21,367 | 30,004 | - | - | 17,09,670 | 16,96,046 | | 5. Other Liabilities and Provisions | 3,18,274 | 3,71,893 | 2,03,591 | 2,36,229 | 1,48,982 | 2,57,632 | 2,928 | 4,078 | - | 216 | 6,73,775 | 8,70,048 | | Total Liabilities/Assets | 1,01,63,226 | 1,07,83,018 | 52,97,937 | 58,32,139 | 10,56,375 | 12,65,304 | 83,508 | 1,32,768 | - | 1,645 | 1,66,01,045 | 1,80,14,875 | | 1. Cash and Balances with RBI | 4,55,974 | 4,36,736 | 2,06,654 | 2,72,616 | 33,660 | 55,048 | 2,328 | 5,058 | - | 33 | 6,98,616 | 7,69,492 | | 2. Balances with Banks and Money at Call and Short Notice | 3,93,270 | 4,66,615 | 1,75,076 | 2,12,324 | 91,095 | 95,658 | 4,054 | 8,701 | - | 455 | 6,63,494 | 7,83,753 | | 3. Investments | 27,02,033 | 29,40,636 | 12,22,045 | 12,93,031 | 3,83,433 | 4,31,277 | 14,953 | 24,203 | - | 694 | 43,22,464 | 46,89,842 | | 3.1 In Government Securities (a+b) | 21,98,041 | 24,09,182 | 9,51,273 | 10,66,313 | 3,19,567 | 3,84,109 | 11,633 | 20,748 | - | 694 | 34,80,513 | 38,81,046 | | a) In India | 21,67,070 | 23,71,783 | 9,32,574 | 10,57,074 | 3,05,764 | 3,62,547 | 11,633 | 20,748 | - | 694 | 34,17,040 | 38,12,845 | | b) Outside India | 30,970 | 37,399 | 18,699 | 9,240 | 13,803 | 21,562 | - | - | - | - | 63,473 | 68,201 | | 3.2 Other Approved Securities | 157 | 102 | - | - | - | - | - | - | - | - | 157 | 102 | | 3.3 Non-approved Securities | 5,03,835 | 5,31,352 | 2,70,772 | 2,26,718 | 63,866 | 47,168 | 3,320 | 3,455 | - | - | 8,41,793 | 8,08,694 | | 4. Loans and Advances | 58,92,667 | 61,58,112 | 33,27,328 | 36,25,154 | 3,96,726 | 4,28,072 | 59,461 | 90,576 | - | - | 96,76,183 | 1,03,01,914 | | 4.1 Bills Purchased and Discounted | 1,66,336 | 1,60,977 | 1,17,234 | 1,25,078 | 76,192 | 61,864 | 4 | 37 | - | - | 3,59,767 | 3,47,955 | | 4.2 Cash Credits, Overdrafts, etc. | 24,71,666 | 24,16,408 | 9,45,461 | 9,83,165 | 1,79,764 | 2,05,130 | 5,433 | 6,872 | - | - | 36,02,323 | 36,11,575 | | 4.3 Term Loans | 32,54,665 | 35,80,727 | 22,64,633 | 25,16,912 | 1,40,770 | 1,61,078 | 54,024 | 83,668 | - | - | 57,14,093 | 63,42,385 | | 5. Fixed Assets | 1,07,318 | 1,06,507 | 36,142 | 38,243 | 4,426 | 4,129 | 1,251 | 1,649 | - | 200 | 1,49,137 | 1,50,728 | | 6. Other Assets | 6,11,963 | 6,74,412 | 3,30,693 | 3,90,770 | 1,47,036 | 2,51,120 | 1,461 | 2,580 | - | 263 | 10,91,153 | 13,19,146 | Notes: 1. -: Nil/negligible.
2. #: Data pertain to seven scheduled SFBs at end-March 2019 and 10 scheduled SFBs at end-March 2020.
3. Components may not add up to their respective totals due to rounding-off numbers to ₹ crore.
4. Detailed bank-wise data on annual accounts are collated and published in Statistical Tables Relating to Banks in India, available at https://www.dbie.rbi.org.in.
Source: Annual accounts of respective banks. |
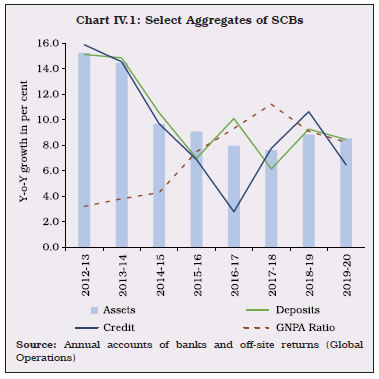 2.1 Liabilities IV.4 SCBs’ deposit growth remained elevated throughout the first three quarters of 2019-20 relative to the period since September 2017 (Chart IV.2a). During the last quarter, i.e., January-March 2020, however, deposit growth – especially in private sector banks (PVBs) – decelerated. Currency with public surged in response to the COVID-19 induced dash for cash while solvency issues related to a private sector bank also brought about some reassignment of deposits. IV.5 During 2020-21 so far, deposits with PSBs grew at a higher pace than usual, partly reflecting perception of their safe haven status (Chart IV.2b). IV.6 Term deposits – contributing almost 60 per cent of total deposits – moderated, reflecting the easing of interest rates and the lure of returns on competing asset classes. Term deposit growth of PVBs decelerated sharply even as it quadrupled in PSBs (Chart IV.3a). Foreign banks aggressively raised low-cost current and saving account (CASA) deposits, although their share in total deposits is low (Chart IV.3b). IV.7 Subdued credit growth and relatively robust deposit growth for most part of the year resulted in a decline in borrowing requirements of banks, except for PVBs (Chart IV.4).
2.2 Assets IV.8 After a gap of two consecutive years, SCBs’ loan growth decelerated in 2019-20, reflecting both risk aversion and tepid demand. During the current financial year so far, this was accentuated by the COVID-19 pandemic. The loan book of PVBs was affected disproportionately relative to their counterparts on asset quality concerns and higher provisioning requirements. Credit expansion was at a higher pace among PSBs during March, June and September, 2020 quarters, after three consecutive quarters of deceleration (Chart IV.5). IV.9 Another positive development was the robust credit growth in rural areas. Although the share of rural credit in the total has been hovering between 8 and 9 per cent, its growth surpassed that of other categories in 2019-20, after a gap of four years. While the share of PSBs in rural credit has gradually fallen, PVBs2 have been making inroads (Chart IV.6a and b).
IV.10 The credit-GDP ratio declined consistently throughout 2010s, partly reflecting availability of alternate avenues to raise resources. During 2019-20, however, the ratio declined even further and the incremental credit to GDP ratio also ebbed (Chart IV.7a). The outstanding credit-deposit (C-D) ratio declined across all bank groups (Chart IV.7b). IV.11 Muted credit offtake prompted PSBs to lean in favour of investments. Risk-free liquid statutory liquidity ratio (SLR) securities were their instruments of choice amidst the prevailing uncertainties. On the other hand, investment portfolio of PVBs and FBs decelerated due to profit booking in their trading books as yield on G-Secs softened significantly during the course of the year (Chart IV.8a).  IV.12 Till end-August 2020, banks were permitted to exceed the limit of 25 per cent of total investments under the held to maturity (HTM) category, provided the excess comprises only of SLR securities and total SLR securities held in the HTM category are not more than 19.5 per cent of net demand and time liabilities (NDTL). With the headroom available for PSBs and PVBs for further investment in SLR securities under the HTM category getting exhausted (Chart IV.8b) and in view of heavy government borrowing programme for 2020-21, the 19.5 per cent limit was raised to 22 per cent of NDTL up to March 31, 2022, for securities acquired between September 1, 2020 and March 31, 2021. 2.3 Flow of Funds to the Commercial Sector IV.13 Subdued credit demand conditions were reflected in a sharp moderation in flow of credit to the commercial sector in 2019-20, from both bank and non-bank sources. The moderation in non-bank funding was lower as compared with bank funding. Corporates raised higher resources from foreign sources such as foreign direct investment (FDI), external commercial borrowing (ECB) and foreign currency convertible bonds (FCCBs). Rationalisation of ECB guidelines, prudent and tighter single-group exposure norms, low interest rates in origin countries and the relatively stable exchange rate created an enabling environment to raise more resources from foreign sources. Within domestic non-bank sources, acceleration in resources raised from the capital market – public and rights issues as well as private placements – coupled with the investment of Life Insurance Corporation of India (LIC) in corporate debt provided a silver lining (Table IV.2). IV.14 The flow of funds to commercial sector has been higher during 2020-21 so far. Flows from banks, domestic non-bank sources – notably private placements; commercial paper (CP) issuances; and credit by housing finance companies (HFCs) – have picked up, compensating for lower flows from foreign sources like ECB/FCCB and short-term credit from abroad (Table IV.2). 2.4 Maturity Profile of Assets and Liabilities IV.15 Asset-liability management (ALM) profiles have direct implications for liquidity and profitability of banks. Rate Sensitive Assets (RSAs) and Rate Sensitive Liabilities (RSLs) directly impact banks’ net interest income. The decision to hold a positive (RSAs > RSLs) or negative gap (RSLs > RSAs) depends on a bank’s expectations on interest rates and its overall business strategy. In an environment of declining interest rates during 2019-20, the negative gap in the maturity bucket of up to one year and positive gap in higher maturity buckets moderated (Chart IV.9). | Table IV.2: Trends in Flow of Financial Resources to Commercial Sector from Banks and Non-banks | | (₹ crore) | | | April to March | April 1 to December 4 | | 2016-17 | 2017-18 | 2018-19 | 2019-20 | 2019-20 | 2020-21 | | A. Adjusted Non-food Bank Credit (NFC) | 4,95,224 | 9,16,109 | 12,29,977 | 5,81,209 | 73,792 | 89,556 | | | (33.6) | (42.8) | (52.3) | (40.2) | (12.2) | (14.4) | | i) Non-food credit | 3,88,247 | 7,95,897 | 11,46,677 | 5,88,985 | 79,907 | 89,526 | | of which: petroleum and fertilizer credit | 13,283 | 2,724 | 7,463 | 21,721 | -16,622 | -27,168@ | | ii) Non-SLR investment by SCBs | 1,06,977 | 1,20,212 | 83,301 | -7,775 | -6,116 | 30 | | B. Flow from Non-banks (B1+B2) | 9,79,207 | 12,24,042 | 11,22,424 | 8,64,615 | 5,32,770 | 5,32,957 | | | (66.4) | (57.2) | (47.7) | (59.8) | (87.8) | (85.6) | | B1. Domestic Sources | 7,03,377 | 8,85,589 | 7,35,678 | 3,21,100 | 2,26,811 | 3,26,773 | | | (47.7) | (41.4) | (31.3) | (22.2) | (37.4) | (52.5) | | 1 Public & rights issues by non-financial entities | 15,503 | 43,826 | 10,565 | 63,689 | 59,281 | 27,571 $ | | 2 Gross private placements by non-financial entities | 2,00,243 | 1,46,176 | 1,55,133 | 2,37,062 | 1,19,442 | 1,79,641 $ | | 3 Net issuance of CPs subscribed to by non-banks | 86,894 | -25,377 | 1,36,089 | -1,52,722 | -33,041 | 53,759 $ | | 4 Net credit by housing finance companies | 1,37,390 | 2,19,840 | 1,65,893 | 8,573 | -8,852 | 51,197 @ | | 5 Total accommodation by four RBI-regulated AIFIs - NABARD, NHB, SIDBI & EXIM Bank | 46,939 | 95,084 | 1,11,984 | 82,160 | -1,738 | -12,725 @ | | 6 Systemically important non-deposit taking NBFCs and deposit taking NBFCs (net of bank credit) | 1,88,748 | 3,68,243 | 1,26,004 | 13,572 | 46,758 | 2,937 & | | 7 LIC's net investment in corporate debt, infrastructure and social sector | 27,661 | 37,797 | 30,011 | 68,766 | 44,962 | 24,393 $ | | B2. Foreign Sources | 2,75,829 | 3,38,454 | 3,86,746 | 5,43,515 | 3,05,959 | 2,06,185 | | | (18.7) | (15.8) | (16.4) | (37.6) | (50.4) | (33.1) | | 1 External commercial borrowings / FCCBs | -50,928 | -5,129 | 69,629 | 1,54,263 | 70,820 | -37,178 @ | | 2 ADR/GDR issues excluding banks and financial institutions | 0 | 0 | 0 | 0 | 0 | 0 @ | | 3 Short-term credit from abroad | 43,465 | 89,606 | 15,184 | -7,704 | 13,841 | -1,488 & | | 4 Foreign direct investment to India | 2,83,292 | 2,53,977 | 3,01,932 | 3,96,955 | 2,21,299 | 2,44,851 @ | | C. Total Flow of Resources (A+B) | 14,74,431 | 21,40,151 | 23,52,401 | 14,45,824 | 6,06,562 | 6,22,513 | | | (100.0) | (100.0) | (100.0) | (100.0) | (100.0) | (100.0) | Notes: 1. &: Up to June 2020 @: Up to October 2020 $: Up to November 2020.
2. There was a rights issue of partly paid-up shares of ₹53,124 crore by Reliance Industries Limited in June 2020, of which 25 per cent (₹13,281 crore) has been paid at the time of subscription and the balance 25 per cent and 50 per cent shall be paid in May 2021 and November 2021, respectively.
3. Figures in the parentheses represent share in total flows.
Source: RBI, SEBI, BSE, NSE, Merchant Banks, LIC and NHB. | IV.16 While liabilities like deposits and borrowings in the maturity bucket of up to one year declined, assets – specifically, investments – picked up, led by PSBs and PVBs. On the other hand, borrowings and investments in the maturity bucket of over five years dipped. At the same time, deposits and loans and advances edged up. FBs continued to focus mainly on short-term borrowings and investments (Table IV.3). 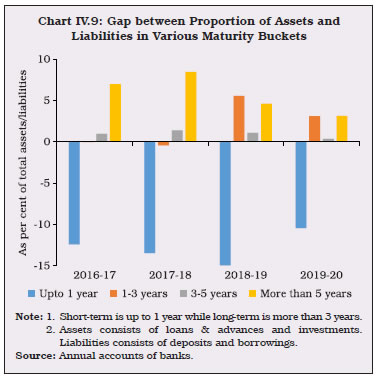
| Table IV.3: Bank Group-wise Maturity Profile of Select Liabilities/Assets | | (As at end-March) | | (Per cent to total under each item) | | Liabilities/Assets | PSBs | PVBs | FBs | SFBs | PBs | All SCBs | | 2019 | 2020 | 2019 | 2020 | 2019 | 2020 | 2019 | 2020 | 2019 | 2020 | 2019 | 2020 | | 1 | 2 | 3 | 4 | 5 | 6 | 7 | 8 | 9 | 10 | 11 | 12 | 13 | | I. Deposits | | | | | | | | | | | | | | a) Up to 1 year | 43.6 | 40.4 | 42.9 | 38.1 | 64.2 | 63.9 | 59.6 | 59.6 | - | 10.0 | 44.4 | 40.9 | | b) Over 1 year and up to 3 years | 22.4 | 22.8 | 26.8 | 28.1 | 28.6 | 28.3 | 36.7 | 37.5 | - | 90.0 | 24.0 | 24.8 | | c) Over 3 years and up to 5 years | 10.7 | 10.2 | 9.5 | 8.5 | 7.2 | 7.7 | 0.6 | 0.7 | - | - | 10.2 | 9.5 | | d) Over 5 years | 23.3 | 26.6 | 20.9 | 25.3 | 0.03 | 0.03 | 3.1 | 2.2 | - | - | 21.5 | 24.7 | | II. Borrowings | | | | | | | | | | | | | | a) Up to 1 year | 61.6 | 49.7 | 47.9 | 51.5 | 87.5 | 83.9 | 40.0 | 41.1 | - | - | 57.4 | 53.0 | | b) Over 1 year and up to 3 years | 14.1 | 27.6 | 19.9 | 24.4 | 8.1 | 9.8 | 44.9 | 44.0 | - | - | 16.5 | 25.0 | | c) Over 3 years and up to 5 years | 8.3 | 13.0 | 14.1 | 11.2 | 1.8 | 2.2 | 10.9 | 11.3 | - | - | 10.4 | 11.3 | | d) Over 5 years | 16.0 | 9.7 | 18.1 | 12.9 | 2.6 | 4.1 | 4.2 | 3.6 | - | - | 15.6 | 10.7 | | III. Loans and Advances | | | | | | | | | | | | | | a) Up to 1 year | 25.7 | 25.2 | 31.4 | 32.3 | 57.9 | 61.4 | 44.1 | 38.1 | - | - | 29.1 | 29.3 | | b) Over 1 year and up to 3 years | 41.6 | 40.3 | 34.0 | 33.6 | 22.1 | 19.3 | 34.7 | 42.4 | - | - | 38.1 | 37.1 | | c) Over 3 years and up to 5 years | 12.4 | 11.0 | 12.9 | 12.7 | 7.4 | 7.1 | 9.6 | 9.0 | - | - | 12.4 | 11.4 | | d) Over 5 years | 20.4 | 23.5 | 21.6 | 21.5 | 12.5 | 12.1 | 11.6 | 10.4 | - | - | 20.4 | 22.2 | | IV. Investments | | | | | | | | | | | | | | a) Up to 1 year | 17.9 | 22.3 | 51.7 | 54.3 | 82.6 | 82.5 | 66.3 | 59.0 | - | 100.0 | 33.3 | 36.8 | | b) Over 1 year and up to 3 years | 13.5 | 12.9 | 16.5 | 15.1 | 10.9 | 10.9 | 20.3 | 26.3 | - | - | 14.2 | 13.4 | | c) Over 3 years and up to 5 years | 13.5 | 10.7 | 8.2 | 6.8 | 2.2 | 2.2 | 1.3 | 3.1 | - | - | 11.0 | 8.8 | | d) Over 5 years | 55.1 | 54.1 | 23.6 | 23.8 | 4.2 | 4.5 | 12.1 | 11.6 | - | - | 41.5 | 41.0 | Note: The sum of components may not add up to 100 due to rounding off.
Source: Annual accounts of banks. | 2.5 International Liabilities and Assets IV.17 During 2019-20, total international liabilities of banks located in India declined due to a drop in short-term borrowings from abroad. Divestment by non-residents in banks, particularly PVBs, also contributed to this decline (Appendix Table IV.9). On the other hand, international assets of banks rebounded from a decline in the previous year, largely driven by an upsurge in NOSTRO balances and placements abroad. However, claims arising out of outstanding export bills sharply declined due to slackening of international trade (Appendix Table IV.10). This resulted in an uptick in the ratio of international claims to international liabilities. The ratio of international liabilities of banks to India’s total external debt declined due to an increase in external debt during the year (Chart IV.10). IV.18 The consolidated international claims of banks declined across both short-term and long-term maturities and shifted away from the non-financial private sector and banks towards non-bank financial institutions (NBFIs) (Appendix Table IV.11). Consolidated international claims of banks also underwent geographical changes favouring Germany, Singapore and the United Arab Emirates (U.A.E.) at the cost of Hong Kong, the United Kingdom (U.K.) and the United States (U.S.) (Appendix Table IV.12). 2.6 Off-balance Sheet Operations IV.19 During 2019-20, off-balance sheet liabilities of PVBs and FBs decelerated, while those of PSBs contracted, suggesting prudent behaviour in the face of elevated credit risk (Chart IV.11; Appendix Table IV.2). At end-March 2020, foreign banks’ contingent liabilities were as high as 10 times their balance sheet assets, while PVBs (1.2 times) and PSBs (0.31 times) had relatively lower off-balance sheet exposures. 3. Financial Performance IV.20 Net profits of SCBs turned around in 2019-20 after losses in two consecutive years (Table IV.4). Although PSBs incurred losses for the fifth year in a row, the amount of losses shrank. PBs could not break even as they incurred high initial capital expenditure and wage bills. | Table IV.4: Trends in Income and Expenditure of Scheduled Commercial Banks | | (Amount in ₹ crore) | | Item | Public Sector Banks | Private Sector Banks | Foreign Banks | Small Finance Banks# | Payments Banks | All SCBs | | 2019 | 2020 | 2019 | 2020 | 2019 | 2020 | 2019 | 2020 | 2019 | 2020 | 2019 | 2020 | | 1. Income | 7,75,331 | 8,34,320 | 4,67,058 | 5,46,041 | 69,901 | 83,223 | 10,898 | 19,219 | - | 55 | 13,23,188 | 14,82,858 | | | (0.03) | (7.6) | (25.5) | (16.9) | (9.8) | (19.1) | (62.7) | (76.4) | | | (8.7) | (12.1) | | a) Interest Income | 6,81,575 | 7,16,203 | 3,93,637 | 4,48,566 | 55,569 | 66,673 | 9,682 | 16,948 | - | 46 | 11,40,463 | 12,48,435 | | | (3.2) | (5.1) | (29.0) | (14.0) | (10.0) | (20.0) | (65.4) | (75.0) | | | (11.6) | (9.5) | | b) Other Income | 93,755 | 1,18,117 | 73,422 | 97,476 | 14,332 | 16,550 | 1,216 | 2,271 | - | 9 | 1,82,725 | 2,34,422 | | | (-18.3) | (26.0) | (9.9) | (32.8) | (8.9) | (15.5) | (43.9) | (86.7) | | | (-6.6) | (28.3) | | 2. Expenditure | 8,41,939 | 8,60,335 | 4,39,437 | 5,26,930 | 55,393 | 67,043 | 9,816 | 17,251 | - | 389 | 13,46,585 | 14,71,947 | | | (-2.2) | (2.2) | (33.0) | (19.9) | (4.9) | (21.0) | (53.3) | (75.7) | | | (7.7) | (9.3) | | a) Interest Expended | 4,50,614 | 4,68,005 | 2,31,257 | 2,58,038 | 24,476 | 28,810 | 4,535 | 7,928 | - | 14 | 7,10,881 | 7,62,794 | | | (-1.0) | (3.9) | (32.7) | (11.6) | (14.3) | (17.7) | (70.7) | (74.8) | | | (8.8) | (7.3) | | b) Operating Expenses | 1,75,114 | 1,91,925 | 1,09,276 | 1,26,320 | 18,697 | 21,584 | 4,200 | 7,152 | - | 488 | 3,07,287 | 3,47,469 | | | (6.6) | (9.6) | (26.3) | (15.6) | (3.8) | (15.4) | (52.8) | (70.3) | | | (13.2) | (13.1) | | Of which : Wage Bill | 1,01,503 | 1,15,044 | 39,202 | 47,357 | 6,720 | 7,878 | 2,127 | 3,811 | - | 264 | 1,49,551 | 1,74,354 | | | (10.6) | (13.3) | (21.5) | (20.8) | (-2.3) | (17.2) | (36.3) | (79.2) | | | (12.9) | (16.6) | | c) Provision and Contingencies | 2,16,211 | 2,00,405 | 98,905 | 1,42,572 | 12,220 | 16,648 | 1,081 | 2,171 | - | -112 | 3,28,417 | 3,61,685 | | | (-10.3) | (-7.3) | (42.1) | (44.2) | (- 8.7) | (36.2) | (8.4) | (100.8) | | | (1.0) | (10.1) | | 3. Operating Profit | 1,49,603 | 1,74,390 | 1,26,526 | 1,61,684 | 26,728 | 32,829 | 2,163 | 4,139 | - | -446 | 3,05,019 | 3,72,595 | | | (-3.9) | (16.6) | (13.6) | (27.8) | (10.3) | (22.8) | (67.1) | (91.4) | | | (4.2) | (22.2) | | 4. Net Profit | -66,608 | -26,015 | 27,621 | 19,111 | 14,508 | 16,180 | 1,082 | 1,968 | - | -334 | -23,397 | 10,911 | | | | | (- 33.9) | (- 30.8) | (33.7) | (11.5) | (264.4) | (81.9) | | | | | | 5. Net Interest Income (NII) (1a-2a) | 2,30,962 | 2,48,198 | 1,62,380 | 1,90,528 | 31,093 | 37,863 | 5,147 | 9,020 | - | 32 | 4,29,581 | 4,85,641 | | | (12.6) | (7.5) | (23.9) | (17.3) | (6.9) | (21.8) | (61.0) | (75.3) | | | (16.6) | (13.0) | | 6. Net Interest Margin (NIM) | 2.33 | 2.37 | 3.26 | 3.42 | 3.23 | 3.26 | 7.62 | 8.34 | - | 1.95 | 2.7 | 2.8 | Notes: 1. #: Data pertain to seven scheduled SFBs at end-March 2019 and 10 scheduled SFBs at end-March 2020.
2. NIM has been defined as NII as percentage of average assets.
3. Figures in parentheses refer to per cent variation over the previous year.
4. Percentage variations could be slightly different as absolute numbers have been rounded off to ₹ crore.
Source: Annual accounts of respective banks. | IV.21 The improvement in financial performance also reflected an increase in trading income on profit booking in the light of favourable yield movements (Box IV.1). IV.22 In line with the increasing share of PVBs in banking assets, their share in operating profits also increased to 43.4 per cent in 2019-20 at the cost of PSBs (Chart IV.12a and b). IV.23 Both interest income and interest expended by banks decelerated; however, banks managed to register higher net interest margin (NIM) with the growth in interest income. The gap between NIM of PVBs and PSBs enlarged as the former managed to lend at comparatively higher rates while reducing their deposit rates (Chart IV.13a and b). Box IV.1: Impact of Movements in G-Sec Yield on Bank Profitability A decline in G-Sec yields may prompt banks to book profits on their trading books. Higher yields and a steep yield curve are generally associated with higher NIMs (Alessandri and Nelson, 2015; Borio et al, 2015; Claessens et al, 2018). The level and slope of the yield curve have been found to affect NIM and trading income in the opposite direction, which is consistent with banks hedging interest rate risk through derivatives (Alessandri and Nelson, 2015; Borio et al, 2015). The net effect of these countervailing factors is not obvious. In the Indian context, yield on long-term government securities and short-term rates have sharply fallen in recent quarters, while the slope of the yield curve (i.e., the difference between yield on 10-year G-Sec and three-month T-Bills) has steepened (Chart 1). Using quarterly panel data of public and private sector banks for the period March 2015 to March 2020 three variations of a fixed effects model were estimated (Table 1). Controlling for bank-specific variables and macro-variables, the yield on 10-year G-Secs and the slope of the yield curve were found to have a significant and negative impact on trading profit (Col.4). This impact was strong enough to pull down total profitability (RoA) of banks (Col. 3), notwithstanding the uncertain impact on interest margins (Col. 2). The negative sign on the slope coefficient points to hedging activity of banks across the maturity spectrum. 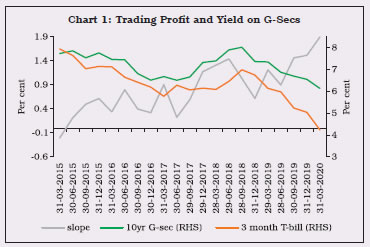
| Table 1: Yield and Profitability: Fixed Effects Model | | Column (1) | Column (2) | Column (3) | Column (4) | | Dependent Variable: NIM | Dependent Variable: RoA | Dependent Variable: Trading profit to assets ratio | | Dependent variable (-1) | 0.375*** | 0.423*** | 0.122** | | | (0.101) | (0.046) | (0.051) | | 10-year G-Sec yield | - 0.176 | -7.142*** | - 0.044*** | | | (0.275) | (2.38) | (.004) | | Slope | - 0.009 | -3.772*** | -0.028*** | | | (0.111) | (1.071) | (0.005) | | Slope (-1) | - 0.085 | -2.613*** | -0.005 | | | (0.097) | (1.006) | (0.006) | | GNPA | - 0.016*** | -.093*** | - | | | (0.005) | (0.032) | | | CASA | 0.012*** | - | - | | | (0.003) | | | | Cost to Income ratio | -0.005 | - 0.028*** | - | | | (0.003) | (0.006) | | | Spread | 0.398*** | - | - | | | (0.056) | | | | Liquid assets to Total Assets | -0.005** | -0.002 | - | | | (0.002) | (0.012) | | | IIP | 0.004 | 0.080*** | - | | | (0.003) | (0.026) | | | Diversification | -0.001** | 0.006*** | - | | | (0.0005) | (0.002) | | | Log (assets) | 0.363 | 0.832 | - | | | (0.282) | (0.673) | | | Tier I Leverage ratio | - | - | 0.0003*** | | | | | (0.00002) | | Constant | 4.235*** | 62.537 | 0.395*** | | | (3.487) | (20.94) | (0.030) | | R2 (overall) | 0.89 | 0.76 | 0.34 | | No. of observations | 818 | 814 | 656 | | Bank Fixed Effect | Yes | Yes | Yes | | Time Fixed Effect | Yes | Yes | Yes | Notes: 1. Figures in parentheses refer to robust standard errors.
2. *p < 0.10, ** p < 0.05, *** p < 0.01 | Reference: Alessandri, P. and B. D. Nelson (2015). Simple Banking: Profitability and the Yield Curve. Journal of Money, Credit and Banking, 47(1), 143–175. Borio, C., L. Gambacorta, and B. Hofmann (2017). The Influence of Monetary Policy on Bank Profitability. International Finance, 20(1):48-63. Claessens, S, N. Coleman and M. Donnelly (2018). “Low- For-Long” Interest Rates and Banks’ Interest Margins and Profitability: Cross-country Evidence. Journal of Financial Intermediation, 35 (2018) 1–16. Verma, R. and S. Herwadkar (2020). Interest Rate Movements and Bank Profitability: An Indian Experience, mimeo. |
 IV.24 Banks’ spreads increased, with SFBs commanding the highest spread followed by FBs, PVBs and PSBs in that order (Table IV.5). SFBs – which characteristically have a larger share of microfinance portfolio than peers – face higher cost of deposits and borrowings. This was, however, more than compensated by higher lending rates. IV.25 Provisions – especially those of PVBs – accelerated on account of higher NPAs as well as to meet regulatory requirements post-loan moratorium provided as COVID-19 relief measure. Although banks are required to make general provisions of not less than 10 per cent of the total outstanding on accounts that were in default as on February 29, 2020 and where moratorium / interest deferment and the consequent asset classification benefit was extended, it was allowed to be spread over Q4:2019-20 and Q1:2020-21. Against the backdrop of a regulatory ban on banks that prevent them from distribution of dividends, many PVBs earmarked the entire required provision – or even more – in the March 2020 quarter itself. As a result, the provision coverage ratio (PCR) of SCBs improved to 66.2 per cent in end-March 2020 and further rose to 72.4 per cent by end-September 2020 (Chart IV.14a). This also impacted profitability of banks in varying degrees (Chart IV.14b).3 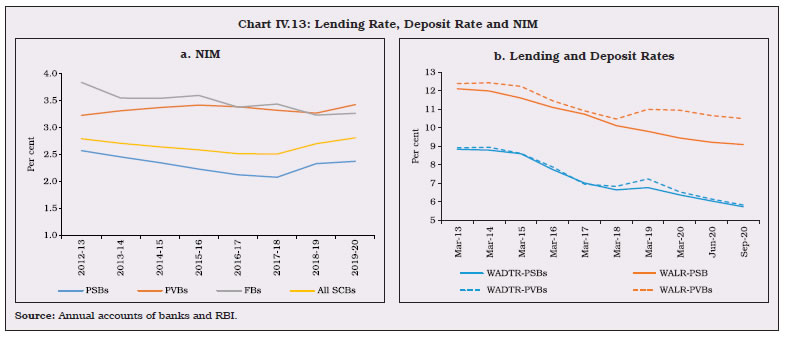
| Table IV.5: Cost of Funds and Return on Funds by Bank Groups | | (Per cent) | | Bank Group / Year | Cost of Deposits | Cost of Borrowings | Cost of Funds | Return on Advances | Return on Investments | Return on Funds | Spread | | 1 | 2 | 3 | 4 | 5 | 6 | 7 | 8 | 9 = 8-5 | | PSBs | 2018-19 | 5.01 | 4.81 | 4.99 | 8.07 | 7.20 | 7.79 | 2.80 | | | 2019-20 | 4.96 | 4.56 | 4.92 | 8.16 | 6.92 | 7.76 | 2.84 | | PVBs | 2018-19 | 5.14 | 6.64 | 5.40 | 9.78 | 6.99 | 9.01 | 3.61 | | | 2019-20 | 5.26 | 6.17 | 5.41 | 10.10 | 6.59 | 9.17 | 3.76 | | FBs | 2018-19 | 3.79 | 2.93 | 3.61 | 8.15 | 6.23 | 7.23 | 3.61 | | | 2019-20 | 3.65 | 4.07 | 3.73 | 8.45 | 6.71 | 7.59 | 3.86 | | SFBs | 2018-19 | 7.03 | 9.79 | 8.02 | 17.77 | 7.55 | 15.63 | 7.61 | | | 2019-20 | 8.20 | 9.84 | 8.66 | 19.87 | 7.54 | 17.32 | 8.66 | | PBs | 2018-19 | - | - | - | - | - | - | - | | | 2019-20 | 1.58 | - | 1.59 | - | 3.49 | 3.49 | 1.90 | | All SCBs | 2018-19 | 5.00 | 5.54 | 5.06 | 8.69 | 7.06 | 8.18 | 3.12 | | | 2019-20 | 5.00 | 5.36 | 5.04 | 8.94 | 6.81 | 8.28 | 3.23 | Notes: 1. Cost of deposits = Interest paid on deposits/Average of current and previous year’s deposits.
2. Cost of borrowings = (Interest expended - Interest on deposits)/Average of current and previous year’s borrowings.
3. Cost of funds = Interest expended / (Average of current and previous year’s deposits plus borrowings)
4. Return on advances = Interest earned on advances /Average of current and previous year’s advances.
5. Return on investments = Interest earned on investments /Average of current and previous year’s investments.
6. Return on funds = (Interest earned on advances + Interest earned on investments) / (Average of current and previous year’s advances plus investments).
7. Data include SFBs and PBs.
Source: Calculated from balance sheets of respective banks. | IV.26 At the system level, SCBs’ return on assets (RoA) and return on equity (RoE) turned positive during 2019-20, although PSBs and PBs remained a drag on banking system profitability (Table IV.6).
| Table IV.6: Return on Assets and Return on Equity of SCBs – Bank Group-wise | | (Per cent) | | Bank Group | PSBs | PVBs | FBs | SFBs | PBs | All SCBs | | 2018-19 | 2019-20 | 2018-19 | 2019-20 | 2018-19 | 2019-20 | 2018-19 | 2019-20 | 2018-19 | 2019-20 | 2018-19 | 2019-20 | | Return on Assets | -0.65 | -0.23 | 0.63 | 0.51 | 1.57 | 1.55 | 1.59 | 1.70 | - | -25.39 | -0.09 | 0.15 | | Return on Equity | -11.44 | -4.16 | 5.45 | 3.30 | 8.77 | 8.76 | 12.59 | 15.00 | - | -58.19 | -1.85 | 0.78 | | Source: Annual accounts of banks. | 4. Soundness Indicators IV.27 During 2019-20, SCBs strengthened their capital buffers, improved their asset quality and raised liquidity coverage ratios (LCR), although the leverage ratios marginally declined. Despite the COVID-19 pandemic, these improvements in soundness indictors continued till September 2020 due to moratorium on loans till August 2020 and continuing asset classification standstill. However, an increase in the restructured advances ratio to 0.43 per cent at end-September 2020 from 0.36 in March 2020 may be indicative of incipient stress. 4.1 Capital Adequacy IV.28 The consistent improvement in the capital to risk-weighted assets ratio (CRAR) of SCBs since March 2015 continued throughout 2019-20 and 2020-21 so far, reaching 15.8 per cent by end-September 2020 (Table IV.7). | Table IV.7: Component-wise Capital Adequacy of SCBs | | (As at end-March) | | (Amount in ₹ crore) | | | PSBs | PVBs | FBs | SCBs | | | 2019 | 2020 | 2019 | 2020 | 2019 | 2020 | 2019 | 2020 | | 1. Capital Funds | 6,38,553 | 6,99,872 | 6,01,046 | 6,54,772 | 1,69,598 | 1,88,660 | 14,09,197 | 15,43,304 | | i) Tier I Capital | 5,18,963 | 5,65,830 | 5,27,007 | 5,80,718 | 1,59,184 | 1,72,883 | 12,05,154 | 13,19,431 | | ii) Tier II Capital | 1,19,590 | 1,34,042 | 74,039 | 74,054 | 10,413 | 15,777 | 2,04,043 | 2,23,873 | | 2. Risk Weighted Assets | 52,32,524 | 54,46,253 | 37,39,838 | 39,56,956 | 8,74,432 | 10,65,869 | 98,46,793 | 1,04,69,078 | | 3. CRAR (1 as % of 2) | 12.2 | 12.9 | 16.1 | 16.5 | 19.4 | 17.7 | 14.3 | 14.7 | | Of which: Tier I | 9.9 | 10.4 | 14.1 | 14.7 | 18.2 | 16.2 | 12.2 | 12.6 | | Tier II | 2.3 | 2.5 | 2.0 | 1.9 | 1.2 | 1.5 | 2.1 | 2.1 | | Source: Off-site returns, RBI. | Although at the system level, the capital position exceeded the regulatory minimum [10.875 per cent inclusive of capital conservation buffer (CCB)], a few banks breached the regulatory minimum. Mergers helped improve the capital position of constituent banks due to pooling of resources for various operations and other scale economies (Box IV.2). Deferred implementation of the last tranche of CCB as a regulatory response to potential impact of COVID-19 on capital position of banks also helped. The decline in GNPAs and fresh slippages, improved profitability and restriction on dividend pay-out by banks contributed to strengthening of capital position of banks. IV.29 There has been a visible shift in the CRAR distribution of banks between 2008 (onset of the global financial crisis) and 2020 (onset of COVID-19 pandemic). The median CRAR has increased from 12.3 in March 2008 to 13.3 in March 2020 (Chart IV.15a). Although Indian banks had comparatively stronger capital buffers while entering the global financial crisis (GFC), they have significantly weaker capital position in comparison to their global counterparts in the COVID-19 pandemic4. In terms of distance from regulatory minimum CET-I ratio (5.5 per cent plus capital conservation buffer of 1.875 per cent i.e., 7.375 per cent) banks are concentrated at the lower end the distribution (Chart IV.15b). Box IV.2: Effects of Merger on Indian Banking System Ten public sector banks were merged into four banks with effect from April 1, 2020 with the objective of creating next generation banks with strong national and global presence. Notwithstanding some initial hiccups, factors like government ownership, similar pay structure and career progression avenues for staff, and common core banking solutions helped smoothen the operationalisation of the merger (Table 1). The equity swap ratio between merged entities was another issue that was widely discussed but was settled ahead of the merger (Table 2). The merged entities can now reap benefits of synergy, especially in the case of branch network presence across regions. For example, United Bank of India, which had a large presence in the eastern region, will now benefit from the more diversified branch network of Punjab National Bank which had vast network in northern and central region before the merger. Similarly, Indian Bank – with concentrated presence in the southern part of the country – can now expand its reach in central and eastern parts due to its alliance with Allahabad Bank (Chart 1). | Table 1: Core Banking Solutions | | Banks | Merged Into | Core Banking Solution | Punjab National Bank (PNB)
Oriental bank of Commerce (OBC)
United Bank of India | Punjab National Bank | Finacle | Syndicate Bank
Canara Bank | Canara Bank | iFLex Cube (OFSS) | Andhra Bank
Union Bank of India
Corporation Bank | Union Bank of India | Finacle | Allahabad Bank
Indian Bank | Indian Bank | BaNCS |
| Table 2: Share Swap Ratios | | Punjab National Bank | • 1,150 equity shares of ₹2 each of Punjab National Bank for every 1,000 shares of ₹10 each of Oriental Bank of Commerce
• 121 equity shares of ₹2 each of Punjab National Bank for every 1,000 equity shares of ₹10 each of United Bank of India | | Canara Bank | • 158 equity shares of ₹10 each of Canara Bank for every 1,000 equity shares of ₹10 each of Syndicate Bank | | Union Bank of India | • 325 equity shares of ₹10 each of Union Bank of India for every 1,000 equity shares of ₹10 each of Andhra Bank
• 330 equity shares of ₹10 each of Union Bank of India for every 1,000 equity shares of ₹2 each of Corporation Bank | | Indian Bank | • 115 equity shares of ₹10 each of Indian Bank for every 1,000 equity shares of ₹10 each of Allahabad Bank | Merger helped strengthen the capital buffers of banks that were facing challenges in meeting regulatory requirements (Table 3). | Table 3: CRAR of Banks: Pre- and Post-Merger | | (Per cent) | | | March 31, 2020
(Pre-Merger) | June 30, 2020
(Post-Merger) | | Punjab National Bank | 14.14 | 12.63 | | Oriental Bank of Commerce | 11.55 | | United Bank | 5.56 | | Canara Bank | 13.65 | 12.77 | | Syndicate Bank | 11.52 | | Union Bank of India | 12.81 | 11.62 | | Andhra Bank | 11.12 | | Corporation Bank | 11.53 | | Indian Bank | 14.12 | 13.45 | | Allahabad Bank | 12.01 |
| Table 4: NNPA Ratio | | (Per cent) | | | March 31, 2020
(Pre-Merger) | June 30, 2020
(Post-Merger) | | Punjab National Bank | 5.80 | 5.39 | | Oriental Bank of Commerce | 5.00 | | United Bank | 4.88 | | Canara Bank | 4.18 | 4.08 | | Syndicate Bank | 4.61 | | Union Bank of India | 5.49 | 4.75 | | Andhra Bank | 4.92 | | Corporation Bank | 5.14 | | Indian Bank | 3.13 | 3.76 | | Allahabad Bank | 5.66 |
Table 5: Provision Coverage Ratio
(Without write-off adjusted, in per cent) | | | March 31, 2020
(Pre-Merger) | June 30, 2020
(Post-Merger) | | Punjab National Bank | 62.39 | 64.47 | | Oriental Bank of Commerce | 62.84 | | United Bank | 66.86 | | Canara Bank | 50.20 | 56.27 | | Syndicate Bank | 63.44 | | Union Bank of India | 64.37 | 69.61 | | Andhra Bank | 72.80 | | Corporation Bank | 66.26 | | Indian Bank | 53.11 | 66.92 | | Allahabad Bank | 70.18 | Although it is difficult to isolate the impact of mergers from other forces acting concomitantly, the improvement in provisions helped in containing the net NPA ratios (Table 4 and 5). The consolidation may have also helped improve the operating profit per employee across banks. | IV.30 With capital infusion by the Government, PSBs improved their CRARs despite the increase in risk weighted assets (RWAs). With the budgeted capital infusion of ₹70,000 crores in 2019-20, the Government has infused ₹3.16 lakh crore in the last five years in these banks. SCBs shored up their capital position to strengthen loss-absorption capacity against imminent COVID-19 induced loan delinquencies. Apart from internal capital generation and recapitalisation (in case of PSBs) by the Government, banks raised capital from the market through public issues, preferential allotment, qualified institutional placement (QIP) and by selling non-core assets. PSBs abstained from public issues due to depressed valuations (Table IV.8). 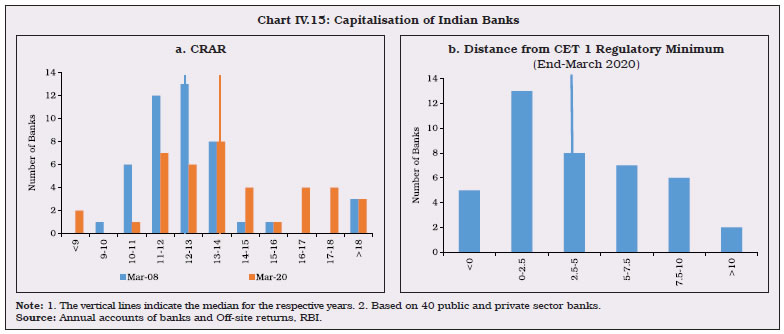
| Table IV.8: Public and Rights Issues by the Banking Sector | | (Amount in ₹ crore) | | Year | PSBs | PVBs | Total | Grand Total | | Equity | Debt | Equity | Debt | Equity | Debt | | 1 | 2 | 3 | 4 | 5 | 6 | 7 | 8= (6+7) | | 2018-19 | - | - | - | - | - | - | - | | 2019-20 | - | - | 410 | - | 410 | - | 410 | | 2020-21* | - | - | 15,000 | - | 15,000 | - | 15,000 | Note: 1. *: Up to November 2020.
2. -: Nil/Negligible.
Source: SEBI. |
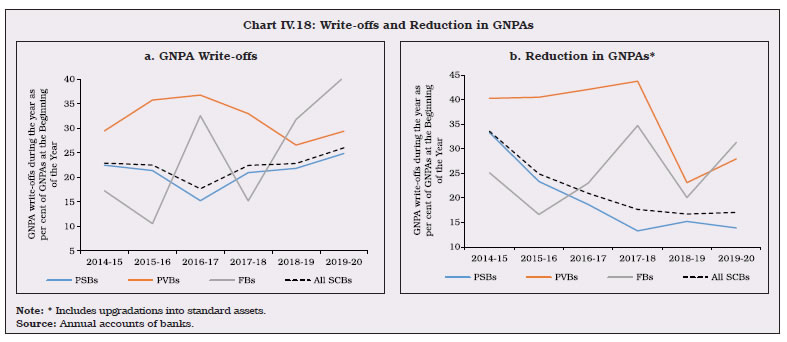
| Table IV.9: Resources Raised by Banks through Private Placements | | (Amount in ₹ crore) | | | 2018-19 | 2019-20 | 2020-21 (up to November) | | No. of Issues | Amount Raised | No. of Issues | Amount Raised | No. of Issues | Amount Raised | | PSBs | 13 | 15,190 | 20 | 29,573 | 15 | 36,439 | | PVBs | 13 | 19,943 | 8 | 23,121 | 3 | 32,443 | | Source: BSE, NSE and Merchant Bankers. | IV.31 Going forward, almost all major banks have announced plans to raise capital in 2020-21 either through debt or through equity or a combination of the two. A few major PVBs have taken a lead in raising capital but smaller lenders, especially the ones with already weak balance sheets, are conspicuous by their absence, partly reflecting uncertainty as to whether or not they will be able to raise resources in prevailing market conditions. IV.32 During 2019-20, the amount raised by PSBs through QIP and bond issuances on a private placement basis was almost double that of a year ago. Both PSBs and PVBs raised higher capital through private placements during 2020-21 so far (up to November) than a year ago (Table IV.9). Many of these bonds come under the category of Basel III compliant tier II bonds, which help shore up banks’ capital positions. 4.2 Leverage and Liquidity IV.33 The Leverage ratio, defined as the ratio of Tier I capital to total exposure, serves as a supplement to risk-based capital ratios to constrain the build-up of leverage. By end-March 2020, the leverage ratio declined marginally to 6.5 per cent from 6.6 per cent a year ago, driven by foreign banks (FBs) whose derivative exposure rose sharply. However, leverage ratio of SCBs again rose to 7.0 per cent by September 2020. Despite the reduction in regulatory requirements, effective October 2019, the leverage ratio of PSBs and PVBs witnessed a marginal uptick on improvement in capital positions while their total exposure remained stable (Chart IV.16a). IV.34 Of the two standards for funding liquidity prescribed by the Basel Committee, LCR has been effective in India since January 1, 2015 (the implementation of the net stable funding ratio (NSFR) has been deferred to April 1, 2021). As at end-March 2020, LCRs of SCBs rose to 159.1 per cent from 128.9 per cent in the previous year, given the low credit off-take and risk aversion among banks (Chart IV.16b). Despite the regulatory relaxation given to banks to maintain LCR at a lower rate of 80 per cent since April 17, 2020, the system-wide LCR was maintained at 171 per cent as at end September 2020. 4.3 Non-performing Assets IV.35 The moderation in the GNPA ratio, which started after the peak in March 2018, continued through 2019-20 and 2020-21 so far, to reach 7.5 per cent by end-September 2020. The improvement was driven by lower slippages which declined to 0.74 per cent in September 2020 and resolution of a few large accounts through the Insolvency and Bankruptcy Code (IBC). Fresh slippages remained the highest among PSBs (Chart IV.17a &b). IV.36 The modest GNPA ratio of 7.5 per cent at end-September 2020 veils the strong undercurrent of slippage. The accretion to NPAs as per the Reserve Bank’s Income Recognition and Asset Classification (IRAC) norms would have been higher in the absence of the asset quality standstill provided as a COVID-19 relief measure (Table IV.10). Given the uncertainty induced by COVID-19 and its real economic impact, the asset quality of the banking system may deteriorate sharply, going forward. IV.37 The rapid credit growth during 2005-12, coupled with absence of strong credit appraisal and monitoring standards and wilful defaults, are responsible for sizeable asset impairments in subsequent years.
| Table IV.10: Asset Classification as per IRAC Norms | | (As at end-September 2020) | | | As Reported (Per Cent) | As per IRAC Norms (Per cent) | Difference (Percentage points) | | GNPA Ratio | NNPA Ratio | GNPA Ratio | NNPA Ratio | GNPA Ratio | NNPA Ratio | | 1 | 2 | 3 | 4 | 5 | (4-2) | (5-3) | | Bank of Baroda | 9.14 | 2.51 | 9.33 | 2.67 | 0.19 | 0.16 | | State Bank of India | 5.28 | 1.59 | 5.88 | 2.08 | 0.60 | 0.49 | | Union Bank of India | 14.71 | 4.13 | 15.37 | 4.76 | 0.66 | 0.63 | | Axis Bank | 3.94 | 0.98 | 4.28 | 1.03 | 0.10 | 0.05 | | Bandhan Bank | 1.18 | 0.36 | 1.54 | 0.72 | 0.36 | 0.36 | | HDFC Bank | 1.08 | 0.17 | 1.37 | 0.35 | 0.29 | 0.18 | | ICICI Bank | 5.63 | 1.00 | 5.36 | 1.12 | 0.19 | 0.12 | | IDFC First Bank | 1.62 | 0.43 | 1.87 | 0.60 | 0.25 | 0.17 | | Kotak Mahindra Bank | 2.55 | 0.64 | 2.70 | 0.74 | 0.15 | 0.10 | | Source: OSMOS Supervisory Returns. | IV.38 The quantum of GNPAs of SCBs declined for the second consecutive year. With substantial increase in provisioning, the net NPA ratio of SCBs moderated to 2.8 per cent by end-March 2020 (Table IV.11). According to Supervisory Returns with the Reserve Bank, the net NPA ratio of SCBs further declined to 2.2 per cent by end-September 2020. IV.39 The reduction in NPAs during the year was largely driven by write-offs (Chart IV.18a and b). NPAs older than four years require 100 per cent provisioning and, therefore, banks may prefer to write them off. In addition, banks voluntarily write-off NPAs in order to clean up their balance-sheets, avail tax benefits and optimise the use of capital. At the same time, borrowers of written-off loans remain liable for repayment. IV.40 With these developments, the share of standard assets in total advances increased in SCBs except for PVBs and SFBs during 2019-20. Concomitantly, the share of doubtful assets declined while that of loss assets rose (Table IV.12). | Table IV.11: Movements in Non-Performing Assets by Bank Group | | (Amount in ₹ crore) | | Item | PSBs* | PVBs | FBs | SFBs | All SCBs# | | Gross NPAs | | | | | | | Closing Balance for 2018-19 | 7,39,541 | 1,83,604 | 12,242 | 1,087 | 9,36,474 | | Opening Balance for 2019-20 | 7,17,850 | 1,83,604 | 12,242 | 1,660 | 9,15,355 | | Addition during the year 2019-20 | 2,38,464 | 1,31,249 | 6,751 | 1,764 | 3,78,228 | | Reduction during the year 2019-20 | 99,692 | 51,335 | 3,832 | 1,046 | 1,55,905 | | Written-off during the year 2019-20 | 1,78,305 | 53,949 | 4,953 | 669 | 2,37,876 | | Closing Balance for 2019-20 | 6,78,317 | 2,09,568 | 10,208 | 1,709 | 8,99,803 | | Gross NPAs as per cent of Gross Advances** | | | | | | | 2018-19 | 11.6 | 5.3 | 3.0 | 1.7 | 9.1 | | 2019-20 | 10.3 | 5.5 | 2.3 | 1.9 | 8.2 | | Net NPAs | | | | | | | Closing Balance for 2018-19 | 2,85,122 | 67,309 | 2,051 | 586 | 3,55,068 | | Closing Balance for 2019-20 | 2,30,918 | 55,746 | 2,084 | 784 | 2,89,531 | | Net NPAs as per cent of Net Advances** | | | | | | | 2018-19 | 4.8 | 2.0 | 0.5 | 1.0 | 3.7 | | 2019-20 | 3.7 | 1.5 | 0.5 | 0.9 | 2.8 | Notes: 1. #: Data includes scheduled SFBs.
2. *: Closing balance for 2018-19 and opening balance for 2019-20 do not match due to amalgamation of Dena Bank and Vijaya Bank into Bank of Baroda.
3. **: Calculated by taking gross NPAs from annual accounts of respective banks and gross advances from off-site returns (global operations).
Source: Annual accounts of banks and off-site returns (global operations), RBI. |
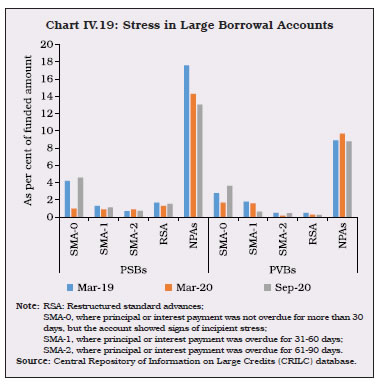
 IV.41 Large borrowal accounts (exposure of ₹5 crore and above) constituted 79.8 per cent of NPAs and 53.7 per cent of total loans at end-September 2020. During 2019-20, PSBs’ GNPA ratio as well as the ratio of restructured standard assets to total funded amounts emanating from larger borrowal accounts trended downwards. On the contrary, PVBs experienced an increasing share of NPAs in respect of such accounts. The share of special mention accounts (SMA-0) witnessed a sharp rise in September 2020. This may be an initial sign of stress after lifting of moratorium on August 31, 2020. However, the share of other categories of SMAs i.e., SMA-1 and SMA-2 remained at a relatively lower level (Chart IV.19). 4.4 Recoveries IV.42 Insolvency and Bankruptcy Code (IBC), under which recovery is incidental to rescue of companies, remained the dominant mode of recovery. However, the Securitisation and Reconstruction of Financial Assets and Enforcement of Securities Interest Act, 2002 (SARFAESI) channel also emerged as a major mode of recovery in terms of the amount recovered as well as the recovery rate (Table IV.13). With the applicability of the SARFAESI Act extended to co-operative banks, recovery through this channel is expected to gain further traction. Going forward, insolvency outcomes will hinge around uncertainties relating to COVID-19. The government has suspended any fresh initiation of insolvency proceedings in respect of defaults arising during one year commencing March 25, 2020 to shield companies impacted by COVID-19. | Table IV.12: Classification of Loan Assets by Bank Group | | (Amount in ₹ crore) | | Bank Group | End-March | Standard Assets | Sub-Standard Assets | Doubtful Assets | Loss Assets | | Amount | Per cent* | Amount | Per cent* | Amount | Per cent* | Amount | Per cent* | | PSBs | 2019 | 50,86,874 | 87.8 | 1,37,377 | 2.4 | 5,06,492 | 8.7 | 66,239 | 1.1 | | | 2020 | 53,27,903 | 89.2 | 1,32,530 | 2.2 | 4,04,724 | 6.8 | 1,07,163 | 1.8 | | PVBs | 2019 | 31,03,581 | 95.2 | 42,440 | 1.3 | 1,04,696 | 3.2 | 9,576 | 0.3 | | | 2020 | 34,14,554 | 94.9 | 56,588 | 1.6 | 92,396 | 2.6 | 34,986 | 1.0 | | FBs | 2019 | 3,94,638 | 97.0 | 3,190 | 0.8 | 8,019 | 2.0 | 1,034 | 0.3 | | | 2020 | 4,25,857 | 97.7 | 3,273 | 0.8 | 5,775 | 1.3 | 1,161 | 0.3 | | SFBs** | 2019 | 61,652 | 98.2 | 719 | 1.1 | 360 | 0.6 | 44 | 0.1 | | | 2020 | 89,800 | 98.1 | 1,023 | 1.1 | 648 | 0.7 | 39 | 0.0 | | All SCBs | 2019 | 86,46,745 | 90.8 | 1,83,726 | 1.9 | 6,19,567 | 6.5 | 76,894 | 0.8 | | | 2020 | 92,58,114 | 91.7 | 1,93,413 | 1.9 | 5,03,543 | 5.0 | 1,43,349 | 1.4 | Notes: 1. Constituent items may not add up to the total due to rounding off.
2. *: As per cent to gross advances.
3. **: Refers to scheduled SFBs.
Source: Off-site returns (domestic operations), RBI. |
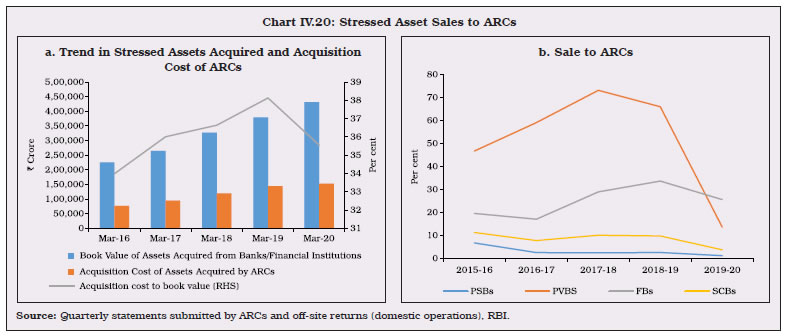
 IV.43 Apart from recovery through various resolution mechanisms, banks also clean up balance sheets through sale of NPAs to assets reconstruction companies (ARCs) for a quick exit. During 2019-20, asset sales by SCBs to ARCs declined which could probably be due to SCBs opting for other resolution channels such as IBC and SARFAESI. The acquisition cost of ARCs as a proportion to the book value of assets declined suggesting lower realisable value of the assets (Chart IV.20). | Table IV.13: NPAs of SCBs Recovered through Various Channels | | (Amount in ₹ crore) | | Recovery Channel | 2018-19 | 2019-20 | | No. of cases referred | Amount involved | Amount recovered* | Col. (4) as per cent of Col. (3) | No. of cases referred | Amount involved | Amount recovered* | Col. (8) as per cent of Col. (7) | | 1 | 2 | 3 | 4 | 5 | 6 | 7 | 8 | 9 | | Lok Adalats | 40,87,555 | 53,484 | 2,750 | 5.1 | 59,86,790 | 67,801 | 4,211 | 6.2 | | DRTs | 51,679 | 2,68,413 | 10,552 | 3.9 | 40,818 | 2,45,570 | 10,018 | 4.1 | | SARFAESI Act | 2,35,437 | 2,58,642 | 38,905 | 15.0 | 1,05,523 | 1,96,582 | 52,563 | 26.7 | | IBC | 1,152@ | 1,45,457 | 66,440 | 45.7 | 1,953@ | 2,32,478 | 1,05,773 | 45.5 | | Total | 43,75,823 | 7,25,996 | 1,18,647 | 16.3 | 61,35,084 | 7,42,431 | 1,72,565 | 23.2 | Notes: 1. Data are provisional.
2. DRTs: Debt Recovery Tribunals
3. *: Refers to the amount recovered during the given year, which could be with reference to the cases referred during the given year as well as during the earlier years. In the case of IBC, the realisation does not include amount realisable for operational creditors, from guarantors of corporate debtors and disposal of avoidance transactions.
4. @: Cases admitted by National Company Law Tribunals (NCLTs) under IBC. However, figures appearing for amount involved and amount recovered are for cases whose resolution plan was approved during the given financial year i.e. 81 cases for 2018-19 and 135 cases in 2019-20. Also, the amount recovered refers to realisables by all financial creditors, not just SCBs.
5. The resolution plan of Essar Steel India Ltd. was approved in 2018-19. However, as apportionment among creditors was settled in 2019-20, the recovery is reflected in the latter year data.
Source: Off-site returns, RBI and Insolvency and Bankruptcy Board of India (IBBI). |
 IV.44 The share of security receipts (SRs) subscribed to by banks steadily declined, reaching 66.7 per cent by end-March 2020 from 80.5 per cent at end-March 2018 as ARCs were incentivised to increase skin-in-the-game and diversify the investor base by bringing in other financial institutions (Table IV.14). 4.5 Frauds in the Banking Sector IV.45 Operational risk has emerged as a major source of risk. Although 98 per cent of frauds in terms of value were related to loans, their occurrence was spread over several previous years (Table IV.15, Appendix Table IV.15). There was a concentration of large value frauds, with the top fifty credit-related frauds constituting 76 per cent of the total amount reported as frauds during 2019-20. IV.46 Further, the banking relationship and date of sanction of credit facility in many of these accounts were much older. For instance, the majority of frauds reported till September 2020 both in terms of number and amount had occurred in years prior to 2017-18 (Table IV.16). | Table IV.14: Details of Financial Assets Securitised by ARCs | | (Amount in ₹ crore) | | Item | March-2018 | March-2019 | March-2020 | | 1. Book Value of Assets Acquired | 3,27,400 | 3,79,383 | 4,31,339 | | 2. Security Receipt issued by ARCs | 1,18,351 | 1,42,885 | 1,51,435 | | 3. Security Receipts Subscribed to by | | | | | (a) Banks | 95,299 | 99,840 | 1,00,934 | | (b) ARCs | 18,924 | 26,470 | 29,435 | | (c) FIIs | 505 | 1,681 | 10,366 | | (d) Others (Qualified Institutional Buyers) | 3,622 | 14,895 | 10,700 | | 4. Amount of Security Receipts Completely Redeemed | 8,413 | 12,240 | 17,947 | | 5. Security Receipts Outstanding | 98,203 | 1,12,651 | 1,07,877 | | Source: Quarterly statements submitted by ARCs. |
| Table IV.15: Frauds in Various Banking Operations Based on the Date of Reporting | | (Cases in number and amount in ₹ crore) | | Area of Operation | 2017-18 | 2018-19 | 2019-20 | 2019-20
(April-September) | 2020-21
(April-September) | | Number of frauds | Amount involved | Number of frauds | Amount involved | Number of frauds | Amount involved | Number of frauds | Amount involved | Number of frauds | Amount involved | | Advances | 2,525 | 22,558 | 3,604 | 64,548 | 4,611 | 1,82,117 | 2,441 | 1,10,639 | 1,664 | 63,950 | | Off-balance Sheet | 20 | 16,288 | 33 | 5,538 | 34 | 2,445 | 22 | 2,059 | 14 | 439 | | Forex Transactions | 9 | 1,426 | 13 | 695 | 8 | 54 | 3 | 52 | 1 | 0 | | Card/Internet | 2,059 | 110 | 1,866 | 71 | 2,677 | 129 | 1,234 | 53 | 1244 | 49 | | Deposits | 691 | 457 | 593 | 148 | 530 | 616 | 274 | 484 | 245 | 148 | | Inter-Branch Accounts | 6 | 1 | 3 | 0 | 2 | 0 | 2 | 0 | 2 | 0 | | Cash | 218 | 40 | 274 | 56 | 371 | 63 | 208 | 24 | 132 | 21 | | Cheques/DDs, etc. | 207 | 34 | 189 | 34 | 202 | 39 | 98 | 13 | 76 | 48 | | Clearing Accounts, etc. | 37 | 6 | 24 | 209 | 22 | 7 | 15 | 6 | 4 | 1 | | Others | 144 | 247 | 200 | 244 | 250 | 174 | 113 | 44 | 106 | 25 | | Total | 5,916 | 41,167 | 6,799 | 71,543 | 8,707 | 1,85,644 | 4,410 | 1,13,374 | 3,488 | 64,681 | Notes: 1. Refers to frauds of ₹1 lakh and above.
2. The figures reported by banks and financial institutions are subject to change based on revisions filed by them.
3. Frauds reported in a year could have occurred several years prior to year of reporting.
4. Amounts involved are as reported and do not reflect the amount of loss incurred. Depending on recoveries, the loss incurred gets reduced. Further, the entire amount involved in loan accounts is not necessarily diverted.
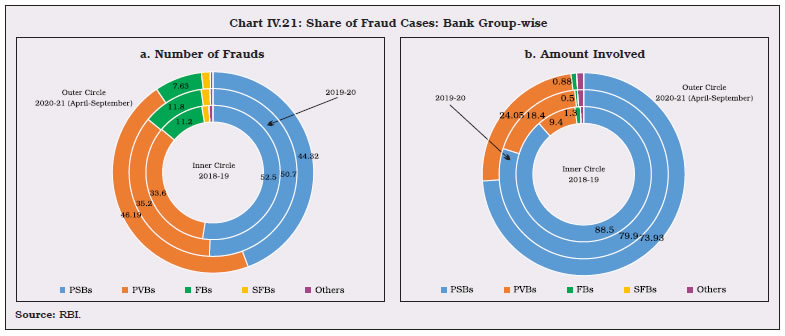
Source: RBI. | IV.47 Although around 80 per cent of the frauds involving amount of ‘more than ₹ one lakh’ were reported by PSBs, their share in total reporting – both number of cases as well as amounts involved – declined in 2019-20 (Chart IV.21). | Table IV.16: Frauds in Various Banking Operations Based on Date of Occurrence | | (Cases in number and amount in ₹ crore) | | Area of operation | Prior to 2017-18 | 2017-18 | 2018-19 | 2019-20 | 2020-21
(April-September) | | No. | Amount | No. | Amount | No. | Amount | No. | Amount | No. | Amount | | 1 | 2 | 2 | 2 | 3 | 4 | 5 | 6 | 7 | 8 | 9 | | Advances | 7,612 | 2,58,258 | 1,944 | 22,793 | 1,705 | 29,565 | 1,023 | 21,455 | 120 | 1,103 | | Off-balance sheet | 70 | 20,640 | 11 | 1,143 | 18 | 2924 | 1 | 1 | 1 | 0 | | Foreign Exchange Transactions | 15 | 1,940 | 5 | 83 | 5 | 145 | 6 | 7 | - | - | | Card/Internet | 348 | 28 | 2,168 | 105 | 2,050 | 80 | 2,463 | 119 | 817 | 26 | | Deposits | 527 | 666 | 583 | 345 | 521 | 137 | 361 | 191 | 67 | 30 | | Inter-branch accounts | 6 | 1 | 3 | 0 | 3 | 0 | - | - | 1 | 0 | | Cash | 99 | 41 | 214 | 39 | 270 | 53 | 342 | 31 | 70 | 16 | | Cheques/ demand drafts | 103 | 24 | 210 | 41 | 158 | 26 | 174 | 62 | 29 | 2 | | Clearing, etc accounts | 17 | 6 | 36 | 9 | 22 | 206 | 10 | 1 | 2 | 1 | | Others | 228 | 347 | 162 | 167 | 172 | 51 | 113 | 123 | 25 | 4 | | Total | 9,025 | 2,81,951 | 5,336 | 24,725 | 4,924 | 33,187 | 4,493 | 21,990 | 1,132 | 1,182 | Notes: 1. Refers to frauds of ₹1 lakh and above
2. The figures reported by banks & select FIs are subject to change based on revisions filed by them.
3. Data based on ‘date of occurrence’ may change for a period of time as frauds reported late but having occurred earlier would get added. For example, for frauds occurring in 2016-17, the data generated as on April 1, 2018 would be different from the one generated as on April 1, 2019 because the frauds reported between April 1, 2018 and March 31, 2019 but occurred in the year 2016-17 get added in latter report.
Source: RBI. |
 5. Sectoral Bank Credit: Distribution and NPAs IV.48 The deceleration in credit growth during 2019-20 and 2020-21 so far (up to September) was spread across sectors but was pronounced in the case of industry and services partly reflecting elevated levels of sectoral NPAs (Table IV.17 and Chart IV.22a). Low credit demand, coupled with corporate deleveraging, also played a role. The pick-up in resolution and decline in slippages helped alleviate stress in large accounts. NPAs in the micro, small and medium enterprises (MSME) sector were contained by the facility to restructure their loans5 (Chart IV.22b). Slowdown in credit to NBFCs was partly offset by banks’ investment in their debt papers, incentivised by targeted long-term repo operations (TLTRO) scheme of the Reserve Bank. | Table IV.17: Sectoral Deployment of Gross Bank Credit | | (Amount in ₹ crore) | | Sr. No. | Item | Outstanding as on | Per cent variation (y-o-y) | | Mar-19 | Mar-20 | Sep-20 | 2018-19* | 2019-20** | 2020-21
(up to September)^ | | 1 | Agriculture & Allied Activities | 12,17,594 | 12,39,575 | 12,91,752 | 10 | 1.8 | 6.6 | | 2 | Industry, of which | 32,93,638 | 32,52,801 | 31,30,493 | 5.2 | -1.2 | -1.4 | | | 2.1 Micro & Small Industries | 4,39,811 | 4,37,658 | 4,63,564 | 5.2 | -0.5 | 6.6 | | | 2.2 Medium | 1,23,843 | 1,12,376 | 1,40,247 | -1.7 | -9.3 | 18.6 | | | 2.3 Large | 26,11,567 | 26,11,369 | 24,42,320 | 6.1 | -0.01 | -3.5 | | 3 | Services, of which | 26,02,287 | 27,54,824 | 26,89,484 | 25.1 | 5.9 | 4.3 | | | 3.1 Trade | 5,83,930 | 6,28,171 | 6,51,990 | 12.4 | 7.6 | 11.5 | | | 3.2 Commercial Real Estate | 2,43,122 | 2,66,357 | 2,54,960 | 18.9 | 9.6 | -1.1 | | | 3.3 Tourism, Hotels & Restaurants | 56,194 | 60,039 | 62,313 | 7.9 | 6.8 | 9.6 | | | 3.4 Computer Software | 22,236 | 24,404 | 22,566 | -0.3 | 9.8 | 0.0 | | | 3.5 Non-Banking Financial Companies | 6,27,089 | 7,36,447 | 7,17,778 | 38.4 | 17.4 | 1.1 | | 4 | Retail Loans, of which | 23,04,313 | 26,59,250 | 27,27,946 | 18.6 | 15.4 | 10.4 | | | 4.1 Housing Loans | 12,04,362 | 13,96,445 | 14,37,886 | 19.5 | 15.9 | 10.3 | | | 4.2 Consumer Durables | 9,195 | 11,154 | 16,786 | -51.7 | 21.3 | 88.6 | | | 4.3 Credit Card Receivables | 1,11,361 | 1,32,076 | 1,40,824 | 34.5 | 18.6 | 15.7 | | | 4.4 Auto Loans | 2,69,677 | 2,89,366 | 2,98,672 | 12.9 | 7.3 | 8.4 | | | 4.5 Education Loans | 76,233 | 79,056 | 80,092 | 1.8 | 3.7 | 2.7 | | | 4.6 Advances against Fixed Deposits (incl. FCNR (B), etc.) | 77,135 | 80,753 | 71,482 | -0.1 | 4.7 | 13.0 | | | 4.7 Advances to Individuals against Shares, Bonds, etc. | 9,339 | 5,619 | 6,977 | 46.3 | -39.8 | -19.4 | | | 4.8 Other Retail Loans | 5,47,010 | 6,64,781 | 6,75,229 | 25.6 | 21.5 | 10.4 | | 5 | Gross Bank Credit | 95,26,932 | 1,00,98,420 | 1,00,63,699 | 13.4 | 6 | 5.1 | Note: 1. Figures in the table may not tally with the figures released by RBI in ‘Sectoral Deployment of Bank Credit’ every month due to difference in coverage of banks.
2. *: March 2019 over March 2018.
3. **: March 2020 over March 2019.
4. ^: September 2020 over September 2019.
Source: Off-site returns (domestic operations), RBI. |
 IV.49 Construction and power sectors were saddled with problems related to land acquisition, delay in getting various clearances, long gestation periods, contractual issues and cost overruns, and consequently had high NPA levels. In the gems and jewellery sector, NPAs increased with the exports declining during 2019-20 (Chart IV.23). IV.50 PVBs have been the engine of credit growth during the last few years. In a reversal during 2019-20, however, their loan growth decelerated across sectors. Lending to industry and agriculture sector by PVBs and PSBs also slowed down or declined (Chart IV.24a). The aggressive credit growth of PVBs to services and retail segments in the last few years – which surpassed 30 per cent mark in 2018-19 – came down sharply, even as PSBs managed to hold on to market shares in the retail segment (Chart IV.24b).
5.1 Unsecured Loans IV.51 The share of unsecured lending in the portfolio of both banks and non-banks has increased sharply over the last three years (Chart IV.25a). In recent years, SCBs have been reorienting their loan book away from the industrial sector and towards retail loans in view of lower delinquency rates of the latter. The growing share of unsecured credit card loans of SCBs – up from 3.1 per cent to 5.2 per cent within a span of five years – does not, however, augur well for their risk profile (Chart IV.25b). 5.2 Priority Sector Credit IV.52 Priority sector credit decelerated across constituent categories as well as across bank groups during 2019-20 (Chart IV.26). The deceleration in agricultural credit was led by Kisan Credit Card loans (Appendix Table IV.3). In the case of priority sector education loans (amount less than ₹10 lakh), the retrenchment, reflecting their high NPAs, is in sharp contrast with non-priority sector education loans, which have continued to grow. 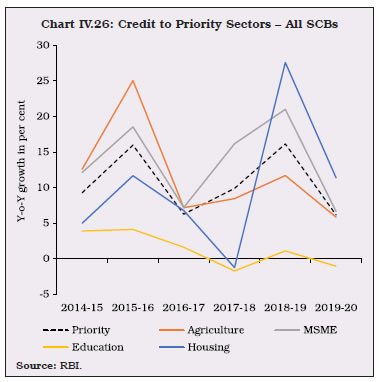 IV.53 During 2019-20, although all the bank-groups managed to achieve the overall priority sector lending (PSL), several sub-targets like those for agriculture, micro enterprises, small and marginal farmers (SMF) and non-corporate individual farmers were not achieved by some of them (Table IV.18). The revised priority sector lending guidelines issued in September 2020 are expected to increase lending to small and marginal farmers (SMFs) and weaker sections as targets prescribed for these categories are being raised in a phased manner. The guidelines are also expected to boost credit to start-ups, renewable energy, and health infrastructure in line with emerging national priorities. | Table IV.18: Priority Sector Lending by Banks | | (As on March 31, 2020) | | (Amount in ₹ crore) | | Item | Target/ sub-target
(per cent of ANBC/ CEOBE) | Public Sector Banks | Private Sector Banks | Foreign Banks | Small Finance Banks | | Amount outstanding | Per cent of ANBC/ CEOBE | Amount outstanding | Per cent of ANBC/ CEOBE | Amount outstanding | Per cent of ANBC/ CEOBE | Amount outstanding | Per cent of ANBC/ CEOBE | | 1 | 2 | 3 | 4 | 5 | 6 | 7 | 8 | 9 | 10 | | Total Priority Sector Advances | 40/75* | 23,14,242 | 41.05 | 12,72,745 | 40.32 | 1,67,095 | 40.80 | 45,566 | 88.22 | | of which | | | | | | | | | | | Total Agriculture | 18 | 9,71,334 | 17.23 | 5,03,939 | 15.96 | 41,745 | 18.25 | 13,917 | 26.94 | | Small and marginal farmers | 8 | 5,13,400 | 9.11 | 2,29,420 | 7.27 | 19,168 | 8.38 | 13,052 | 25.27 | | Non-corporate Individual Farmers# | 12.11 | 7,11,852 | 12.63 | 3,45,305 | 10.94 | 23,382 | 10.22 | 15,138 | 29.31 | | Micro Enterprises | 7.5 | 3,96,159 | 7.03 | 2,53,592 | 8.03 | 17,477 | 7.64 | 15,251 | 29.53 | | Weaker Sections | 10 | 6,83,876 | 12.13 | 3,40,182 | 10.78 | 24,148 | 10.56 | 30,260 | 58.59 | Notes: 1. Amount outstanding and achievement percentage are based on the average achievement of banks for four quarters of the financial year
2. *: Total priority sector lending target for Small Finance Banks is 75 per cent.
3. #: Target for non-corporate farmers is based on the system-wide average of the last three years’ achievement. For FY 2019-20, the applicable system wide average figure is 12.11 per cent.
4. For foreign banks having less than 20 branches, only the total PSL target of 40 per cent is applicable.
Source: RBI. | IV.54 The Reserve Bank had introduced Priority Sector Lending Certificates (PSLCs) in April 2016 as a market mechanism to incentivize banks to lend to the priority sector. Under this mechanism, over-achievers can issue PSLCs against the surplus in respect of a target/sub-target. Four types of certificates viz. PSLC General, PSLC-Agriculture (A), PSLC-Micro Enterprises (ME) and PSLC-Small and Marginal farmer (SMF) can be traded on the Reserve Bank’s e-Kuber platform. The total trading volume of PSLCs increased by 42.8 per cent to ₹4,67,789 crore during 2019-20 as against 74.6 per cent growth during 2018-19. In H1:2020-21, trading volume increased by 20.7 per cent from a year ago. Trading volumes tend to spike at the end of each quarter as buyers vie with each other to meet quarterly priority sector targets (Chart IV.27). Among the four PSLC categories, the highest trading was recorded in PSLC-General and PSLC-SMF. 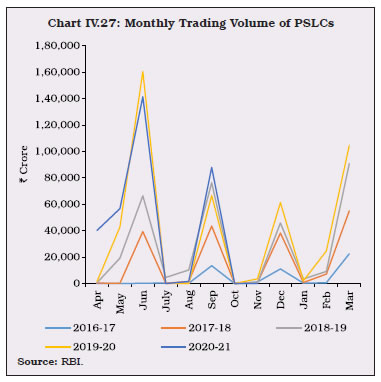
| Table IV.19: Weighted Average Premium on Various Categories of PSLCs | | (Per cent) | | | 2016-17 | 2017-18 | 2018-19 | 2019-20 | 2019-20
(Apr-Sep) | 2020-21
(Apr-Sep) | | PSLC-A | 1.87 | 1.29 | 0.79 | 1.17 | 1.32 | 1.61 | | PSLC-ME | 0.75 | 0.61 | 0.57 | 0.44 | 0.65 | 0.54 | | PSLC-SMF | 1.72 | 1.54 | 1.15 | 1.58 | 1.65 | 1.87 | | PSLC-G | 0.7 | 0.59 | 0.31 | 0.35 | 0.54 | 0.49 | | Source: RBI. | IV.55 During the year, priority sector areas where lending is comparatively more challenging were rewarded by higher premiums for PSLCs, e.g., the PSLC-SMF category commands almost four times higher premium than PSLC-ME and PSLC-General (Table IV.19). Commensurately, the growth in organic lending6 by banks to the SMF category was highest among all categories. IV.56 PSBs that carry a strong agriculture lending portfolio, have benefitted from the high premiums in PSLC-A and PSLC-SMF categories. After introduction of PSLCs, PVBs have increased their lending to micro enterprises exceeding their sub-target, although they are net buyers of PSLCs in agriculture and SMF sub-categories (Chart IV.28). FBs are net buyers and SFBs are net sellers across all the sub-categories of PSLCs. IV.57 PSBs and PVBs are the largest buyers as well as sellers of PSLCs on account of their larger loan books. On a net basis, PSBs which were net sellers till the previous year, turned buyers due to lending shortfalls in respect of overall priority sector and sub-target for lending to micro enterprises (Chart IV.29). IV.58 At end-March 2020, the GNPA ratio relating to priority sector loans increased to 8.3 per cent from 7.6 per cent in the previous year, driven primarily by delinquencies in agricultural and micro and small enterprises lending (Table IV.20). 
| Table IV.20: Sector-wise GNPAs of Banks | | (As at end-March) | | (Amount in ₹ crore) | | Bank Group | Priority Sector | Of which | Non-priority Sector | Total NPAs | | Agriculture | Micro and Small Enterprises | Others | | Amt. | Per cent# | Amt. | Per cent# | Amt. | Per cent# | Amt. | Per cent# | Amt. | Per cent# | Amt. | Per cent# | | PSBs* | | | | | | | | | | | | | | 2019 | 2,12,315 | 29.9 | 93,146 | 13.1 | 86,705 | 12.2 | 32,464 | 4.6 | 4,97,794 | 70.1 | 7,10,109 | 100 | | 2020 | 2,36,212 | 36.7 | 1,11,571 | 17.3 | 90,769 | 14.1 | 33,872 | 5.3 | 4,08,205 | 63.3 | 6,44,417 | 100 | | PVBs | | | | | | | | | | | | | | 2019 | 29,721 | 19.0 | 12,679 | 8.1 | 12,796 | 8.17 | 4,246 | 2.7 | 1,26,991 | 81.0 | 1,56,712 | 100 | | 2020 | 36,219 | 19.7 | 14,462 | 7.9 | 16,111 | 8.76 | 5,646 | 3.1 | 1,47,751 | 80.3 | 1,83,970 | 100 | | FBs | | | | | | | | | | | | | | 2019 | 1,103 | 9.0 | 105 | 0.9 | 616 | 5.0 | 382 | 3.1 | 11,139 | 91.0 | 12,243 | 100 | | 2020 | 1,692 | 16.6 | 376 | 3.7 | 1,070 | 10.5 | 246 | 2.4 | 8,498 | 83.4 | 10,189 | 100 | | SFBs | | | | | | | | | | | | | | 2019 | 893 | 79.5 | 138 | 12.3 | 583 | 51.9 | 172 | 15.3 | 230 | 20.5 | 1123 | 100 | | 2020 | 1,376 | 80.5 | 256 | 15.0 | 754 | 44.1 | 367 | 21.4 | 333 | 19.5 | 1709 | 100 | | All SCBs | | | | | | | | | | | | | | 2019 | 2,44,033 | 27.7 | 1,06,069 | 12.1 | 1,00,700 | 11.4 | 37,264 | 4.2 | 6,36,154 | 72.3 | 8,80,186 | 100 | | 2020 | 2,75,499 | 32.8 | 1,26,664 | 15.1 | 1,08,704 | 12.9 | 40,131 | 4.8 | 5,64,787 | 67.2 | 8,40,286 | 100 | Notes: 1. Amt.: – Amount; Per cent: Per cent of total NPAs.
2. Constituent items may not add up to the total due to rounding off.
3. # Share in total NPAs.
Source: Off-site returns (domestic operations), RBI. | 5.3 Credit to Sensitive Sectors IV.59 Banks’ exposure to the capital market and real estate is reckoned as sensitive in view of risks inherent in fluctuation in prices. While banks generally slowed down such lending. PSBs, in particular, reduced advances against collateral of shares/debentures as a precautionary measure due to excess leveraging of corporates (Chart IV.30 and Appendix Table IV.4). 6. Ownership Pattern in Scheduled Commercial Banks IV.60 Except for Andhra Bank, Punjab and Sind Bank and Syndicate Bank, the Government’s shareholding in other PSBs during 2019-20 either increased (due to recapitalisation) or remained static (Chart IV.31). Amalgamation of 10 PSBs into four, effective from April 1, 2020 brought about significant changes in ownership structure. Government shareholding in Canara Bank, Punjab National Bank, Indian Bank and Union Bank of India significantly increased due to high government share in the merged entities. Currently, the foreign investment limit in PVBs and PSBs is 74 per cent and 20 per cent, respectively. While the maximum foreign shareholding in PSBs was 9.8 per cent, it was more than 50 per cent in five PVBs at end-March 2020. Out of 22 PVBs, only three attracted higher foreign shareholdings during 2019-20 (Appendix Table IV.5). 7. Compensation Practices IV.61 Perverse incentive structures that reward risk-takers for short-term profits, without adequate recognition of long term risks, jeopardise various stakeholders’ interests and have potential to threaten financial stability. Recognising this, especially in the aftermath of the global financial crisis, the Reserve Bank introduced its guidelines on compensation practices in 2012. In India, banks which compete in the same market place have different compensation levels and structures (Chart IV.32a). The median variable pay of CEOs in PVBs and SFBs was much less than 50 per cent of their total compensation (Chart IV.32b). Similarly, deferrals in payment of variable pay were found to be infrequent (Chart IV.32c). Therefore, keeping pace with evolving Financial Stability Board’s Principles and Implementation Standards for Sound Compensation Practices, the guidelines were revised in November 2019 and became effective from pay cycles/ performance periods beginning April 1, 2020. These guidelines apply to compensation of Whole Time Directors (WTDs) / Chief Executive Officers (CEOs) / Material Risk Takers (MRTs). The revised guidelines cover, inter alia, specification of the minimum variable pay component, deferral of variable pay and clawback arrangements. These key personnel are required to get at least half of their compensation in the form of variable pay which, in turn, is linked to the bank’s performance. The total variable pay is capped at a maximum of 300 per cent of the fixed pay. Deferral arrangements are required to be implemented for the variable pay of the top executives, regardless of the quantum of pay. 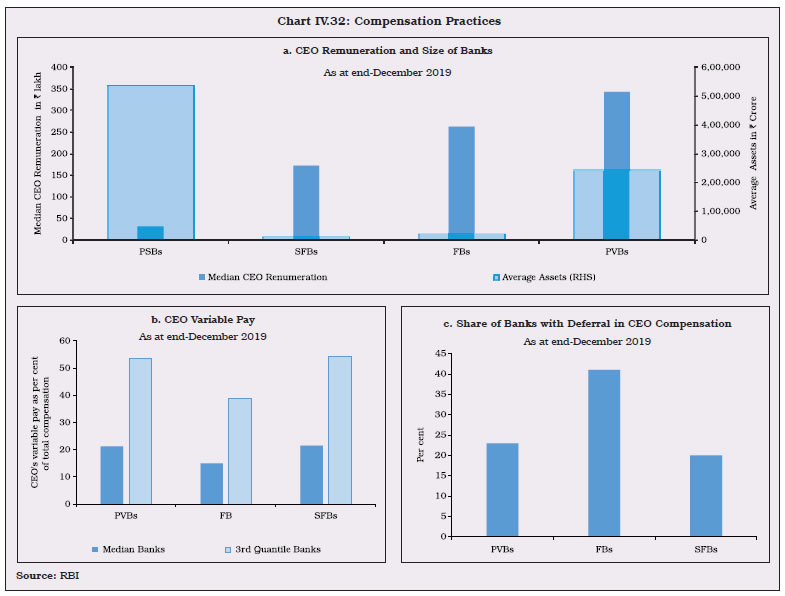 8. Foreign Banks’ Operations in India and Overseas Operations of Indian Banks IV.62 During 2019-20, the number of branches of FBs increased due to scaling up of operations by two wholly owned subsidiaries of FBs (Table IV.21). On the other hand, Indian PSBs continued to reduce their overseas presence for the third consecutive year with a view to rationalising their overseas operations and increasing cost efficiency by shutting down less profitable operations. On the contrary, Indian PVBs increased their overseas presence marginally (Appendix Table IV.6). | Table IV.21: Operations of Foreign Banks in India | | | Foreign banks operating through branches | Foreign banks having representative offices | | No. of Banks | Branches | | March 2016 | 46 | 325 | 39 | | March 2017 | 44 | 295 | 39 | | March 2018 | 45 | 286 | 40 | | March 2019 | 45# | 299# | 37 | | March 2020 | 46# | 308# | 37 | Note: #: Includes two foreign banks namely SBM Bank (India) Limited and DBS Bank India Limited which are operating through Wholly Owned Subsidiary (WOS) mode and their branches.
Source: RBI. | 9. Digital Payments IV.63 In line with earlier years, large value credit transfers through RTGS dominated the overall digital payments landscape in the year 2019-20, accounting for 80.8 per cent of the total value of digital transactions. In terms of volume however, credit transfers via multiple channels such as the Unified Payments Interface (UPI), National Electronic Funds Transfer (NEFT) and Immediate Payment Service (IMPS) were the leaders. In case of card payments, the value of debit card transactions registered a growth of 35.6 per cent as against 21.1 per cent for credit cards (Table IV.22). | Table IV.22: Digital Payments | | | Volume (Lakh) | Value (₹ Crore) | | 2017-18 | 2018-19 | 2019-20 | 2017-18 | 2018-19 | 2019-20 | | 1. Large Value Credit Transfers – RTGS | 1,244 | 1,366 | 1,507 | 11,67,12,478 | 13,56,88,187 | 13,11,56,475 | | 2. Credit Transfers | 58,793 | 1,18,750 | 2,06,661 | 1,88,14,287 | 2,60,97,655 | 2,85,72,100 | | 2.1 AePS (Fund Transfers) | 6 | 11 | 10 | 300 | 501 | 469 | | 2.2 APBS | 12,980 | 15,032 | 16,805 | 55,949 | 86,734 | 99,448 | | 2.3 ECS Cr | 61 | 54 | 18 | 11,864 | 13,235 | 5,145 | | 2.4 IMPS | 10,098 | 17,529 | 25,792 | 8,92,498 | 15,90,257 | 23,37,541 | | 2.5 NACH Cr | 7,031 | 9,021 | 11,406 | 5,20,992 | 7,36,349 | 10,52,187 | | 2.6 NEFT | 19,464 | 23,189 | 27,445 | 1,72,22,852 | 2,27,93,608 | 2,29,45,580 | | 2.7 UPI | 9,152 | 53,915 | 1,25,186 | 1,09,832 | 8,76,971 | 21,31,730 | | 3. Debit Transfers and Direct Debits | 3,788 | 6,382 | 8,957 | 3,99,300 | 6,56,232 | 8,26,036 | | 3.1 BHIM Aadhaar Pay | 20 | 68 | 91 | 78 | 815 | 1,303 | | 3.2 ECS Dr | 15 | 9 | 1 | 972 | 1,260 | 39 | | 3.3 NACH Dr | 3,738 | 6,299 | 8,768 | 3,98,211 | 6,54,138 | 8,24,491 | | 3.4 NETC | 15 | 6 | 97 | 39 | 20 | 203 | | 4. Card Payments | 47,486 | 61,769 | 73,012 | 9,19,035 | 11,96,888 | 15,35,765 | | 4.1 Credit Cards | 14,052 | 17,626 | 21,773 | 4,58,965 | 6,03,413 | 7,30,895 | | 4.2 Debit Cards | 33,434 | 44,143 | 51,239 | 4,60,070 | 5,93,475 | 8,04,870 | | 5. Prepaid Payment Instruments | 34,591 | 46,072 | 53,318 | 1,41,634 | 2,13,323 | 2,15,558 | | Total Digital Payments (1+2+3+4+5) | 1,45,902 | 2,34,339 | 3,43,456 | 13,69,86,734 | 16,38,52,286 | 16,23,05,934 | | Source: RBI. | IV.64 The social distancing requirements during the pandemic led to the digital mode of transactions being preferred over cash, although the value and volume of the former were somewhat depressed on account of the slowdown in economic activity ahead of the outbreak. The trajectory of growth in UPI-based transactions as well as overall retail digital transactions has been impressive both in value and volume terms (Chart IV.33a and b). 10. Consumer Protection IV.65 Fair treatment of customers, transparency, product suitability, privacy and grievance redressal are the overarching principles guiding the Reserve Bank in its approach to the protection of bank customers. Awareness has assumed a critical role in view of the widening customer base, introduction of technology-based banking products, and growing usage of these products by vulnerable sections of society. Recent initiatives include launch of the Complaint Management System (CMS) [a technology-enabled platform for end-to-end grievance redressal to effectively support the Ombudsman framework], launch of the Ombudsman Scheme for Non-Banking Financial Companies and Digital transactions, and also the Internal Ombudsman scheme for non-bank system participants. During 2019-20, digitisation of grievance redressal at the Reserve Bank through CMS helped in uninterrupted resolution of complaints filed by customers of regulated entities despite sharp increase in complaints (57.5 per cent) received by the offices of Ombudsman and the nation-wide lockdown imposed on account of pandemic. 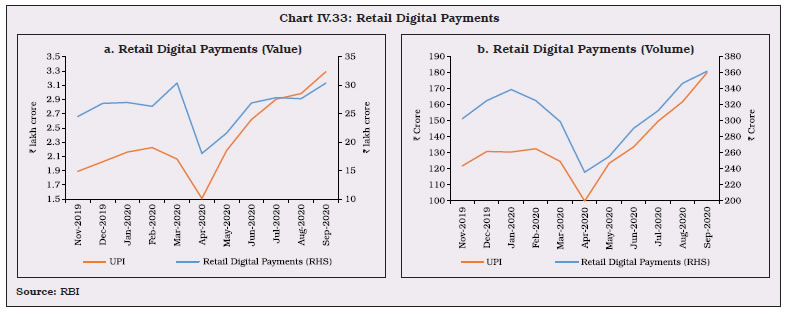 IV.66 In terms of numbers of complaints pertaining to ATM/debit cards, mobile/electronic banking and non-adherence to the Fair Practices Code were the highest in 2019-20. In comparison, during the previous year, complaints related to non-adherence to the Fair Practices Code topped the list followed by those pertaining to ATM/debit cards and mobile/electronic banking. Complaints pertaining to mobile/electronic banking, credit cards, loans and advances, non-adherence to BCSBI code, direct selling agents (DSAs) and recovery agents and levy of charges without prior notice more than doubled during the year (Table IV.23 and Appendix Table IV.8). This suggests that the consumer awareness campaigns such as ‘RBI Kehta Hai Jankar Baniye Satark Rahiye’, and ‘Is Your Banking Complaint Unresolved?’ are helping in bank customer education, awareness and maturity. Root Cause Analysis (RCA) of customer complaints was undertaken to understand the nature of consumer complaints and take appropriate measures (Box IV.3). | Table IV.23: Nature of Complaints at BOs | | Categories | 2017-18 | 2018-19 | 2019-20 | | ATM/ Debit Cards | 24,672 | 36,539 | 67,800 | | Mobile / Electronic Banking | 8,487 | 14,794 | 41,310 | | Non-observance of Fair Practice Code | 36,146 | 37,557 | 36,215 | | Credit Cards | 12,647 | 13,274 | 28,713 | | Failure to Meet Commitments | 11,044 | 13,332 | 25,036 | | Levy of Charges without Prior Notice | 8,209 | 8,391 | 18,558 | | Loans and Advances | 6,226 | 7,610 | 16,437 | | Non-adherence to BCSBI Codes | 3,962 | 5,981 | 14,194 | | Deposit Accounts | 6,719 | 10,844 | 8,778 | | Pension Payments | 7,833 | 7,066 | 6,307 | | Remittances | 3,330 | 3,451 | 4,045 | | DSAs and Recovery Agents | 554 | 629 | 1,406 | | Para-Banking* | 579 | 1,115 | 1,117 | | Notes and Coins | 1,282 | 480 | 514 | | Others | 26,219 | 28,330 | 29,204 | | Out of Purview of BO Scheme | 5,681 | 6,508 | 8,996 | | Total | 1,63,590 | 1,95,901 | 3,08,630 | Notes: 1. *: Fresh grounds included from July 1, 2017.
2. @: Data pertain to July-June.
Source: Various offices of Banking Ombudsman. |
Box IV.3: Root Cause Analysis of Customer Complaints Root cause analysis (RCA) is aimed at understanding the factors underlying the main grievances of customers to take appropriate measures. The first round of structured RCA was undertaken during May-June 2019, with a follow-up exercise during June 2020. Coordinated by the Consumer Education and Protection Department (CEPD) of the Reserve Bank, the ambit of the analysis covered complaints received by Offices of Banking Ombudsmen, Consumer Education and Protection Cells (CEPCs) and the top five banks whose customers had lodged complaints in the Offices of Banking Ombudsmen (OBOs). Areas of complaints for which RCA was done included ATM / debit cards, credit cards and recovery agents, mobile / online banking / UPI, deposit accounts / loan related, pension related complaints, levy of charges, non-observance of fair practices code, remittance, notes and coin exchange related, tax deduction at source (TDS), para-banking and violations of the Reserve Bank’s directives. RCA identified three main areas of complaints; i) lack of awareness ii) gaps in regulation, and iii) external threats such as crimes perpetrated by organised gangs. Banks were advised to take remedial actions on specific areas (Table 1). | Table 1: Root Cause Analysis of Customer Complaints: Findings | | Sr. | Main Issue | RBI Instruction | Concern | Remedial Action Proposed | | 1 | Digital Transactions | In 2013, the Reserve Bank had advised banks to track the transaction pattern of each card user in coordination with payment networks and to frame personalised breach rules to forewarn the customers for arresting frauds. | Fraudulent transactions were still being carried out by unscrupulous elements who exploited the vulnerabilities in the system. | Invigorate transaction pattern analysis, devise effective velocity checks and forewarn likely victims. | | 2 | Credit Card and Recovery Agents | In 2003, lenders were advised not to resort to undue harassment of customers for recovery of loans. Furthermore, in 2015, banks and NBFCs were advised to take a prudent approach in issuing credit cards and independently assess the credit risk involved, especially if potential card holders are students and others with no independent financial means. | Unsolicited cards being issued to consumers without proper due diligence and consumers being harassed. | Extant instructions were reiterated to the banks. | | 3 | Know Your Customer (KYC) Guidelines | The Reserve Bank’s master directions in 2016 clearly specified that the regulated entities are responsible for the identification of customers and due diligence should be carried out while undertaking any transaction with them. | Various loopholes exploited by fraudsters in the KYC practices for movement of siphoned funds. | Extant instructions were reiterated to the banks. | | 4 | Limiting Liability of Customer in Fraudulent Electronic Banking Transactions | In 2017, the Reserve Bank mandated that the liability of customers in fraudulent electronic transactions is limited if it is reported within the prescribed time and customer is not responsible for the fraud. Banks were advised to credit the amount involved (shadow reversal) within 10 days and the resolution needs to be done within 90 days. | Instances of shadow reversal of the amount involved in the unauthorised electronic transaction to the customer’s account within 10 working days not being afforded by banks and complaints being rejected in routine manner. | Extant instructions were reiterated to the banks. | | 5 | Misselling/ Para-banking | The Charter of Customer Rights (2014) issued by the Reserve Bank emphasized the right to suitability in an effort to prevent mis-selling of banking products. | Vulnerable customers still suffering due to sale of unintended – in most cases, third-party – products. | Banks were advised to treat their customers fairly, honestly and transparently, with regard to suitability and appropriateness of the financial products | | 6 | Deficiency in services to senior citizens | Detailed instructions to agency banks for ensuring timely payment of pension. | Delay in credit of pension / payments due to lack of coordination between the bank branches and the banks’ pension processing centres. | Extant instructions were reiterated to the banks. | | 7. | Lack of awareness among customers of banks | Banks to provide complete information on their products and the implications thereof should be disclosed to customers to help them take an informed decision. | Customers of banks are susceptible to errors and victimization through malpractices and frauds. | Banks were advised to enhance consumer awareness in the areas of safe digital banking, consumer rights and responsibilities and grievance redressal avenues. | | IV.67 The share of complaints emanating from urban and metropolitan areas account for more than three fourth of the total, indicating the higher level of awareness regarding grievance redressal mechanisms in these areas (Chart IV.34a). This also highlights the ground that needs to be covered by future awareness and consumer education campaigns. A disproportionately large share of complaints relating to levy of charges without prior notice were filed against PVBs (49 per cent, given that their share in total assets of the banking sector is 32 per cent). Since PSBs are the traditional preference of pensioners, almost all the complaints in this area were against them (close to 98 per cent), (Chart IV.34b). 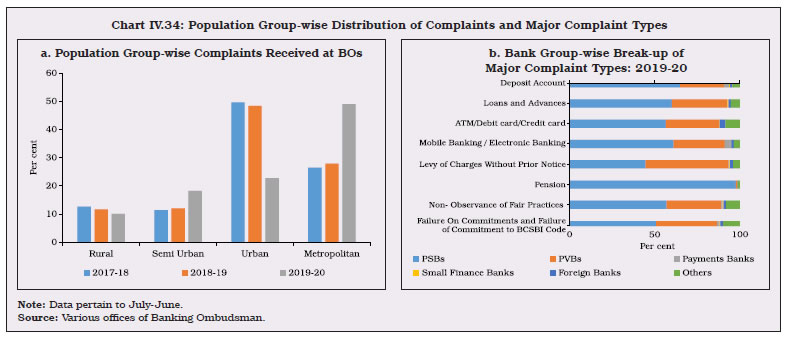 IV.68 Deposit guarantee schemes around the world have become an important policy tool for protecting savings of small depositors and building trust in the banking sector. The Finance Minister in Union Budget 2020-21 announced an increase in deposit insurance cover to ₹5 lakh from ₹1 lakh earlier [refer to Chapter III: Policy Environment for details]. By March 2020, more than 90 per cent of the total number of accounts were insurance-protected under ₹1 lakh cover, which increased to over 98 per cent when the coverage increased to ₹5 lakh with effect from February 4, 20207. The amount of insured deposits covered was close to 30 per cent (₹1 lakh), which increased to more than 50 per cent under ₹5 lakh insurance cover. The share of insured deposits accordingly increased to more than 70 per cent in the case of co-operative banks, LABs and RRBs (Table IV.24). | Table IV.24: Bank Group-wise Insured Deposits | | (As on March 31, 2020) | | (Amount in ₹ crore) | | Bank Group | No. of Insured Banks | Total Assessable Deposits (AD) | Total Insured Deposits (ID) | ID as percentage of AD | | ₹5 lakh Cover | ₹1 lakh Cover | ₹5 lakh Cover | ₹1 lakh Cover | | 1 | 2 | 3 | 4 | 5 | 6 | 7 | | Public Sector Banks | 13 | 77,27,690 | 44,27,421 | 23,45,905 | 57.3 | 30.4 | | Private Sector Banks | 37 | 38,24,556 | 13,94,640 | 6,96,219 | 36.5 | 18.2 | | Foreign Banks | 46 | 5,86,232 | 37,360 | 15,609 | 6.4 | 2.7 | | Regional Rural Banks | 45 | 4,19,317 | 357,311 | 2,41,050 | 85.2 | 57.5 | | Co-operative Banks | 1,923 | 9,30,315 | 654,099 | 3,96,917 | 70.3 | 42.7 | | Local Area Banks | 3 | 799 | 654 | 389 | 81.9 | 48.7 | | TOTAL | 2,067 | 1,34,88,908 | 68,71,484 | 36,96,089 | 50.9 | 27.4 | Notes: 1. Based on deposit base of September 2019 i.e., six months prior to the reference date.
2. Data on private sector banks is inclusive of small finance banks and payments banks.
Source: Deposit Insurance and Credit Guarantee Corporation. | 11. Financial Inclusion IV.69 Sound financial inclusion policies have a multiplier effect on economic growth reducing poverty and income inequality, while also being conducive for financial stability. The latest Financial Access Survey (FAS) data of the IMF8 show that various initiatives taken by the Reserve Bank and the Government in the direction of financial inclusion have borne fruit. The number of bank branches per 100,000 adults rose to 14.6 in 2019 from 13.6 in 2015, which is higher than Germany, China and South Africa (Chart IV.35a). With a strong government push to increase bank account among unbanked adults through Pradhan Mantri Jan Dhan Yojana (PMJDY), the number of persons with deposit accounts at banks significantly increased, becoming comparable with emerging economy peers and even some of the advanced economies (Chart IV.35b). Even in terms of access to credit, noticeable progress has been made, although, it remains much lower than its peers (Chart IV.35c). In terms of use of digital payments too, India made noteworthy progress due to various Government initiatives and promotion of usage of digital medium for payments. Between 2015 and 2019, the number of mobile and internet banking transactions per 1,000 adults has increased to 6,184 in 2019 from 183 in 2015 (Chart IV.35d). 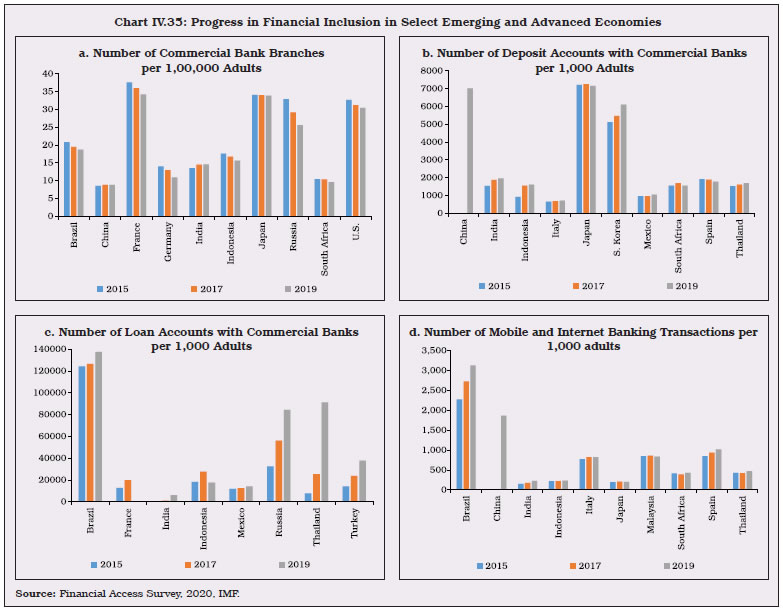 IV.70 In order to systematically accelerate the level of financial inclusion in the country in a sustainable manner, the National Strategy for Financial Inclusion (NSFI) 2019-24 was released in January 2020. Further, with a view to align the Reserve Bank’s policies with the vision outlined in the NSFI document, the Financial Inclusion Plan (FIP) template has been revised and rechristened as ‘Monitoring Progress of Financial Inclusion (MPFI)’ to capture more granular data and qualitative aspects at the ground level. IV.71 The new branch authorisation policy of 2017 – which recognises Business Correspondent (BCs) that provide banking services for a minimum of four hours per day and for at least five days a week as banking outlets – coupled with emphasis on digitisation and modernisation of technological infrastructure has progressively obviated the need to set up brick and mortar branches. As has been observed for the last few years, during 2019-20 also, branch expansion in rural areas remained subdued as BC model made further inroads in villages with population more than 2,000. The BC phenomenon did not remain restricted to rural areas alone and model gained popularity even in urban areas. Further, the growth in the number of Basic Savings Bank Deposit Accounts (BSBDAs) and deposits mobilised through BCs remained higher than BSBDAs in physical bank branches (Table IV.25). Based on experience gained during the COVID-19 pandemic, the BC model is likely to strengthen further as physical access to banks is constrained by social distancing. | Table IV.25: Financial Inclusion Plan | | Sr. No. | Particulars | End-March 2010 | End-March 2019 | End-March 2020* | Y-o-Y Growth 2019-20 | | 1. | Banking Outlets in Villages- Branches | 33,378 | 52,489 | 54,561 | 3.9 | | 2. | Banking Outlets in Villages>2000-BCs | 8,390 | 1,30,687 | 1,49,106 | 14.1 | | 3. | Banking Outlets in Villages<2000-BCs | 25,784 | 4,10,442 | 3,92,069 | -4.5 | | 4. | Total Banking Outlets in Villages – BCs | 34,174 | 5,41,129 | 5,41,175 | 0.0 | | 5. | Banking Outlets in Villages – Other Modes | 142 | 3,537 | 3,481 | -1.6 | | 6. | Banking Outlets in Villages –Total | 67,694 | 5,97,155 | 5,99,217 | 0.3 | | 7. | Urban Locations Covered Through BCs | 447 | 4,47,170 | 6,35,046 | 42.0 | | 8. | BSBDA - Through Branches (No. in Lakh) | 600 | 2,547 | 2,616 | 2.7 | | 9. | BSBDA - Through Branches (Amt. in Crore) | 4,400 | 87,765 | 95,831 | 9.2 | | 10. | BSBDA - Through BCs (No. in Lakh) | 130 | 3,195 | 3,388 | 6.0 | | 11. | BSBDA - Through BCs (Amt. in Crore) | 1,100 | 53,195 | 72,581 | 36.4 | | 12. | BSBDA - Total (No. in Lakh) | 735 | 5,742 | 6,004 | 4.6 | | 13. | BSBDA - Total (Amt. in Crore) | 5,500 | 1,40,960 | 1,68,412 | 19.5 | | 14. | OD Facility Availed in BSBDAs (No. in Lakh) | 2 | 59 | 64 | 8.5 | | 15. | OD Facility Availed in BSBDAs (Amt. in Crore) | 10 | 443 | 529 | 19.4 | | 16. | KCC - Total (No. in Lakh) | 240 | 491 | 475 | -3.3 | | 17. | KCC - Total (Amt. in Crore) | 1,24,000 | 6,68,044 | 6,39,069 | -4.3 | | 18. | GCC - Total (No. in Lakh) | 10 | 120 | 202 | 68.3 | | 19. | GCC - Total (Amt. in Crore) | 3,500 | 1,74,514 | 1,94,048 | 11.2 | | 20. | ICT-A/Cs-BC-Total Transactions (No. in Lakh) | 270 | 21,019 | 32,318 | 53.8 | | 21. | ICT-A/Cs-BC-Total Transactions (Amt. in Crore) | 700 | 5,91,347 | 8,70,643 | 47.2 | Notes: 1. *: Provisional.
2. Sr. No. 1-16 consist of cumulative data from the inception. Sr. No. 17-18 consist of data from the start of corresponding financial year.
Source: FIP returns submitted by banks. |
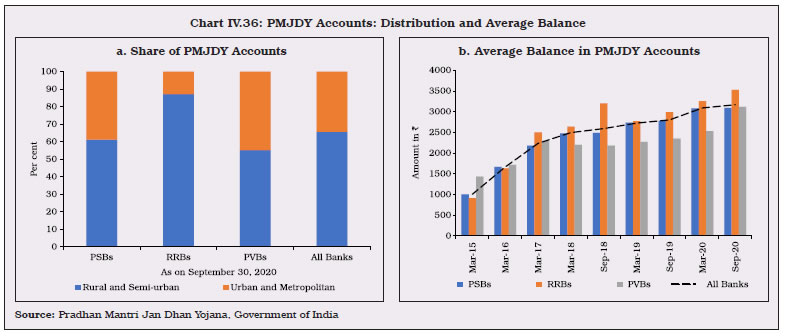 11.1 Pradhan Mantri Jan Dhan Yojana (PMJDY) IV.72 In six years of its implementation, the total number of accounts opened under PMJDY reached 41.4 crore, with ₹1.30 lakh crore of deposits as on December 2, 2020. Of these accounts, nearly two-third are operational in rural and semi-urban areas. As on September 2020, more than 60 per cent of PMJDY accounts were with PSBs (Chart IV.36a). However, usage of these accounts remains a concern, with lacklustre growth in the average balance in these accounts (Chart IV.36b). 11.2 New Bank Branches by SCBs IV.73 The decline in the number of new bank branches during 2019-20 was mainly due to SFBs, RRBs and PBs. PVBs and SFBs maintained the lead in opening new branches as part of their business expansion strategy. (Chart IV.37). During the year, more than half of the new branches were opened in Tier I centres, although fewer branches were opened in other higher tier centres (Table IV.26). 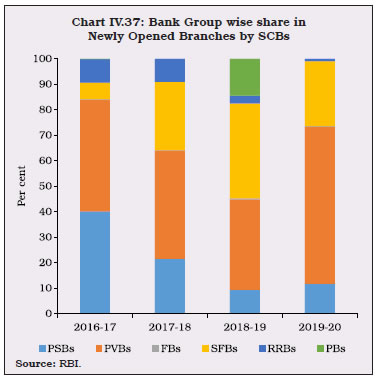
| Table IV.26: Tier-wise Break-up of Newly Opened Bank Branches by SCBs | | Centre | 2016-17 | 2017-18 | 2018-19 | 2019-20 | | Tier 1 | 2,328 | 1,593 | 2,123 | 2,184 | | | (43.6) | (40.4) | (47.0) | (53.1) | | Tier 2 | 363 | 335 | 513 | 363 | | | (6.8) | (8.5) | (11.4) | (8.8) | | Tier 3 | 638 | 572 | 697 | 550 | | | (12.0) | (14.5) | (15.4) | (13.4) | | Tier 4 | 422 | 334 | 358 | 329 | | | (7.9) | (8.5) | (7.9) | (8.0) | | Tier 5 | 654 | 451 | 382 | 247 | | | (12.3) | (11.4) | (8.5) | (6.0) | | Tier 6 | 930 | 656 | 443 | 443 | | | (17.4) | (16.6) | (9.8) | (10.8) | | Total | 5,335 | 3,941 | 4,516 | 4,116 | | | (100.0) | (100.0) | (100.0) | (100.0) | Notes: 1. Tier-wise classification of centres is as follows: ‘Tier 1’ includes centres with population of 1, 00,000 and above, ‘Tier 2’ includes centres with population of 50,000 to 99,999, ‘Tier 3’ includes centres with population of 20,000 to 49,999, ‘Tier 4’ includes centres with population of 10,000 to 19,999, ‘Tier 5’ includes centres with population of 5,000 to 9,999, and ‘Tier 6’ includes centres with population of Less than 5000.
2. Data exclude ‘Administrative Offices’.
3. All population figures are as per census 2011.
4. Central Information System for Banking Infrastructure data are dynamic in nature. The data are updated based on information received from banks.
5. Figures in the parentheses represent proportion of the branches opened in a particular area vis-à-vis the total.
Source: Central Information System for Banking Infrastructure (erstwhile Master Office File system) database, RBI. | 11.3 ATMs IV.74 The deceleration in the total number of ATMs (on-site and off-site) operated by banks reversed during the year, aided by all categories of banks, except PSBs and FBs (Table IV.27 and Appendix Table IV.7). Interestingly, SFBs operated more than twice the number of ATMs operated by FBs as at end-March 2020, despite their smaller balance sheet size. The high growth of white label ATMs (WLAs) for the second consecutive year was fuelled by regulatory support such as permission to source cash directly from the Reserve Bank and permission to offer non-bank services (Chart IV.38). More than 82 per cent of the WLAs are located in rural and semi-urban areas with high unmet demand for ATMs. Data available for 2020-21 so far indicate that the growth in WLAs continued as the rural economy was not as severely impacted as the urban areas due to the lockdown associated with COVID-19. 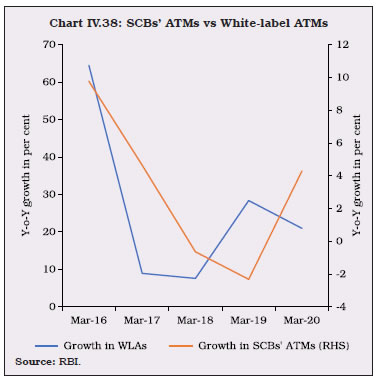 IV.75 The geographical distribution of ATMs across rural and urban areas remained broadly similar in 2019-20 to that in the previous year. The concentration of ATMs remains tilted towards urban customers (Table IV.28). | Table IV.27: ATMs | | (At end-March) | | Sr. No. | Bank Group | On-site ATMs | Off-site ATMs | Total Number of ATMs | | 2019 | 2020 | 2019 | 2020 | 2019 (3+5) | 2020 (4+6) | | I | PSBs | 78,419 | 78,484 | 57,679 | 56,379 | 1,36,098 | 1,34,863 | | II | PVBs | 26,197 | 32,690 | 37,143 | 40,362 | 63,340 | 73,052 | | III | FBs | 221 | 225 | 693 | 678 | 914 | 903 | | IV | SFBs* | 1,541 | 1,870 | 301 | 56 | 1,842 | 1,926 | | V | WLAs | - | - | - | - | 19,507 | 23,597 | | VI | All SCBs (I to IV) | 1,06,378 | 1,13,269 | 95,816 | 97,475 | 2,02,194 | 2,10,744 | | VII | Total (V+VI) | | | | | 2,21,701 | 2,34,341 | Note: *: 10 scheduled SFBs as at end-March 2020.
Source: RBI. |
| Table IV.28: Number of ATMs of SCBs at Various Centres | | (At end-March) | | Bank Group | Rural | Semi - Urban | Urban | Metropolitan | Total | | Public Sector Banks | 27,451 | 39,551 | 38,522 | 29,339 | 1,34,863 | | (20.4) | (29.3) | (28.6) | (21.8) | (100.0) | | Private Sector Banks | 6,046 | 17,708 | 19,138 | 30,160 | 73,052 | | (8.3) | (24.2) | (26.2) | (41.3) | (100.0) | | Foreign Banks | 23 | 18 | 167 | 695 | 903 | | (2.5) | (2.0) | (18.5) | (77.0) | (100.0) | | Small Finance Banks* | 213 | 579 | 617 | 517 | 1,926 | | (11.1) | (30.1) | (32.0) | (26.8) | (100.0) | | Total | 33,733 | 57,856 | 58,444 | 60,711 | 2,10,744 | | (16.0) | (27.5) | (27.7) | (28.8) | (100.0) | | Growth over Previous Year | 0.85 | 3.17 | 4.64 | 6.86 | 4.23 | Notes: 1. Figures in parentheses indicate percentage share of total ATMs under each bank group.
2. *: 10 scheduled SFBs as at end-March 2020.
Source: RBI. |
| Table IV.29: Credit Flow to the MSME sector by SCBs | | (Number of accounts in lakh, amount outstanding in ₹ crore) | | | | 2016-17 | 2017-18 | 2018-19 | 2019-20 | | Public Sector Banks | No. of accounts | 111.97 | 111.01 | 112.97 | 110.82 | | (4.8) | (-0.9) | (1.8) | (-1.9) | | Amount Outstanding | 8,28,933 | 8,64,598 | 8,80,033 | 8,93,315 | | (1.0) | (4.3) | (1.8) | (1.5) | | Private Sector Banks | No. of accounts | 119.59 | 148.33 | 205.31 | 270.62 | | (24.0) | (24.0) | (38.4) | (31.8) | | Amount Outstanding | 4,30,963 | 4,10,760 | 5,63,678 | 6,46,988 | | (20.0) | (-4.7) | (37.2) | (14.8) | | Foreign Banks | No. of accounts | 2.07 | 2.20 | 2.40 | 2.74 | | (11.1) | (6.2) | (9.3) | (14.1) | | Amount Outstanding | 36,503 | 48,881 | 66,939 | 73,279 | | (0.4) | (33.9) | (36.9) | (9.47) | | All SCBs | No. of accounts | 233.63 | 261.54 | 320.68 | 384.18 | | (13.9) | (12.0) | (22.6) | (19.8) | | Amount Outstanding | 12,96,399 | 13,24,239 | 15,10,651 | 16,13,582 | | (6.6) | (2.2) | (14.1) | (6.8) | Note: Figures in the parentheses indicate y-o-y growth rates.
Source: RBI. | 11.4 Microfinance Programme IV.76 Steady progress was made in the delivery of micro-credit through self-help groups (SHGs) and joint liability groups (JLGs). During 2019-20, 31.5 lakh new SHGs were credit-linked with banks and loans of ₹ 77,659 crore (including repeat loans) were disbursed to these SHGs. During the year, the number of Joint Liability Group (JLG) and loan amounts disbursed by banks grew by 161 per cent and 169 per cent, respectively. The NPA ratio of the SHG loans declined to 4.9 per cent from 5.2 per cent in the previous year9 (Appendix Table IV.13). 11.5 Credit to Micro, Small and Medium Enterprises (MSMEs) IV.77 The number of MSME accounts and credit growth decelerated across PVBs and PSBs in 2019-20. PSBs’ share in total credit to MSMEs decreased from 65 per cent in 2017-18 to 55 per cent in 2019-20. Although the number of accounts with PVBs was more than double that with PSBs in 2019-20, the average amount of loans extended by PVBs was ₹2.39 lakh – much lower than ₹8.12 lakh by PSBs (Table IV.29). 11.6 Trade Receivables Discounting System (TReDS) IV.78 The Trade Receivables Discounting System (TReDS) conceived by the Reserve Bank in 2014 is an electronic platform on which receivables of MSMEs drawn against buyers (large corporates, PSUs, Government departments) are financed by multiple financiers through a competitive auction process. To widen the scope of TReDS and to incentivise more players to be part of this platform, banks’ exposures were brought under priority sector lending in 2016. Three entities [viz., Receivables Exchange of India Ltd. (RXIL), A.TReDS, and Mynd Solutions] licensed by the Reserve Bank have been operating the platform for more than three years. In October 2019, the Reserve Bank had allowed ‘on-tap’ authorisation to entities desirous of providing platforms for TReDS. During 2019-20, the number and amount of invoices uploaded and financed through the platform almost doubled, however, the success rate10 was marginally lower (Table IV.30). | Table IV.30: Progress in MSME Financing through TReDS | | (Invoices in number, amount in ₹ crore) | | Financial Year | Invoices Uploaded | Invoices Financed | | Invoices | Amount | Invoices | Amount | | 2017-18 | 22,704 | 1,094.82 | 19,890 | 814.54 | | 2018-19 | 2,51,695 | 6,699.57 | 2,32,098 | 5,854.48 | | 2019-20 | 5,30,077 | 13,088.27 | 4,77,969 | 11,165.86 | | Source: RBI. | 11.7 Regional Banking Penetration IV.79 Despite recent strides in banking penetration across various geographies, significant inter-regional inequality remains in terms of the share of different regions in credit, deposits and branches (Chart IV.39a). The average population served per bank branch remains substantially higher in eastern, central and north-eastern regions than in other parts (Chart IV.39b). 12. Regional Rural Banks IV.80 Regional Rural Banks (RRBs) bring together the rural orientation of credit co-operatives and professionalism of commercial banks to address the credit needs of the rural economy. With a view to enabling RRBs to minimize their overhead expenses, optimize the use of technology, enhance the capital base and area of operation, and increase their exposure, the Government has initiated a structural consolidation of RRBs in three phases. In the ongoing third phase of amalgamation based on the principle of ‘one state–one RRB’ in smaller states and reduction in number of RRBs in larger states, the number of RRBs declined to 45 by end-March 2020. Three RRBs were amalgamated, reducing the total number of RRBs to 43 with effect from April 1, 2020. In order to recapitalise RRBs with CRAR below 9 per cent, the Government extended the process of recapitalisation up to 2020-21 and earmarked ₹670 crore as the central government’s share in their recapitalization. This amount is equivalent to 50 per cent of the planned recapitalization support of ₹1,340 crore, subject to the condition that the sponsor banks release their proportionate shares. 12.1 Balance Sheet Analysis IV.81 The acceleration in the consolidated balance sheet of RRBs during 2019-20 was driven by capital expansion, fuelled by recapitalisation, as well as expansion of term deposits. On the assets side, RRBs resorted to parking their funds in investments as the loans and advances growth was subdued. Accumulated losses of RRBs more than doubled during 2019-20 (Table IV.31). IV.82 RRBs are mandated to provide 75 per cent of their total outstanding advances as on the corresponding date of the previous year for priority sector lending. During 2019-20, RRBs overachieved this mandate with 96 per cent. Agriculture lending topped the list of RRB credit portfolio (70 per cent), followed by exposure to MSMEs (12.0 per cent) and housing (7.8 per cent) (Table IV.32). | Table IV.31: Consolidated Balance Sheet of Regional Rural Banks | | (Amount in ₹ Crore) | | Sr. No. | Item | At end-March | Y-o-Y Growth in Percent | | 2019 | 2020P | 2018-19 | 2019-20 | | 1 | 2 | 3 | 4 | 5 | 6 | | 1 | Share Capital | 6,735 | 7,849 | 4.6 | 16.5 | | 2 | Reserves | 25,398 | 26,817 | 0.8 | 5.6 | | 3 | Deposits | 4,34,444 | 4,78,547 | 8.5 | 10.2 | | | 3.1 Current | 11,124 | 10,750 | 8.8 | -3.4 | | | 3.2 Savings | 2,24,095 | 2,44,224 | 11.5 | 9.0 | | | 3.3 Term | 1,99,226 | 2,23,573 | 5.3 | 12.2 | | 4 | Borrowings | 53,548 | 54,393 | -7.1 | 1.6 | | | 4.1 from NABARD | 46,894 | 46,120 | 2.1 | -1.6 | | | 4.2 Sponsor Bank | 3,738 | 4,519 | -59.9 | 20.9 | | | 4.3 Others | 2,916 | 3,754 | 21.9 | 28.7 | | 5 | Other Liabilities | 17,864 | 25,372 | 17.3 | 42.0 | | | Total liabilities/Assets | 5,37,989 | 5,92,978 | 6.5 | 10.2 | | 6 | Cash in Hand | 2,913 | 2,860 | 4.4 | -1.8 | | 7 | Balances with RBI | 17,897 | 16,744 | 13.2 | -6.4 | | 8 | Other Bank Balances | 5,469 | 7,613 | -2.5 | 39.2 | | 9 | Investments | 2,26,172 | 2,49,155 | 1.8 | 10.2 | | 10 | Loans and Advances (net) | 2,61,953 | 2,86,919 | 10.5 | 9.5 | | 11 | Fixed Assets | 1,274 | 1,226 | 4.1 | -3.8 | | 12 | Other Assets # | 22,311 | 28,462 | 10.1 | 27.6 | | | 12.1 Accumulated Losses | 2,887 | 6,467 | 54.7 | 124.0 | Note: 1. #: Includes accumulated losses.
2. P Provisional.
3. Totals may not tally on account of rounding off of figures in ₹ Crore. Percentage Variations could be slightly different as absolute numbers have been rounded off to ₹ Crore
Source: NABARD. | 12.2 Financial Performance of RRBs IV.83 With acceleration in provisioning due to elevated NPAs and a sharp increase in operating expenses – largely attributed to higher wage bills on account of implementation of pension scheme – RRBs reported net losses for the second consecutive year. Their operating profits also declined, despite robust growth in both interest and non-interest income. Provisioning for pension liability and deteriorating asset quality led to erosion in capital positions of RRBs (Table IV.33). NPAs of RRBs are concentrated in the eastern, north-eastern and central regions which together accounted for 74 per cent of the loss making RRBs (Appendix Table IV.14). | Table IV.32: Purpose-wise Outstanding Advances by RRBs | | (Amount in ₹ Crore) | | Sr. No. | Purpose/End-March | 2019 | 2020P | | 1 | 2 | 3 | 4 | | I | Priority (i to v) | 2,55,022 | 2,70,145 | | | Per cent of total loans outstanding | 90.8 | 90.6 | | | i Agriculture | 1,96,228 | 2,08,831 | | | ii Micro small and medium enterprises | 33,723 | 35,239 | | | iii Education | 2,634 | 2,351 | | | vi Housing | 18,238 | 19,750 | | | v Others | 4,199 | 3,974 | | II | Non-priority (i to vi) | 25,733 | 28,111 | | | Per cent of total loans outstanding | 9.2 | 9.4 | | | i Agriculture | 1 | 9 | | | ii Micro small and medium enterprises | 306 | 495 | | | iii Education | 72 | 75 | | | iv Housing | 2,606 | 3,477 | | | v Personal Loans | 6,392 | 7,157 | | | vi Others | 16,356 | 16,898 | | Total (I+II) | 2,80,755 | 2,98,256 | Notes: 1. P: Provisional
2. Totals may not tally on account of rounding off of figures in ₹ Crore.
Source: NABARD. |
| Table IV.33: Financial Performance of Regional Rural Banks | | (Amount in ₹ Crore) | | Sr. No. | Item | Amount | Y-o-Y Change in per cent | | 2018-19 | 2019-20P | 2018-19 | 2019-20 | | 1 | 2 | 3 | 4 | 5 | 6 | | A | Income (i + ii) | 42,988 | 49,452 | 2.8 | 15.0 | | | i Interest income | 38,931 | 43,698 | 1.5 | 12.2 | | | ii Other income | 4,057 | 5,754 | 16.5 | 41.8 | | B | Expenditure (i+ii+iii) | 43,639 | 51,658 | 8.2 | 18.4 | | | i Interest expended | 23,716 | 25,985 | -0.6 | 9.6 | | | ii Operating expenses | 13,803 | 18,651 | 25.3 | 35.1 | | | of which, Wage bill | 9,379 | 12,842 | 33.1 | 36.9 | | | iii Provisions and contingencies | 6,120 | 7,021 | 12.7 | 14.7 | | C | Profit | | | | | | | i Operating profit | 5,459 | 4,523 | -27.6 | -17.2 | | | ii Net profit | - 652 | -2,206 | - | - | | D | Total Average Assets | 5,18,349 | 5,54,200 | 8.7 | 6.9 | | E | Financial ratios # | | | | | | | i Operating profit | 1.1 | 0.8 | | | | | ii Net profit | - 0.1 | -0.4 | | | | | iii Income (a + b) | 8.3 | 8.9 | | | | | (a) Interest income | 7.5 | 7.9 | | | | | (b) Other income | 0.8 | 1.0 | | | | | iv Expenditure (a+b+c) | 8.4 | 9.3 | | | | | (a) Interest expended | 4.6 | 4.7 | | | | | (b) Operating expenses | 2.7 | 3.4 | | | | | of which, Wage bill | 1.8 | 2.3 | | | | | (c) Provisions and contingencies | 1.2 | 1.3 | | | | F | Analytical Ratios (%) | | | | | | | Gross NPA Ratio | 10.8 | 10.4 | | | | | CRAR | 11.5 | 10.3 | | | Notes: 1. P- Provisional
2. # Financial ratios are percentages with respect to average total assets.
3. Totals may not tally on account of rounding off of figures in ₹ Crore. Percentage Variations could be slightly different as absolute numbers have been rounded off to ₹ crore
Source: NABARD. | 13. Local Area Banks IV.84 In line with SCBs, the consolidated balance sheet of LABs decelerated in 2019-20. Contrary to SCBs, however, the deceleration was led by deposits while gross advances surged (Table IV.34). Reflective of this, the outstanding credit-deposit ratio of LABs increased from 75 per cent in the previous year to 81 per cent in 2019-20, unlike SCBs which experienced decline. 13.1 Financial Performance of LABs IV.85 In an environment characterised by low interest rates, the acceleration in interest income of LABs was moderate, while non-interest income increased substantially as these banks diversified their business. Slower increase in expenditure as compared to income led to increase in their profitability (Table IV.35). | Table IV.34: Profile of Local Area Banks | | (At end-March) | | (Amount in ₹ crore) | | | 2018-19 | 2019-20 | | 1. Assets | 926.4 | 1026.0 | | | (13.0) | (10.8) | | 2. Deposits | 746.9 | 813.8 | | | (14.7) | (9.0) | | 3. Gross Advances | 559.7 | 660.5 | | | (8.9) | (18.0) | Note: Figures in parenthesis represent y-o-y growth in per cent.
Source: Off-site returns, global operations, RBI. |
| Table IV.35: Financial Performance of Local Area Banks | | (At end-March) | | | Amount in ₹ crore | Y-o-Y growth in per cent | | 2018-19 | 2019-20 | 2018-19 | 2019-20 | | 1. Income (i+ii) | 118 | 135 | 1.7 | 14.9 | | i) Interest income | 97 | 107 | 7.6 | 10.6 | | ii) Other income | 21 | 28 | -19.0 | 35.0 | | 2. Expenditure (i+ii+iii) | 107 | 121 | 8.6 | 13.9 | | i) Interest expended | 45 | 52 | 7.3 | 14.8 | | ii) Provisions and contingencies | 9 | 13 | -6.4 | 53.8 | | iii) Operating expenses | 53 | 56 | 12.6 | 6.7 | | of which, wage bill | 24 | 26 | 22.2 | 8.1 | | 3. Profit | | | | | | i) Operating profit / loss | 20 | 27 | -26.3 | 37.3 | | ii) Net profit / loss | 11 | 14 | -36.7 | 24.6 | | 4. Net Interest Income | 52 | 55 | 7.9 | 6.9 | | 5. Total Assets | 926 | 1,026 | 13.0 | 10.8 | | 6. Financial Ratios @ | | | | | | i. Operating Profit | 2.1 | 2.7 | | | | ii. Net Profit | 1.2 | 1.4 | | | | iii. Income | 12.7 | 13.2 | | | | iv. Interest Income | 10.4 | 10.4 | | | | v. Other Income | 2.3 | 2.8 | | | | vi. Expenditure | 11.5 | 11.8 | | | | vii. Interest Expended | 4.9 | 5.0 | | | | viii. Operating Expenses | 5.7 | 5.5 | | | | ix. Wage Bill | 2.6 | 2.6 | | | | x. Provisions and contingencies | 0.9 | 1.3 | | | | xi. Net Interest Income | 5.6 | 5.4 | | | Notes: 1. Financial ratios for 2019-20 are calculated based on the Asset of current year only.
2. @: Ratios as per cent of average assets of last two years.
3. ‘Wage Bill’ is taken as Payments to and provisions for employees.
Source: Off-site Returns, global operations, RBI. | 14. Small Finance Banks IV.86 Small Finance Banks (SFBs) were set up in 2016 to provide basic banking services such as accepting deposits and lending to the unserved and the under-served sections of society, including small businesses, marginal farmers, micro and small industries, and the unorganised sector. At end-March 2020, ten SFBs were operational. 14.1 Balance Sheet of SFBs IV.87 In keeping with development over the last couple of years, SFBs’ dependence on bank borrowings declined further in 2019-20 with deposits contributing more than 60 per cent of liabilities. On the assets side, however, balance sheet growth was led by investments as loans and advances decelerated (Table IV.36). | Table IV.36: Consolidated Balance Sheet of Small Finance Banks | | (At end-March) | | (Amount in ₹ crore) | | Sr. No. | | 2019 | 2020 | Y-o-Y growth in per cent | | 1 | Share Capital | 4,759.6 | 5,151.0 | 8.2 | | 2 | Reserves & Surplus | 6,967.1 | 11,047.0 | 58.6 | | 3 | Tier II Bonds | 3,831.0 | 3,795.0 | -0.9 | | 4 | Deposits | 55,686.3 | 82,488.0 | 48.1 | | | 4.1 Current Demand Deposits | 2,155.0 | 2,381.0 | 10.5 | | | 4.2 Savings | 7,669.1 | 10,284.0 | 34.1 | | | 4.3 Term | 45,862.1 | 69,823.0 | 52.2 | | 5 | Borrowings (Including Tier II Bonds) | 27,838.9 | 30,004.0 | 7.8 | | | 5.1 Bank | 3,466.3 | 3,784.0 | 9.2 | | | 5.2 Others | 24,372.4 | 25,948.0 | 6.5 | | 6 | Other Liabilities & provisions | 3,672.5 | 4,078.0 | 11.0 | | Total liabilities/Assets | 98,884.0 | 1,32,689.0 | 34.2 | | 7 | Cash in Hand | 461.3 | 976.0 | 111.6 | | 8 | Balances with RBI | 3,162.1 | 4,082.0 | 29.1 | | 9 | Other Bank Balances/ Balances with Financial Institutions | 4,601.8 | 8,701.0 | 89.1 | | 10 | Investments | 17,287.0 | 24,203.0 | 40.0 | | 11 | Loans and Advances | 69,856.8 | 90,576.0 | 29.7 | | 12 | Fixed Assets | 1,642.7 | 1,649.0 | 0.4 | | 13 | Other Assets | 1,913.3 | 2,580.0 | 34.8 | | Source: Off-site returns (domestic operations), RBI. | 14.2 Priority Sector Lending of SFBs IV.88 The share of SFBs’ lending to the priority sector declined for the third year in a row in 2019-20 with a quarter of total advances coming under non-priority sector as at end-March 2020. Within priority sector, their focus remained on MSMEs, followed by agriculture. There was an increase in the share of housing as a proportion to total advances (Table IV.37). 14.3 Financial Performance of SFBs IV.89 During 2019-20, the asset quality of SFBs improved, leading to a significant contraction in provisions and contingencies requirements even as their CRAR improved (Table IV.38). 15. Payments Banks IV.90 Payments Banks (PBs) are niche banks that leverage technology for financial inclusion and are aimed at small businesses and low-income households. Their business model focuses on small remittances which are stored in digital wallets that can, in turn, be used for purchases of goods and services. Being a nascent business model that requires heavy overhead costs especially at the beginning, most of these banks are yet to turn profitable. | Table IV.37: Purpose-wise Outstanding Advances by Small Finance Banks | | (Share in total advances) | | Purpose | end-March 2019 | end-March 2020 | | I Priority (i to v) | 78.1 | 75.0 | | Per cent to total loans outstanding | | | | i. Agriculture and allied activities | 24.6 | 23.0 | | ii. Micro small and medium enterprises | 35.0 | 35.8 | | iii. Education | 0.0 | 0.1 | | iv. Housing | 2.7 | 3.9 | | v. Others | 15.8 | 12.3 | | II Non-priority (i to vi) | 21.9 | 25.0 | | Total (I+II) | 100 | 100 | | Source: Off-site returns (domestic operations), RBI. |
| Table IV.38: Financial Performance of Small Finance Banks | | (At end-March) | | (Amount in ₹ crore) | | Sr. No. | Item | 2018-19 | 2019-20 | Y-o-Y growth | | 1 | 2 | 3 | 4 | 5 | | A | Income (i + ii) | 13,239.0 | 19,219.0 | 45.2 | | | i Interest Income | 11,819.0 | 16,948.0 | 43.4 | | | ii Other Income | 1,421.0 | 2,271.0 | 59.8 | | B | Expenditure (i+ii+iii) | 13,756.0 | 17,251.0 | 25.4 | | | i Interest Expended | 5,500.0 | 7,928.0 | 44.1 | | | ii Operating Expenses | 5,728.0 | 7,152.0 | 24.9 | | | of which, Staff Expenses | 2,962.0 | 3,811.0 | 28.7 | | | iii Provisions and contingencies | 2,529.0 | 2,171.0 | -14.2 | | C | Profit (Before Tax) | -188.0 | 2,679.0 | | | | i Operating Profit (EBPT) | 1,802.0 | 4,141.0 | 129.8 | | | ii Net Profit (PAT) | -727.0 | 1,968.0 | | | D | Total Assets | 98,884.0 | 1,32,689.0 | 34.2 | | E | Financial Ratios # | | | | | | i Operating Profit | 1.82 | 3.12 | | | | ii Net Profit | -0.74 | 1.48 | | | | iii Income (a + b) | 13.39 | 14.48 | | | | (a) Interest Income | 11.95 | 12.77 | | | | (b) Other Income | 1.44 | 1.71 | | | | iv Expenditure (a+b+c) | 13.91 | 13.00 | | | | (a) Interest Expended | 5.56 | 5.97 | | | | (b) Operating Expenses | 5.79 | 5.39 | | | | of which, Staff Expenses | 3.00 | 2.87 | | | | (c) Provisions and contingencies | 2.56 | 1.64 | | | F | Analytical Ratios (%) | | | | | | Gross NPA Ratio | 2.35 | 1.87 | | | | CRAR | 16.7 | 20.2 | | | | Core CRAR | 13.1 | 17.2 | | Note: # As per cent to total assets.
Source: Off-site returns (domestic operations), RBI. | 15.1 Balance Sheet IV.91 At end-March 2020, the number of operational PBs declined to six as compared with seven in the previous year as one bank surrendered its licence. The consolidated balance sheet of PBs increased in 2019-20 on a hefty increase in deposits with their share in liabilities more than doubling to 27.4 per cent from 12.3 per cent in 2018-19, despite the cap of ₹1 lakh per account. As these banks are not permitted to lend, their asset side growth was due to spurt in investments and balances with banks (Table IV.39). | Table IV.39: Consolidated Balance Sheet of Payments Banks | | (Amount in ₹ crore) | | Item | March-18 | March-19 | March-20 | | 1. Total Capital and Reserves | 1,848 | 1,899 | 1,862 | | 2. Deposits | 438 | 882 | 2,306 | | 3. Other Liabilities and Provisions | 2,606 | 4,392 | 4,256 | | Total Liabilities/Assets | 4,892 | 7,172 | 8,425 | | 1. Cash and Balances with RBI | 358 | 712 | 785 | | 2. Balances with Banks and Money Market | 1,243 | 1,375 | 2,101 | | 3. Investments | 2,449 | 3,136 | 4,077 | | 4. Fixed Assets | 236 | 638 | 353 | | 5. Other Assets | 606 | 1,311 | 1,108 | Note: Data for end-March 2018, end-March 2019 and end-March 2020 pertain to five, seven and six PBs, respectively. Hence, the data are not comparable across years.
Source: Off-site returns (domestic operations), RBI. | 15.2 Financial Performance IV.92 Notwithstanding improvement in both interest income and non-interest income, the consolidated balance sheet of PBs ended the financial year 2019-20 with losses due to high operating expenses. The limited operational space of these banks, coupled with high initial costs in setting up of the infrastructure, implied that the initial years would be invested in expanding their customer base and they will take time to break even (Table IV.40). | Table IV.40: Financial Performance of Payments Banks | | (Amount in ₹ crore) | | | March-18 | March-19 | March-20 | | A Income (i + ii) | | | | | i. Interest Income | 175.6 | 290.8 | 349.3 | | ii. Non-Interest Income | 1,003.6 | 2,099.1 | 3,115.0 | | B Expenditure | | | | | i. Interest Expenses | 24.5 | 35.4 | 62.3 | | ii. Operating Expenses | 1,676.8 | 3,265.3 | 4,337.4 | | Provisions and Contingencies | | | | | of which, | | | | | Risk Provisions | -6.6 | 2.3 | 2.7 | | Tax Provisions | 1.0 | 16.1 | -107.1 | | C Net Interest Income | 151.2 | 255.4 | 287.0 | | D Profit | | | | | i. Operating Profit (EBPT) | -522.0 | -910.8 | -935.3 | | ii. Net Profit | -517.2 | -937.1 | -833.0 | Note: Data for end-March 2018, end-March 2019 and end-March 2020 pertain to five, seven and six PBs, respectively. Hence, the data are not comparable across years.
Source: Off-site returns (domestic operations), RBI. | IV.93 Efficiency, measured in terms of cost-to-income ratio, improved while the net interest margin (NIM) declined during the year (Table IV.41). | Table IV.41: Select Financial Ratios of Payments Banks | | Item | March-18 | March-19 | March-20 | | 1. Return on Assets | -10.6 | -13.1 | -9.9 | | 2. Return on Equity | -28.0 | -49.4 | -44.7 | | 3. Investments to Total Assets | 50.1 | 43.7 | 48.4 | | 4. Net Interest Margin | 4.5 | 6.1 | 4.8 | | 5. Efficiency (Cost-Income Ratio) | 142.2 | 136.6 | 125.2 | | 6. Operating profit to working funds | -10.7 | -12.7 | -11.1 | | 7. Profit Margin | -43.9 | -39.2 | -24.0 | Note: Data for end-March 2018, end-March 2019 and end-March 2020 pertain to five, seven and six PBs, respectively. Hence, the data are not comparable across years.
Source: Off-site returns (domestic operations), RBI. | 15.3 Inward and Outward Remittances IV.94 In 2019-20, inward and outward remittances through the UPI occupied the largest share in the total remittance business of payments banks in terms of both value and volume. In fact, more than 46 per cent of inward and 37 per cent of outward remittances in terms of value were made through the UPI channel. The second place was occupied by the IMPS channel, with 9.3 per cent of inward and 24.5 per cent of outward remittances flowing through this channel. The RTGS channel recorded strong growth with its share increasing to 13.2 per cent of outward flow and 22.2 per cent of inflow coming through it (Table IV.42). | Table IV.42: Remittances through Payments Banks | | (Number in thousand, amount in ₹ crore) | | Channel | 2018-19 | 2019-20 | | Inward Remittances | Outward Remittances | Inward Remittances | Outward Remittances | | Number | Amount | Number | Amount | Number | Amount | Number | Amount | | 1. NEFT | 4,763 | 67,035 | 6,819 | 13,16,665 | 8,980 | 19,398 | 14,084 | 43,593 | | | (0.3) | (0.4) | (0.3) | (3.5) | (0.4) | (5.3) | (0.6) | (10.1) | | i) Bill Payments | 182 | 2,956 | 1,367 | 11,29,717 | 633 | 6,103 | 4,214 | 8,151 | | | (0.0) | (0.0) | (0.1) | (3.0) | (0.0) | (1.7) | (0.2) | (1.9) | | ii) Other than Bill Payments | 4,581 | 64,079 | 5,452 | 1,86,949 | 8,348 | 13,296 | 9,870 | 35,442 | | | (0.2) | (0.4) | (0.3) | (0.5) | (0.4) | (3.6) | (0.4) | (8.2) | | 2. RTGS | 34 | 33,204 | 7 | 17,629 | 198 | 81,411 | 73 | 56,794 | | | (0.0) | (0.2) | (0.0) | (0.0) | (0.0) | (22.2) | (0.0) | (13.2) | | 3. IMPS | 1,04,045 | 11,69,970 | 1,84,482 | 1,55,55,000 | 1,40,688 | 34,309 | 3,45,218 | 1,05,366 | | | (5.6) | (6.7) | (8.9) | (41.8) | (6.8) | (9.3) | (15.0) | (24.5) | | 4. UPI | 13,02,082 | 1,60,94,995 | 13,17,627 | 2,02,64,339 | 14,42,274 | 1,70,998 | 14,53,701 | 1,60,976 | | | (69.8) | (92.5) | (63.6) | (54.4) | (69.4) | (46.6) | (63.2) | (37.4) | | 5. E - Wallets | 3,98,339 | 24,186 | 5,04,639 | 52,249 | 3,39,601 | 23,427 | 4,03,157 | 41,274 | | | (21.4) | (0.1) | (24.4) | (0.1) | (16.3) | (6.4) | (17.5) | (9.6) | | 6. Micro ATM (POS) | 8,905 | 3,576 | 165 | 57 | 47,362 | 16,746 | 694 | 229 | | | (0.5) | (0.0) | (0.0) | (0.0) | (2.3) | (4.6) | (0.0) | (0.1) | | 7. ATM | _ | _ | 1,772 | 505 | _ | _ | 3,749 | 1,169 | | | _ | _ | (0.1) | (0.0) | _ | _ | (0.2) | (0.3) | | 8. Others | 45,979 | 12,657 | 56,530 | 16,931 | 1,00,450 | 20,740 | 78,402 | 21,515 | | | (2.5) | (0.1) | (2.7) | (0.0) | (4.8) | (5.7) | (3.4) | (5.0) | | Total | 18,64,148 | 1,74,05,623 | 20,72,041 | 3,72,23,375 | 20,79,551 | 3,67,030 | 22,99,078 | 4,30,916 | Note: 1. Figures in the parentheses are percentage to total; -: Nil/Negligible.
2. Data for 2018-19 and 2019-20 are not comparable as there were seven and six PBs, respectively.
Source: Off-site returns (domestic operations), RBI. | 16. Overall Assessment IV.95 The macroeconomic and financial environment, as it were characterised by a sharp deceleration in economic activity and weakening investment demand was suddenly exacerbated by COVID-19. Although, banks’ financial conditions improved on lower slippages and higher capital buffers and provisions, subdued economic conditions amplified risk aversion and dragged down credit off-take. During 2020-21 so far, the safe haven appeal of banks led to a sharp accretion to deposits. With credit demand remaining anaemic, as the deleterious effects of COVID-19 played out on the economy, banks preferred to park funds in safer G-Secs to partially offset the impact of low lending. In anticipation of higher loan delinquencies, banks have announced ambitious plans to shore up their capital bases to adhere to regulatory requirements and to be lending-ready as and when credit demand bounces back. IV.96 The Reserve Bank initiated timely measures to relieve stress on bank balance sheets, corporates and households in the wake of the pandemic. With the moratorium coming to an end, the deadline for restructuring proposals is fast approaching and with the possible lifting of the asset quality standstill, banks’ financials are likely to be impacted in terms of asset quality and future income. Going forward, banks will have to adapt and adjust to the rapidly evolving economic landscape due to these challenges and also the entry of niche players and emerging financial technologies.
|