The perturbations from repeated waves of the COVID-19 pandemic have come in the way of sustained growth recovery in India. The supply constraints pushed up shipping costs and commodity prices, thereby intensifying inflationary pressures and threatening the nascent economic recovery across the world. In India, the private corporate sector showed resilience as firms adopted new modes of operations and aligned their business strategies to the new environment. The capital expenditure push in the Union Budget for 2022-23 can provide the much needed support to achieve sustained high growth by enhancing productive capacity, crowding in private investment and strengthening aggregate demand. Though both private consumption expenditure and investment marginally surpassed their respective pre-pandemic levels in 2021-22, there is a need to strengthen the growth momentum to compensate for the lost output. 1. INTRODUCTION I.1 The ongoing COVID-19 pandemic has been the first of its kind the world has witnessed in the 21st century. The cyclical slowdown that set in the Indian economy before the outbreak of the pandemic, got exacerbated on the back of cliff effects and scarring generated by the pandemic. Despite having witnessed one of the steepest contractions in gross domestic product (GDP) in Q1:2020-21 and being hit by three successive waves, the Second Advance Estimates of National Income released on February 28, 2022 indicate that the economy has surpassed its pre-COVID level in 2021-22, on the back of unprecedented policy support from monetary and fiscal authorities. Nonetheless, India’s recovery from the pandemic, despite its innate strength of macroeconomic fundamentals, remains fragile and is yet to become broad-based. I.2 Supply disruptions, restrained workforce participation, risks from new variants of the virus and the Russia-Ukraine war have emerged as the dampeners to global growth outlook. Fresh sanctions on Russia pose new risks accentuating supply disruptions in global value chains, and commodity price spirals hitting glass ceilings. As price pressures become more generalised globally, risk to growth might aggravate. Looking ahead, even as the growth outlook hinges on global headwinds from the Ukraine war and new variants of COVID, the shape of the recovery post-pandemic would be guided by realisation of reform dividend as also the contributions from new emerging areas such as healthcare, Information Technology Enabled Services (ITeS), and e-commerce, which could drive the future growth with adaptations to the pandemic that may become endemic. I.3 The pandemic has caused a deep dent on livelihoods and has scarred minds, production capacities and confidence with far-reaching economic and social costs, and the post-pandemic new normal may be very different from the pre-pandemic situation. On the backdrop of the pre-existing conditions ahead of the pandemic, this chapter focuses on a macro-assessment of the economic impact of the successive waves of the COVID-19 pandemic on the Indian economy. In section 2, the pre-COVID slowdown is described with a view to providing a backdrop. This is followed by an impact analysis of the pandemic in section 3. Section 4 concludes the chapter with an assessment of the risks to recovery. 2. PRE-COVID SLOWDOWN I.4 Ahead of the COVID-19 pandemic, a cyclical downturn had set in the Indian economy from 2017-18, culminating in the lowest growth of 3.7 per cent in 2019-20 since the global financial crisis (GFC). Episodes of boom and bust over the past two decades portray 2003-08 as the sharpest and longest expansionary phase when the economy expanded at an average of 7.9 per cent – unprecedented in its recorded history (Table I.1). With the onset of GFC, GDP growth had plummeted to 3.1 per cent in 2008-09, followed by a sharp but short revival during 2009-11 on the wings of coordinated fiscal and monetary policy actions which could not be sustained, giving way to another phase of slowdown between 2011-14. Following a consumption-led brief boom during 2014-17, the economy eventually entered a phase of slowdown from 2017-18 onwards, with the GDP growth moderating for eight successive quarters before the onset of the COVID-19 pandemic. I.5 The pre-pandemic GDP growth has mainly been consumption-led. However, over the years, the share of consumption, the backbone of India’s economic growth has been declining, with gross fixed capital formation (GFCF) compensating for the decline (Chart I.1). The ratio of gross capital formation (GCF) to GDP at current prices or the investment rate, however, decreased to 30.7 per cent in 2019-20 from 32.1 per cent during 2015-16. Government expenditure provided an upward thrust to aggregate demand, excluding which the slowdown would have been deeper.
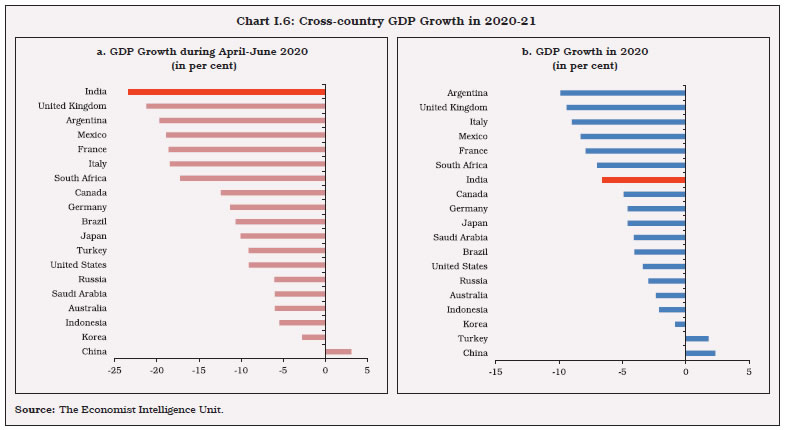
I.6 The GDP slowdown coincided with sluggishness in the labour market. The decline in employment in general, and the depressed employment in the construction sector resulted in low rural wages (Charts I.2a and I.2b). This along with high household leverage in 2017-18 and 2018-19 and domestic shocks pulled down consumption demand. I.7 The moderation in capital formation emanated from both private corporate and household sector investments (Chart I.3). The slowdown in fixed investment by the household sector was more pronounced in ‘dwellings, other buildings, and structures’ which on an average had a share of 53.1 per cent in GFCF during 2011-12 to 2019-20. I.8 Liquidity and solvency problems faced by some major non-banking financial companies (NBFCs)1 and deterioration in asset quality of the banking sector accentuated the slowdown in private sector investment. The twin balance sheet crisis – banks and corporates – reinforced each other to contribute to a slowdown in the credit offtake. Loss of business and consumer confidence caused both consumption and investment to tumble. The corporate sector preferred to continue deleveraging in this environment, thus exacerbating the slowdown. I.9 Due to growing integration with the global economy, the domestic slowdown was accentuated by the subdued global growth attributed to rising trade barriers; elevated uncertainty surrounding trade and geopolitics; idiosyncratic factors causing macroeconomic strain in several emerging market economies; and structural factors, such as low productivity growth and aging demographics in advanced economies (IMF, 2019). I.10 Path-breaking structural reforms like the implementation of the goods and services tax (GST), enactment of the Insolvency and Bankruptcy Code (IBC), corporate tax cut, and regulatory measures to streamline the real estate sector were expected to provide renewed thrust to growth momentum when the pandemic struck. 3. POST-COVID ECONOMIC SCENARIO I.11 After being first reported officially in Wuhan city of China at end-December 2019, COVID-19 was declared a pandemic by the World Health Organization (WHO) on March 11, 2020. Dispersed across successive waves and characterised by differentiated intensity of infections and mortality, the COVID-19 pandemic has been expansive in terms of geographical spread — touching even the remotest parts of the world. Ever since the first case of COVID-19 was reported in Kerala on January 30, 2020, India has experienced three waves of infections so far, taking its total caseload to the second highest in the world (Chart I.4). 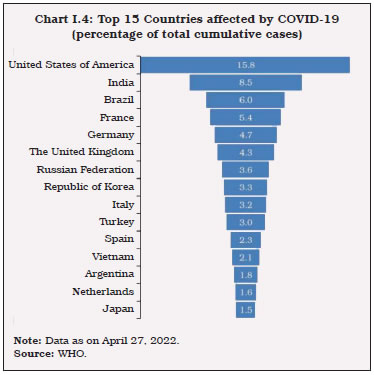 I.12 Given the suddenness of the COVID-19 shock, the Government of India imposed a strict lockdown during the first wave delaying its peak to September 16, 2020 when 0.97 lakh new cases were reported. The peaks for the second and the third waves were attained faster on May 6, 2021 with 4.14 lakh new cases, and on January 20, 2022 with 3.47 lakh new cases, respectively. The first wave, dominated by the alpha variant, was less infectious and virulent compared with the delta variant which dominated the second wave. The caseload was far higher in majority of the states during the second wave compared to the first wave. The recovery rate steadily improved to 97.3 per cent by mid-July 2021 after having declined to 81.8 per cent at the end of April 2021. The third wave, which started in the last week of December 2021 and began to subside after January 20, 2022, was dominated by the Omicron variant which was highly infectious, though less deadly, raising the hope that the pandemic might soon become endemic. Apart from deft administrative management based on testing and isolation in micro containment zones, the success of India’s vaccination programme helped in effective containment of the highly infectious Omicron variant during the third wave. I.13 India started vaccination programme from January 16, 2021. The progress of India’s vaccination programme is reflected in the percentage of total population administered with one dose at 73.1 per cent and fully inoculated population at 62.2 per cent as on April 27, 2022 (Chart I.5). India has intensified its vaccination drive by initiating precaution doses and vaccination for 12-14 old age group, in the wake of the recent surge in new variants-led cases globally. I.14 At the height of the first wave of infections, India registered one of the deepest recessions in the world, with GDP declining by as much as 23.8 per cent in the first quarter of 2020-21 (Chart I.6a). A gradual recovery took hold during the second half of the year, as a result of which the contraction for the full financial year turned out to be far less severe at 6.6 per cent – which also placed India at a relatively better position among the G-20 countries in terms of annual GDP growth for 2020 (Chart I.6b). 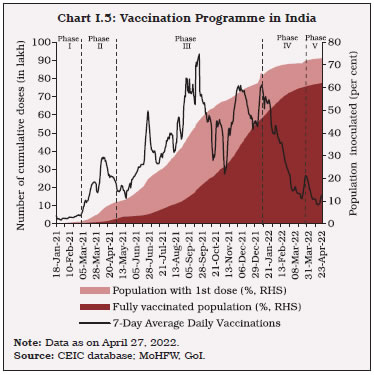
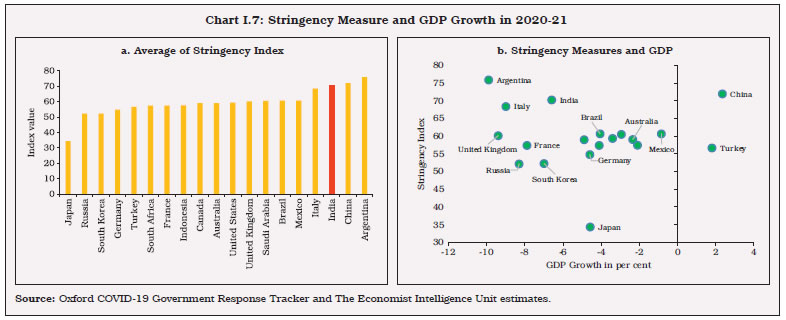 I.15 A number of factors worked in conjunction to culminate into the most severe economic impact for India, with the stringency of the lockdown as the most cited reason. India imposed one of the most stringent lockdowns in the world in 2020 to curb the spread of the virus (Chart I.7a). Countries ranked higher in terms of stringency Index – India, Argentina, Italy and the United Kingdom – faced deeper contraction in GDP (Chart I.7b). There were, however, noteworthy outliers like China and Turkey which, despite stringent measures, were able to expand their GDP in 2020. I.16 Apart from the direct restrictive measures, the preponderance of contact-intensive services sector in the existing structure of the domestic economy, exacerbated the economic consequences of the large pandemic shock (Chart I.8a). In case of India, as elsewhere, the services sector which includes majority of the contact-intensive and non-essential activities bore the maximum brunt of the pandemic. Second, self-employment is the pre-dominant nature of employment in India occupying the highest share in overall employment among the G-20 economies (Chart I.8b). The majority of the self-employed workers is engaged in the informal sector with little job protection and weak social security support, accentuating the adverse economic impact of the pandemic. Third, countries could adopt alternative business continuity plans swiftly due to better access to internet. India, however, with 43 per cent of the population having access to internet in 2020, ranked low globally (World Economic Forum, 2020) [Chart I.8c]. This had hindered India’s ability to shield businesses and jobs, which in turn contributed to the deeper contraction in activity. India used unprecedented fiscal support measures to safeguard livelihood and businesses and reinvigorate the economy. I.17 The brunt of the second wave was felt in the first quarter of 2021-22. Camouflaged by statistical base effects, the level of GDP fell 8.3 per cent below the pre-pandemic (or corresponding 2019-20) level. Restricted lockdowns and a growing resilience of both firms and individuals in dealing with the infections reduced the severity of the economic impact — the economic impact of the second wave is estimated to be about one-third of the first wave. The third wave impact is likely to be still smaller as evident from the momentum in high frequency indicators. 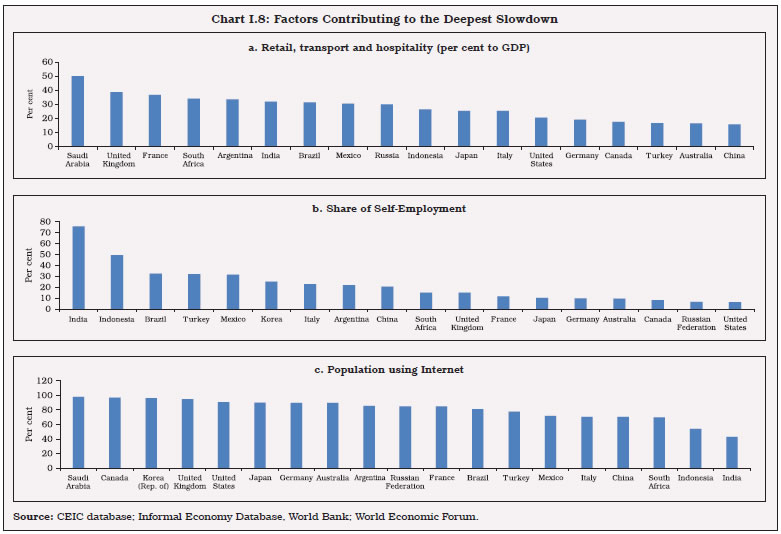 I.18 An overall monthly composite index of high frequency indicators shows that economic activity rebounded sharply in June 2021 with the ebbing of the second wave, and remained resilient pointing towards steady recovery till October 2021. November 2021 onwards, coal and semi-conductor chip shortages, followed by the third wave in January 2022 led to some weakening in the momentum as the index took a downturn in January and February (Chart I.9). Rural demand, in particular, lost steam after the second wave while urban demand recovered. Contagion from the Russia-Ukraine conflict dampened activity beginning March, thereby disrupting and delaying the recovery.
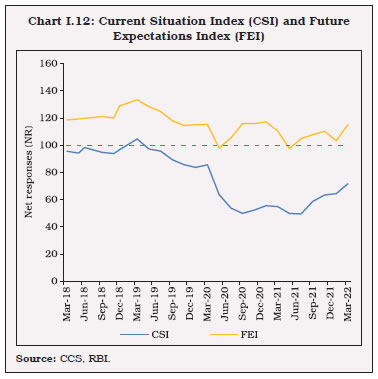
I.19 Despite the second wave, the turnaround in the economy in 2021-22 has been remarkable with all the components of aggregate demand surpassing the pre-pandemic levels in H2:2021-22 (Chart I.10a). GDP in 2021-22, however, is estimated to be only 1.8 per cent above pre-pandemic level suggesting lost growth over two years. I.20 With discretionary consumption spending still lacking traction, private consumption is just a shade above its pre-pandemic level. On account of the massive hit taken by the contact-intensive activities, consumption of services contracted sharply. Consumption of durable goods – the erstwhile high growing component of total consumption, also suffered a sharp decline, while consumption of non-durable goods which include food items and other essentials held up (Chart I.11). I.21 The current situation index (CSI) from the consumer confidence survey of the Reserve Bank indicates a sharp fall from 85.6 in March 2020 to 63.7 in May 2020, dropping further to an all-time low of 48.5 in May 2021 with the onset of the second wave (Chart I.12). However, with the gradual abatement of the second wave, sentiments improved, though the index value remained below 100, indicating pessimism about the current economic situation. The future expectations index (FEI) remained above 100 indicating expectations of future recovery during most part of 2020-21 and 2021-22, except May 2020 and May 2021, when the intensity of restrictions during the respective waves of the pandemic was at a high level. 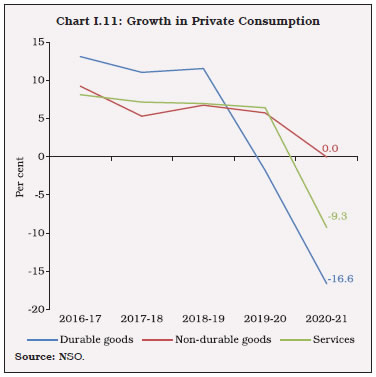
 I.22 The Indian labour market witnessed a sharp deterioration during the first wave of the pandemic with unemployment rate touching a record high and the labour force participation rate plummeting (Chart I.13.a). Reverse migration from urban to rural areas during the first wave period also resulted in a sharp increase in demand for Mahatma Gandhi National Rural Employment Guarantee Scheme (MGNREGS) works in rural areas. The impact of the second wave and third wave was relatively muted and employment conditions have improved (Chart I.13.b). I.23 As per the Periodic Labour Force Survey (PLFS) quarterly reports for the urban areas, casual labourers were the worst affected during the first and second waves of the pandemic, though the extent of the impact was lower during the second wave. Out of the total casual labourers working during January-March 2020, only 35.3 per cent remained in the same category during the first lockdown period of April-June 2020; nearly 50 per cent were pushed to unemployment and about 10 per cent moved out of the labour force during this period (Charts I.14a and I.14b). I.24 Investment demand came to a standstill amid lockdown and suffered the deepest contraction during Q1:2020-21. The recovery has been faster in GFCF primarily aided by a surge in government investment – the only sector that contributed positively to investment demand in 2020-21. Consequently, the share of government investment increased by 4.0 percentage points in 2020-21 (Chart I.15.a). On the other hand, subdued demand, inventory overhang and excess capacity held back private investment as reflected in reduced share of both corporate and household sector in total investment in 2020-21. Buoyed by the digitalisation drive and demand for IT and ITeS, investment in intellectual property products displayed an uptick while investment in other dwellings, buildings and structure and machinery and equipment declined sharply reflecting a drag in construction and manufacturing activities in 2020-21 (Chart I.15.b). 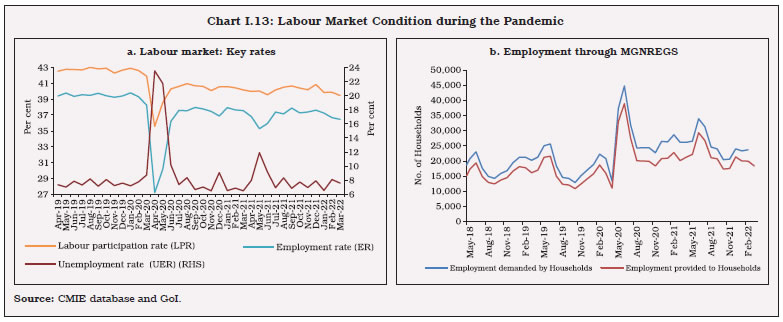
 I.25 Although overall fixed investment turned around to rise above the pre-pandemic level in 2021-22, the high frequency indicators of investment indicate a government capex-led recovery with private investment remaining subdued. I.26 Recent estimates from the Order Books, Inventories and Capacity Utilisation Survey (OBICUS) show that capacity utilisation has recovered to 72.4 per cent in Q3:2021-22 from 60.0 per cent in Q1:2021-22 (Chart I.16). Similar trend is reflected in net response of assessment on capacity utilisation (NRA_CU) and net response of expectation on capacity utilisation (NRE_CU) in the Industrial Outlook Survey (IOS), with a positive forward outlook as reflected in the NRE for Q1:2022-23. I.27 The overall business assessment and expectation compiled from the survey responses of the quarterly IOS touched its historical low values in Q1:2020-21. A V-shaped recovery is observed in subsequent three quarters before it plummeted again sharply as the second wave hit the economy. The assessment turned optimistic immediately after the first and the second waves and the business expectations index (BEI) remained above 100 since March 2020, indicating the positive outlook of the industry despite COVID induced disruptions (Chart I.17).
I.28 Another silver lining is the strong export performance that far-surpassed its pre-pandemic level (detailed in Chapter IV). A strong export performance, if sustained, could lead to additional capacity utilisation and generation and, thereby, lead to an upturn in domestic private investment cycle. I.29 From the supply side, agriculture remained resilient throughout the pandemic period. Agriculture and allied activities were exempted from the lockdown measures and resilience also stemmed from a confluence of factors working in conjunction, viz., a bountiful monsoon; adequate soil moisture; replenished reservoir levels; improved labour availability during the pandemic and favourable terms of trade for agricultural products (RBI, 2021). The industrial sector comprising manufacturing, mining and quarrying, and electricity, gas and water supply witnessed a sharp decline in Q1:2020-21 with manufacturing nosediving to a record low (Chart I.10.b). Mining and quarrying, on the other hand, was lagging for some time and was in contraction even before COVID. Manufacturing which spearheaded the post first wave recovery remained resilient during the second wave. I.30 Within services, the recovery has been heterogenous with financial, real estate and professional services and public administration, defence and other services gaining traction to surpass their respective pre-pandemic levels by 6.6 per cent and 6.4 per cent. On the other hand, recovery in trade, hotels, transport, communication and services related to broadcasting remained sluggish. I.31 Presently, various sectors of the economy are at different stages of recovery (Table I.2). While agriculture remained resilient all through different waves of the pandemic, manufacturing and construction are on the path to recovery. After ebbing of the Omicron wave, green shoots of revival are visible even in contact-intensive services sectors. I.32 Against the backdrop of COVID-19 induced business disruptions, the private corporate sector has shown robust resilience as firms adopted new modes of operations and aligned their business strategies to the new environment for doing business. A disaggregated firm level analysis, however, reveals uneven recovery across the weak and strong firms (Box I.1). While steady improvement was observed for the strong firms, weak firms remained vulnerable with negative profitability, indicating a divergent recovery within the organised corporate sector (Charts I.18a and I.18b). 
Box I.1
Did COVID-19 Expose Pre-existing Weakness in Corporate Balance Sheet? The private corporate sector has shown resilience through the pandemic. An econometric model using listed firms’ quarterly balance sheet data examines the sensitivity of the firms to the pandemic, captured by the absolute change in y-o-y profitability ratio, with specific control variables, viz., age, size, industry as well as debt to assets ratio (DA), debt-service coverage ratio (DSCR) and interest coverage ratio (ICR). In an alternate model (Table 1; column 3), the impact of the pandemic on weak and strong firms has been estimated by using the difference-in-difference (DID) method that compares the effect of an event (pandemic in this case) on the treatment group (group affected by the event) with the control group (group unaffected by the event)2. Following Kulkarni (2020), weak or zombie firms are defined as firms with ICR<1 and DSCR<1 in a cross-sectional model using quarterly balance sheet data of firms for the time-period March 2019-March 2021.  1E=1 is the time indicator variable which takes value 1 if the observation falls in the post-pandemic period (end-March 2020 onwards) and 1i=T is the indicator variable for treatment group (weak or zombie firms in this case). The estimated coefficient τ captures the differential impact of the event on the treatment group (in this case weaker firms) as compared with the control group. To understand the impact of the pandemic on smaller firms, the DID regression is also estimated separately on a smaller sample of firms which consists of the bottom 25 per cent of the initial sample set in terms of asset size (Column 4). | Table 1: Empirical Results | | Dependent Variable | ΔΠ | ΔΠ | Π | Π | | | (1) | (2) | (3) | (4) | | DSCR | | -0.0070263** | | | | | | (0.0017011) | | | | ICR | -0.0034336** | | | | | | (0.0010129) | | | | | DL | 0.27542 | 0.2814185 | | | | | (0.3828997) | (0.381821) | | | | Size | -0.000148** | -0.000147** | | | | | (0.0000496) | (0.0000496) | | | | Age | 0.0130868 | 0.0093762 | | | | | (0.0428435) | (0.0427686) | | | | π Q42020 | -0.000013** | -0.000013** | -0.000012** | -0.0000118 | | | (0.00) | (0.00) | (0.000) | (0.00) | | Time(δ) | | | -4.595627** | -2.466289 | | | | | (0.6594099) | (1.748093) | | DID interaction (τ) | | | 2.765929 | 0.6538439 | | | | | (1.792182) | (2.675901) | | Treatment (θ) | | | -23.46111*** | -16.23408*** | | | | | (1.213463) | (1.846779) | | Industry dummy | Yes | Yes | Yes | Yes | | No of observations | 1143 | 1143 | 12,447 | 5455 | | R2 | 0.1357 | 0.1355 | 0.0918 | 0.0483 | | F | 360.51 | 343.39 | 22.13 | 21.19 | | Prob>F | 0.000 | 0.000 | 0.000 | 0.000 | | Note: Standard errors in parentheses. ***: Significant at 1 per cent. **: Significant at 5 per cent. | The results suggest that companies with relatively sound financials indicated by higher DSCR and ICR had lower sensitivity to the pandemic. Further, larger companies and companies with higher profit in Q4:2019-20 too had lower sensitivity to the pandemic-induced disruptions. Weaker firms and weaker small sized firms suffered lower profitability even in the pre-pandemic era. Weak firms’ financials deteriorated further during the pandemic. References Vig, V. (2013). Access to collateral and corporate debt structure: Evidence from a natural experiment. The Journal of Finance, 68(3), 881-928. Kulkarni, N. (2020). Resolving Zombie Lending with Collateral Reform. Working Paper. Centre for Advanced Financial Research and Learning (CAFRAL). https://www.cafral.org.in/sfControl/content/Speech/327202152843PMMisallocation_Creditor_Rights_II.pdf | I.33 It is found that real estate and automobiles which were badly hit by the pandemic, the slowdown started even before the pandemic. Retail trading, hotel and restaurants, air transport services, transport logistics services, and education are some of the contact-intensive sectors in which profitability was dented by the pandemic. The spurt in profitability in consumer electronics, storage and distribution appliances was primarily due to the increased demand during lockdown, while online marketplaces, ITES, computer software, communication equipment, drugs and pharmaceuticals, health services and business services and consultancy are some of the sectors which remained relatively unscathed from the effect of the pandemic (Chart I.19). Impact on the Unorganised Sector I.34 Household sector’s share in gross value added (GVA) which represents the unorganised sector activity fell to its lowest since 2011-12, confirming the view that the pandemic took a larger toll on the informal economy. In the manufacturing sector, corporate sector GVA and household sector GVA which had broadly moved together in the pre-pandemic period, moved in opposite directions in 2020-21. While corporate sector GVA registered growth, the household sector GVA registered heavy contraction (Chart I.20).
I.35 Within services sector GVA, unorganised segment, which has a higher share registered a sharp drop in 2020-21 compared with the organised sector (comprising private corporates, general government and public sector), indicating larger losses incurred in the unorganised sector (Chart I.21). Potential Output and Scarring Caused by the Pandemic I.36 COVID-19 has brought in steep challenges in conceptualising and estimating potential output. Using the standard statistical filtering methods such as Hodrick-Prescott (HP), Baxter-King (BK) and Christiano-Fitzgerald (CF) filters, output gap is seen as closing early in 2022-23. However, the scarring of potential output may be getting overestimated in these methods and the output gap accordingly is likely to close later than is indicated by filter-based techniques. The multivariate Kalman filter estimates of potential output indicate that during the pandemic period, a negative output gap of about 4-6 per cent per quarter during Q2:2020-21 through Q1:2021-22 opened up (Patra et al., 2021). As per an alternative methodology proposed by Rangarajan-Srivastava (2017)3, potential growth for 2020-21 is estimated to have declined to 5.4 per cent from 7.8 per cent in 2017-18. 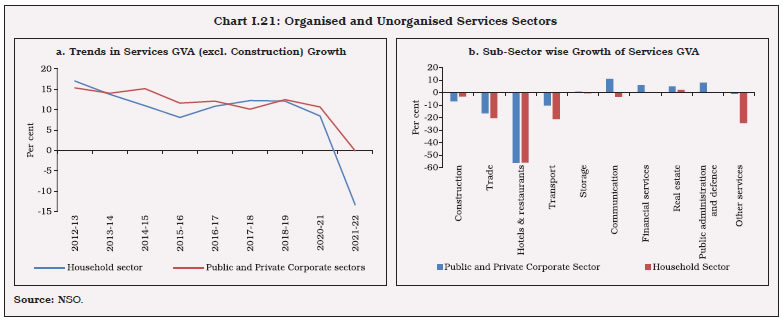 I.37 During the COVID period, multiple waves and restrictive measures disrupted the supply chains and interrupted productive activity. However, demand conditions were impacted far more than the supply situation (Box I.2) as both consumer and business confidence fell and remained subpar. I.38 In last four decades, India has faced three major shocks – the 1991 balance of payments (BoP) crisis which was followed by a major liberalisation drive that raised India’s trend growth; the global financial crisis of 2008; and the COVID-19 pandemic which hit India during early 2020 and still unfolding, and the impact of which on trend growth remains uncertain. Apart from the immediate moderation in growth caused by these shocks, they structurally altered the dynamics of growth, as observed statistically from the structural breaks in GDP growth. The Bai and Perron structural break test (Bai and Perron, 1998) identifies three break points in the post-independence period — 1979-80, 2002-03 and 2011-12 (after the GFC) (Chart I.22).4 Risks to post-COVID trend growth can be mitigated through targeted structural reforms and policy changes as discussed in detail in the subsequent chapters. Box I.2
COVID-19 Shock - Relative Impact on Demand and Supply Against the backdrop of the pandemic, using the Taylor Rule framework, a consensus trend is extracted in the form of a dynamic factor from two series — differences in output gap and differences in inflation gap — which has been used in the identification of demand pressure (Taylor, 1993; Blanchard and Quah, 1989). Phases in the business cycle that are devoid of demand-side disturbances qualify as supply-side disturbances measured as residual effects. Further, a demand-side disturbance can be disentangled into positive and negative demand pressure (+) / (-). Positive demand side pressure is identified when the difference in output gap and the difference in inflation gap are both positive. Similarly, negative demand pressure is recognised whenever the differences in output gap and inflation gap turn negative. The consensus trend from the differences in output gap and inflation gap is extracted by using a Two-Step (TS) estimation procedure in a dynamic factor model (Doz, Giannone, and Reichlin 2011)5. The pre-COVID growth between the latter half of 2017 and the first half of 2019 was demand-led, which eventually collapsed during the first wave of the pandemic. Despite the presence of supply-side bottlenecks, it is observed that the economic contraction during the first wave of COVID-19 was dominated by demand-side factors (Chart 1). The steady decline in the consensus trend (TS core) in recent months implies the presence of supply-side bottlenecks. References: Blanchard, O.J., Quah, D., 1989. The dynamic effects of aggregate demand and supply disturbances. American Economic Review 79, 655–673. Doz, C., D. Giannone and L. Reichlin (2011) ‘A two-step estimator for large approximate dynamic factor models based on Kalman filtering’, Journal of Econometrics, 164(1): 188–205. Taylor, John B (1993), “Discretion versus Policy Rules in Practice,” Carnegie-Rochester Conference Series on Public Policy, 39, pp.195-214. | I.39 The pandemic is a watershed moment and the ongoing structural changes catalysed by the pandemic can potentially alter the growth trajectory in the medium-term. Sustained thrust on capital expenditure by the government, push to digitalisation and growing opportunities for new investment in areas like e-commerce, start-ups, renewables and supply chain logistics could in turn, contribute to step up the trend growth while closing the formal-informal gap in the economy. I.40 The pre-COVID trend growth rate works out to 6.6 per cent (CAGR for 2012-13 to 2019-20) and excluding the slowdown years it works out to 7.1 per cent (CAGR for 2012-13 to 2016-17). Taking the actual growth rate of (-) 6.6 per cent for 2020-21, 8.9 per cent for 2021-22 and assuming growth rate of 7.2 per cent for 2022-23, and 7.5 per cent beyond that, India is expected to overcome COVID-19 losses in 2034-35 (Chart I.23). The output losses for individual years have been worked out to ₹19.1 lakh crore, ₹17.1 lakh crore and ₹16.4 lakh crore for 2020-21, 2021-22 and 2022-23, respectively. 4. Risks to Recovery I.41 The perturbations from repeated waves of COVID-19 pandemic have come in the way of sustained recovery and the quarterly trends in GDP essentially followed the ebbs and flows of the pandemic. Following a very sharp contraction in Q1:2020-21, the economic momentum progressively picked up till it was hit by the second wave in Q1:2021-22. Similarly, the impact of the third wave, concentrated in the month of January 2022 dented partially the recovery process. “We are living in a world of Knightian uncertainty (Das 2022)”, suggesting the lack of any quantifiable knowledge about some possible occurrence as opposed to quantifiable risks. I.42 The pandemic is not yet over. A fresh wave of COVID has hit China, South Korea and several parts of Europe. However, various economies are reacting divergently ranging from a no-COVID policy in some jurisdictions (e.g., China, Hong Kong and Bhutan) on the one hand to those with relatively open borders and removal of internal restrictions (e.g., Denmark and the UK). In India, the restriction levels are being dynamically calibrated at local levels in response to the evolving situation. 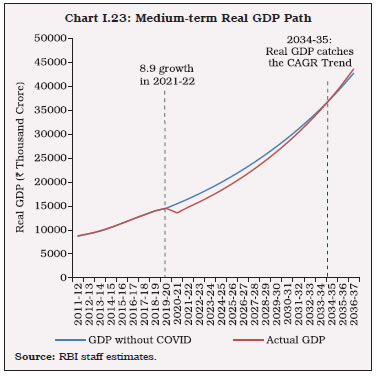 I.43 With the ongoing Russia-Ukraine conflict, the downward risks to global and domestic growth are getting accentuated through surge in commodity prices and global supply chain disruptions. The supply constraints and longer delivery times pushed up shipping costs, commodity prices, thereby intensifying inflationary pressures and threatening the nascent economic recovery across the world. India too felt the pressure from the global supply chain disruptions with the supplier’s delivery time6 falling to its lowest point of 29.5 in April 2020. While the delivery time improved thereafter, it remained below 50 all through 2020-21 and 2021-22. The increased delivery times and higher raw material prices squeezed profits of Indian firms from Q3:2020-21 onwards. The Indian automobile sector which benefitted from consumers’ preference for personal vehicles received a jolt from the global semiconductor shortages making them incapacitated to benefit from increased demand as there was a surge in waiting periods for customers. Growth risk from geopolitics-induced supply shocks looks more acute for oil importers like India who are already facing a tight fiscal position due to the pandemic related relief packages by the Government. I.44 The capital expenditure push in the Union Budget for 2022-23 can provide the much needed support critical to achieve sustained high growth by enhancing productive capacity, crowding in private investment and strengthening aggregate demand. India must focus on building world class infrastructure apropos the needs of a modern economy. I.45 With unlocking and learnings from the pandemic that are increasingly getting internalised, the time is ripe to start reconstruction. A push toward universal vaccination and booster doses in India, combined with adoption of work-from-home mode in workplaces augurs well for the future of the economy. The future work processes are changing with the help of digitalisation and India has particularly adapted well to it. In a sequel to the pandemic, India is set to unleash impulses of animal spirits and poised to move to a higher growth trajectory with digital start-ups and ventures, biomedical, pharmaceuticals and healthcare sectors emerging as new winners. I.46 The dividends of reforms initiated to counter the pre-COVID slowdown along with additional measures and initiatives during the pandemic will help launch the economy on a sustainable high growth path. The behavioural and technological changes brought about by the pandemic may usher in a new normal which would not necessarily ape the pre-pandemic trends but would be built on a more efficient, equitable, clean and green foundations. References: Bai, Jushan and Perron, Pierre (1998), ‘‘Estimating and Testing Linear Models with Multiple Structural Changes’’, Econometrica, The Econometric Society, Vol. 66, No. 1, pp. 47-78. Bank of England, (2021), Monetary Policy Report, May. Bhandari, Pranjul, (2019), “Lighten India’s Debt Burden to Give Growth a Chance,” Livemint, November 13. Bhoi, Binod K, Behera, Harendra (2017), ‘‘India’s Potential Output Revisited’’. Journal of Quantitative Economics, Springer; The Indian Econometric Society (TIES), Vol. 15(1), pages 101-120. Blinder, Alan (2006): “Offshoring: The Next Industrial Revolution?”, Foreign Affairs, March/April. Bodnár, Katalin Le Roux, Julien, Lopez-Garcia, Paloma and Szörfi, Bela (2020), ‘‘The Impact of COVID-19 on Potential Output in the Euro Area’’, ECB Economic Bulletin, Issue 7. Borio, Claudio, Disyatat, Piti and Juselius, Mikael (2013), ‘‘Rethinking Potential Output: Embedding Information about the Financial Cycle’’, BIS Working Papers No 404, February. Bosworth, Barry, Collins, Susan M, Virmani, Arvind (2007), ‘‘Sources of Growth in the Indian Economy’’, NBER working papers, February. Chinnoy, Sajjid (2019), “India’s Credit Crunch: Is it Demand or Supply?” J.P. Morgan Research Note, December. Chinoy, Sajjid, Jain, Toshi (2021), ‘‘COVID-19 and India’s Macro Economy: Pre-Existing Conditions, Performance and Prospects”, India Policy Forum, NCAER. Das, Shaktikanta (2022), “Monetary Policy and Central Bank Communication”, Remarks at the National Defence College, Ministry of Defence, Government of India, New Delhi. Government of India (2018), ‘‘Chapter III: Investment and Saving Slowdowns and Recoveries: Cross-Country Insights for India’’, Economic Survey 2017–18, Vol. I, 43–54. Goyal, A and Arora, S (2013), “Inferring India’s Potential Growth and Policy Stance,” Journal of Quantitative Economics, Vol 11, Nos 1–2, pp 60–83. Goyal, A and Tripathi, S (2015), “Separating Shocks from Cyclicality in Indian Aggregate Supply,” Journal of Asian Economics, Vol 38, pp 93–103. Goyal, Ashima (2018), ‘‘Demand-led Growth Slowdown and inflation Targeting in India’’, Economic and Political Weekly, Vol. 53, Issue No. 13, March 31, 2018. Hansda, S K, Prakash, A, Chattopadhyay, S K (2021), ‘‘A Foray into Tracking Economic Activities in COVID Time through the Lens of High Frequency Indicators’’, presented at 39th Annual Conference of IARNIW held on March 6-7, 2021. International Monetary Fund, (2015), World Economic Outlook, April. International Monetary Fund, (2018), World Economic Outlook, April. International Monetary Fund, (2019), World Economic Outlook, October. International Monetary Fund, (2020), World Economic Outlook, April. Nagraj, R (2013), ‘‘India’s Dream Run, 2003-08: Understanding the Boom and Its Aftermath’’, Economic and Political Weekly, Vol XLVIII, No 20. Patra, M D (2022), “RBI’s Pandemic Response: Stepping out of Oblivion”, Keynote Address at the C D Deshmukh Memorial Lecture, Council for Social Development, Hyderabad. Patra, M D (2022), “Taper 2022: Touchdown in Turbulence”, Keynote Address at IMC Chamber of Commerce and Industry, Mumbai. Patra, M D, Behera, Harendra and John, Joice (2021), ‘‘Is the Phillips Curve in India Dead, Inert and Stirring to Life or Alive and Well?’’ RBI Bulletin, November. Reserve Bank of India (2010), Annual Report, 2009-10. Reserve Bank of India (2018), Annual Report, 2017-18. Reserve Bank of India (2019), Annual Report, 2018-19. Reserve Bank of India (2020), Annual Report, 2019-20. Reserve Bank of India (2021), Annual Report, 2020-21. World Economic Forum (2020), Global Competitiveness Report.
|