During 2021-22, NBFCs’ balance sheet grew at a subdued pace driven by deceleration in their loans and advances. The sector, however, continued to show resilience in terms of sound capital position, improved asset quality, adequate provisioning and higher profitability. HFCs’ balance sheet expanded moderately in 2021-22 on the back of consolidation. AIFIs’ balance sheet exhibited double digit growth mainly on account of growth in investments and loans and advances. 1. Introduction VI.1 Non-banking financial companies (NBFCs) weathered the pandemic supported by various policy initiatives. They built up financial soundness during 2021-22, marked by balance sheet consolidation, improvement in asset quality, augmented capital buffers and profitability. In the second wave of the pandemic during H1: 2021-22, the disruption to economic activity was limited due to adoption of localised and region-specific containment policies and the steady pace of vaccination. Contact-intensive segments and smaller businesses in the NBFC sector were however, hit hard and faced asset quality and liquidity stress. As the impact of the second wave waned and the third wave turned out to be short-lived, the NBFC sector regained momentum, cushioned by pro-active policy measures announced by the Reserve Bank and the government. Housing finance companies (HFCs) remained resilient as property sales picked up, driven by pent up demand, low interest rates, reduction in stamp duties and the shift in labour market conditions with a preference to work from home. All India financial institutions (AIFIs) also realigned their business strategies to contribute to economic recovery, buoyed by the refinance support from the Reserve Bank. VI.2 This chapter analyses the operations and performance of non-banking financial institutions (NBFIs) regulated by the Reserve Bank1, comprising NBFCs, HFCs, AIFIs and primary dealers (PDs) (Chart VI.1). NBFCs comprise government/ public/ private limited companies which provide niche financing to various sectors of the economy, ranging from real estate and infrastructure to agriculture and micro loans, thereby supplementing bank credit. HFCs specialise in providing housing finance to individuals, co-operative societies and corporate bodies to support housing activity in the country2. AIFIs, i.e., the National Bank for Agriculture and Rural Development (NABARD), the Export Import Bank of India (EXIM Bank), the Small Industries Development Bank of India (SIDBI), the National Housing Bank (NHB) and the recently established National Bank for Financing Infrastructure and Development (NaBFID)3, are the apex financial institutions which provide long-term funding to agriculture, foreign trade, small industries, housing finance companies and infrastructure, respectively. PDs ensure subscription to primary issuances of government securities (G-secs), besides acting as market makers in the G-sec market. The rest of the chapter is organised into four sections. Section 2 provides an overview of the NBFC sector, covering in detail non-deposit taking systemically important NBFCs (NBFCs-ND-SI) and deposit-taking NBFCs (NBFCs-D). The activities and financial performance of HFCs are also covered in this section. An assessment of the performance of AIFIs and PDs is provided in Section 3 and Section 4, respectively. Section 5 concludes with an overall assessment and offers perspectives for the way forward. 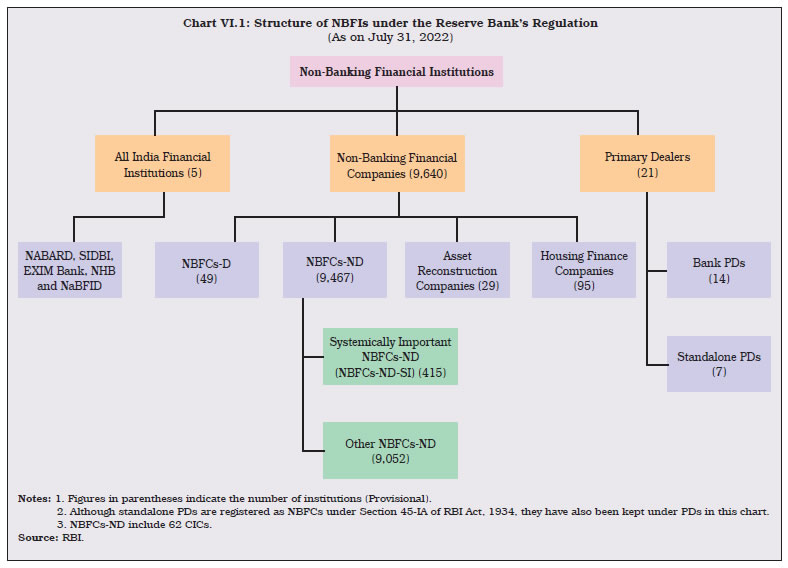 2. Non-Banking Financial Companies (NBFCs)4 VI.3 The growing importance of the NBFC sector in the Indian financial system is reflected in the consistent rise of NBFCs’ credit as a proportion to GDP as well as in relation to credit extended by scheduled commercial banks (SCBs) (Charts VI.2a and b). VI.4 In terms of asset/liability structures, NBFCs are subdivided into deposit-taking NBFCs (NBFCs-D) - which accept and hold public deposits - and non-deposit taking NBFCs (NBFCs-ND). Among non-deposit taking NBFCs, those with asset size of ₹500 crore or more are classified as non-deposit taking systemically important NBFCs (NBFCs-ND-SI). VI.5 After the regulatory overhaul in October 2022, NBFCs are segregated into four layers, namely, Base Layer (NBFC-BL), Middle Layer (NBFC-ML), Upper Layer (NBFC-UL) and Top Layer (NBFC-TL), based on their size, activity, and perceived level of riskiness. In terms of size, NBFC-BL comprises all NBFCs-ND with asset size below ₹1,000 crore. NBFCs-ND with asset size above ₹1,000 crore and NBFCs-D are put in NBFC-ML. NBFC-UL comprises those NBFCs (including NBFCs-D) which are specifically monitored by the Reserve Bank on the basis of a set of parameters and scoring methodology. The framework also envisages that top ten eligible NBFCs in terms of their asset size shall always reside in NBFC-UL. Accordingly, the Reserve Bank has identified and placed 16 NBFCs (including HFCs) in NBFC-UL. NBFC-TL shall ideally remain empty and will be populated if the Reserve Bank perceives a substantial increase in the potential systemic risk from specific NBFCs in NBFC-UL. Apart from scale, the new regulatory framework also prescribes activity-based regulation for NBFCs (Table VI.1). The Reserve Bank also specified a Prompt Corrective Action (PCA) framework for NBFCs in the middle and upper layers to further strengthen its oversight over these segments (Box VI.1). 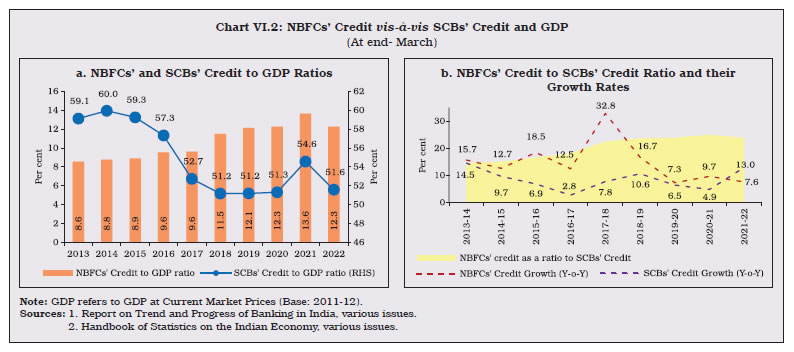
| Table VI.1: Classification of NBFCs by Activity under the New Regulatory Framework | | Type of NBFC | Activity | Layer | | 1. NBFC-Investment and Credit Company (NBFC-ICC) | Lending and investment. | Any layer, depending on the parameters of the scale based regulatory framework. | | 2. NBFC-Infrastructure Finance Company (NBFC-IFC) | Financing of infrastructure sector. | Middle layer or Upper layer, as the case may be. | | 3. Core Investment Company (CIC) | Investment in equity shares, preference shares, debt, or loans of group companies. | Middle layer or Upper layer, as the case may be. | | 4. NBFC-Infrastructure Debt Fund (NBFC-IDF) | Facilitation of flow of long-term debt only into post commencement operations in infrastructure projects which have completed at least one year of satisfactory performance. | Middle layer | | 5. NBFC-Micro Finance Institution (NBFC-MFI) | Providing collateral free small ticket loans to low income households. | Any layer, depending on the parameters of the scale based regulatory framework. | | 6. NBFC-Factors | Acquisition of receivables of an assignor or extending loans against the security interest of the receivables at a discount. | Any layer, depending on the parameters of the scale based regulatory framework. | | 7. NBFC-Non-Operative Financial Holding Company (NBFC-NOFHC) | Facilitation of promoters/ promoter groups in setting up new banks. | Base layer | | 8. NBFC-Mortgage Guarantee Company (NBFC-MGC) | Undertaking of mortgage guarantee business. | Any layer, depending on the parameters of the scale based regulatory framework. | | 9. NBFC-Account Aggregator (NBFC-AA) | Collecting and providing a customer’s financial information in a consolidated, organised, and retrievable manner to the customer or others as specified by the customer. | Base layer | | 10. NBFC–Peer to Peer Lending Platform (NBFC-P2P) | Providing an online platform to bring lenders and borrowers together to help mobilise funds. | Base layer | | 11. Housing Finance Company (HFC) | Financing for purchase/ construction/ reconstruction/ renovation/ repairs of residential dwelling units. | Middle layer or Upper layer, as the case may be. | Notes: 1. Standalone Primary Dealers (SPDs) lie in the middle layer.
2. Government NBFCs lie in either base or middle layer.
Source: RBI. |
Box VI.1: New Regulatory Framework for NBFCs Over the years, the NBFC sector in India has made rapid strides, furthering financial inclusion by offering tailored financial products to segments underserved by banks. In recent years, however, many NBFCs have assumed systemic significance with inter-linkages across the financial system. In keeping with the principle of proportionality, the Reserve Bank recently introduced scale-based regulation (SBR) for NBFCs, thereby narrowing the regulatory arbitrage between banks and large NBFCs while preserving operational flexibility. An analysis of supervisory data reveals that NBFCs residing in the middle and upper layers account for almost 95 per cent of the total assets and may pose systemic risks (Charts 1a and b). As a result, the Reserve Bank has prescribed progressively stringent regulatory regimes for NBFCs in these two layers. The Reserve Bank has also extended its Prompt Corrective Action (PCA) framework, akin to that applicable to banks, to NBFCs in the middle and upper layers5 so as to undertake remedial measures in a timely manner if vital financial parameters breach the prescribed thresholds. In case of NBFCs-ND-SI and NBFCs-D, capital adequacy ratio (CRAR), Tier- I capital ratio and net non-performing assets (NNPA) ratio are the key indicators used to demarcate various risk thresholds (RT)6 (Table 1). 
| Table 1: Risk Thresholds defined under PCA Framework for NBFCs-ND-SI and NBFCs-D. | | Indicator | RT-1 | RT-2 | RT-3 | | CRAR | Less than the regulatory minimum of 15 per cent but greater than or equal to 12 per cent. | Less than 12 per cent but greater than or equal to 9 per cent. | Less than 9 per cent. | | Tier-I Capital Ratio | Less than the regulatory minimum of 10 per cent but greater than or equal to 8 per cent. | Less than 8 per cent but greater than or equal to 6 per cent. | Less than 6 per cent. | | NNPA Ratio | Greater than 6 per cent but less than or equal to 9 per cent. | Greater than 9 but less than or equal to 12 per cent. | Greater than 12 per cent. | Supervisory data suggest that at the aggregate level, NBFC-ML and NBFC-UL are adequately capitalised, with low delinquency ratios (Chart 2). A granular analysis of NBFCs populating various risk thresholds reveals that the 10 NBFC-UL7, which include three NBFCs-D and seven NBFCs-ND-SI, fulfil the regulatory norms in all the three parameters. The Reserve Bank engages in continuous monitoring of these companies to maintain system-level resilience. In case of NBFC-ML, around 90 per cent of the NBFCs considered in the analysis meet the regulatory norms in all three parameters. Some companies, however, are currently undergoing arbitration and resolution under the Insolvency and Bankruptcy Code (IBC) and Prudential Framework for Resolution of Stressed Assets, 2019 and are in breach of the prescribed risk thresholds. Going forward, it is expected that once the companies successfully undergo resolution, they will be able to maintain healthy prudential ratios. References Scale Based Regulation (SBR): A Revised Regulatory Framework for NBFCs, RBI, October 22, 2021. https://rbidocs.rbi.org.in/rdocs/notification/PDFs/NT1127AD09AD866884557BD4DEEA150ACC91A.PDF Prompt Corrective Action (PCA) Framework for Non-Banking Financial Companies (NBFCs), RBI, December 14, 2021. https://rbidocs.rbi.org.in/rdocs/notification/PDFs/139PCANBFCSC3389782516C440DAF56D30473BF005B.PDF |
VI.6 The current regulatory guidelines mandate that only those companies with minimum net owned funds (NOF) of ₹10 crore can commence the activities of NBFCs8. The existing NBFCs-ICC, NBFCs-MFI and NBFC-Factors are required to attain NOF of ₹10 crore by March 2027 following a glide-path.
VI.7 During 2021-22, the number of registrations of NBFCs dipped marginally and the number of cancellations increased year-on-year (Chart VI.3). The pandemic led to a mushrooming of digital lenders as customers increasingly resorted to digital platforms for quick short-term loans. Several such NBFCs violated extant regulations and guidelines on outsourcing and Fair Practices Code (FPC) and faced cancellation of licenses. 2.1 Ownership Pattern VI.8 The NBFCs-ND-SI category accounted for around 86 per cent of the total assets of the NBFC sector at end-March 2022. Although the category is largely populated by non-government companies, a few large government-owned NBFCs hold a substantial share of the assets of the NBFCs-ND-SI sub-sector (Table VI.2). VI.9 The deposits of NBFCs-D are not insured by the Deposit Insurance and Credit Guarantee Corporation (DICGC). Hence, the Reserve Bank has mandated that only investment grade NBFCs-D shall accept fixed deposits from the public up to a limit of 1.5 times of their NOF and for a tenure of 12 to 60 months only, with interest rates capped at 12.5 per cent, keeping depositors’ interest in view. In May 2022, it was mandated that the deposits of NBFCs shall have a minimum investment grade credit rating of ‘BBB–’ from any of the SEBI-registered credit rating agencies. 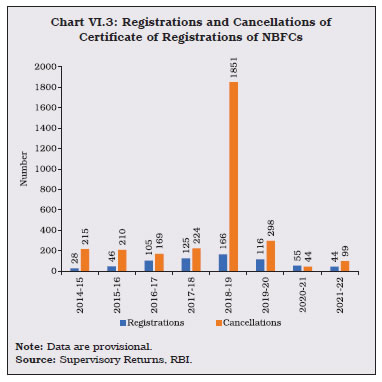
| Table VI.2: Ownership Pattern of NBFCs | | (At end-March 2022) | | (Amount in ₹ crore) | | Type | NBFCs-ND-SI | NBFCs-D | | Number | Asset Size | Asset share in per cent | Number | Asset Size | Asset share in per cent | | 1 | 2 | 3 | 4 | 5 | 6 | 7 | | A. Government Companies | 19 | 14,91,617 | 45.4 | 4 | 64,729 | 11.7 | | B. Non-government Companies (1+2) | 403 | 17,96,727 | 54.6 | 45 | 4,87,848 | 88.3 | | 1. Public Limited Companies | 234 | 13,96,233 | 42.5 | 41 | 4,87,839 | 88.3 | | 2. Private Limited Companies | 169 | 4,00,494 | 12.2 | 4 | 9 | 0 | | Total (A+B) | 422 | 32,88,344 | 100.0 | 49 | 5,52,577 | 100.0 | Note: Data are provisional.
Source: Supervisory Returns, RBI. | VI.10 At end-March 2022, NBFCs-D accounted for 14.4 per cent of the total assets of the NBFC sector. Non-government public limited companies dominate this category, with a share of 88.3 per cent of the total assets of NBFCs-D (Table VI.2). 2.2 Balance Sheet VI.11 The balance sheet size of NBFCs grew at a subdued pace in 2021-22, reflecting both weak demand and risk aversion amid disruptions caused by the second wave of COVID-19. NBFCs also faced headwinds as competition from banks intensified, particularly in the retail space. The sector nevertheless maintained comfortable liquidity buffers, adequate provisioning, and a strong capital position. VI.12 The deceleration in loans and advances of the sector was driven by an absolute decline in unsecured loans by NBFCs-ND-SI, highlighting their preference for safe assets in an atmosphere of economic uncertainty. NBFCs-ND-SI also continued to shore up their liquidity, with their cash and bank balances exhibiting double digit growth. At end- September 2022, balance sheet growth of NBFCs moderated on the back of a decline in investments of NBFCs-ND-SI. Credit, however, grew in double digits for both NBFCs-ND-SI and NBFCs-D (Appendix Tables VI.1, VI.2 and VI.3). VI.13 The allure of higher interest rates offered by NBFCs-D ensured a steady growth in their public deposits in 2021-22. While their credit books exhibited a robust expansion, their investments, cash and bank balances declined (Table VI.3). | Table VI.3: Abridged Balance Sheet of NBFCs | | (Amount in ₹ crore) | | Items | At end-March 2021 | At end-March 2022 | At end-September 2022 | | NBFCs | NBFCs-ND-SI | NBFCs-D | NBFCs | NBFCs-ND-SI | NBFCs-D | NBFCs | NBFCs-ND-SI | NBFCs-D | | 1 | 2 | 3 | 4 | 5 | 6 | 7 | 8 | 9 | 10 | | 1. Share Capital and Reserves | 7,97,627 | 6,96,742 | 1,00,884 | 9,01,449 | 7,89,909 | 1,11,541 | 8,40,345 | 7,25,704 | 1,14,641 | | | (26.3) | (27.6) | (17.6) | (13.0) | (13.4) | (10.6) | (3.4) | (2.7) | (8.5) | | 2. Public Deposits | 62,262 | - | 62,262 | 70,754 | - | 70,754 | 71,640 | - | 71,640 | | | (24.5) | | (24.5) | (13.6) | | (13.6) | (7.8) | - | (7.8) | | 3. Debentures | 9,82,576 | 8,83,895 | 98,681 | 10,06,496 | 8,97,508 | 1,08,988 | 10,09,804 | 8,98,490 | 1,11,314 | | | (8.4) | (10.1) | (-4.5) | (2.4) | (1.5) | (10.4) | (2.2) | (1.5) | (8.1) | | 4. Bank Borrowings | 7,75,099 | 6,60,285 | 1,14,815 | 9,04,715 | 7,85,089 | 1,19,625 | 9,23,732 | 7,88,646 | 1,35,086 | | | (11.5) | (15.7) | (-7.7) | (16.7) | (18.9) | (4.2) | (26.4) | (26.1) | (28.0) | | 5. Commercial Paper | 72,597 | 64,074 | 8,523 | 70,117 | 62,218 | 7,899 | 72,340 | 57,560 | 14,780 | | | (8.6) | (7.9) | (14.0) | (-3.4) | (-2.9) | (-7.3) | (0.5) | (-4.7) | (27.2) | | 6. Others | 8,14,174 | 6,80,946 | 1,33,228 | 8,87,389 | 7,53,619 | 1,33,770 | 9,00,311 | 7,64,012 | 1,36,298 | | | (-0.6) | (-3.2) | (15.0) | (9.0) | (10.7) | (0.4) | (7.1) | (9.1) | (-3.0) | | Total Liabilities/Assets | 35,04,335 | 29,85,943 | 5,18,392 | 38,40,921 | 32,88,344 | 5,52,577 | 38,18,173 | 32,34,413 | 5,83,760 | | | (10.6) | (11.3) | (6.5) | (9.6) | (10.1) | (6.6) | (8.8) | (8.6) | (9.6) | | 1. Loans and Advances | 27,02,618 | 22,78,224 | 4,24,394 | 29,08,743 | 24,47,059 | 4,61,684 | 29,37,051 | 24,51,024 | 4,86,028 | | | (9.7) | (11.3) | (1.6) | (7.6) | (7.4) | (8.8) | (10.3) | (10.3) | (10.7) | | 2. Investments | 4,44,837 | 3,98,236 | 46,601 | 5,13,891 | 4,68,413 | 45,479 | 4,50,462 | 3,98,252 | 52,210 | | | (27.9) | (29.0) | (19.0) | (15.5) | (17.6) | (-2.4) | (-4.1) | (-5.9) | (11.5) | | 3. Cash and Bank Balances | 1,57,708 | 1,23,474 | 34,235 | 1,80,341 | 1,48,174 | 32,167 | 1,80,066 | 1,48,793 | 31,272 | | | (20.0) | (8.1) | (98.2) | (14.4) | (20.0) | (-6.0) | (11.1) | (14.8) | (-3.4) | | 4. Other Current Assets | 1,59,543 | 1,46,988 | 12,555 | 1,65,364 | 1,52,703 | 12,661 | 1,75,179 | 1,63,808 | 11,371 | | | (-11.5) | (-12.8) | (32.2) | (3.6) | (3.9) | (0.8) | (8.9) | (8.7) | (12.3) | | 5. Other Assets | 39,629 | 39,021 | 608 | 72,581 | 71,994 | 587 | 75,414 | 72,536 | 2,878 | | | (-13.1) | (-12.9) | (-80.3) | (83.2) | (84.5) | (-3.4) | (34.5) | (39.7) | (-30.6) | Notes: 1. Data are provisional.
2. Figures in parentheses indicate y-o-y growth in per cent.
Source: Supervisory Returns, RBI. |
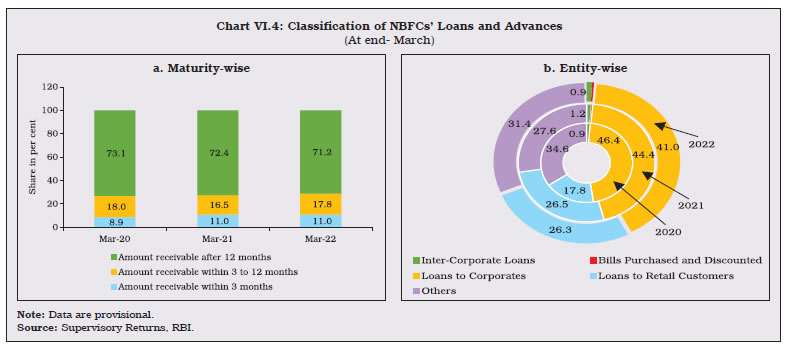 VI.14 The maturity profile of NBFCs’ credit indicates that over two- thirds of their loans are receivable after 12 months, although the pandemic did induce a marginal shift toward shorter-tenure loans (Chart VI.4a). Corporates and retail customers are the largest beneficiaries of NBFC credit. The share of wholesale loans in NBFCs’ loan book declined between 2020 and 2022 amidst muted demand. The share of retail loans, on the other hand, grew strongly, as discretionary spending picked up (Chart VI.4b). VI.15 Amongst NBFCs-ND-SI, balance sheets of ICCs and IDFs continued to grow in 2021-22, while the performance of IFCs moderated. In case of NBFCs-MFI, growth decelerated as collection efficiency and disbursals moderated in the aftermath of the second wave of COVID-19 (Table VI.4). VI.16 ICCs and IFCs accounted for around 95 per cent of total assets of NBFCs-ND-SI in 2021-22 (Chart VI.5a). While the former largely lend to services and retail sectors, the latter mainly comprises large Government NBFCs which operate in the infrastructure space. Lending by ICCs grew on the back of a rebound in the services sector. In particular, the commercial real estate (CRE) segment has been on the upswing since H2: 2021-22, driven by a resumption in economic activity, low interest rates on home loans and stamp duty cuts in a few states. Loans and advances extended by NBFCs-MFI also grew in double digits, albeit at a slower pace than last year. VI.17 To mitigate the adverse effects of the pandemic on the power sector finances, the Union government had directed two government IFCs in the power sector to lend to eligible DISCOMS under the Atmanirbhar Bharat Abhiyan (ABA). As a result, both these IFCs had made large disbursements in 2020-21. While disbursements under ABA continued in 2021-22, the pace slowed. Disbursements by another government IFC lending to railways fell from over ₹1 lakh crore in 2020-21 to around ₹60,000 crore in 2021-22. With these three government IFCs accounting for around 40 per cent of total assets of NBFCs-ND-SI, IFC credit grew at a slower pace in 2021-22. NBFC- Factors was the only category which registered a decline in credit growth, reflecting the cash flow disruptions faced by the MSME sector (Chart VI.5b). | Table VI.4: Major Components of Liabilities and Assets of NBFCs-ND-SI by Classification | | (Amount in ₹ crore) | | Category / Liability | As at end-March 2021 | As at end-March 2022 | As at end-September 2022 | Percentage Variation of Total Liabilities | | Borrowings | Other Liabilities | Total Liabilities | Borrowings | Other Liabilities | Total Liabilities | Borrowings | Other Liabilities | Total Liabilities | March 2021 over March 2020 | March 2022 over March 2021 | | 1 | 2 | 3 | 4 | 5 | 6 | 7 | 8 | 9 | 10 | 11 | 12 | | NBFC-ICC | 9,30,742 | 6,28,683 | 15,59,426 | 10,25,201 | 6,99,637 | 17,24,838 | 10,31,564 | 6,28,668 | 16,60,232 | 8.1 | 10.6 | | NBFC-Factors | 1,839 | 2,039 | 3,878 | 1,477 | 1,418 | 2,895 | 1,203 | 659 | 1,862 | -0.4 | -25.4 | | NBFC-IDF | 28,429 | 6,415 | 34,844 | 34,641 | 8,003 | 42,644 | 29,386 | 6,601 | 35,988 | 16.9 | 22.4 | | NBFC-IFC | 10,41,895 | 2,39,515 | 12,81,409 | 11,12,015 | 2,72,543 | 13,84,558 | 11,26,612 | 2,89,536 | 14,16,149 | 13.9 | 8.0 | | NBFC-MFI | 62,585 | 25,830 | 88,415 | 75,127 | 28,712 | 1,03,840 | 66,779 | 24,210 | 90,989 | 33.6 | 17.4 | | Others | 77 | 17,893 | 17,970 | 1,900 | 27,670 | 29,569 | 2,086 | 27,108 | 29,194 | 26.8 | 64.6 | | Total | 20,65,567 | 9,20,376 | 29,85,943 | 22,50,360 | 10,37,984 | 32,88,344 | 22,57,631 | 9,76,782 | 32,34,413 | 11.3 | 10.1 | | Category / Asset | Loans and Advances | Other Assets | Total Assets | Loans and Advances | Other Assets | Total Assets | Loans and Advances | Other Assets | Total Assets | Percentage Variation of Total Assets | | March 2021 over March 2020 | March 2022 over March 2021 | | NBFC-ICC | 10,07,142 | 5,52,283 | 15,59,426 | 10,85,372 | 6,39,466 | 17,24,838 | 10,82,404 | 5,77,828 | 16,60,232 | 8.1 | 10.6 | | NBFC-Factors | 2,961 | 917 | 3,878 | 2,296 | 599 | 2,895 | 1,767 | 96 | 1,862 | -0.4 | -25.4 | | NBFC-IDF | 30,414 | 4,430 | 34,844 | 34,475 | 8,169 | 42,644 | 32,902 | 3,086 | 35,988 | 16.9 | 22.4 | | NBFC-IFC | 11,69,244 | 1,12,165 | 12,81,409 | 12,43,485 | 1,41,073 | 13,84,558 | 12,60,866 | 1,55,283 | 14,16,149 | 13.9 | 8.0 | | NBFC-MFI | 68,462 | 19,954 | 88,415 | 81,430 | 22,410 | 1,03,840 | 73,086 | 17,903 | 90,989 | 33.6 | 17.4 | | Others | - | 17,970 | 17,970 | 1 | 29,569 | 29,569 | - | 29,194 | 29,194 | 26.8 | 64.6 | | Total | 22,78,224 | 7,07,719 | 29,85,943 | 24,47,059 | 8,41,285 | 32,88,344 | 24,51,024 | 7,83,389 | 32,34,413 | 11.3 | 10.1 | Note: Data are provisional.
Source: Supervisory Returns, RBI. |
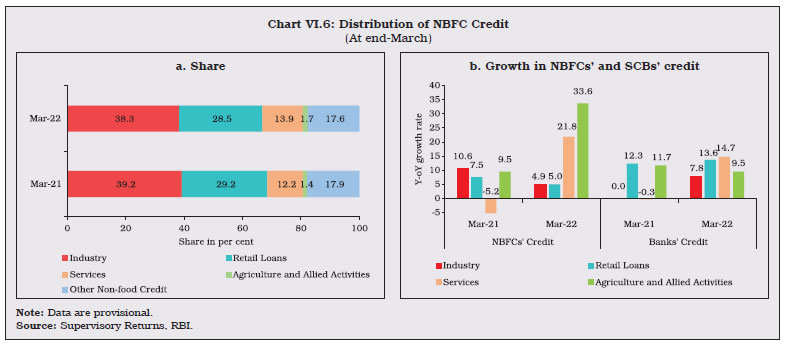 2.3 Sectoral Credit of NBFCs VI.18 Industry has traditionally remained the largest recipient of credit from the NBFC sector, followed by retail, services and agriculture (Chart VI.6 a and Appendix Table VI.4). In 2021-22, credit growth to industry and retail sectors was subdued relative to the previous year, while credit to the service sector exhibited double digit growth. VI.19 During 2021-22, while banks’ credit to industry and services sector benefitted from a favourable base effect, it is the retail segment in which banks outperformed NBFCs (Chart VI.6 b). VI.20 Within industry, about 86 per cent of industrial credit goes to infrastructure, which grew at just 1.6 per cent in 2021-22 dragging down the overall credit growth. VI.21 NBFCs also play a crucial role in bridging the credit needs of micro, small and medium enterprises (MSMEs), primarily those engaged in services (Chart VI.7). The emergency credit line guarantee scheme (ECLGS) launched by the government in May 2020 helped MSMEs to access enhanced credit. The co-lending model introduced by the Reserve Bank in November 2020 also improved the flow of credit to the MSME sector. Subsequently, the Union Budget 2022-23 has extended the ECLGS up to March 2023, with the guarantee cover raised by ₹50,000 crores to a total of ₹5 lakh crores. 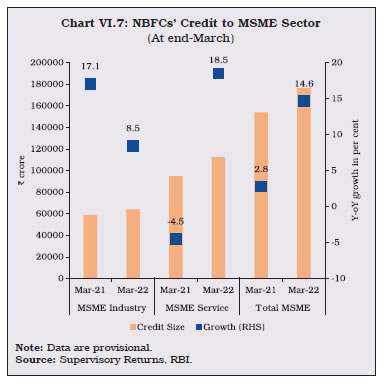
 VI.22 Vehicle loans, which traditionally form the biggest component of NBFCs’ retail portfolio, declined during 2021-22. Accordingly, the share of vehicle and auto loans, which accounted for about 45 per cent of NBFCs’ retail portfolio at the end of March 2021, dropped to around 40 per cent at end-March 2022. In recent years, banks had ceded ground to NBFCs in the vehicle loan space. This reversed in 2021-22, with the share of banks surpassing that of NBFCs (Chart VI.8a). In 2021-22, retail sales of vehicles improved after witnessing a contraction in the previous year (Chart VI.8b). VI.23 Advances against gold is a niche segment in which NBFCs have a robust market presence. However, the relaxation in loan-to-value (LTV) requirements given to banks gave a fillip to their gold loan business during the pandemic period. As a result, the share of NBFCs in the gold loan segment moderated in 2020-21. Subsequently, unwinding of the relaxation restored the competitive edge of NBFCs during 2021-22, with a modest improvement in their share (Chart VI.9). VI.24 Credit to transport operators, retail trade, and commercial real estate (CRE) segments expanded strongly by end-March 2022. Renewed demand for office and retail spaces, along with a favourable base effect, aided this recovery. A normal monsoon supported credit to agriculture and allied sectors (Table VI.5). 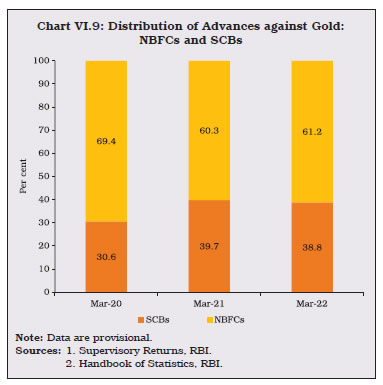
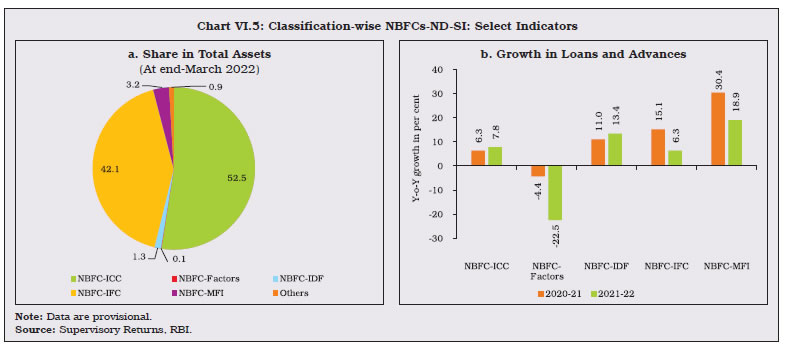
| Table VI.5: Sectoral Credit Deployment by NBFCs | | (Amount in ₹ crore) | | Items | At end-March 2021 | At end-March 2022 | At end-September 2022 | Percentage Variation | | 2020-2021 | 2021-2022 | | 1 | 2 | 3 | 4 | 5 | 6 | | I. Gross Advances (II + III) | 27,02,618 | 29,08,743 | 29,37,051 | 9.7 | 7.6 | | II. Food Credit | - | - | 1,752 | | | | III. Non-Food Credit (1 to 5) | 27,02,618 | 29,08,743 | 29,35,299 | 9.7 | 7.6 | | 1. Agriculture and Allied Activities | 37,728 | 50,422 | 46,464 | 9.5 | 33.6 | | 2. Industry | 10,60,411 | 11,12,852 | 11,15,749 | 10.6 | 4.9 | | 2.1 Micro and Small | 44,235 | 46,967 | 49,966 | 21.4 | 6.2 | | 2.2 Medium | 14,910 | 17,186 | 15,103 | 5.9 | 15.3 | | 2.3 Large | 8,54,546 | 8,94,102 | 8,99,619 | 7.5 | 4.6 | | 2.4 Others | 1,46,720 | 1,54,598 | 1,51,061 | 30.1 | 5.4 | | 3. Services | 3,30,758 | 4,02,935 | 3,81,485 | -5.2 | 21.8 | | of which, | | | | | | | 3.1 Transport Operators | 65,313 | 1,02,742 | 90,059 | 2.1 | 57.3 | | 3.2 Retail Trade | 26,719 | 40,390 | 45,066 | 0.0 | 51.2 | | 3.3 Commercial Real Estate | 80,480 | 88,123 | 79,754 | -20.7 | 9.5 | | 4. Retail Loans | 7,90,073 | 8,29,485 | 8,79,571 | 7.5 | 5.0 | | of which, | | | | | | | 4.1 Housing Loans | 21,484 | 23,329 | 24,680 | 52.7 | 8.6 | | 4.2 Consumer Durables | 18,519 | 24,802 | 27,464 | -3.4 | 33.9 | | 4.3 Vehicle/Auto Loans | 3,57,338 | 3,34,947 | 3,54,966 | 7.5 | -6.3 | | 4.4 Advances to Individuals Against Gold | 1,12,899 | 1,18,918 | 1,18,723 | 49.6 | 5.3 | | 4.5 Micro Finance Loan/SHG Loan | 59,635 | 74,826 | 77,567 | 32.2 | 25.5 | | 5. Other Non-food Credit | 4,83,648 | 5,13,050 | 5,12,031 | 24.9 | 6.1 | Note: Data are provisional.
Source: Supervisory Returns, RBI. | VI.25 Unlike IFCs, which deploy their credit primarily in industries, ICCs extend credit across all sectors, with the highest allocation made to the retail sector (Chart VI.10). NBFC-MFIs, which provide collateral-free small ticket loans showed a pick-up in credit disbursement at end-March 2022. VI.26 There was a substantial increase in the share of microfinance loans extended by NBFC-MFIs in 2021-22 (Chart VI.11). The Reserve Bank set out a common regulatory framework for microfinance loans that is applicable across the regulated entities (REs) in March 2022. Provisions like revision in the income limit to ₹3 lakh and removal of the interest rate cap should help facilitate expansion in credit flows to this segment.
2.4 Resource Mobilization VI.27 NBFCs other than NBFCs-D rely heavily on borrowings to fund their activities. Borrowing from the markets and from banks constituted around 75 per cent of total borrowings at end-March 2022. A benign interest rate environment contributed to the increase in borrowings from banks. In H1:2022-23, total borrowings accelerated mainly due to increase in borrowings from banks (Table VI.6). VI.28 While NBFCs have been gradually relying more on long-term borrowings, the share of borrowings payable in three months or less increased marginally in 2021-22 (Chart VI.12). VI.29 Non-convertible debentures (NCDs) with AAA and AA ratings have an overwhelming share in the total private placements of private NBFCs (Chart VI.13a). | Table VI.6: Sources of Borrowings of NBFCs | | (Amount in ₹ crore) | | Items | At end-March 2021 | At end-March 2022 | At end-September 2022 | Percentage Variation | | 2020-21 | 2021-22 | | 1 | 2 | 3 | 4 | 5 | 6 | | 1. Debentures | 9,82,576 | 10,06,496 | 10,09,804 | 8.4 | 2.4 | | | (41.8) | (39.5) | (39.1) | | | | 2. Bank Borrowings | 7,75,099 | 9,04,715 | 9,23,732 | 11.5 | 16.7 | | | (33.0) | (35.5) | (35.7) | | | | 3. Borrowings from FIs | 57,355 | 66,418 | 70,875 | -9.7 | 15.8 | | | (2.4) | (2.6) | (2.7) | | | | 4. Inter-corporate Borrowings | 77,840 | 86,663 | 95,573 | -0.6 | 11.3 | | | (3.3) | (3.4) | (3.7) | | | | 5. Commercial Paper | 72,597 | 70,117 | 72,340 | 8.6 | -3.4 | | | (3.1) | (2.7) | (2.8) | | | | 6. Borrowings from Government | 19,129 | 18,804 | 18,857 | 2.0 | -1.7 | | | (0.8) | (0.7) | (0.7) | | | | 7. Subordinated Debts | 68,984 | 70,863 | 67,640 | -6.9 | 2.7 | | | (2.9) | (2.8) | (2.6) | | | | 8. Other Borrowings | 2,98,099 | 3,27,015 | 3,25,874 | -10.3 | 9.7 | | | (12.7) | (12.8) | (12.6) | | | | 9. Total Borrowings | 23,51,679 | 25,51,092 | 25,84,696 | 5.2 | 8.5 | Notes: 1. Data are provisional.
2. Figures in parentheses indicate share in total borrowings.
Source: Supervisory Returns, RBI. | VI.30 NCDs of two years and three years tenor together constitute about half of the total NCDs issued in Q2:2022-23. NCDs of long tenor (greater than 10 years) were mainly raised by prominent private NBFCs (Chart VI.13 b).
VI.31 The spike in spreads, which was observed during the pandemic period, moderated owing to the liquidity enhancing measures announced by the Reserve Bank. In recent months, however, the spread of NBFC bonds yields over G-sec yields of corresponding maturity has widened marginally with the normalisation of monetary policy, elevated oil prices and rising global yields (Chart VI.14a and b). VI.32 As alluded to earlier, NBFCs rely heavily on SCBs for their funds. Public sector banks (PSBs) are the foremost lenders, followed by private sector banks (PVBs) and foreign banks (FBs) (Chart VI.15a and b).
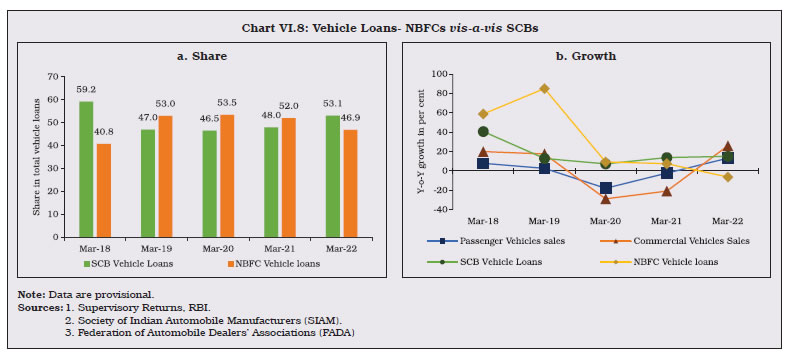
VI.33 The exposure of banks to NBFCs grew mainly due to increase in direct lending which amounted to 86.5 per cent of the total bank funding to the NBFC sector (Chart VI.16a). Banks also subscribe to debentures and commercial papers (CPs) issued by NBFCs. The growth of banks’ subscription to CP issuances by NBFCs has turned around since Q3:2021-22 (Chart VI.16b). 2.5 NBFCs-D: Deposits VI.34 Public deposits constituted 12.8 per cent of total liabilities of NBFCs-D at end-March 2022. Competitive interest rates offered along with robust credit ratings contributed to their steady growth. The number of companies authorized to accept such deposits, however, has been gradually declining (Chart VI.17).
VI.35 Public deposits allow these companies to diversify their sources of funds rather than relying exclusively on banks and capital markets. Almost 90 per cent of deposits were held by 5 NBFCs-D, with all of them having total deposits of greater than ₹5,000 crores (Chart VI.18). 2.6 Asset Sales and Securitisation VI.36 Asset sales allow NBFCs to strengthen their balance sheets by rebalancing their exposures and enhancing liquidity. Asset sales picked up after dipping marginally in December 2021 and volumes crossed pre-COVID levels in March 2022 (Chart VI.19a). Securitisation, unlike strategic asset sales, helps NBFCs in spreading out credit risk to a wider investor base comprising banks, insurance companies and asset reconstruction companies. It also provides them an additional source of funding. Securitized assets have been gathering pace on a sequential basis since June 2021 (Chart VI.19b). Nevertheless, securitisation volumes are yet to reach pre-COVID levels. In both asset sales and securitisation undertaken by NBFCs, banks are the main counterparties, utilising these arrangements to meet their commitments under priority sector lending requirements.
2.7 Asset Liability Profile of NBFCs VI.37 The liquidity position of NBFCs is assessed by monitoring the liquidity mismatch, which is the difference between inflows and outflows for a given time bucket. An improvement in mismatch indicates a comfortable liquidity position which can be attributed to either an increase in inflows or a decrease in outflows. Short-term mismatches viz., in the 1-30/31 days bucket is critical for liquidity risk management. Due to fall in outflows, an improvement in the cumulative mismatch was observed in this bucket at end-March 2022 vis-à-vis end-March 2021. All time buckets except that of over six months to one year and over five years, recorded improvement at end-March 2022, with no cumulative negative mismatches in the less than one-year buckets (Chart VI.20). 2.8 Financial Performance of NBFCs VI.38 NBFCs’ income grew at a higher rate in 2021-22 than a year ago, primarily driven by fund-based income of NBFCs-ND-SI and NBFCs-D. During H1:2022-23, net profits of NBFCs improved mainly by a turnaround in fund-based income (Appendix Tables VI.5 and VI.6). VI.39 On the expenditure side, there was a steep growth in the operating expenses of NBFCs. Provisions against NPAs, on the other hand, declined reflecting easing of asset quality concerns. Overall, expenditure of the sector declined due to lower provisions and decrease in interest expenses on bank loans and inter-corporate deposits. The result was a sizable growth in net profit. The decline in cost to income ratio for the NBFC sector, across all categories, indicates efficiency gains in their operations (Table VI.7). In 2022-23 (up to end-September), there was a turnaround in total income surpassing the growth in total expenditure. 2.9 Profitability Indicators VI.40 Profitability indicators - return on assets (RoA), return on equity (RoE) and net interest margin (NIM) - increased in 2021-22. NBFCs-ND-SI and NBFCs-D experienced bottom line growth at end-March 2022 (Chart VI.21). All profitability indicators showed an improvement in H1:2022-23 over the corresponding period in the previous year. | Table VI.7: Financial Parameters of the NBFC Sector | | (Amount in ₹ crore) | | Items | 2020-21 | 2021-22 | H1:2022-23 | | NBFCs | NBFCs-ND-SI | NBFCs-D | NBFCs | NBFCs-ND-SI | NBFCs-D | NBFCs | NBFCs-ND-SI | NBFCs-D | | 1 | 2 | 3 | 4 | 5 | 6 | 7 | 8 | 9 | 10 | | A. Income | 3,56,252 | 2,89,157 | 67,095 | 3,76,563 | 3,03,831 | 72,732 | 2,09,589 | 1,69,696 | 39,893 | | | (3.9) | (4.7) | (0.8) | (5.7) | (5.1) | (8.4) | (20.0) | (21.7) | (13.2) | | B. Expenditure | 3,00,373 | 2,44,869 | 55,504 | 2,94,928 | 2,39,645 | 55,282 | 1,53,366 | 1,25,955 | 27,411 | | | (4.8) | (4.2) | (7.9) | (-1.8) | (-2.1) | (-0.4) | (10.9) | (16.4) | (-8.9) | | C. Net Profit | 41,578 | 32,901 | 8,677 | 61,843 | 48,523 | 13,319 | 45,204 | 35,766 | 9,437 | | | (6.5) | (16.2) | (-19) | (48.7) | (47.5) | (53.5) | (55.9) | (44.7) | (120.7) | | D. Total Assets | 35,04,335 | 29,85,943 | 5,18,392 | 38,40,921 | 32,88,344 | 5,52,577 | 38,18,173 | 32,34,413 | 5,83,760 | | | (10.6) | (11.3) | (6.5) | (9.6) | (10.1) | (6.6) | (8.8) | (8.6) | (9.6) | | E. Financial Ratios (as per cent of Total Assets) | | | | | | | | | | | (i) Income | 10.2 | 9.7 | 12.9 | 9.8 | 9.2 | 13.2 | 11.0 | 10.5 | 13.7 | | (ii) Expenditure | 8.6 | 8.2 | 10.7 | 7.7 | 7.3 | 10.0 | 8.0 | 7.8 | 9.4 | | (iii) Net Profit | 1.2 | 1.1 | 1.7 | 1.6 | 1.5 | 2.4 | 2.4 | 2.2 | 3.2 | | F. Cost to Income Ratio (Per cent) | 84.3 | 84.7 | 82.7 | 78.3 | 78.9 | 76.0 | 73.2 | 74.2 | 68.7 | Notes: 1. Data are provisional.
2. Figures in parentheses indicate y-o-y growth in per cent.
Source: Supervisory Returns, RBI. | VI.41 Among NBFCs-ND-SI, all segments except NBFC-IDF registered an improvement in RoA and RoE at end-March 2022 (Chart VI.22). 2.10 Asset Quality VI.42 In 2021-22, asset quality of the sector improved as evident from the decline in both GNPA and NNPA ratios. While business conditions improved, the deferment in the NPA upgradation norms9 by the Reserve Bank, better recovery and lower fresh accretions facilitated the decline in NPAs during the period. An increase in provision coverage ratio (PCR) from 56.7 per cent at end March 2021 to 60.7 per cent at end March 2022 suggests enhanced resilience (Chart VI.23). In 2022-23 (up to end-September), asset quality of the sector witnessed an improvement.
VI.43 At end-March 2022, all categories of NBFCs-ND-SI maintained a higher PCR than in the previous year, indicating that they are cushioned to deal with credit impairment risk (Chart VI.24). VI.44 Based on the duration for which an asset remains non-performing, NPAs can be categorised into sub-standard, doubtful and loss assets. In 2021-22, there was a marginal improvement in the proportion of standard assets (Chart VI.25).
VI.45 Among performing loans, the overall delinquency ratios came down year-on-year by end-March 2022. Loans overdue in the first bucket viz., less than 30 days were the largest, but the position improved in 2021-22 vis-à-vis the previous year, resulting in an overall reduction in the overdues of performing loans (Chart VI.26). The share of standard assets with no overdues in total performing loans increased from 87.7 per cent in 2020-21 to 90.6 per cent in 2021-22. VI.46 Overall, GNPA and NNPA ratios of NBFCs-ND-SI showed an improvement in 2021-22 as the quality of assets improved in all the segments, with the exception of ICC (Chart VI.27 a and b). In H1: 2022-23, GNPA and NNPA ratios continued to decline. VI.47 A sectoral distribution of delinquent assets of NBFCs shows that industry, which is traditionally the largest recipient of credit from NBFCs, also had the dominant share of NPAs at end-March 2022, with large industries accounting for the major portion. Vehicle/auto loans and commercial real estate segments have the largest share of impaired assets in retail and service sector loans, respectively (Chart VI.28). At end-September 2022, NPA ratio broadly declined across the sectors. VI.48 In the case of NBFCs-D, the decline in the GNPA ratio was aided by buoyant growth in loans and advances. The NNPA ratio also registered a marginal reduction in the same period (Chart VI.29). In 2022-23 so far (up to September), asset quality improved further.
VI.49 Large borrowal accounts (exposure of ₹5 crore and above) constituted 51.3 per cent of gross advances extended by NBFCs. They, however, contributed around 76.6 per cent of total NPAs at end-March 2022 (Chart VI.30a). Special mention accounts (SMA) give a sense of incipient stress in performing assets. While SMA-0 increased, SMA-2, which comprises loans on the brink of being classified as NPAs, declined during the year. The increase in GNPA ratio in large borrowal accounts indicates build-up of stress in this segment even as GNPA and NNPA at the aggregate level declined (Chart VI.30b). 2.11 Capital to Risk Weighted Assets Ratio (CRAR) VI.50 As per the extant regulation, NBFCs are required to maintain a minimum capital ratio of not less than 15 per cent of aggregate risk-weighted assets (including both on and off-balance sheet exposures). The NBFC sector is comfortably placed, with CRAR well above the regulatory requirement (Chart VI.31). VI.51 In 2021-22, amongst NBFCs-ND-SI, IFCs registered a significant improvement in their CRAR, buoyed by an increase in Tier I capital. Among other categories, ICCs recorded marginal improvement, while CRAR of NBFCs-IDF and NBFCs-MFI deteriorated (Chart VI.32a). NBFCs-D continued to maintain adequate capital, considerably higher than the stipulated norm (Chart VI.32b). 2.12 Exposure to Sensitive Sectors VI.52 Assets in sensitive sectors are susceptible to fluctuations in value, which makes them important from the viewpoint of financial stability. Capital market exposure (CME) includes advances to and investment in capital market and advances to individuals for investment in Initial Public Offerings (IPOs). CME’s share in total sensitive sector exposure (SSE) has remained almost invariant since end-March 2020. Real estate exposures (REE), which include credit and investments in real estate, have been declining in terms of share in total SSE. Investment in securities (IIS), which includes investment in quoted and un-quoted securities and equities, has been gaining share at the expense of REE. SSE of NBFCs recorded an increase in 2021-22, as a share of total assets, mostly on account of growth in investment in securities (Chart VI.33).
2.13 Housing Finance Companies (HFCs) VI.53 In India, housing finance companies (HFCs) are specialised institutions which extend housing credit, along with SCBs. Effective August 9, 2019 HFCs are being regulated as a category of NBFCs, after the transfer of regulation of HFCs to the Reserve Bank by amendment of the NHB Act, 1987. Furthermore, with a view of harmonising the regulations between HFCs and NBFCs in a phased manner, HFCs have undergone several legislative/regulatory changes. Based on a review, the Reserve Bank issued the revised regulatory framework for HFCs on October 22, 2020, and subsequently the extant regulations applicable to HFCs were compiled under Master Directions issued on February 17, 2021. 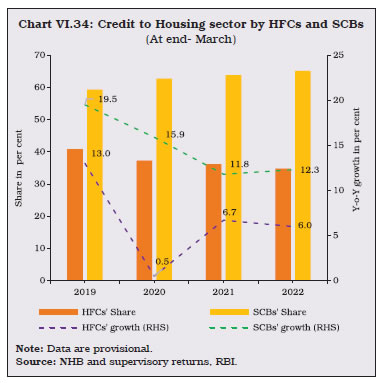 VI.54 HFCs’ credit to the housing sector decelerated in 2021-22 mainly due to change in valuation of loan assets of a distressed HFC pursuant to its amalgamation with another HFC. However, HFCs continued to maintain a sizable share in the housing credit market. SCBs’ credit to the housing segment accelerated in 2021-22, buoyed by surplus liquidity and various policy measures, such as reduction in stamp duties, easing of interest rates and fiscal incentives to households (Chart VI.34). VI.55 At the end of March 2022, there were 95 HFCs, of which only 15 were deposit taking entities. Six of the latter need prior permission from the regulator before accepting public deposits. Non-government public limited companies dominate the segment, comprising 94.3 per cent of total assets. The combined balance sheet of these entities grew, albeit at a slower pace during 2021-22 than in the previous year. The asset size of the lone government HFC expanded in 2021-22 (Table VI.8). | Table VI.8: Ownership Pattern of HFCs | | (At end-March) | | (₹ crore) | | Type | 2021 | 2022 | | Number | Asset Size | Number | Asset Size | | 1 | 2 | 3 | 4 | 5 | | A. Government Companies | 1 | 76,959 | 1 | 80,939 | | B. Non-Government Companies (1+2) | 99 | 14,05,904 | 94 | 14,46,022 | | 1. Public Ltd. Companies | 78 | 14,01,522 | 73 | 14,39,592 | | 2. Private Ltd. Companies | 21 | 4,382 | 21 | 6,430 | | Total (A+B) | 100 | 14,82,863 | 95 | 15,26,961 | Notes: 1. Two companies whose Certificate of Registration (CoR) has been cancelled and did not submit the data have not been included in the list above for the position as on March 31, 2022.
2. Data are provisional.
Source: NHB. | 2.13.1. Balance Sheet VI.56 The consolidated balance sheet of HFCs decelerated in 2021-22 due to resolution of a stressed HFC and merger of another HFC with its parent NBFC resulting in tepid growth of loans and advances, along with contraction of investments. On the liabilities side, inter-corporate borrowings recorded a steep rise as funds availed from other sources, such as, debentures, borrowings from NHB, commercial papers, borrowings from the government and other borrowings declined (Table VI.9). | Table VI.9: Consolidated Balance Sheet of HFCs | | (At end-March) | | (₹ crore) | | Items | 2020 | 2021 | 2022 | Percentage variation | | 2021 | 2022 | | 1 | 2 | 3 | 4 | 5 | 6 | | 1 | Share capital | 36,858 | 37,696 | 40,357 | 2.3 | 7.1 | | 2 | Reserves and surplus | 1,45,053 | 1,70,359 | 2,24,698 | 17.4 | 31.9 | | 3 | Public deposits | 1,19,795 | 1,26,691 | 1,25,236 | 5.8 | -1.1 | | 4 | Debentures | 3,97,949 | 3,97,816 | 3,56,320 | 0.0 | -10.4 | | 5 | Bank borrowings | 3,53,214 | 3,29,835 | 3,74,803 | -6.6 | 13.6 | | 6 | Borrowings from NHB | 49,673 | 67,341 | 59,551 | 35.6 | -11.6 | | 7 | Inter-Corporate Borrowings | 6,206 | 19,182 | 1,24,969 | 209.1 | 551.5 | | 8 | Commercial papers | 46,631 | 54,554 | 50,216 | 17.0 | -8.0 | | 9 | Borrowings from Government* | 1,282 | 19,313 | 2,587 | 1406.9 | -86.6 | | 10 | Subordinated debts | 17,348 | 19,168 | 15,363 | 10.5 | -19.9 | | 11 | Other borrowings | 1,49,404 | 1,31,818 | 71,410 | -11.8 | -45.8 | | 12 | Current liabilities | 20,446 | 8,100 | 28,922 | -60.4 | 257.0 | | 13 | Provisions^ | 7,499 | 64,303 | 33,793 | 757.5 | -47.4 | | 14 | Other** | 42,508 | 36,686 | 18,738 | -13.7 | -48.9 | | 15 | Total Liabilities / Assets | 13,93,865 | 14,82,863 | 15,26,961 | 6.4 | 3.0 | | 16 | Loans and advances | 11,83,561 | 12,77,653 | 13,28,070 | 7.9 | 3.9 | | 17 | Hire purchase and lease assets | 33 | 10 | 20 | -70.4 | 106.5 | | 18 | Investments | 97,931 | 1,29,961 | 1,04,625 | 32.7 | -19.5 | | 19 | Cash and bank balances | 56,955 | 36,864 | 39,968 | -35.3 | 8.4 | | 20 | Other assets*** | 55,384 | 38,375 | 54,277 | -30.7 | 41.4 | ^The sudden increase in provisions at end-March 2021, is due to high provision reported by one major HFC.
* includes borrowings from foreign government also.
**includes deferred tax liabilities and other liabilities.
***includes tangible & intangible assets, other assets, and deferred tax asset.
Note: Data are provisional.
Source: NHB. |
 2.13.2. Resource Profile of HFCs VI.57 HFCs essentially rely on debentures and borrowings from banks to perform the credit intermediation function. Together these two sources constituted around 62 per cent of total resources mobilised at end-March 2022. The share of debentures moderated in 2021-22, while HFCs’ dependence on banks increased (Chart VI.35). VI.58 Public deposits, which constitute another important source of funding, declined in 2021-22 (Chart VI.36). Furthermore, the share of deposits in total liabilities of HFCs has been steadily declining since 2016-17, except in 2019-20. VI.59 The distribution of deposits with HFCs in 2021-22 shows that there is a concentration in the 6-9 per cent interest rate bracket. Growth was observed in deposits in the below 6 per cent interest rate bracket on account of the overall soft interest rate regime (Chart VI.37a). Maturity wise, the maximum share of deposits was in the tenure of 1 to 5 years (Chart VI.37b). 2.13.3. Financial Performance VI.60 The consolidated income of HFCs contracted in 2021-22 on account of a decline in both fund income and fee income. Expenditure, however, increased marginally due to rise in provisions/depreciations. Consequently, there was an increase in the cost to income ratio in 2021-22. Net profit of HFCs improved, mainly due to resolution of one major HFC. The RoA also improved and became positive (Table VI.10). 2.13.4. Soundness Indicators VI.61 Asset quality of the sector improved in 2021-22 compared to the previous year, when there was a spike in GNPA ratio of two major HFCs. However, both GNPA and NNPA ratios declined at end-March 2022 due to resolution of a major HFC (Chart VI.38). | Table VI.10: Financial Parameters of HFCs | | (At end-March) | | (₹ crore) | | | 2019-20 | 2020-21 | 2021-22 | Percentage Variation | | 2020-21 | 2021-22 | | 1 | 2 | 3 | 4 | 5 | 6 | | Total Income* | 1,41,692 | 1,29,476 | 1,25,425 | -8.6 | -3.1 | | 1. Fund Income | 1,39,683 | 1,27,924 | 1,22,998 | -8.4 | -3.9 | | 2. Fee Income | 2,009 | 1,537 | 1,376 | -23.5 | -10.5 | | Total Expenditure** | 1,22,128 | 98,965 | 1,00,264 | -19.0 | 1.3 | | 1. Financial Expenditure | 89,041 | 79,392 | 74,467 | -10.8 | -6.2 | | 2. Operating Expenditure | 33,087 | 19,199 | 10,638 | -42.0 | -44.6 | | Tax Provision | 8,561 | 13,135 | 4,766 | 53.4 | -63.7 | | Net Profit (PAT) | -2,669 | 210 | 20,395 | -107.9 | 9624.1 | | Total Assets | 13,93,865 | 14,82,863 | 15,26,961 | 6.4 | 3.0 | | Cost to Income Ratio# | 86.2 | 76.4 | 79.9 | | | | Return on Assets@ (RoA) | -0.2 | 0.0 | 1.3 | | | * Total income also comprises income from non-financial business.
** Total expenditure also comprises depreciation/provisions.
# Total Exp./Total Income
@ PAT/Total Assets
Note: Data are provisional.
Source: NHB. |
 VI.62 To sum up, in 2021-22, HFCs showed resilience as macroeconomic conditions improved. Timely regulatory and liquidity measures by the Reserve Bank, along with the announcement of the additional outlay for Prandhan Mantri Aawas Yojna-Urban (PMAY-U) by the government, assisted in enhancing liquidity. The low interest rate environment improved affordability and contributed to the resurgence in demand for housing loans. VI.63 Going forward, HFCs are expected to improve their credit disbursements. They need to be cautious, however, about rising borrowing costs and competition from SCBs. With the implementation of scale-based regulation, a few HFCs have been included in the upper layer, which highlights their systemic importance in the Indian financial landscape. The regulatory arbitrage between NBFCs and banks has been gradually narrowing, as reflected in the recent application filed by a major HFC to merge with its parent entity. 3. All India Financial Institutions VI.64 All-India financial institutions (AIFIs) facilitate sector-specific long-term financing to agriculture and the rural sector, small industries, housing finance companies, NBFCs, MFIs and international trade. At end-March 2021, four AIFIs, viz. the National Bank for Agriculture and Rural Development (NABARD), the Small Industries Development Bank of India (SIDBI), the National Housing Bank (NHB) and the Export Import Bank of India (EXIM Bank) were registered with the Reserve Bank. Since the enactment of the NaBFID Act 2021, effective April 19, 2021, NaBFID10 has been established as the fifth AIFI, which will cater to long term financing needs of India’s infrastructure sector. It shall be regulated and supervised as an AIFI by the Reserve Bank under Sections 45L and 45N of the Reserve Bank of India Act, 1934. 3.1. AIFIs’ Operations11 VI.65 Financial assistance sanctioned by AIFIs declined during 2021-22, primarily on account of contraction in sanctions by NABARD as no fresh loans were sanctioned under Pradhan Mantri Awaas Yojana-Gramin (PMAY-G) and Swachh Bharat Mission-Gramin (SBM-G). Further, no new projects were sanctioned in 2021-22, while disbursements of instalments were made against ongoing projects sanctioned in earlier years. Disbursements by EXIM Bank and SIDBI gained traction during 2021-22, reflecting the thrust on promoting trade and on MSMEs and manufacturing. Total disbursements of AIFIs improved in 2021-22 as a share of total sanctions (Table VI.11 and Appendix Table VI.7). | Table VI.11: Financial Assistance Sanctioned & Disbursed by AIFIs | | (₹ crore) | | Institutions | Sanctions | Disbursements | | 2020-21 | 2021-22 | 2020-21 | 2021-22 | | 1 | 2 | 3 | 4 | 5 | | EXIM BANK | 36,521 | 54,807 | 34,122 | 52,271 | | NABARD | 4,59,849 | 3,80,396 | 3,50,022 | 3,78,387 | | NHB | 37,791 | 22,330 | 34,230 | 19,313 | | SIDBI | 98,354 | 1,48,550 | 98,115 | 1,46,402 | | Total | 6,32,515 | 6,06,083 | 5,16,489 | 5,96,373 | Note: Data are provisional.
Source: Respective Financial Institutions. | 3.2. Balance Sheet VI.66 In 2021-22, the consolidated balance sheet of AIFIs’ continued to grow at a double digit rate. This was mainly on account of growth in investments and loans and advances, primarily by NABARD and SIDBI. Loans and advances constituted the largest share in the total assets of AIFIs, followed by investments. On the liabilities side, AIFIs’ borrowings increased steeply followed by moderate growth in bonds and debentures (Table VI.12). The former was mainly due to steep increase in borrowings by SIDBI to facilitate revival and growth of MSMEs. | Table VI.12: AIFIs’ Balance Sheet | | (₹ crore) | | | 2021 | 2022 | Percentage variation | | 2021-22 | | 1 | 2 | 3 | 4 | | 1. Capital | 32,221 | 35,008 | 8.6 | | | (3.0) | (2.9) | | | 2. Reserves | 71,025 | 81,538 | 14.8 | | | (6.6) | (6.7) | | | 3. Bonds & Debentures | 3,27,427 | 3,56,901 | 9.0 | | | (30.4) | (29.2) | | | 4. Deposits | 4,12,001 | 4,36,057 | 5.8 | | | (38.3) | (35.7) | | | 5. Borrowings | 1,70,820 | 2,43,121 | 42.3 | | | (15.9) | (19.9) | | | 6. Other Liabilities | 62,023 | 68,612 | 10.6 | | | (5.8) | (5.6) | | | Total Liabilities / Assets | 10,75,517 | 12,21,236 | 13.5 | | 1. Cash & Bank Balances | 34,595 | 28,379 | -18.0 | | | (3.2) | (2.3) | | | 2. Investments | 79,275 | 1,06,329 | 34.1 | | | (7.4) | (8.7) | | | 3. Loans & Advances | 9,44,318 | 10,69,116 | 13.2 | | | (87.8) | (87.5) | | | 4. Bills Discounted / Rediscounted | 1,410 | 3,058 | 116.9 | | | (0.1) | (0.3) | | | 5. Fixed Assets | 1,273 | 1,268 | -0.4 | | | (0.1) | (0.1) | | | 6. Other Assets | 14,646 | 13,087 | -10.6 | | | (1.4) | (1.1) | | Notes: 1. Figures in parentheses are percentages of total liabilities/assets.
2. Data are provisional.
Source: Respective Financial Institutions. | VI.67 The Reserve Bank announced a number of measures for AIFIs during the COVID-19 pandemic, which included a special refinance facility of ₹75,000 crore in 2020-21. In continuation with the objective of supporting nascent growth, the Reserve Bank extended fresh support of ₹50,000 crore to three AIFIs for new lending in 2021-22. This included a special liquidity facility (SLF) of ₹25,000 crore to NABARD, an SLF of ₹10,000 crore to NHB to support the housing sector and ₹15,000 crore to the SIDBI to meet the funding requirements of micro, small and medium enterprises (MSMEs). NABARD, NHB and SIDBI utilised the full amount under the SLF. Additionally, in order to meet MSMEs’ short and medium-term credit needs, with a special focus on smaller MSMEs and businesses including those in credit deficient and aspirational districts, SIDBI was provided SLF of ₹16,000 crore during 2021-22. VI.68 Total resources mobilised by all AIFIs, except NHB, increased in 2021-22. NABARD mobilised the highest share, followed by SIDBI, EXIM Bank and NHB. NABARD and SIDBI together accounted for 87 per cent of the total resources. AIFIs’ reliance on short-term funds increased in 2021-22 vis-à-vis the previous year. EXIM Bank remains the lone AIFI to raise resources from foreign sources (Table VI.13). | Table VI.13: Resources Mobilised by AIFIs in 2021-22 | | (₹ crore) | | Institution | Total Resources Raised | Total Outstanding | | Long-Term | Short-Term | Foreign Currency | Total | | 1 | 2 | 3 | 4 | 5 | 6 | | EXIM BANK | 0 | 39,123 | 18,302 | 57,425 | 1,07,477 | | NABARD | 1,34,919 | 2,11,051 | 0 | 3,45,970 | 6,29,586 | | NHB | 8,576 | 2,605 | 0 | 11,182 | 65,641 | | SIDBI | 62,780 | 53,211 | 0 | 1,15,991 | 2,14,024 | | Total | 2,06,275 | 3,05,990 | 18,302 | 5,30,567 | 10,16,728 | Note: Long-term rupee resources comprise borrowings by way of bonds/debentures, term loans, PSL deposits of LT nature; while short-term resources comprise CPs, term deposits, ICDs, CDs, SLF from RBI, borrowings from the term money market and ST loans. Foreign currency resources largely comprise of borrowings by issuing of bonds in the international market.
Source: Respective Financial Institutions. | VI.69 NABARD and SIDBI together constituted around 81 per cent of total resources raised by AIFIs from the money market. While resources raised through certificate of deposits increased, commercial paper issuances declined during the year. The utilisation of umbrella limit increased in 2021-22 (Table VI.14). | Table VI.14: Resources Raised by AIFIs from the Money Market | | (At end-March)# | | (₹ crore) | | Instrument | 2020-21 | 2021-22 | | 1 | 2 | 3 | | A. Total | 94,604 | 97,709 | | i) Term Deposits | 3,396 | 5,258 | | ii) Term Money | 3,602 | 1,987 | | iii) Inter-corporate Deposits | - | - | | iv) Certificate of Deposits | 21,275 | 38,170 | | v) Commercial Paper | 66,331 | 52,294 | | Memo: | | | | B. Umbrella Limit^^ | 1,34,662 | 1,32,240 | | C. Utilization of Umbrella limit* (A as percentage of B) | 70.3 | 73.9 | #: End-June for NHB. *: Resources raised under A.
^^: post adoption of accounts by the Board
Note: AIFIs are allowed to mobilise resources within the overall ‘umbrella limit’, which is linked to the net owned funds (NOF) of the FI concerned as per its latest audited balance sheet. The umbrella limit is applicable for five instruments– term deposits; term money borrowings; certificates of deposits (CDs); commercial paper (CPs); and inter-corporate deposits.
Source: Respective Financial Institutions. | 3.3. Sources and Uses of Funds VI.70 Funds raised and deployed by the AIFIs decelerated in 2021-22. Though internal funds remained as the major source, external funds increased sharply. The share of repayment of past borrowings in mobilised resources decreased marginally (Table VI.15). 3.4. Maturity profile and Cost of Borrowings and Lending VI.71 AIFIs, except SIDBI, were able to borrow at lower rates as the weighted average cost (WAC) of rupee resources decreased in 2021-22 vis-à-vis the previous year due to monetary policy support. The weighted average maturity of rupee resources of all AIFIs, except NHB, decreased (Chart VI.39a and b). Long-term prime lending rate (PLR) of EXIM Bank decreased marginally, while it remained stagnant for NHB and SIDBI in 2021-22 (Chart VI.40). 3.5. Financial Performance VI.72 AIFIs registered a marginal decline in income during 2021-22, primarily on account of decline in non-interest income. Interest income, which constitutes around 97 per cent of total income, remained stagnant. Expenditure, on the other hand, increased marginally during 2021-22, mainly on account of increase in interest expenditure and operating expenses. The net profits of AIFIs recorded an impressive growth during 2021-22 (Table VI.16). | Table VI.15: Pattern of AIFIs’ Sources and Deployment of Funds | | (₹ crore) | | Items | 2020-21 | 2021-22 | Percentage variation | | 1 | 2 | 3 | 4 | | A. Sources of Funds (i+ii+iii) | | | | | i. Internal | 43,78,840 | 45,88,852 | 4.8 | | | (82.3) | (78.0) | | | ii. External | 8,82,814 | 12,31,852 | 39.5 | | | (16.6) | (20.9) | | | iii. Others@ | 60,018 | 65,124 | 8.5 | | | (1.1) | (1.1) | | | Total (i+ii+iii) | 53,21,672 | 58,85,828 | 10.6 | | | (100) | (100) | | | B. Deployment of Funds (i+ii+iii) | | | | | i. Fresh Deployment | 8,03,936 | 8,60,062 | 7.0 | | | (15.1) | (14.6) | | | ii. Repayment of Past Borrowings | 31,36,755 | 34,42,379 | 9.7 | | | (59.0) | (58.5) | | | iii. Other Deployment | 13,74,471 | 15,77,707 | 14.8 | | | (25.9) | (26.8) | | | of which: Interest Payments | 39,344 | 39,590 | 0.6 | | | (0.7) | (0.7) | | | Total (i+ii+iii) | 53,15,161 | 58,80,149 | 10.6 | | | (100) | (100) | | @: Includes cash and balances with banks and the Reserve Bank of India
Notes: 1. Figures in parentheses are percentages of total.
2. Data are provisional.
Source: Respective Financial Institutions. |
| Table VI.16: Financial Performance of AIFIs | | (₹ crore) | | | 2020-21 | 2021-22 | Percentage Variation | | 2020-21 | 2021-22 | | 1 | 2 | 3 | 4 | 5 | | A) Income | 59,291 | 59,022 | 1.4 | -0.5 | | a) Interest Income | 57,597 | 57,543 | 1.3 | -0.1 | | | (97.1) | (97.5) | | | | b) Non-Interest Income | 1,694 | 1,479 | 6.1 | -12.7 | | | (2.9) | (2.5) | | | | B) Expenditure | 42,913 | 43,671 | -3.6 | 1.8 | | a) Interest Expenditure | 39,829 | 40,280 | -3.4 | 1.1 | | | (92.8) | (92.2) | | | | b) Operating Expenses | 3,084 | 3,390 | -5.5 | 9.9 | | | (7.2) | (7.8) | | | | of which Wage Bill | 2,203 | 2,270 | -5.2 | 3.0 | | C) Provisions for Taxation | 2,409 | 4,064 | 7.4 | 68.7 | | D) Profit | | | | | | Operating Profit (PBT) | 16,378 | 15,351 | 17.3 | -6.3 | | Net Profit (PAT) | 7,635 | 9,698 | 17.6 | 27.0 | Notes: 1. Figures in parentheses are percentages of total income/expenditure.
2. Data are provisional.
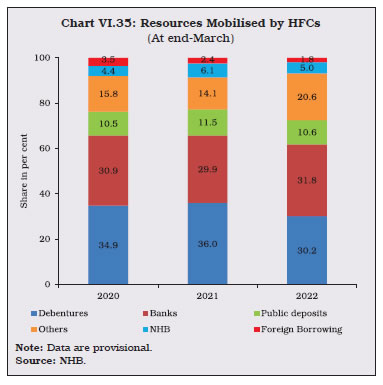
Source: Respective Financial Institutions. | VI.73 The financial ratios of AIFIs reveal that operating profit as a ratio of total average assets declined during 2021-22, whereas net profit increased slightly during the year. However, all other financial ratios, decreased year on year (Chart VI.41). VI.74 During 2021-22, interest income as a ratio of average working funds declined for all AIFIs which may be attributed to the low interest rate environment. Operating profits as a ratio of average working funds improved for EXIM Bank and NHB indicating efficient utilization of working funds; however, for SIDBI and NABARD, it decreased during the year (Table VI.17). VI.75 The RoA for all AIFIs improved marginally in 2021-22, except for SIDBI (Chart VI.42). AIFIs continued to maintain CRAR above the regulatory requirement, which indicates a comfortable capital position. The CRAR for EXIM Bank and NHB improved in 2021-22, while that of NABARD and SIDBI moderated.
| Table VI.17: AIFIs’ Select Financial Parameters | | | Interest Income/Average Working Funds (per cent) | Non-interest Income/Average Working Funds (per cent) | Operating Profit/Average Working Funds (per cent) | Net Profit per Employee (₹ lakh) | | 2021 | 2022 | 2021 | 2022 | 2021 | 2022 | 2021 | 2022 | | 1 | 2 | 3 | 4 | 5 | 6 | 7 | 8 | 9 | | EXIM | 6.4 | 6.3 | 0.5 | 0.3 | 2.3 | 2.5 | 73 | 216 | | NABARD | 6.1 | 5.5 | 0.0 | 0.0 | 1.5 | 1.2 | 127 | 160 | | NHB | 5.5 | 5.1 | 0.1 | 0.6 | 1.3 | 1.9 | 436 | 1192 | | SIDBI | 5.7 | 4.3 | 0.5 | 0.2 | 2.3 | 1.3 | 237 | 199 | Note: Data are provisional.
Source: Respective Financial Institutions. | 3.6. Soundness Indicators VI.76 The net NPAs (NNPA) ratios of all AIFIs decreased during 2021-22. All AIFIs except SIDBI reported zero per cent NNPAs on account of full provisioning for NPA (Chart VI.43). VI.77 Overall, the proportion of standard assets increased while that of doubtful assets declined. This indicates an improvement in asset quality (Chart VI.44). VI.78 As AIFIs play a critical role in facilitating credit to important sectors of the economy with significant backward and forward linkages, it is imperative to ensure the financial resilience of these institutions. To this end, the Reserve Bank released the draft Master Direction on Prudential Regulation for AIFIs on October 22, 2021 in order to extend the Basel III capital framework to the AIFIs.
4. Primary Dealers VI.79 As on March 31, 2022 there were 21 primary dealers (PDs), of which 14 function as bank departments and 7 as Standalone PDs (SPDs). The latter are registered as NBFCs under Section 45-IA of the RBI Act, 1934. 4.1. Operations and Performance of PDs12 VI.80 PDs are financial intermediaries mandated to take part in the all-round development of the primary and secondary government securities market, underwrite issuances of government dated securities and participate in primary auctions. They are also mandated to achieve a minimum success ratio (bids accepted as a proportion of bidding commitment) of 40 per cent in primary auctions of T-bills and Cash Management Bills (CMBs), assessed on a half-yearly basis. In 2021-22, all PDs achieved more than their minimum bidding commitments and subscribed to 76.9 per cent of the total quantum of T-Bills issued during the year, as compared with 68.9 per cent in 2020-21. The actual quantum of bids accepted from PDs was, however, less than in the previous year. During H1:2022-23, PDs subscribed to 69.3 per cent of the total quantum of T-Bills issued. PDs’ share of allotment in the primary issuance of dated securities decreased in 2021-22 vis-à-vis the previous year, but increased during H1:2022-23 (Table VI.18). VI.81 Partial devolvement on PDs took place on 17 instances amounting to ₹97,938 crore during 2021-22 as against 15 instances amounting to ₹1,30,562 crore in the previous year. During H1:2022-23, there were 7 instances of partial devolvement on PDs aggregating to ₹14,799 crore. While the total underwriting commission paid to PDs decreased from ₹455 crore in 2020-21 to ₹413 crore in 2021-22, the average rate of underwriting commission increased in the same period (Chart VI.45). In 2022-23 (up to end-September), the underwriting commission paid to the PDs was ₹88 crore. | Table VI.18: Performance of PDs in the Primary Market | | (₹ crore) | | Items | 2020-21 | 2021-22 | H1:2022-23 | | 1 | 2 | 3 | 4 | | Treasury Bills and CMBs | | | | | (a) Bidding commitment | 17,35,783 | 15,37,735 | 8,07,225 | | (b) Actual bids submitted | 49,05,302 | 37,21,906 | 18,00,182 | | (c) Bids accepted | 10,24,732 | 9,59,380 | 4,88,867 | | (d) Success ratio (c) / (a) (in Per cent) | 59.0 | 62.4 | 60.6 | | (e) Share of PDs in total allotment (in Per cent) | 68.9 | 76.9 | 69.3 | | Central Government Dated Securities | | | | | (f) Notified amount | 12,85,000 | 10,80,000 | 8,12,000 | | (g) Actual bids submitted | 24,54,253 | 22,22,924 | 14,13,444 | | (h) Bids accepted | 6,80,763 | 5,33,201 | 4,38,580 | | (i) Share of PDs (h)/(f) (in per cent) | 49.7* | 47.3** | 55.1*** | * Calculated with respect to the total accepted amount of ₹13,70,324 crore.
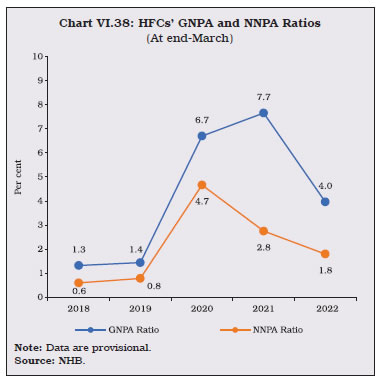
** Calculated with respect to the total accepted amount of ₹11,27,382 crore.
*** Calculated with respect to the total accepted amount of ₹7,96,000 crore.
Source: Returns filed by PDs. | VI.82 In the secondary market, all PDs individually achieved the required minimum annual total turnover ratio. In Government dated securities, the minimum turnover ratio is set at 5 times for repo and outright taken together and 3 times for outright transactions of the average month-end stock of securities held by them. For T-Bills, the corresponding minimum targets are set at 10 times and 6 times respectively. 4.2. Performance of Standalone PDs13 VI.83 In the secondary market outright segment, the turnover of SPDs increased during 2021-22 as compared with the previous year, notwithstanding a decrease in the overall market turnover during the same period. In the repo segment, the turnover by SPDs increased over the previous year. The share of SPDs in total market turnover increased marginally during the year (Table VI.19). 4.3. Sources and Application of SPDs’ Funds VI.84 Funds mobilized by SPDs rose on a year-on-year basis in 2021-22. Borrowings remained the major source of their funding. The total quantum of secured and unsecured loans increased during this period. The largest share of their investments was held in the form of current assets (Table VI.20). 4.4. Financial Performance of SPDs VI.85 SPDs recorded a substantial decrease in profit after tax in 2021-22 vis-a-vis the previous year on account of decrease in trading profit and a marginal decrease in the interest and discount income (Table VI.21 and Appendix Table VI.8). Consequently, SPDs’ return on net worth also decreased during the year (Table VI 22). | Table VI.19: Performance of SPDs in the G-secs Secondary Market | | (₹ crore) | | Items | 2020-21 | 2021-22 | H1:2022-23 | | 1 | 2 | 3 | 4 | | Outright | | | | | Turnover of SPDs | 24,71,523 | 25,91,788 | 18,09,980 | | Market turnover | 1,00,32,187 | 87,98,428 | 53,35,981 | | Share of SPDs (Per cent) | 24.6 | 29.5 | 33.9 | | Repo | | | | | Turnover of SPDs | 90,75,360 | 95,60,700 | 57,89,793 | | Market turnover | 2,27,70,547 | 2,55,25,641 | 1,59,61,220 | | Share of SPDs (Per cent) | 39.9 | 37.5 | 36.3 | | Total (Outright + Repo) | | | | | Turnover of SPDs | 1,15,46,883 | 1,21,52,488 | 75,99,774 | | Market turnover | 3,28,02,734 | 3,43,24,069 | 2,12,97,200 | | Share of SPDs (Per cent) | 35.2 | 35.4 | 35.7 | Note: Total Turnover for Market Participants / Standalone PDs includes Outright and Repo 1st Leg settlement volumes.
Source: Clearing Corporation of India Ltd. |
| Table VI.20: Sources and Applications of SPDs’ Funds | | (₹ crore) | | Items | 2020-21 | 2021-22 | H1: 2022-23 | Percentage Variation | | 2021-22 over 2020-21 | | 1 | 2 | 3 | 4 | 5 | | Sources of Funds | 71,986 | 86,669 | 79,157 | 20.4 | | 1. Capital | 1,849 | 1,849 | 1849 | 0.0 | | 2. Reserves and surplus | 7,011 | 7,425 | 7,199 | 5.9 | | 3. Loans (a+b) | 63,127 | 77,394 | 70,109 | 22.6 | | (a) Secured | 50,374 | 61,188 | 55,262 | 21.5 | | (b) Unsecured | 12,752 | 16,207 | 14,847 | 27.1 | | Application of Funds | 71,986 | 86,669 | 79,157 | 20.4 | | 1. Fixed assets | 44 | 71 | 82 | 58.8 | | 2. HTM investments (a+b) | 154 | 2,870 | 5,704 | 1767.2 | | (a) Government securities | 0 | 2,688 | 5,522 | 0.0 | | (b) Others | 154 | 182 | 182 | 18.7 | | 3. Current assets | 72,389 | 80,841 | 75,836 | 11.7 | | 4. Loans and advances | 1,986 | 7,048 | 4,861 | 254.8 | | 5. Current liabilities | 2,616 | 4,118 | 7,280 | 57.4 | | 6. Deferred tax | 33 | -35 | -38 | -206.7 | | 7. Others | -3 | -8 | -8 | 153.1 | | Source: Returns submitted by PDs. |
| Table VI.21: Financial Performance of SPDs | | (₹ crore) | | Items | 2020-21 | 2021-22 | H1: 2022-23 | Percentage Variation | | 2021-22 over 2020-21 | | 1 | 2 | 3 | 4 | 5 | | A. Income (i to iii) | 5,386 | 4,002 | 2,055 | -25.7 | | (i) Interest and discount | 4,173 | 4,139 | 2441 | -0.8 | | (ii) Trading profits | 1,008 | -244 | -396 | -124.2 | | (iii) Other income | 205 | 107 | 10 | -47.9 | | B. Expenses (i to ii) | 2,493 | 2,622 | 1995 | 5.1 | | (i) Interest | 2,130 | 2,238 | 1794 | 5.1 | | (ii) Other expenses# | 364 | 384 | 201 | 5.5 | | C. Profit before tax | 2,582 | 1,253 | 153 | -51.4 | | D. Profit after tax | 1,938 | 937 | 102 | -51.6 | #: Includes establishment and administrative costs
Note: Figures may not add up due to rounding-off.
Source: Returns submitted by PDs. |
| Table VI.22: SPDs’ Financial Indicators | | (₹ crore) | | Indicators | 2020-21 | 2021-22 | H1: 2022-23 | | 1 | 2 | 3 | 4 | | (i) Net profit | 1,938 | 937 | 102 | | (ii) Average assets | 77,357 | 79,085 | 91,155 | | (iii) Return on average assets (Per cent) | 2.6 | 1.2 | 0.1 | | (iv) Return on net worth (Per cent) | 26.0 | 11.6 | 0.9 | | (v) Cost to income ratio (Per cent) | 11.2 | 21.8 | 76.8 | | Source: Returns submitted by PDs | VI.86 The combined CRAR for all SPDs increased in 2021-22 and remained above the mandated 15 per cent, largely on account of improvement in capital buffers. During H1:2022-23, the combined CRAR however, decreased primarily due to increase in their risk weighted assets (Chart VI.46 and Appendix Table VI.9). 5. Overall Assessment VI.87 NBFIs exhibited remarkable resilience in the face of the COVID-19 shock. During 2021-22, their operations gained traction notwithstanding the divergent speed of recovery in different sectors of the economy and cash flow disruptions faced by borrowers. Strong capital buffers and adequate provisioning in this unsettling environment are reassuring. The asset quality of NBFCs is expected to further improve in the near term, aided by strengthening economic activity. Sharper regulatory oversight, realignment in asset quality classification and prompt corrective action norms will further entrench stability. VI.88 NBFCs need to be mindful of the rising interest rate cycle and persisting uncertainties due to global shocks. They also face intensifying competition from banks, particularly in segments that were NBFC strongholds like vehicle and gold loans. The fast growing digital lending ecosystem poses novel challenges, and regulated entities need to be cautious about unethical recovery practices and data privacy issues. These entities also need to strengthen their oversight of outsourced activities to prevent undue harassment of their customers by third party applications. The Reserve Bank, on its part, has endeavoured to address these issues proactively and has provided timely regulatory guidance. VI.89 HFCs came out of the pandemic with moderate expansion in their balance sheet. HFCs, however, have been increasingly facing competition from SCBs which have access to funds at cheaper rates. AIFIs growth has been impressive, with improvement in disbursements and rise in profitability. PDs achieved the minimum success ratio and fulfilled the minimum bidding commitments in primary market and turnover ratio in the secondary market, thus aiding in borrowing programme of the Government. With robust pick-up in bank credit raising demand on the available pool of resources in the economy, and ongoing global spill-overs on the domestic financial system and markets, the role of PDs in ensuring orderly conditions in the market would be critical.
|