Press Release RBI Working Paper Series No. 02 Drivers of Commercial Paper Rate Spread - An Empirical Assessment Priyanka Priyadarshini, Anshul, Srijashree Sardar, Dipak R. Chaudhari and Sangeeta Das@ Abstract 1The commercial paper (CP) market provides an avenue for creditworthy firms to raise short-term loans to meet cash flow requirements without providing any collateral. The paper aims to empirically estimate the determinants of the CP rate spread over the T-Bill rate using daily data. The empirical analysis indicates that the volume of CP issuance, liquidity conditions, market risk, share of mutual funds in CP investment and share of NBFCs in the CP issuances impact the CP spread. Episodes of Initial Public Offering (IPO) raise the CP spread. JEL Classification: G12, G15, G38 Keywords: Commercial paper, GARCH, money market, market liquidity Introduction During COVID-19, commercial paper (CP) issuances increased, as corporates and financial firms attempted to raise short-term liquidity. CP is an unsecured money market instrument, issued in the form of a promissory note, tapped by corporates, financial and non-financial institutions, and firms to meet their short-term financing needs. Individuals, banks, corporate bodies and foreign investors can invest in CPs subject to the prescribed regulatory limit. Over the years, various policy measures taken by the Reserve Bank of India (RBI) have resulted in an expansion of the CP market in India (Annex - Table A1). For corporates, raising funds through CPs has various advantages – a) CP is an uncollateralised instrument, which enables firms to quickly raise short-term funds for their working capital requirements; b) for firms with high credit ratings, CP issuance acts as a source of low-cost funding; and c) CPs also help to diversify funding sources and enhance financial flexibility (Kahl et al., 2008). For investors, CPs have low default risk with comparatively higher returns than other secured instruments, such as bank deposits. The discount rates offered by the issuers on the CPs represents the return to the investors. On the flip side, CPs are less liquid than other money market instruments with low retail participation. Further, CP issuances indicate a seasonal pattern, correlated with financial cycles and liquidity conditions prevailing in the market. Also, small and low-rated firms often find it difficult to raise funds in the CP market as about 99 per cent of CPs are issued by top-rated companies. Similarly, retail investors find it difficult to access the CP market due to limited investor base and liquidity risk. CP discount rates for similar rated companies can differ substantially, which indicates an asymmetry in pricing in the CP market. This leads to the question of what drives the CP discount rates. The differences in cross-country CP market structures and concentration in primary market make it difficult to find the possible drivers for CP discount rates (Huang, Liu & Shi, 2020). In India, an earlier attempt has been made by Ghosh & Pradhan (2008) and Sing & Raja (2015) to understand the determinants of WADR (weighted average discount rate) of CP. However, the CP market dynamics have changed over the time, particularly since COVID-19. Moreover, the existing estimates based on monthly data may not provide an accurate picture of the trends observed in daily data. Against this backdrop, the paper empirically estimates the determinants of the CP spread over the treasury bill (T-Bill) rate. This is perhaps the first attempt using daily frequency data, which provides an in-depth analysis of CP market without any loss of underlying information. The paper also assesses why despite having similar credit rating and tenor, the CP rates differ across firms. The rest of the paper is divided into four sections. Section II presents cross-country experiences; Section III provides stylised facts related to the CP market in India. Section IV undertakes the empirical estimation and Section V concludes the study with policy recommendations. II. Cross-Country Experiences At the beginning of the 1980s, issuance of CPs was limited to entities in the United States, Canada and Australia (Ghosh & Pradhan, 2008). However, the later years witnessed the opening of CP markets in several other countries and the establishment of a market for Euro-commercial paper. Although the US market has been the model for these new markets, there are many significant differences in these markets when compared with the US CP market (Huang et al., 2020). In the US, CPs are exempted from registration if the maturity of CP is less than 270 days; however, in practice, 1 to 7-day CPs constitute a major portion of the CP market (Anderson & Gascon, 2009). In case of shorter maturity also, 1-day CP issuance is dominant as CPs are mainly used for funding day-to-day cash requirements. Large holders of US CPs include non-financial corporations, life insurance companies and pension funds. Proceeds from CP issuance are used to finance “current transactions,” including meeting payroll obligations and funding current assets, such as managing receivables or inventories (Anderson & Gascon, 2009). Due to the heterogeneous characteristics of CP and shorter maturity period, the secondary market in CP in the US is modest (Ghosh & Pradhan, 2008). Although, rating is not compulsory in the US for CP issuances, CPs are usually rated to attract investors. A major characteristic of the US CP market is the Asset-Backed Commercial Paper (ABCP) which accounted for 21 per cent of the total US CP market in June 2020 (Baklanova et al., 2020). The ABCP is a type of CP that is collateralised by financial assets, typically issued by a non-bank financial institution through special purpose vehicles (SPVs) (Anderson & Gascon, 2009). The ABCPs provide an avenue for smaller and less creditworthy firms to access the CP market. The US CP market experienced a peak during 2007 with outstanding issuance reaching USD 2.1 trillion (Baklanova et al., 2020). However, after the global financial crisis (GFC), the CP market in the US declined substantially. The biggest change since the GFC is the sharp fall in the issuance of ABCP (Chart 1), mainly on account of the reduction in domestic firms’ issuances, as foreign issuers captured a larger share of the market. At end-December 2023, the US CP market size was about USD1.2 trillion. The Euro Commercial Paper (ECP) market emerged in 1985 as an offshoot of underwritten Note Issuance Facilities (NIFs) and was characterised by US dollar-based uncommitted programmes. The ECP market has been developed as a multi-currency short-term market. The ECPs are denominated in a currency which is different from the domestic currency of the market where the papers are issued. Further, ECP consists of several different markets within the European countries, each with their own legal frameworks, post-trade structures and participants. The European Central Bank’s ECP purchase programme boosted the ECP market during the COVID-19 period2. In the European market, issuers can be divided into four categories: a) financial institutions, including banks, b) sovereign and supranational agencies (SSA), c) non-financial corporates (NFCs), and d) asset backed conduits (ABCP) (Hill, 2021). For all these entities, CPs provide a flexible means to manage short-term funding, working capital requirements, or outflows. Furthermore, for corporate issuers, CPs provide an alternative to drawing on bank credit lines. Thus, CPs attract a broad and diverse investor base, including pension funds, insurance funds, SSAs3 and corporates (Annex - Table A2). In China, CPs were introduced in 2005 (Huang et al., 2020). CPs are issued at a discount and traded in the interbank market and are mainly used by non-financial companies to meet their short-term requirements. As the CPs are traded in the interbank market, these can be seen as an exact replica of corporate bonds for short maturity (Huang et al., 2020). Similar to Indian CP market, the Chinese CP issuers are mandated to get two ratings from different rating agencies with at least one rating being AA or above (Amstad & He, 2019). Globally, in March 2020, when COVID-19 disrupted financial markets, investors became risk-averse and traded in liquid and secured assets, such as government securities. As a result, money market funds experienced massive outflows on a global scale known as ‘dash for cash’ (more accurately described as a ‘dash for liquidity’). This was not a credit flight to quality, but a flight to liquidity (Boyarchenko et al, 2022). This reduction in the availability of credit coincided with increase in yield spread even for the highest rated issuers across the maturity spectrum. During this period, India too experienced large sell-offs in the domestic equity, bond and forex markets. With the intensification of redemption pressures, liquidity premia on CPs surged, manifesting in higher rates for shorter tenor than the longer ones. Combined with the thinning of trading activity with the pandemic outbreak, CP spread over T-Bill rates spiked (Charts 2a and 2b). III. Stylised Facts: Indian Scenario In India, as per the existing framework, CP issuance is regulated by the RBI and operational guidelines are provided by Fixed Income Money Market and Derivatives Association of India (FIMMDA). CP being an unsecured debt instrument, issued in dematerialised form and considering state-wise differences in stamp duty structures applicable for primary issuances of CPs, the issuing and paying agent (IPA) plays a vital role (Annex Table A3). As per FIMMDA guidelines, only scheduled commercial banks can act as IPAs. The IPAs ensure that the guidelines prescribed are followed diligently by issuers and investor protection is not compromised in any manner. Chart 3 provide a synoptic view of major players in CP market in India. 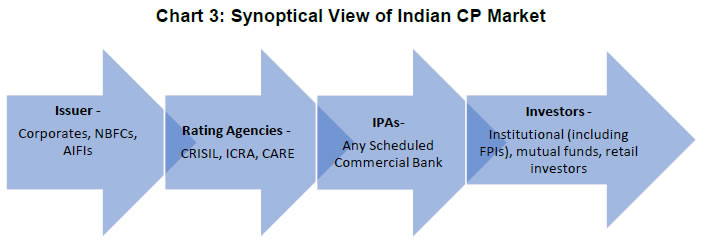 In the recent period, particularly after COVID-19, when market was in surplus liquidity, there was an increase in CP issuances. Further, CP issuances also spiked during the initial public offering (IPO) period, as CPs are an important source for IPO funding. Thus, during July and November 2021, when majority IPOs were issued, the CP issuance for ultra-short-term tenor (7-10) days increased substantially. CP issuance, in general, is also cyclical, as there is a general increase in the issuance around financial year end coinciding with the business cycle (Calomiris et al., 1994). Further, the WADR of CPs increased from April 2022, which coincided with interest rate increase in other segments following rate hikes by the RBI. III.1. Liquidity Conditions and WADR Gatev & Philop (2003) observed that during periods of liquidity deficit, CP rates increase and market spreads widen. The converse happens during periods of surplus liquidity. During the study period, WADR of CPs generally moved in tandem with the liquidity conditions in the banking system, while some spikes in WADR were due to factors such as CP issuances for IPO funding (Chart 4). During this period, the spread between WADR and T-Bill as well as between WADR and Weighted Average Call Rate (WACR) – the policy target rate - remained range-bound (Chart 5).
A calibrated withdrawal of surplus liquidity by the RBI resulted in a concomitant increase in the inter-bank and T-Bill rates along with a rise in CP rates. III.2. Tenor and WADR As with any financial instrument, CP rates rise as the tenor increases reflecting term premia for higher maturities (Chart 6). Following policy rate hikes by the RBI during May 2022 to February 2023, CP rates rose with a relatively sharper increase in rates with shorter duration as compared to those with longer duration. In November 2021, WADR in the shorter tenor of 7-30 days rose sharply to 5.4 per cent, higher than other longer tenors primarily due to high demand by NBFCs for IPO financing. Since March 2023, the term premia in the CP market have decreased. 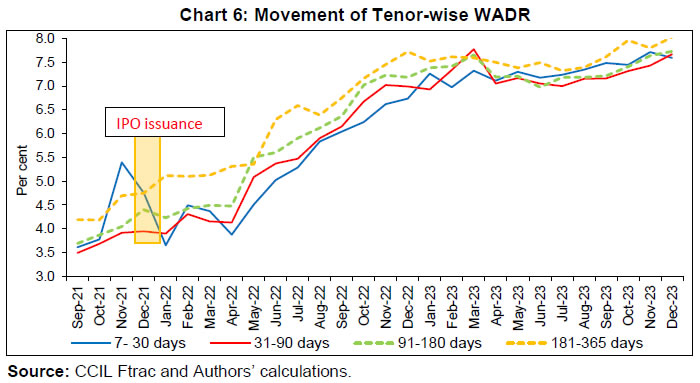 The tenor-wise distribution of CP issuances under three categories - up to 91 days, 92-180 days and 181-365 days indicates dominance of issuances up to 91-days with an average share of 84 per cent (Chart 7). The average share of 92-180 days and 181-365 days was around 6 per cent and 10 per cent, respectively. Further, within the 91-days tenor, the share of CPs with ultra-short-term tenor (7-10) days peaked at 68 per cent in July 2021 as NBFCs raised resources for IPO financing during this time. Higher share in the shorter tenor (up to 91 days) as compared to longer tenors indicates that the CP market served as an important source of funding for meeting short-term funding requirements. The dominant share of shorter duration CP issuances also implied that most investors, such as mutual funds preferred lower tenor options for investment. III.3. Issuers and WADR From the issuer side, there can be a shift in demand from short-term to long-term borrowings which may decrease the demand for CPs and vice versa. Similarly, a decrease in bank lending rates may decrease demand for CPs. For the investors, liquidity and credit risk along with reputation and corporate governance in firms can be factors determining the CP rates. The issuer profile of CPs showed that corporates were the largest issuers, constituting an average of 47 per cent of the total issuances during April 2020 to December 2023, followed by NBFCs with a share of 30 per cent, public finance institutions at 7 per cent, housing finance companies (HFCs) at 7 per cent, and limited liability partnerships (LLPs) at 4 per cent (Chart 8). The share of corporates has remained broadly range-bound. On the other hand, the share of NBFCs increased to 49 per cent in Q3:2021 from 15 per cent in Q2:2020. 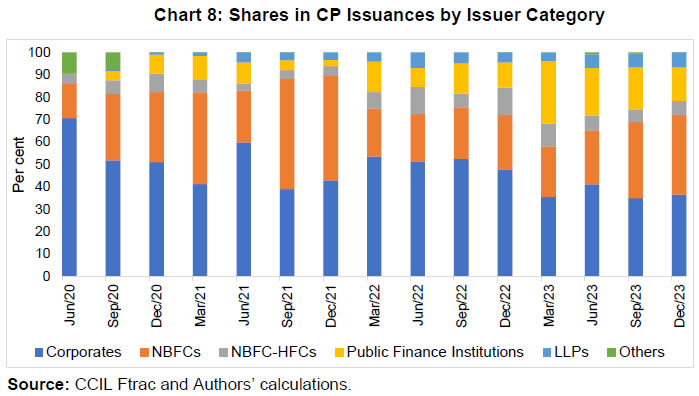 A comparison of WADR across issuer categories also indicated that in recent times, WADR of CPs issued by NBFCs and HFCs were higher than corporates and LLPs. The WADR of CPs issued by public finance institutions were lower than other issuer categories throughout the period under consideration. The differences in risk perceptions of issuers might have resulted in the variation of WADR across issuer categories. Further, the WADR rose after May 2022 across issuer categories, reflecting hikes in policy rates. Also, the WADR spreads between different issuer categories decreased from 186 basis points in May 2020 to 48 basis points in October 2022 and thereafter remained range-bound (Chart 9). III.4. Investor Profile and WADR Investors are attracted towards the CP market mainly because it provides an opportunity to invest on a short-term basis for higher returns. An analysis of the category-wise shares of investors in the CP market shows that the share of mutual funds has been the highest throughout the study period, with an average share of 82 per cent (Chart 10). Furthermore, the share of mutual funds increased from 69 per cent in April-June 2020 to peak at 86 per cent during July-September 2021. The next in line were public sector (PSU) banks with an average share of 7 per cent followed by private sector banks and NBFCs, at an average share of 3 per cent and 2 per cent, respectively during the study period (Chart 10). As CPs are issued mainly over the counter (OTC) and then get listed in exchanges, the WADRs are negotiated by the IPAs and institutional investors. A comparison of investors indicated that the WADR for mutual funds was relatively low (Chart 11). The minimum discount rate of CP issuances is expected to remain closer to the T-Bill rate of similar tenor (adjusting for risk premia) for issuers of highest credit rating. The spread between the minimum and maximum rate of CPs can be due to credit rationing on the part of investors for different categories of issuers as well as for different ratings of issuers within a category. III.5. Credit Ratings and WADR As per the RBI guidelines, all eligible participants should obtain minimum ‘A3’ credit rating as per rating symbol and definition prescribed by Securities and Exchange Board of India (SEBI) for their respective CP issuances4. As per operational guidelines issued by Fixed Income Money Market and Derivatives Association of India (FIMMDA), dated March 31, 2020, if the CP issue has been rated by more than one rating agency, then (i) where the ratings are different, the lower of the two ratings along with the amount specified against the rating should be adopted; (ii) where the ratings are the same but the amounts are different, the rating with the lower amount should be adopted. The four accredited credit rating agencies are: Credit Rating Information Services of India Limited (CRISIL), Investment Information and Credit Rating Agency of India Limited (ICRA), Credit Analysis and Research (CARE), India Ratings and Research (Ind-Ra) and Brickwork Ratings (BWR). | Table 1: Composition of CPs by Credit Rating | | Credit Rating | 2020 | 2021 | 2022 | 2023 | | A1+ | 99.85 | 99.85 | 96.64 | 92.95 | | A1 | 0.12 | 0.10 | 1.54 | 2.97 | | A2+ | 0.00 | 0.01 | 0.07 | 0.12 | | A2 | 0.01 | 0.03 | 0.26 | 0.58 | | A3+ | 0.01 | 0.01 | 0.68 | 1.72 | | A3 | 0.01 | 0.01 | 0.80 | 1.66 | | A4+ | 0.01 | 0.00 | 0.01 | 0.00 | | Source: CCIL Ftrac and Authors’ calculations. |
Among the rating agencies, CRISIL dominates with 44 per cent share, ICRA at 36 per cent, IND at 10 per cent and CARE at 9 per cent (Chart 12). Almost all borrowers in the CP market were A1+ during the last four years (Table 1). As with any other debt instrument, it is expected that lower CP rates will be associated with higher credit ratings. Here, we have analysed the short-term ratings (up to 91 days) which reflect the fundamental quality of issues, as 97 per cent of borrowers were rated as A1+. Even within a single rating category, CP issuers have a large variation in the total volume over the years. Further, the share of issuances for different issuers have also shown variations over the last four years, although corporates have remained the dominant player (Chart 13). Rating-wise, the WADRs for the highest-rated i.e. A1+ issues, as expected, were the lowest and less volatile than others, while for the lower rated CPs, the WADRs were higher and more volatile (Chart 14). However, there is a variation among the WADRs of CPs issued by different issuers over time. The WADRs for two major issuers in the CP market, i.e., corporates and NBFCs show significant movement over the recent years (Chart 15). The WADRs for A2/A2+ rated corporates witnessed a sharp decline in 2021, while the WADR for similar-rated NBFCs declined gradually during these four years. As the CPs are issued for tenor mentioned in the credit rating letter, investors are secured against possible changes in credit risk during the issuance period. However, it has been observed that firms with similar ratings raise CPs with different rates, which indicates that there is a scope for improvement in CP ratings (Srinivasan, 2019). III.6. Secondary Market CP Rates – NBFCs v/s other Companies Like most other economies including the US, the secondary CP market in India is modest mainly due to heterogeneous nature of CPs with dominance of shorter maturity issuances. However, the secondary market trading takes place through inter-bank broking between institutional participants. The trade settlement takes place on T+0 or T+1 day basis and settled through the clearing corporation of any recognised stock exchange or any other mechanism approved by the RBI5. It has been observed that the WADR of 3-month CPs, both for NBFCs and other companies (non-NBFCs) in the secondary market increased gradually during the period under the study in line with the increase in policy rate and other interest rates. However, the WADRs were relatively volatile during the period from February to May 2021 (Chart 16). Since October 2021, the 3-month CP rate for NBFCs traded above the CP rates of non-NBFCs following the general trend. Furthermore, the risk premium i.e., spread between 3-month CP rate of NBFCs over the 3-month T-Bill rate was stable except during the second wave of COVID-19 (February-May 2021) (Chart 17). The same trend is visible in the risk premium for CP rate for non-NBFCs and the T-Bill rate. IV. Data and Empirical Analysis The existing literature suggests that market liquidity condition is the main driver of CP rate spread, while the other determinants could be credit risk and bid-ask spread (Covitz et al., 2013; Huang et al., 2020a). However, another strand in the literature suggests that considering liquidity conditions as the only determinants of CP rates could be misleading (Covitz and Downing, 2007). In the case of India, Index of Industrial Production (IIP), amount of CP issuance, call money rate and bank credit have been observed as determinants of the WADR in CP market, using monthly data from April 2002 to September 2007 (Ghosh and Pradhan, 2008). Taking cues from the literature, we model our empirical exercise. IV.1. Data In order to find the determinants of WADR in the Indian CP market, we use the spread between WADR up to 3-months (91-days) CP and 3-months T-Bill rate as the dependent variable. The rationale behind taking the 91-days tenor is its dominant share in the overall CP issuance during the study period, as noted earlier. We use daily data of the select variables from April 1, 2020 to October 31, 2023. The select independent variables include: 1. Index of Industrial Production (IIP); 2. Volume of daily CP issuance of up to 91 days; 3. Marginal Cost of Lending Rate (MCLR); 4. Share of Mutual funds in 91 days CP investment; 5. Share of NBFCs in 91 days CP issuance; 6. Volatility Index (VIX) an indicator for market sentiment; 7. 1-month overnight indexed swap (OIS) for market expectations for interest rate; 8. Net LAF to capture the prevailing liquidity conditions in the money market; 9. Dummy variable to capture IPO issuance effect on CP spread. The descriptive statistics and correlation among the variables are given in Annex Tables A4 and A6. Data on MCLR, and IIP, being lower frequency (weekly /monthly) have been repeated for the daily exercise. Further, all other variables except MCLR, are found to be stationarity at level (Annex Table A5). Calomiris et al. (1994) have found that CP issuance and economic activities have a close correlation and higher inventories tend to increase the CP issuances. IIP growth indicates higher production activity, and therefore higher demand for operational borrowing (Singh and Raja, 2014) by corporates possibly leading to an increase in CP spread. MCLR is a major benchmark for bank lending. Therefore, MCLR and CP spread may share a positive and contemporaneous relationship (Table 2). Regarding the relationship between CP issuance and the CP rates, there is an ambiguity in the existing literature. Ghosh and Pradhan (2008) observed no relationship between CP issued and the CP rates at level and negative relationship while differencing the data. Under normal liquidity conditions, we expect a positive relationship between CP issuance and the CP discount rates, as higher issuances lead to excess supply and investors may seek higher returns. However, in periods of excess liquidity, this relationship may weaken and an increase in CP issuances may not necessarily lead to an increase in CP rates. WADR for mutual funds is relatively lower when compared with that of other investors. As a result, a larger share of mutual funds in the CP market could result in a lower WADR further leading to a decline in spread. From the issuer side, NBFCs tend to issue CPs at higher rates vis-à-vis others, paying risk premia due to their higher risk perception and limited alternative sources of funds. To capture the impact of liquidity, we have assigned a dummy for net liquidity adjustment (LAF) variable. LAF is a liquidity management framework provided by the RBI for banks to avail liquidity in case of any requirement and for parking excess funds. A positive net LAF indicates central bank injection, while a negative net position shows absorption of liquidity by central bank6. The dummy for negative net LAF indicating surplus liquidity, has been assigned a value 1, otherwise 0. We expect the CP spread to decrease when there is surplus liquidity. With respect to OIS, we expect a positive relationship, as market expectations about higher interest rates would drive the CP issuers to offer a higher return leading to an increase in the WADR and spread. Finally, the market risk indicator i.e., VIX, could also have a positive relationship because during a period of uncertainty when market volatility is high, investors might prefer to invest in safe haven assets, such as treasury bills. This could cause an increase in demand for treasury bills, a decline in their yield and an upward movement in the CP spread. | Table 2: Variables and Their Expected Signs | | Variable | Notation used | Frequency | Expected sign | Source | | Volume of CP issuance in the 91 day (in lakh crores) | CP_VOL | daily | + | CCIL | | MCLR; lending rate based on marginal cost of funds | MCLR | weekly | + | RBI | | Share of Mutual funds in 91 days CP investment | MTLFNDS | daily | - | CCIL | | Share of NBFC in 91 days CP issuance | NBFCS | daily | + | CCIL | | IIP (level); tracks manufacturing activity in the economy | IIP | monthly | + | MOSPI | | OIS rate (1 month tenor) | OIS | Daily | + | Bloomberg | | VIX; tracks market risk | VIX | Daily | + | NSE | | IPO dummy; during the IPO period the value will be 1 otherwise 0 | IPO | dummy variable | + | SEBI, authors estimation | | Liquidity dummy; 1 for surplus (-ve) net LAF position otherwise 0. | Liquidity | dummy variable | - | RBI, authors estimation | | Source: Authors’ calculations. | IV.2. Empirical Analysis The daily data exhibited the phenomenon of volatility clustering - bouts of intense volatility followed by periods of calm. Therefore, GARCH (Generalised Autoregressive Conditional Heteroskedasticity) model would be appropriate which considers error variance, where variance follows an autoregressive (AR) process. As per the GARCH (1,1) framework developed by Baillie and Bollerslev (1989), we estimate the spread (3-month CP and 3-month T-Bill spread) using the following mean equation: It indicates that the spread at time “t” (spreadt) is dependent on its own lag, CP issuances volume (CP_VOL), marginal cost of funds-based lending rate (MCLR), investment share of mutual funds (MTLFNDS), share of NBFCs in total issuances (NBFCs), IIP growth, IPO issuance episodes, prevailing liquidity conditions and the error term (εt). Further, the εt is dependent on some lagged information (Ω−1) and it followed a normal distribution with zero mean and its variance (ht). Here, the variance equation can be written as: The estimation results (Table 3) indicate that all our variables except MCLR and IIP have statistically significant coefficients. Further, coefficients of issuance volume, liquidity, daily investment share of mutual funds, daily issuance share of NBFCs, market volatility index (VIX) and IPO dummy have the expected signs. | Table 3: GARCH Estimation Results | | Variable | Coefficient | Std. Error | Z-Statistic | Prob. | | Mean Equation | | C | 0.012 | 0.094 | 0.127 | 0.898 | | SPREAD(-1) | 0.425*** | 0.021 | 19.660 | 0.000 | | CP_VOL | 0.0000002* | 0.0001 | 1.747 | 0.080 | | D(MCLR) | -0.080 | 0.386 | -0.208 | 0.83 | | MTLFNDS | -0.340*** | 0.053 | -6.30 | 0.000 | | NBFCS | 0.425*** | 0.037 | 11.258 | 0.000 | | IIP | 0.003 | 0.005 | 0.652 | 0.514 | | OIS | 0.032*** | 0.008 | 3.632 | 0.003 | | VIX | 0.015*** | 0.002 | 6.679 | 0.000 | | IPO | 0.042** | 0.020 | 2.142 | 0.032 | | Liquidity | -0.058*** | 0.024 | -2.355 | 0.000 | | Variance Equation | | C | 0.005*** | 0.0002 | 2.586 | 0.009 | | RESID(-1)^2 | 0.022*** | 0.004 | 5.015 | 0.000 | | GARCH(-1) | 0.965*** | 0.005 | 178.08 | 0.000 | | Residual Diagnostics | | Adjusted R2 | 0.40 | | AIC | 0.39 | | Log-likelihood | -168 | | DW | 2.0 | | Q2 (10) | 12.44 (0.275) | | ARCH-LM | 2.09 (0.12) | Note: *** denotes significance at 1 per cent confidence level, ** denotes 5 per cent confidence level while * indicate 10 per cent significant level. AIC is Akaike Information Criterion; DW is Durbin Watson statistics.
Source: Authors’ calculations. | Daily issuance volume has a positive coefficient indicating that in order to raise higher resources from the CP market, the discount rate offered should be higher. This could in turn lead to an increase in spread. As expected, the share of mutual funds (MTLFNDS) is significant with a negative sign i.e., a larger share of mutual funds in the CP market is associated with a lower WADR further leading to a decline in spread. The coefficient for share of NBFCs is positive and significant, indicating that when the share of NBFCs in the total issuance increases, the WADR moves upward, increasing the CP spread. This could be primarily driven by the higher risk premia demanded by the investors buying securities issued by NBFCs. Market volatility indicator, VIX, affects the spread positively, as the study period witnessed certain episodes of heightened volatility in the market. Hence, the positive and significant sign of VIX is on expected lines. Liquidity has negative and significant coefficient, indicating spreads are lower during surplus liquidity conditions. The dummy variable for IPO is positive and statistically significant. Thus, a rise in NBFC’s share in daily issuances during IPOs can widen the CP spread. In this context it may be noted that RBI has recently put in place a regulatory ceiling of ₹1 crore per borrower on NBFC’s lending for IPO allotments7. Conditional Variance Chart 18 depicts the GARCH conditional volatility of WADR spread. It shows a declining trend from the initial phase of the pandemic to the post-pandemic period. For stability of the model, we have checked the residual diagnostics and those are satisfied. By and large, the regression residuals remained within the two standard deviations band, confirming the robustness of the estimation process (Annex Chart 1A). V. Conclusion Among the money market instruments, CPs are an important source of financing for corporates and NBFCs. CP issuers have to pay higher rates over the risk-free T-Bill rate depending on the firm’s credit quality. The empirical analysis in our paper suggests that a number of factors impact the CP spread over similar tenors of T-Bills. Among the financial variables, surplus liquidity is associated with lower CP spread. Market volatility measure increases the spread, indicating a shift in investors’ preference towards safer assets during periods of increased risk. Market expectation of interest rates (OIS 1-month) increases the spread indicating a rise in CP rates with the market expectation of interest rates going up. An increase in the share of mutual funds, the dominant investors in the CP issuances, dampens the CP spread. The CP issuers are broadly divided into corporates and NBFCs; our results indicate that spreads increase in tandem with an increase in CP issuances by NBFCs. Due to the credit ratings being similar for almost all the issuances, we could not factor the role of credit rating in the CP spread; this is an issue that can be taken up for future research. The CP market in India is still in an evolving stage as compared to the markets in the US, Europe, and China. About 97 per cent of the issuances are A1+ rated during our study period. The development of the secondary market could benefit from improved price discovery and diversification of investor base.
Reference Amstad, M., & He, Z. (2019). Chinese Bond Market and Interbank Market in: Marlene Amstad, G. S., and Wei Xiong, eds., The Handbook of China’s Financial System, Chapter 6.,Princeton University Press, 105–150. Anderson, R. G., & Gascon, C. S. (2009). The Commercial Paper Market, the Fed, and the 2007-2009 Financial Crisis. Federal Reserve Bank of St. Louis Review, November/ December 91(6), 589–612. https://files.stlouisfed.org/files/htdocs/publications/review/09/11/Anderson.pdf Baillie, R., & Bollerslev, T. (1989). The Message in Daily Exchange Rates: Conditional-Variance Tale. In Journal of Business and Economic Statistics (Vol. 7, Issue 3, 297–305). Baklanova, V., Kuznits, I., & Tatum, T. (2020). Primer: Money Market Funds and the Commercial Paper Market. SEC Staff Report. https://www.sec.gov/files/primer-money-market-funds-commercial-paper-market.pdf Boyarchenko, N., Crump, R. K., Kovner, A., & Leonard, D. (2022). The Commercial Paper Funding Facility. Economic Policy Review, 28(1), 114-129. Calomiris, C. W., Himmelberg, C. P. and Wachtel, P (1994), Commercial Paper, Corporate Finance, and the Business Cycle: A Microeconomic Perspective. NBER Working Paper No. w4848. Covitz, D., & Downing, C. (2007). Liquidity or Credit Risk? The Determinants of Very Short-Term Corporate Yield Spreads. Journal of Finance, 62(5), 2303–2328. https://doi.org/10.1111/j.1540-6261.2007.01276.x Covitz, D., Liang, N., & Suarez, G. A. (2013). The Evolution of a Financial Crisis: Collapse of the Asset-Backed Commercial Paper Market. Journal of Finance, 68(3), 815–848. https://doi.org/10.1111/jofi.12023. Gatev, E., & Philip, S. (2003). Banks’ Advantage in Hedging Liquidity Risk: Theory and Evidence from the Commercial Paper Market. NBER Working Paper No. 9956 http://www.nber.org/papers/w9956. Ghosh, S., & Pradhan, N. C. (2008). Determinants of WADR for Commercial Paper: An Empirical Analysis for India. RBI Occasional Papers, 29(1), 19–35. Hill, Andy. (2021). The European Commercial Paper and Certificates of Deposit Market. International Capital Market Association.A White Paper by the ICMA Commercial Paper Committee. September. Huang, J.-Z. J., Liu, B., & Shi, Z. (2020). Determinants of Short-Term Corporate Yield Spreads: Evidence from the Commercial Paper Market. (PBCSF-NIFR) Research Paper,Available at SSRN: https://ssrn.com/abstract=3530408 or http://dx.doi.org/10.2139/ssrn.3530408 Kahl, M., Shivdasani, A., & Wang, Y. (2008). Do Firms Use Commercial Paper to Enhance Financial Flexibility? In Working Paper, University of North Carolina at Chapel Hill. http://ssrn.com/abstract=1120068 Singh, S. & Raja, A. (2014) Indian Commercial Paper Market: An Insightful Investigation. CCIL Monthly Newsletter. https://www.ccilindia.com/Documents/Rakshitra/2014/apr/Article.pdf Srinivasan, A. (2019). Rating Efficiency in the Indian Commercial Paper Market. Centre for Advanced Financial Research and Learning, 4(1), 88–100.
Annex | Table A1: Chronology of Developments in Indian CP Market | | January 1, 1990 | Introduction of Indian CP only for high rated corporate borrowers (on recommendation of Sukhamoy Chakravarty Committee on Review of the Working of Monetary System (1985) and N. Vaghul Working Group on the Money Market (1987). | | April 15, 1997 | Primary Dealers (PDs) were allowed in Indian CP market to issue CPs. | | October 10, 2000 | AIFIs were permitted to raise short-term funds through CPs under the umbrella limit fixed by the RBI. | | April 30, 2001 | Banks, FIs, PDs (PDs) and SDs (Satellite Dealers) were directed to make fresh investment and hold CPs only in dematerialised form and have to convert outstanding investments in physical (scrip) form into dematerialised form by October 31, 2001. These entities could hold CPs only in dematerialised form w.e.f. November 1, 2001. | | April 30, 2003 | Permission was given to non-bank entities including corporates to provide unconditional and irrevocable guarantee for credit enhancement to CP issuer given the guarantor had a credit rating at least one notch higher than the issuer by an approved credit rating agency (CRA) along with other eligibility criteria. Banks were allowed to invest in CPs guaranteed by non-bank entities provided their exposure remains within the regulatory ceiling as prescribed by RBI for unsecured exposures. | | August 19, 2003 | Introduction of a mechanism for monitoring and reporting full particulars of defaults in redemption/repayments of CPs immediately on occurrence. | | October 26, 2004 | The minimum maturity period of CP was reduced to 7 days with immediate effect. | | December 1, 2011 | Reporting of OTC Trades in CPs only on FIMMDA Trade Reporting and Confirmation System (F -TRAC) within 15 minutes of trades. | | January 3, 2012 | Introduction of Buyback option of CPs from investors before maturity. The buyback of CP was to be through the secondary market at prevailing market price, but not before a minimum of 7 days from the date of issue. However, option (call/put) were not permitted on CP. | | June 26, 2013 | The clearing house of the MCX-Stock Exchange (MCX-SX) Clearing Corporation Limited (CCL) was allowed to settle OTC trades in CPs. | | February 14, 2014 | Reduction in available sub-limit for investments by eligible foreign investors in CP market to USD2 billion from existing USD3.5 billion (which was part of the corporate debt limit of USD51 billion). | | August 10, 2017 | The 2014 master directions for CP, required all eligible participants/ issuers to obtain credit rating for issuance of CP from any one of the SEBI registered credit rating agencies (CRAs). As against this, Master Directions in 2017 required eligible issuers, whose total CP issuance during a calendar year was ₹1000 crore or more, to obtain credit rating for issuance of CPs from at least two CRAs registered with SEBI and to adopt the lower of the two ratings. When both ratings are the same, the issuance was to be for the lower of the two amounts for which ratings were obtained. | | August 10, 2017 | The minimum period for the buyback offers to be made was increased from 7 days to 30 days from the date of issue. | | October 22, 2021 | NBFCs raise resources via commercial papers in order to finance high net worth individuals during the IPO period. The RBI announced a ceiling of ₹1 crore per borrower for financing subscription to IPOs for NBFCs. The instructions relating to ceiling on IPO funding came into effect from April 01, 2022. |
| Table A2: Cross-Country Comparison of CP Market | | Item | US | ECP | China | India | | Market Size (volume outstanding) | USD 1,098.6 billion at Dec 2022 (Federal Reserve) settled through depository trust company. | Settled through Euroclear and Clearstream | 1.9 trillion RMB at Dec 2018 mainly OTC market; however, the CPs are traded in inter-bank market | Rs. 3.6 lakh crore at December 2023 (largely OTC market) | | Market segmentation (primary: secondary) | 90:10 | varies from country to country | 22:78 | 97:3 | | Tenor / Maturity | Up to 270 days | 1 day to 1 year | up to 1 year; (for super CP it is 270 days) | 7 days to 1 year | | Types of CPs | Non-financial, financial, asset backed (ABCP). Directly sold and placed through dealer | can be issued in any currency (not restricted to Euro currency), secured or ABCP | Allowed in inter-bank bond market | Non-financial and Financial | | Issuers | Financial and non-financial corporations, municipalities | International corporations (supernational agencies), financial and non-financial corporates | Issued mainly by non-financial firms (Huang and Shi, 2020) | Corporates, PSUs, PDs, Financial institutions, REITs and InvITs | | Investors | Domestic and foreigners, institutional and retail investors money market mutual funds | global institutional investors; non-resident domestic investors | Mutual funds, trusts, commercial banks, and security firms | Mutual funds, PSUs, Banks, NBFCs, individuals (including NRIs) etc. | | Rating/ Registration requirements | Rating not compulsory, SEC (Securities Exchange Commission) registration not required if the CP is issued for less than 270 days. | legal frameworks for CP differ in European countries; most CPs carries superior credit; not regulated by SEC; | CP issuers covered in only three rating categories - AAA, AA+ and AA-. In that only 8 per cent of CPs fall into the rating category of AA- or below. | Rating compulsory, stamp duty registration required. | Note: REITs are Real Estate Investment Trusts and InvITs is Infrastructure Investment Trusts.
Source: Euroclear.com; https://www.cmdportal.com; International Capital Market Association (ICMA) CPC white paper; Amstad and He (2019); Huang et al. (2020). |
| Table A3: Indian Commercial Paper: Current Specification | | Product | Unsecured discounted Money Market Instrument. | | Issuance Form | A CP shall be issued in the form of a promissory note and held in a dematerialised form through any of the depositories approved by and registered with SEBI.
A CP shall be issued at a discount to face value.
No issuer shall have the issue of a CP underwritten or co-accepted.
Options (call/put) are not permitted on a CP. | | Denomination | ₹5 Lakh or Multiple thereof (Single investment should not be less than ₹5 Lakh (face value)). | | Rating | Eligible issuers, whose total CP issuance during a calendar year is ₹1000 crore or more, shall obtain credit rating for issuance of CPs from at least two CRAs registered with SEBI and should adopt the lower of the two ratings. When both ratings are the same, the issuance shall be for the lower of the two amounts for which ratings are obtained.
The minimum credit rating for a CP shall be 'A3' as per the rating symbol and definition prescribed by SEBI. | | Maturity | Minimum: 7 Days and Maximum: 1 Year from the date of issuance. | | Fund Raising Period | The proposed amount should be raised within a period of two weeks from the date on which the issuer opens the issue for subscription. | | Regulators | RBI and FIMMDA (Market Self-Regulatory Organisation - SRO). | | Borrowable Limit | Aggregate amount of CP issuance from an issuer shall be within the limit as approved by its Board of Directors or the quantum indicated by the Credit Rating Agency (CRA) for the specified Rating, whichever is lower. A financial institution can issue CP within the overall umbrella limit fixed by the RBI, but the issue of CP together with other short-term instruments should not exceed 100 per cent of its net owned funds as per the latest audited balance sheet. | | Eligible Issuers | Companies, NBFCs, InvITs, REITs All-India Financial Institutions (AIFIs) and any other body corporate with a minimum net-worth of ₹100 crore, provided that the body corporate is statutorily permitted to incur debt or issue debt instruments in India, are eligible to issue CPs subject to the condition that any fund-based facility availed of from bank(s) and/or financial institutions is classified as a standard asset by all financing banks/institutions at the time of issue.
Other entities like co-operative societies/unions and limited liability partnerships with a net worth of ₹100 crore subject to the condition as specified above.
Any other entity specifically permitted by the RBI. | | Eligible Investors | All residents and non-residents permitted to invest in CPs under Foreign Exchange Management Act (FEMA), 1999 are eligible to invest in CPs; however, no person can invest in CPs issued by related parties either in the primary or secondary market.
Generally, mutual funds, banks, insurance companies are the dominant investors in the CP market. | | Source: RBI, CCIL. |
| Table A4: Descriptive Statistics | | | SPREAD | CP_VOL | IIP | MCLR | MTLFND | OIS | VIX | NBFC | | Mean | 0.580 | 5843.313 | 132.024 | 6.921 | 0.830 | 4.693 | 18.881 | 0.265 | | Maximum | 3.385 | 61275.200 | 151.700 | 7.950 | 1.000 | 6.870 | 55.303 | 0.984 | | Minimum | -0.333 | 55.000 | 54.000 | 6.450 | 0.063 | 3.390 | 10.135 | 0.000 | | Std. Dev. | 0.478 | 6188.827 | 16.343 | 0.517 | 0.143 | 1.328 | 6.810 | 0.207 | | Skewness | 2.140 | 3.781 | -2.667 | 1.073 | -1.492 | 0.540 | 1.892 | 0.944 | | Kurtosis | 8.827 | 24.207 | 12.472 | 2.622 | 5.591 | 1.518 | 8.787 | 3.301 | | Jarque-Bera | 2032.215 | 19707.674 | 4593.524 | 184.719 | 607.029 | 130.667 | 1858.725 | 141.942 | | Probability | 0.000 | 0.000 | 0.000 | 0.000 | 0.000 | 0.000 | 0.000 | 0.000 | | Observations | 933 | 933 | 933 | 933 | 933 | 933 | 933 | 933 | | Source: Authors’ calculations. |
| Table A5: Breakpoint Unit Root Test Results | | Variable | t-statistic | Probability | | SPREAD | -18.066** | 0.00 | | CP_VOL_LC | -24.539** | 0.00 | | IIP | -6.963** | 0.00 | | D(MCLR) | -39.032** | 0.02 | | MTLFND | -26.179** | 0.01 | | NBFC | -24.762** | 0.01 | | OIS | -6.864** | 0.01 | | VIX | -6.432** | 0.01 | Note: ** denotes significance at 5 per cent confidence level.
Source: Authors’ calculations. |
| Table A6: Multicollinearity Test- Variance Inflation Factors (VIF) | | Variable | Coefficient Variance | VIF | | CP_VOL | 2.47E-12 | 1.07 | | IIP | 0.000003 | 1.02 | | MCLR | 0.002 | 1.02 | | MTLFND | 0.012 | 1.04 | | NBFC | 0.001 | 1.04 | | OIS | 0.000007 | 2.23 | | VIX | 0.0000005 | 2.10 | Note: No evidence for multicollinearity since VIF for all the covariates are much less than the value 10.
Source: Authors’ calculations. |
|