Headline inflation firmed up in major economies, mostly during the second half of 2007-08, reflecting the combined impact of higher food and fuel prices as well as strong demand conditions, especially in emerging markets. The monetary policy responses during the year, however, were mixed in view of heightened concerns about the implications of credit crunch arising out of the US sub-prime crisis on financial stability and economic growth in the latter part of the year. During the first half of 2007-08, many central banks in developed countries raised/maintained policy rates at elevated levels. In the second half of the year, monetary policy was eased particularly in the US, the UK and Canada following deterioration in financial market conditions. However, many central banks in emerging economies continued with pre-emptive monetary tightening to contain inflation and inflationary expectations on account of excess supply of global liquidity.
Many central banks in major advanced economies (the US Federal Reserve System, Bank of England and Bank of Canada) cut their policy rates during 2007-08, while some others [the Reserve Bank of Australia, the European Central Bank (ECB), Reserve Bank of New Zealand, Norges Bank (Norway), Sveriges Riksbank (Sweden), the People’s Bank of China (PBC), Bank of Korea and South African Reserve Bank] raised their policy rates. The US Federal Reserve System also reduced the discount rate to improve market liquidity. Apart from independent actions, there was also a co-ordinated move by major advanced country central banks in terms of injection of short-term liquidity aimed at easing strains on the money markets. The PBC also raised cash reserve requirements to address concerns regarding excess liquidity.
In India, inflation based on the wholesale price index (WPI) declined from 6.4 per cent at the beginning of the fiscal year to a low of 3.1 per cent on October 13, 2007, partly reflecting moderation in the prices of some primary food articles and some manufactured products items as well as base effects. After hovering around 3 per cent during November 2007, inflation began to edge up from early December 2007 to touch 7.4 per cent by March 29, 2008 mainly reflecting hardening of prices of primary articles such as fruits, oilseeds, raw cotton and iron ore, fuel and manufactured products items such as edible oils/ oil cakes and basic metals, partly due to international commodity price pressures. Consumer price inflation, which had eased up to January 2008, also edged up somewhat in February/March 2008. Various measures of consumer price inflation were placed in the range of 5.5-7.9 per cent during February/March 2008 as compared with 6.7-9.5 per cent in March 2007.
Global Inflation
Headline inflation in major advanced economies firmed up during the second half of 2007-08, mainly reflecting the hardening of food and fuel prices. Inflation hardened to 3.4 per cent in February 2008 in the OECD countries from 2.2 per cent a year ago mainly due to higher energy and food prices (which increased, year-on-year, by 13.9 per cent and 4.9 per cent, respectively, in February 2008). Amongst major advanced economies, headline inflation in the US and the UK, which had moderated up to August 2007, increased thereafter up to March 2008 (Chart 19). Producer price inflation also rose sharply in the US and the UK in March 2008 from a year ago, driven by energy and food prices. Core inflation also remained firm in major economies. In the OECD countries, CPI inflation (excluding food and energy) was 2.0 per cent in February 2008 as compared with 2.2 per cent a year ago. Financial markets, however, came under considerable stress in the aftermath of the US sub-prime crisis, which led to a credit squeeze in many advanced economies, including the UK and the euro area. Notwithstanding hardening of inflation, therefore, many central banks in advanced economies resorted to monetary easing in order to forestall the adverse impact of the tightening of credit conditions on the broader economy.
According to the International Monetary Fund (IMF), headline inflation is likely to firm up further in 2008 across all major economies. However, consumer price inflation in India is expected to moderate in 2008 (Table 33).
In the US, headline inflation softened from 2.8 per cent in March 2007 to 2.0 per cent in August 2007, before increasing to 4.0 per cent in March 2008,
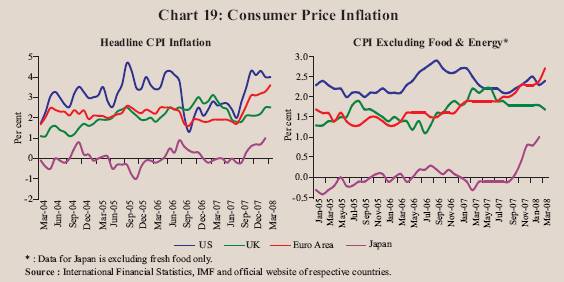
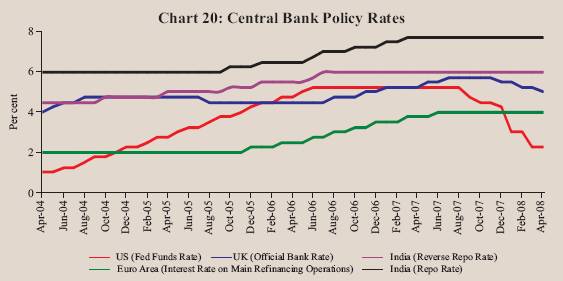
driven by food, energy and transportation prices. Producer price inflation increased to 6.9 per cent, year-on-year, in March 2008 from 3.1 per cent a year ago driven by energy and food prices. CPI inflation (excluding food and energy) also remained firm at 2.4 per cent in March 2008 (2.5 per cent a year ago). The US Federal Open Market Committee (FOMC) in its meeting held on March 18, 2008 expected inflation to moderate in the coming quarters, reflecting a projected levelling-out of energy and other commodity prices and an easing of pressures on resource utilisation. The FOMC, however, recognised that uncertainty about the inflation outlook had increased with inflation remaining at elevated levels and some indicators of inflation expectations rising. Recent information, however, indicates further weakening of the outlook for economic activity. Viewing that the tightening of credit conditions and the deepening of housing contraction are likely to weigh on economic growth over the next few quarters, the FOMC cut its target for the federal funds rate further by 75 basis points to 2.25 per cent on March 18, 2008, taking cumulative reduction to 300 basis points from September 2007 when it began cutting rates. The discount rate was also cut by a total of 375 basis points beginning August 2007 to a level of 2.50 per cent to improve market liquidity. Apart from lowering the discount rate, the US Fed also injected liquidity by auctioning term funds to depository institutions against a wide variety of collaterals at the discount window and through a broader range of counterparties and established foreign exchange swap lines with the ECB and the Swiss National Bank. Although these measures are likely to promote moderate growth over time and help mitigate the risks to economic activity, according to the FOMC, downside risks to growth remain.
Table 33: Global Consumer Price Inflation |
(Per cent) |
Region/Country |
2004 |
2005 |
2006 |
2007 |
2008 P |
2009 P |
1 |
2 |
3 |
4 |
5 |
6 |
7 |
Advanced Economies |
|
|
|
|
|
|
Euro area |
2.1 |
2.2 |
2.2 |
2.1 |
2.8 |
1.9 |
Japan |
0.0 |
-0.3 |
0.3 |
0.0 |
0.6 |
1.3 |
Korea |
3.6 |
2.8 |
2.2 |
2.5 |
3.4 |
2.9 |
UK |
1.3 |
2.0 |
2.3 |
2.3 |
2.5 |
2.1 |
US |
2.7 |
3.4 |
3.2 |
2.9 |
3.0 |
2.0 |
Emerging Economies |
|
|
|
|
|
|
Argentina |
4.4 |
9.6 |
10.9 |
8.8 |
9.2 |
9.1 |
Brazil |
6.6 |
6.9 |
4.2 |
3.6 |
4.8 |
4.3 |
China |
3.9 |
1.8 |
1.5 |
4.8 |
5.9 |
3.6 |
India |
3.8 |
4.2 |
6.2 |
6.4 |
5.2 |
4.0 |
Indonesia |
6.1 |
10.5 |
13.1 |
6.4 |
7.1 |
5.9 |
Malaysia |
1.4 |
3.0 |
3.6 |
2.1 |
2.4 |
2.5 |
Thailand |
2.8 |
4.5 |
4.6 |
2.2 |
3.5 |
2.5 |
P : IMF Projections.
Source : World Economic Outlook, International Monetary Fund, April 2008. |
In the UK, headline inflation moderated from 3.1 per cent in March 2007 to 1.8 per cent in August 2007 but increased to 2.5 per cent in March 2008, reflecting higher prices of transport, housing and household services. The output price inflation rose to 6.2 per cent in March 2008 reflecting increases in petroleum product prices. The input price index for materials and fuels purchased by manufacturing industry rose sharply by 20.6 per cent, year-on-year, in March 2008. Credit conditions have tightened and the availability of credit appears to be worsening. Inflation is expected to rise further this year, reflecting the continuing impact of higher energy and food prices, as well as the recent depreciation of sterling on import costs. The Monetary Policy Committee (MPC) noted that even if commodity prices remained at their current high levels, inflation should fall back. According to the Committee, to ensure that inflation meets the target of 2 per cent in the medium term, it needed to balance the upside risks of above-target inflation this year raising inflation expectations with the downside risks of the disruption in financial markets leading to a slowdown in the economy that was sufficiently sharp to pull inflation below the target. Business surveys, according to the Committee, suggest that growth has begun to moderate and that a margin of spare capacity will emerge during the year. This should help keep domestic inflationary pressures in check in the medium term. Against this backdrop, the Bank of England cut its policy rate further by 25 basis points on April 10, 2008 - a total of 75 basis points from December 2007 - to 5.00 per cent (Table 34). It had earlier raised the policy rate by 125 basis points during August 2006 - July 2007.
In the euro area, inflation, based on the Harmonised Index of Consumer Prices (HICP), rose consistently from 1.7 per cent in August 2007 to 3.6 per cent in March 2008 (1.9 per cent a year ago), reflecting strong upward pressures from energy and food prices. According to the Governing Council of the ECB, there are upside risks to price stability over the medium term, in a context of very vigorous money and credit growth. The upside risks also included further rises in energy and food prices, the possibility of stronger than currently expected wage growth on account of high capacity utilisation and tight labour market conditions, and stronger than expected pricing power of firms in market segments with low competition. The Council also noted that, at that juncture, it was imperative that all parties concerned met their responsibilities and that second-round effects on wage and price setting must be avoided, to preserve price stability in the medium term. Although the economic fundamentals of the euro area are sound, the Council noted that the level of uncertainty resulting from the turmoil in financial markets remained high. Accordingly, emphasising that firm anchoring
Table 34: Global Inflation Indicators |
(Per cent) |
Country/ |
Key Policy Rate |
Policy Rate |
Changes in |
|
CPI |
Real GDP |
Region |
|
(As on April |
Policy Rate |
|
Inflation |
Growth |
|
|
24, 2008) |
(basis points) |
|
(y-o-y) |
(y-o-y) |
|
|
|
2005-06 2006-07 |
Since |
Mar. |
Mar. |
2006 |
2007 |
|
|
|
(April- March) |
(April- March) |
end-
March2007 |
2007 |
2008 |
(Q4) |
(Q4) |
1 |
2 |
3 |
4 |
5 |
6 |
7 |
8 |
9 |
10 |
Developed Economies |
|
|
|
|
|
|
|
|
Australia |
Cash Rate |
7.25 (Mar. 5, 2008) |
0 |
75 |
100 |
2.4 |
4.2 |
2.9 |
3.9 |
Canada |
Overnight Rate |
3.00 (Apr. 22, 2008) |
125 |
50 |
(-)125 |
2.3 |
1.4 |
1.9 |
2.9 |
Euro area |
Interest Rate on |
|
|
|
|
|
|
|
|
|
Main Refinancing |
|
|
|
|
|
|
|
|
|
Operations |
4.00 (June 6, 2007) |
50 |
125 |
25 |
1.9 |
3.6 |
3.2 |
2.2 |
Japan |
Uncollateralised |
|
|
|
|
|
|
|
|
|
Overnight Call Rate |
0.50 (Feb. 21, 2007) |
0 ** |
50 |
0 |
-0.2 |
1.0 ^ |
2.3 |
2.0 |
UK |
Official Bank Rate |
5.00 (Apr.10, 2008) |
(-)25 |
75 |
(-)25 |
3.1 |
2.5 |
3.0 |
2.8 |
US |
Federal Funds Rate |
2.25 (Mar. 18, 2008) |
200 |
50 |
(-)300 |
2.8 |
4.0 |
2.6 |
2.5 |
Developing Economies |
|
|
|
|
|
|
|
|
Brazil |
Selic Rate |
11.75 (Apr. 16, 2008) |
(-)275 |
(-)375 |
(-)100 |
3.0 |
4.7 |
4.4 |
6.2 |
India |
Reverse Repo Rate |
6.00 (July 25, 2006) |
75 |
50 |
0 |
6.7 |
5.5 ^ |
9.1 |
8.4 |
|
Repo Rate |
7.75 (Mar. 30, 2007) |
50 |
125 |
0 |
|
|
|
|
|
|
|
(0) |
(100) |
(200) |
* |
|
|
|
China |
Benchmark 1-year |
|
|
|
|
|
|
|
|
|
Lending Rate |
7.47(Dec. 21, 2007) |
|
81 |
108 |
3.3 |
8.3 |
10.7 |
11.2 |
|
|
|
|
(250) |
(600) |
|
|
|
|
Indonesia |
BI Rate |
8.00 (Dec. 6, 2007) |
425 @ |
(-)375 |
(-)100 |
6.5 |
8.2 |
6.1 |
6.3 |
Israel |
Key Rate |
3.25 (Mar. 24, 2008) |
125 |
(-)75 |
(-)75 |
-0.9 |
3.7 |
7.4 |
6.8 |
Korea |
Base Rate $ |
5.00 (Aug. 9, 2007) |
75 |
50 |
50 |
2.2 |
3.9 |
4.0 |
5.7 |
|
|
|
|
(80) |
|
|
|
|
|
Philippines |
Reverse Repo Rate |
5.00 (Jan. 31 2008) |
+
75 |
0 |
(-)250 |
2.2 |
6.4 |
5.5 |
7.3 |
Russia |
Refinancing Rate |
10.25 (Feb. 4, 2008) |
(-)100 |
(-)150 |
(-)25 |
7.4 |
13.3 |
7.1 |
9.5 |
|
|
|
|
(150) |
(200) |
|
|
|
|
South Africa |
Repo Rate |
11.50 (Apr. 11, 2008) |
(-)50 |
200 |
250 |
6.1 |
10.6 |
6.6 |
4.6 |
Thailand |
14-day Repurchase Rate |
5.00 (June 7, 2006) |
225 |
50 |
|
|
|
|
|
|
1-day Repurchase Rate |
3.25 (July 18, 2007) |
|
(-)44 @@ |
(-)125 |
2.0 |
5.3 |
4.3 |
5.7 |
@ : Bank Indonesia adopted BI rate as the reference rate with the formal adoption of inflation targeting in July 2005.
* : Includes the CRR hike of 50 basis points in two stages of 25 basis points each to be effective from the fortnight beginning April 26, 2008 and May 10, 2008.
** : The Bank of Japan decided on March 9, 2006 to change the operating target of money market operations from the outstanding balance of current accounts at the Bank to the uncollateralised overnight call rate.
@@ : Change over January 16, 2007. Effective January 17, 2007, the 1-day repurchase rate replaced the 14-day repurchase rate as the policy rate.
^ : February 2008.
+ : The tiering system on placement with the BSP was removed and interest rates were adjusted to 6.0 per cent for the reverse repo rate and 8.0 per cent for the repo rate effective July 13, 2007.
$ : Since March 2008, the policy rate has been changed from overnight call rate to ';the Bank of Korea Rate or (Base Rate)'; and fixed at the same level as the current call rate target of 5.0 per cent on March 7, 2008.
Note :
1. For India, data on inflation pertain to CPI for Industrial Workers.
2. Figures in parentheses in column (3) indicate the date when the policy rates were last revised.
3. Figures in parentheses in columns (5) and (6) indicate the variation in cash reserve ratios during the period.
Source : International Monetary Fund, websites of respective central banks and the Economist. |
of medium to longer-term inflation expectations was of the highest priority, the ECB left the policy rates unchanged at each of its meeting held beginning June 6, 2007, when rates were last raised by 25 basis points. The interest rate on main refinancing operations remained at 4.0 per cent (Chart 20).
The Japanese economy is expected to grow at a slower pace for the time being and follow a moderate growth path thereafter. According to the Bank of Japan (BoJ), the year-on-year rate of change in consumer prices is projected to follow a positive trend due to the rise in prices of petroleum products and food products in a situation where overall supply and demand in the economy are more or less balanced. Against this backdrop, the BoJ kept its policy rate unchanged at each of its meetings held since February 2007, when it had raised the uncollateralised overnight call rate (the operating target of monetary policy since March 2006) by 25 basis points to 0.50 per cent. It, however, noted that due attention should continue to be paid to factors such as uncertainties regarding future developments in overseas economies and global financial markets, as well as the effects of high energy and materials prices. Amongst the central banks in other major advanced economies, the policy rate was cut by a total of 150 basis points by the Bank of Canada from December 2007 onwards (it had earlier raised the policy rate by 25 basis points in July 2007), while the Reserve Bank of Australia (100 basis points), the Sveriges Riksbank (100 basis points), the Reserve Bank of New Zealand (75 basis points) and Norges Bank (150 basis points) have raised policy rates since March 2007.
Notwithstanding the appreciation of exchange rates in major emerging market economies (EMEs), inflation remained firm on the back of strong growth and ample liquidity. Consumer price inflation in China increased to 8.3 per cent in March 2008 from 3.3 per cent a year earlier mainly due to higher food prices (Chart 21). Economic activity in China also continued to be strong with real GDP growth, year-on-year, at 10.6 per cent in the first quarter of 2008. In order to address the excess liquidity in the banking system and ease pressures on money and credit expansion, the PBC increased the benchmark 1-year lending rate by a total of 189 basis points beginning April 2006 to 7.47 per cent on December 21, 2007. Apart from continued issuances of its own bills to mop up liquidity, the PBC also raised the cash reserve ratio (CRR) by a total of 850 basis points to 16.0 per cent between July 2006 and April 2008 to strengthen liquidity management in the banking system and guide the 'rational' growth of money and credit. According to the PBC, these adjustments are conducive to prevent the economy from overheating.
In Russia, consumer price inflation remained high, increasing from 7.4 per cent in March 2007 to 13.3 per cent in March 2008 amidst strong growth. Growth in money supply (M2) decelerated somewhat to 47 per cent, year-on-year, as on March 1, 2008 from 50 per cent a year ago. The Bank of Russia raised the required reserve ratio on credit institutions' liabilities to non-resident banks in roubles and foreign currency by 100 basis points to 4.5 per cent effective January 15, 2008 (it was earlier reduced by 100 basis points effective October 11, 2007). The refinancing rate, which was initially cut by 50 basis points to 10.0 per cent effective June 19, 2007, was raised by 25 basis points effective February 4, 2008 to 10.25 per cent.
The upward trend in inflation continued in South Africa driven by rising energy and food prices, which posed the main upside risks to the inflation outlook. The South African Reserve Bank, therefore, raised its policy rate by a total of 200 basis points in four tranches during 2007-08 and by another 50 basis points to 11.50 per cent on April 11, 2008 in view of deterioration in inflation expectations. The policy rate has thus been raised by 450 basis points since the tightening began in June 2006.
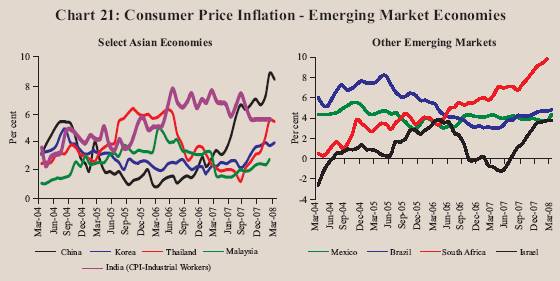
In Korea, inflation increased to 3.9 per cent in March 2008 from 2.2 per cent a year ago mainly influenced by high oil prices. Real estate prices have shown a rebound in some areas and liquidity was still ample in the financial markets. According to the MPC, although the domestic economy was exhibiting some signs of adjustment in its pace of expansion, future economic developments were still surrounded with a high degree of uncertainty largely due to the international financial market turmoil and the US economic slowdown. After raising the policy rate by 50 basis points during July-August 2007, the Bank of Korea, therefore, left its policy rate unchanged thereafter at 5.0 per cent.
In Thailand, inflation accelerated to 5.3 per cent in March 2008 from 2.0 per cent a year ago as a result of higher world oil and commodity prices. The MPC, however, assessed that these pressures were likely to moderate in the latter part of the year in tandem with the slowdown of the global economy. According to the MPC, although the overall growth momentum of the Thai economy has improved, risks to inflation and growth going forward increased making it necessary for it to monitor both issues closely. The MPC, therefore, has left 1-day repurchase rate unchanged at 3.25 per cent since July 18, 2007 (when it was last cut by 25 basis points).
Inflation in Brazil increased to 4.7 per cent in March 2008 from 3.0 per cent a year ago, partly due to robust expansion in demand. After reducing its policy rate by 850 basis points between September 2005 and September 2007, the central bank of Brazil left it unchanged thereafter up to April 15, 2008. The policy rate was raised by 50 basis points to 11.75 per cent on April 16, 2008. Noting that there are important time lags in the transmission of monetary policy stance to economic activity and inflation, the Monetary Policy Committee, had emphasised that the evaluation of alternative monetary policy stances should necessarily focus on the forward-looking inflation scenario and its risks, instead of recent inflation indicators.
Inflation in Indonesia increased to 8.2 per cent in March 2008 from 6.5 per cent a year ago. According to Bank Indonesia, inflationary pressure is forcasted to remain quite strong, dominated by imported inflation related mainly to high international commodity prices. It, however, believes that with close coordination and hard work by all concerned parties, it will be possible to minimise the impact of global economic uncertainties and sustain the momentum for economic growth. Accordingly, after lowering the policy rate by a total of 475 basis points between May 2006 and December 2007, Bank Indonesia left its policy rate unchanged at 8.0 per cent since December 6, 2007. The Bank of Israel, which had earlier raised its policy rate by 75 basis points during August 2007-January 2008, cut the policy rate by 50 basis points each effective March and April 2008 to 3.25 per cent, following its assessment that inflation will return to within the target range of 1-3 per cent in the second half of the year. The central bank of Turkey also cut its policy rates, i.e., overnight borrowing and lending rates further by 50 basis points and 75 basis points, respectively, beginning end-December 2007 - a total of 225 basis points and 325 basis points from September 2007 onwards - to support economic activity. The MPC noted that rising food and energy prices and ongoing uncertainties in the global economy have worsened inflation expectations and increased the upside risk on inflation. Aggregate demand conditions would, however, continue to support the disinflation process.
An assessment of key macroeconomic indicators in select EMEs shows that consumer price inflation was in the range of 3.7-13.3 per cent during February/March 2008. Real policy rates in most countries ranged between (-) 3.1 and 2.3 per cent in March 2008 (Table 35). Current account in major
Table 35: Key Macroeconomic Indicators: Emerging Markets |
(Per cent) |
Country |
Consumer Price Inflation |
Current Account Balance |
Real Efective Exchange Rate(REER) |
Central Govt.
Fiscal Balance |
Real Policy Rate |
Real GDP Growth |
|
|
|
(per cent to GDP) |
|
|
(per cent of GDP) |
|
|
|
|
|
Mar.
2007 |
Mar.
2008 |
2006 |
2007 |
Mar.
2007 |
Mar.
2008 |
2006 |
2007 |
Mar.
2007 |
Mar.
2008 |
2006 |
2007 |
1 |
2 |
3 |
4 |
5 |
6 |
7 |
8 |
9 |
10 |
11 |
12 |
13 |
Brazil |
3.0 |
4.7 |
1.3 |
0.3 |
-0.3 |
13.6 |
-3.2 |
-2.3 |
9.8 |
6.6 |
3.8 |
5.4 |
China |
3.3 |
8.3 |
9.4 |
11.1 |
2.1 |
5.3 |
-0.8 |
1.1 |
3.1 |
-0.8 |
11.1 |
11.4 |
India |
6.7 |
5.5 * |
-1.1 |
-- |
-0.0 |
1.0 |
-3.5 |
-3.1 |
1.1 |
2.3 |
9.6 |
8.7 |
|
(5.9) |
(7.4) |
(-6.9) |
|
|
|
(61.2) |
(61.7) |
(1.9) |
(0.4) |
|
|
Indonesia |
6.5 |
8.2 |
3.0 |
2.5 |
0.5 |
-6.0 |
-1.0 |
-1.2 |
2.5 |
-0.2 |
5.5 |
6.3 |
Israel |
-0.9 |
3.7 |
6.0 |
3.1 |
2.8 |
8.8 |
-1.8 |
-0.8 |
4.9 |
0.0 |
5.2 |
5.3 |
Korea |
2.2 |
3.9 |
0.6 |
0.6 |
0.0 |
-13.5 |
-2.7 |
-2.3 |
2.3 |
1.1 |
5.1 |
5.0 |
Philippines |
2.2 |
6.4 |
4.5 |
4.4 |
2.9 |
9.6 |
-1.1 |
-0.2 |
5.3 |
-1.4 |
5.4 |
7.3 |
Russia |
7.4 |
13.3 |
9.5 |
5.9 |
5.1 |
5.3 |
7.4 |
6.6 |
3.1 |
-3.1 |
7.4 |
8.1 |
South Africa |
6.1 |
10.6 |
-6.5 |
-7.3 |
-16.8 |
-12.1 |
-- |
-- |
2.9 |
0.4 |
5.4 |
5.1 |
Thailand |
2.0 |
5.3 |
1.1 |
6.1 |
7.6 |
2.6 |
1.1 |
-1.7 |
2.5 |
-2.1 |
5.1 |
4.8 |
|
|
|
|
|
|
|
(26.2) |
|
|
|
|
|
*: February 2008.
Note:
1. For India, data pertain to fiscal years 2006-07 and 2007-08.
2. Consumer price inflation data are on a year-on-year basis. Data for India are for CPI-Industrial Workers.
3. Real policy rate is the policy rate less year-on-year consumer price inflation. For India, repo rate is used.
4. Figures in parentheses in columns (2) and (3) refer to wholesale price inflation.
5. Figure in parenthesis in column (4) refers to trade balance/GDP ratio.
6. Data on fiscal balance for Israel pertain to general government balance.
7. Figures in parentheses in columns (8) and (9) refer to central government debt/GDP ratio.
8. Figures in parentheses in columns (10) and (11) for India are based on wholesale price inflation.
9. Data on REER refer to year-on-year variation in broad indices (CPI-based) compiled by the Bank for International Settlements. A positive figure Indicates appreciation while a negative figure indicates depreciation. For India, data are based on movements in 6-currency indices.
Source : International Monetary Fund; Asian Development Bank; Bank for International Settlements; World Bank, the Economist and official websites of respective central banks. |
EMEs, except India and South Africa, was in surplus during 2006/2007. The real effective exchange rate (REER) for the select EMEs, barring the currencies in Indonesia, Korea and South Africa, underwent real appreciation, on a year-on-year basis, in March 2008. Although the Central Government’s fiscal deficit in India declined during 2007-08, it remained higher than that in most EMEs.
Global Commodity Prices
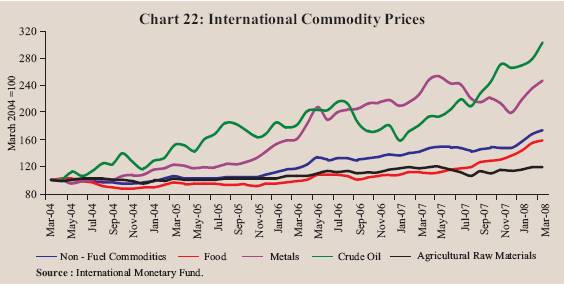
Global commodity prices firmed up during 2007-08 led by sharp increases in food and crude oil prices. Metal prices, which had witnessed some moderation during June-December 2007, rose again during January-March 2008. Agricultural raw materials prices, however, remained largely range bound during 2007-08 (Table 36 and Chart 22).
International crude oil prices, represented by the West Texas Intermediate (WTI), has been rising sharply since June 2007, reflecting tight supply-demand balance, geo-political tensions, weakening of the US dollar against major currencies and increased interest from investors and financial market participants
Table 36: International Commodity Prices |
Commodity |
Unit |
2004 |
Index |
Variation
(Per cent) |
|
|
|
|
|
|
|
2008 |
Mar. 08/ |
Mar. 08/ |
|
|
|
2004 |
2005 |
2006 |
2007 |
Jan. |
Feb. |
Mar. |
Dec.07 |
Mar.07 |
1 |
2 |
3 |
4 |
5 |
6 |
7 |
8 |
9 |
10 |
11 |
12 |
Energy |
|
|
|
|
|
|
|
|
|
|
|
Coal |
$/mt |
53.0 |
100 |
90 |
93 |
124 |
173 |
249 |
233 |
35.4 |
122.6 |
Crude oil (Average) |
$/bbl |
37.7 |
100 |
142 |
170 |
188 |
240 |
248 |
270 |
13.8 |
68.1 |
Non-Energy Commodities |
|
|
|
|
|
|
|
|
|
|
|
Palm oil |
$/mt |
471.3 |
100 |
90 |
101 |
165 |
225 |
246 |
265 |
31.4 |
100.6 |
Soybean oil |
$/mt |
616.0 |
100 |
88 |
97 |
143 |
207 |
227 |
238 |
26.0 |
104.3 |
Soybeans |
$/mt |
306.5 |
100 |
90 |
88 |
125 |
177 |
187 |
188 |
11.8 |
78.9 |
Rice |
$/mt |
237.7 |
100 |
120 |
128 |
137 |
158 |
196 |
236 |
55.8 |
76.3 |
Wheat |
$/mt |
156.9 |
100 |
97 |
122 |
163 |
236 |
271 |
280 |
19.3 |
120.8 |
Maize |
$/mt |
111.8 |
100 |
88 |
109 |
146 |
185 |
197 |
209 |
29.4 |
36.8 |
Sugar |
c/kg |
15.8 |
100 |
138 |
206 |
141 |
167 |
188 |
184 |
23.7 |
26.4 |
Cotton A Index |
c/kg |
136.6 |
100 |
89 |
93 |
102 |
118 |
121 |
132 |
17.5 |
39.9 |
Aluminium |
$/mt |
1716.0 |
100 |
111 |
150 |
154 |
143 |
162 |
175 |
26.2 |
8.8 |
Copper |
$/mt |
2866.0 |
100 |
128 |
235 |
248 |
246 |
275 |
294 |
28.1 |
30.8 |
Gold |
$/toz |
409.2 |
100 |
109 |
148 |
170 |
217 |
225 |
237 |
20.6 |
47.9 |
Silver |
c/toz |
669.0 |
100 |
110 |
173 |
200 |
240 |
264 |
287 |
34.3 |
46.0 |
Steel Products Index |
1990=100 |
121.5 |
100 |
113 |
111 |
111 |
123 |
140 |
148 |
28.0 |
35.3 |
Steel cold-rolled coilsheet |
$/mt |
607.1 |
100 |
121 |
114 |
107 |
113 |
132 |
132 |
23.1 |
23.1 |
Steel hot-rolled coilsheet |
$/mt |
502.5 |
100 |
126 |
119 |
109 |
119 |
149 |
149 |
36.4 |
36.4 |
Tin |
c/kg |
851.3 |
100 |
87 |
103 |
171 |
192 |
202 |
233 |
21.8 |
42.5 |
Zinc |
c/kg |
104.8 |
100 |
132 |
313 |
309 |
223 |
233 |
240 |
6.7 |
-23.2 |
$: US dollar. c: US cent. bbl: barrel. mt: metric tonne. kg: Kilogram. toz: troy oz.
Source: Based on World Bank’s actual commodity price data. The year 2004 has been taken as the base to better exhibit price trends over the relevant period. |
(Table 37). After touching a high of US $ 110.2 a barrel level on March 13, 2008 on the back of a sharp fall in US crude inventories, WTI prices eased somewhat thereafter during the month on deepening concerns about slowdown in the US - the biggest consumer of oil. The WTI prices, however, rose again to
Table 37 : International Crude Oil Prices |
(US dollars per barrel) |
Year/Month |
Dubai Crude |
UK Brent |
US WTI |
Average
Crude Price |
Indian
Basket Price |
1 |
2 |
3 |
4 |
5 |
6 |
2001-02 |
21.8 |
23.2 |
24.1 |
23.0 |
22.4 |
2002-03 |
25.9 |
27.6 |
29.2 |
27.6 |
26.6 |
2003-04 |
26.9 |
29.0 |
31.4 |
29.1 |
27.8 |
2004-05 |
36.4 |
42.2 |
45.0 |
41.3 |
38.9 |
2005-06 |
53.4 |
58.0 |
59.9 |
57.1 |
55.4 |
2006-07 |
60.9 |
64.4 |
64.7 |
63.3 |
62.4 |
2007-08 |
77.3 |
82.4 |
82.3 |
80.7 |
79.2 |
March 2004 |
30.5 |
33.8 |
36.7 |
33.7 |
31.9 |
March 2005 |
45.6 |
53.1 |
54.2 |
50.9 |
48.8 |
March 2006 |
57.7 |
62.3 |
62.9 |
60.9 |
59.6 |
March 2007 |
59.1 |
62.1 |
60.6 |
60.6 |
60.3 |
April 2007 |
63.8 |
67.4 |
63.9 |
65.1 |
65.2 |
May 2007 |
64.5 |
67.5 |
63.5 |
65.2 |
65.7 |
June 2007 |
65.8 |
71.3 |
67.5 |
68.2 |
67.9 |
July 2007 |
69.5 |
77.2 |
74.1 |
73.6 |
72.4 |
August 2007 |
67.2 |
70.8 |
72.4 |
70.1 |
68.6 |
September 2007 |
73.3 |
77.1 |
79.9 |
76.8 |
74.7 |
October 2007 |
77.1 |
83.0 |
85.9 |
82.2 |
79.4 |
November 2007 |
86.7 |
92.5 |
94.8 |
91.3 |
88.9 |
December 2007 |
85.8 |
91.5 |
91.4 |
89.5 |
88.0 |
January 2008 |
87.2 |
91.9 |
93.0 |
90.7 |
89.0 |
February 2008 |
90.0 |
94.8 |
95.4 |
93.4 |
91.8 |
March 2008 |
96.8 |
103.3 |
105.5 |
101.8 |
99.3 |
Source : International Monetary Fund and the World Bank. |
a historical peak of US $ 119.2 a barrel level on April 22, 2008, reflecting weakening of US dollar and tightening of supply.
Despite prospects for slower consumption growth in advanced economies, international crude prices are expected to remain at elevated levels in view of the relatively tight demand supply-balance (Table 38). According to the US Energy Information Administration (EIA), although higher oil prices and slower economic growth have dampened consumption in the US, available partial data indicate global consumption is still increasing because of continued growth in China, India, Russia and the Middle East oil-exporting countries. This along with low surplus production capacity is putting upward pressure on oil prices. Accordingly, the EIA expects WTI (average) prices to firm up by about 39 per cent from US $ 72.3 a barrel during 2007 to US $ 100.6 per barrel during 2008. The EIA, however, expects that the increase in non-OPEC production in the second half of the year, by contributing to increases in OPEC surplus production capacity, may ease upward price pressures toward the end of 2008. The futures markets also suggest that WTI prices are expected to remain firm at over US $ 113 a barrel level up to November 2008. High and volatile international crude oil prices, thus, pose a major risk to the global inflation outlook.
After increasing up to May 2007, metal prices eased subsequently up to December 2007, reflecting lower import demand and some improvement in supply. Between May 2007 and December 2007, the IMF metals price index declined by almost 21 per cent led by copper (14 per cent), aluminium (15 per cent), zinc (38 per cent) and nickel (50 per cent). Since the beginning of 2008, however, prices of these items have increased, which along with higher prices of tin and lead resulted in the IMF metals price index going up by 23.7 per cent
Table 38 : World Supply-Demand Balance of Oil |
(Million barrels per day) |
Item |
2003 |
2004 |
2005 |
2006 |
2007 |
2008 |
2008 (P) |
|
|
|
|
|
|
(P) |
Q1 |
Q2 |
Q3 |
Q4 |
1 |
2 |
3 |
4 |
5 |
6 |
7 |
8 |
9 |
10 |
11 |
Demand |
|
|
|
|
|
|
|
|
|
|
1. OECD |
48.7 |
49.5 |
49.6 |
49.3 |
49.0 |
49.1 |
49.6 |
48.1 |
48.8 |
49.8 |
2. Non-OECD |
31.2 |
33.0 |
34.4 |
35.4 |
36.4 |
37.5 |
36.8 |
37.6 |
37.7 |
38.0 |
of which: China |
5.6 |
6.5 |
6.9 |
7.3 |
7.6 |
8.0 |
7.7 |
7.9 |
8.0 |
8.3 |
3. Total (1+2) |
79.9 |
82.5 |
84.0 |
84.7 |
85.4 |
86.6 |
86.4 |
85.7 |
86.4 |
87.8 |
Supply |
|
|
|
|
|
|
|
|
|
|
4. Non-OPEC |
48.9 |
50.1 |
50.3 |
49.3 |
49.2 |
49.8 |
49.2 |
49.5 |
50.1 |
50.6 |
5. OPEC |
30.7 |
32.9 |
34.2 |
35.3 |
35.4 |
36.9 |
36.9 |
37.3 |
37.1 |
36.1 |
6. Total (4+5) |
79.6 |
83.1 |
84.5 |
84.6 |
84.7 |
86.7 |
86.1 |
86.8 |
87.1 |
86.7 |
Stock Changes |
0.3 |
-0.6 |
-0.5 |
0.1 |
0.7 |
-0.1 |
0.4 |
-1.1 |
-0.7 |
1.1 |
P : Projections.
Source : US Energy Information Administration, April 2008. |
during January-March 2008, more than offsetting the previous decline. International steel prices, which were flat during the first half of 2007-08, rose by 33 per cent during the second half of the year despite increase in global crude steel production (by 5.8 per cent, year-on-year, in March 2008), mainly reflecting rising input costs on account of iron ore, energy and freight charges. After remaining flat up to December 2007, international iron ore prices increased by 66 per cent in January 2008 and have remained flat thereafter up to March 2008.
Food prices firmed up during 2007-08, especially in the second half, led by wheat, rice, and oilseeds/edible oils, reflecting surging demand (both consumption demand and demand for non-food uses such as bio-fuels production) and low stocks of major crops (Chart 23). Reflecting these factors, international prices of wheat, rice, soybeans, soybean oils and palm oils increased by 120.8 per cent, 76.3 per cent, 78.9 per cent, 104.3 per cent and 100.6 per cent, respectively, year-on-year, in March 2008. Consequently, the IMF food price index increased by 43.5 per cent, on a year-on-year basis, in March 2008 surpassing the level which was last seen in the late 1980.
The supply side pressures on global food prices do not appear to be abating, especially with the year ending global stock of major crops at historical lows. According to the US Department of Agriculture (USDA) in April 2008, global wheat stocks are expected to decline further by almost 10 per cent during 2007-08 (on top of about 15 per cent decline during 2006-07) to about 112.5 million tonnes - their lowest levels since 1981-82. Global oilseeds stocks are also expected to decline by about 22 per cent during 2007-08 to 57.2 million

tonnes, reflecting mainly expected fall in global oilseeds production, mostly caused by a shift of plantings from soybean to maize in northern hemisphere countries and increase in global utilisation of oilseed products. Notwithstanding higher coarse grains production, mainly on account of record production of maize in the US following record high prices (due to significant supply shortage in the face of very strong demand for the production of ethanol in the US) and higher corn production in Brazil, the world’s year-ending stocks are projected to decline by about 7 per cent due to forecast about increase in feed use of coarse grains. According to the USDA, rice stocks are projected to marginally improve to 77.1 million tonnes during 2007-08 mainly on account of increase in production in Indonesia and Burma coupled with lower global imports primarily due to the impact of higher global prices and export bans and restrictive policies among many of the leading exporters, including Egypt, India and Vietnam. Thus, global food prices are likely to remain firm given the outlook for various crops and their lower levels of year ending stocks.
International sugar prices had remained largely range bound during the first three quarters of 2007-08, reflecting higher production in traditional importing countries. Subsequently, prices have increased by almost 24 per cent during the past three months, although prices are still lower by 27 per cent from the recent peak of February 2006. According to the International Sugar Organisation (ISO), global sugar production is estimated to exceed global consumption by about 9 million tonnes during 2007-08 (October-September) season. According to the ISO, therefore, the large and growing presence of funds in the market may have a pivotal influence on market sentiment and dynamics, thereby leading to a disconnect between fundamentals and prices in recent months. Global cotton prices, represented by the 'Cotlook A Index', increased by 39.9 per cent, year-on-year, in March 2008, reflecting shortfalls in production. According to the International Cotton Advisory Committee (ICAC), world cotton prices surged to their highest level from August 1997, which equalled the 30-year average recorded between 1973-74 and 2002-03, reflecting increases in prices of competing crops and the increasing role of commodity investment funds rather than fundamental measures of cotton supply and use. According to the ICAC, world cotton stocks are expected to fall further by almost 5 per cent to 11.0 million tonnes and accordingly prices are expected to go up by 8.1 per cent in 2008-09.
In response to high food prices, especially of wheat, rice, corns and oilseeds/edible oils and their implications for headline inflation and inflationary expectations, the Governments in both developed and developing countries have resorted to numerous market interventions in the form of price controls, reduction of import barriers and/or imposition of export restrictions to contain price increases and prevent consumption from falling.
Inflation Conditions in India
Against the backdrop of edging up of inflation rates in India at the commencement of 2007-08, the Annual Policy Statement for 2007-08 (April 2007) of the Reserve Bank reaffirmed its resolve to respond swiftly with all possible measures to developments impinging on inflation expectations and the growth momentum. As the overarching policy challenge was to manage the transition to a higher growth path while containing inflationary pressures, the policy preference for the period ahead was indicated as strongly in favour of price stability and well-anchored inflation expectations with the endeavour being to contain inflation close to 5.0 per cent in 2007-08 and to the range of 4.0-4.5 per cent over the medium-term.
Headline inflation rates turned benign by the first quarter of 2007-08, reflecting the combined impact of lagged and cumulative monetary policy actions and fiscal and administrative measures for supply management. These measures also had a salutary effect on inflation expectations. Nevertheless, the First Quarter Review of the Annual Statement on Monetary Policy for 2007-08 (July 2007) added that monetary management needed to be watchful of movements in commodity prices, particularly oil prices, the elevated levels of asset prices and the re-emergence of pricing power among producers as potential threats to inflation expectations. The outlook for inflation in 2007-08 was, however, left unchanged in the Review. On a review of the then prevailing liquidity situation, the cash reserve ratio (CRR) was raised by 50 basis points with effect from the fortnight beginning August 4, 2007 (Table 39).
The Mid-term Review of the Annual Policy Statement for 2007-08 (October 2007), while indicating that inflation expectations were reasonably well-anchored, recognised that threats to inflation in the future emanated not only from domestic liquidity conditions but also from the underlying global pressures. It also added that the possible impact of injection of liquidity by central banks to meet the recent turbulence in the global financial markets on global inflation was not clear. Accordingly, it persisted with the stance as set out in the Annual Policy Statement for 2007-08 and the First Quarter Review of reinforcing the emphasis on price stability and well-anchored inflation expectations while ensuring a monetary and interest rate environment that supported export and investment demand in the economy so as to enable continuation of the growth momentum. It reiterated the policy endeavour of containing inflation close to
Table 39: Movement in Key Policy Rates and Inflation in India |
(Per cent) |
Effective since |
Reverse Repo Rate |
Repo Rate |
Cash Reserve Ratio |
WPI Inflation |
1 |
2 |
3 |
4 |
5 |
March 31, 2004 |
4.50 |
6.00 |
4.50 |
4.6 |
September 18, 2004 |
4.50 |
6.00 |
4.75 (+0.25) |
7.9 |
October 2, 2004 |
4.50 |
6.00 |
5.00 (+0.25) |
7.1 |
October 27, 2004 |
4.75 (+0.25) |
6.00 |
5.00 |
7.4 |
April 29, 2005 |
5.00 (+0.25) |
6.00 |
5.00 |
6.0 |
October 26, 2005 |
5.25 (+0.25) |
6.25(+0.25) |
5.00 |
4.5 |
January 24, 2006 |
5.50 (+0.25) |
6.50(+0.25) |
5.00 |
4.2 |
June 9, 2006 |
5.75 (+0.25) |
6.75(+0.25) |
5.00 |
4.9 |
July 25, 2006 |
6.00 (+0.25) |
7.00(+0.25) |
5.00 |
4.7 |
October 31, 2006 |
6.00 |
7.25(+0.25) |
5.00 |
5.3 |
December 23, 2006 |
6.00 |
7.25 |
5.25 (+0.25) |
5.8 |
January 6, 2007 |
6.00 |
7.25 |
5.50 (+0.25) |
6.4 |
January 31, 2007 |
6.00 |
7.50(+0.25) |
5.50 |
6.7 |
February 17, 2007 |
6.00 |
7.50 |
5.75 (+0.25) |
6.0 |
March 3, 2007 |
6.00 |
7.50 |
6.00 (+0.25) |
6.5 |
March 31, 2007 |
6.00 |
7.75(+0.25) |
6.00 |
5.9 |
April 14, 2007 |
6.00 |
7.75 |
6.25 (+0.25) |
6.3 |
April 28, 2007 |
6.00 |
7.75 |
6.50 (+0.25) |
6.0 |
August 4, 2007 |
6.00 |
7.75 |
7.00 (+0.50) |
4.4 |
November 10, 2007* |
6.00 |
7.75 |
7.50 (+0.50) |
3.2 |
* : The CRR has been further raised by 50 basis points to 8.0 per cent in two stages of 25 basis points each to be effective
from the fortnight beginning April 26, 2008 and May 10, 2008.
Note :
1. With effect from October 29, 2004, the nomenclature of repo and reverse repo was changed in keeping with international usage. Now, reverse repo indicates absorption of liquidity and repo signifies injection of liquidity. Prior to October 29, 2004, repo indicated absorption of liquidity, while reverse repo meant injection of liquidity. The nomenclature in this document is based on the new usage of terms even for the period prior to October 29, 2004.
2. Figures in parentheses indicate change in policy rates. |
5.0 per cent in 2007-08. In recognition of India’s evolving integration with the global economy and societal preferences in this regard, it further resolved to condition expectations in the range of 4.0-4.5 per cent so that an inflation rate of around 3.0 per cent becomes a medium-term objective consistent with India’s broader integration into the global economy. On a review of the then prevailing liquidity situation, the CRR was increased by 50 basis points to 7.5 per cent with effect from the fortnight beginning November 10, 2007.
The Third Quarter Review of Annual Policy for 2007-08 (January 2008) noted that the domestic outlook remained positive with continued favourable prospects of sustaining the growth momentum in an environment of price and financial stability. In contrast, that the outlook for the global economy had worsened somewhat from the time of the Mid-Term Review with risks to both growth and inflation having accentuated. It also noted that while the dangers of global recession were relatively subdued at that juncture and consensus expectations seemed to support a soft landing, the upside pressures on inflation had become more potent and real than before. Food and energy prices were envisaged to impart a permanent upward shock to inflation globally and, in particular, in EMEs. The future evolution of the sub-prime mortgage crisis was seen to carry the gravest risks for the world economy. Furthermore, the expansion of monetary and liquidity conditions as well as asset prices were felt to contain risks of upward inflationary pressures for the Indian economy, alongside international price pressures. It was indicated that in the period ahead, developments in global financial markets in the context of the sub-prime crisis would warrant more intensified monitoring and swift responses with all available instruments to preserve and maintain macroeconomic and financial stability.
Against the backdrop of increases in inflation since the announcement of the Third Quarter Review for 2007-08 and in light of the current macroeconomic, monetary and anticipated liquidity conditions, the Reserve Bank announced on April 17, 2008 an increase in CRR by 50 basis points to 8.0 per cent, with a view to containing inflation expectations. This increase in CRR would be implemented in two stages of 25 basis points each to be effective from the fortnights beginning April 26, 2008 and May 10, 2008.
Wholesale Price Inflation
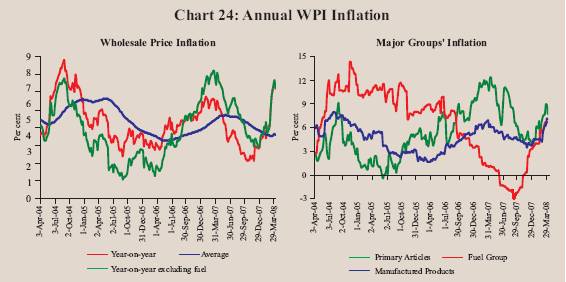
In India, headline inflation based on the wholesale price index (WPI) softened from 6.4 per cent at the beginning of the fiscal year to a low of 3.1 per cent on October 13, 2007, partly reflecting moderation in the prices of some primary food articles and some manufactured products items as well as base effects. After hovering around 3 per cent in November 2007, inflation began to edge up from early December 2007 and touched 7.4 per cent by March 29, 2008, mainly reflecting hardening of prices of primary articles, fuel group and some manufactured products items. On a year-on-year basis, twelve items/groups - rice, wheat, milk, raw cotton, oilseeds, iron ore, coal mining, mineral oils, edible oils, oil cakes, basic heavy inorganic chemicals and metals - with a combined weight of about 35 per cent in the WPI basket accounted for over 82 per cent of headline inflation as on March 29, 2008. Increase in domestic prices of some of these commodities reflected the international commodity price pressures (Table 40). The year-on-year (y-o-y) inflation, excluding fuel, at 7.6 per cent, was marginally higher than the headline inflation rate. After rising up to May 2007, the annual average WPI inflation rate (average of 52 weeks), however, eased from the beginning of June 2007 to reach 4.6 per cent during the week ended March 29, 2008 (5.4 per cent a year ago) (Chart 24).
Amongst major groups, primary articles inflation, y-o-y, eased from 12.2 per cent at the beginning of April 2007 to an intra-year low of 3.7 per cent by
Table 40: Key Commodity Price Inflation - Global vis-à-vis Domestic |
(year-on-year) |
(Per cent) |
|
Global |
Domestic (WPI) |
|
Inflation |
Variation |
Weighted
Contribution |
|
March 2008 over
March 2007 |
2006-07 |
2007-08 |
2006-07 |
2007-08 |
1 |
2 |
3 |
4 |
5 |
6 |
1. |
Rice |
76.3 |
5.7 |
8.2 |
2.1 |
2.4 |
2. |
Wheat |
120.8 |
7.3 |
5.1 |
1.8 |
1.0 |
3. |
Milk |
-- |
8.4 |
7.6 |
5.8 |
4.3 |
4. |
Raw Cotton |
39.9 |
21.9 |
14.0 |
3.5 |
2.1 |
5. |
Oilseeds |
78.9 |
31.6 |
18.7 |
11.0 |
6.5 |
6. |
Iron Ore |
66.0 |
16.9 |
52.9 |
2.0 |
5.6 |
7. |
Coal Mining |
122.6 |
0.0 |
8.8 |
0.0 |
2.3 |
8. |
Mineral Oils |
68.1 |
0.5 |
9.2 |
1.1 |
15.7 |
9. |
Edible Oils |
100.6 - 104.3 |
14.1 |
20.1 |
4.7 |
5.8 |
10.Oil Cakes |
-- |
32.9 |
27.2 |
7.0 |
5.8 |
11.Basic Heavy Inorganic Chemicals |
-- |
-3.5 |
33.2 |
-0.7 |
5.1 |
12.Basic Metals, Alloys and Metal Products |
-- |
11.3 |
20.0 |
17.4 |
25.9 |
- Iron and Steel |
35.3 |
8.1 |
34.2 |
6.0 |
21.0 |
Sub-total |
|
|
|
55.7 |
82.5 |
Note :
1. Global price increases are based on the World Bank commodity prices data.
2. Global edible oils are represented by palm oil and soybean oil.
3. Global iron and steel is represented by the World Bank’s steel products price index.
4. Global mineral oil is represented by crude oil (average) spot prices. |
end-December 2007, reflecting easing of food articles prices, especially of pulses, fruits and vegetables, and eggs, fish and meat as well as base effects. Subsequently, primary articles inflation increased to 8.9 per cent on March 29,
2008 mainly led by fruits and vegetables, oilseeds, raw cotton and iron ore. Within primary food articles, rice and wheat prices increased by 8.2 per cent and 5.1 per cent, respectively, on a year-on-year basis, on March 29, 2008. The lower order of increase in domestic prices of rice and wheat, in the face of sharp increases in international prices, could be attributed to the various supply-side measures undertaken by the Government. Elevated rice prices, however, continued to be a matter of concern in view of the decline in rabi output, low productivity and exposure of the crop to frequent weather-related disturbances in the main producing regions as well as other structural factors. Amongst other primary food items, prices of vegetables increased by 15.8 per cent, y-o-y, on March 29, 2008 (1.2 per cent a year ago), while milk prices increased by 7.6 per cent on top of 8.4 per cent a year ago. Amongst non-food primary articles, prices of oilseeds, y-o-y, increased by 18.7 per cent on March 29, 2008 on top of an increase of 31.6 per cent a year ago, which could be attributed to higher demand, lower estimated rabi production (which was down by 10.7 per cent, y-o-y, as per the Third Advance Estimates) as well as rising global prices. Notwithstanding higher domestic production, raw cotton prices were 14.0 per cent higher, y-o-y, as on March 29, 2008 (21.9 per cent a year ago) in line with international price movements; as noted earlier, the Cotlook ‘A’ Index increased by 39.9 per cent in March 2008 (Chart 25).
Fuel group inflation, which was negative during June-November 2007, reflecting the base effects as well as the cuts in prices of petrol and diesel in November 2006 and February 2007, turned positive from mid-November 2007
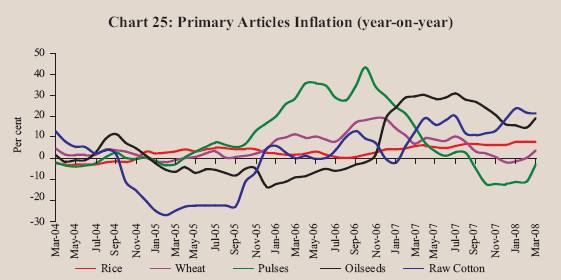
Table 41 : Wholesale Price Inflation in India (year-on-year) |
(Per cent) |
Commodity |
|
2006-07 |
2007-08 (P) |
|
|
(March 31) |
(March 29) |
|
Weight |
Inflation |
WC |
Inflation |
WC |
1 |
2 |
3 |
4 |
5 |
6 |
All Commodities |
100.0 |
5.9 |
100.0 |
7.4 |
100.0 |
1. Primary Articles |
22.0 |
10.7 |
39.0 |
8.9 |
27.1 |
Food Articles |
15.4 |
8.0 |
20.8 |
6.1 |
12.8 |
i. |
Rice |
2.4 |
5.7 |
2.1 |
8.2 |
2.4 |
ii. |
Wheat |
1.4 |
7.3 |
1.8 |
5.1 |
1.0 |
iii. |
Pulses |
0.6 |
12.5 |
1.4 |
-1.8 |
-0.2 |
iv. |
Vegetables |
1.5 |
1.2 |
0.3 |
15.8 |
2.7 |
v. |
Fruits |
1.5 |
5.7 |
1.8 |
3.1 |
0.8 |
vi. |
Milk |
4.4 |
8.4 |
5.8 |
7.6 |
4.3 |
vii. |
Eggs, Fish and Meat |
2.2 |
9.4 |
3.8 |
1.5 |
0.5 |
Non-Food Articles |
6.1 |
17.2 |
15.6 |
11.1 |
8.9 |
i. |
Raw Cotton |
1.4 |
21.9 |
3.5 |
14.0 |
2.1 |
ii. |
Oilseeds |
2.7 |
31.6 |
11.0 |
18.7 |
6.5 |
iii. |
Sugarcane |
1.3 |
1.1 |
0.3 |
-0.4 |
-0.1 |
Minerals |
0.5 |
17.5 |
2.6 |
41.8 |
5.5 |
2. Fuel, Power, Light and Lubricants |
14.2 |
1.0 |
4.0 |
6.7 |
19.4 |
i. |
Mineral Oils |
7.0 |
0.5 |
1.1 |
9.2 |
15.7 |
ii. |
Electricity |
5.5 |
2.3 |
2.8 |
1.5 |
1.4 |
iii. |
Coal Mining |
1.8 |
0.0 |
0.0 |
8.8 |
2.3 |
3. Manufactured Products |
63.8 |
6.1 |
57.3 |
7.1 |
53.5 |
i. |
Food Products |
11.5 |
6.1 |
10.5 |
9.1 |
12.5 |
of which: Sugar |
3.6 |
-12.7 |
-6.6 |
0.0 |
0.0 |
|
Edible Oils |
2.8 |
14.1 |
4.7 |
20.1 |
5.8 |
ii. |
Cotton Textiles |
4.2 |
-1.0 |
-0.6 |
-5.1 |
-2.2 |
iii. |
Man Made Fibres |
4.4 |
3.9 |
1.3 |
0.4 |
0.1 |
iv. |
Chemicals and Chemical Products |
11.9 |
3.6 |
7.1 |
5.4 |
8.2 |
|
of which : Fertilisers |
3.7 |
1.8 |
1.0 |
1.9 |
0.8 |
v. |
Basic Metals, Alloys and Metal Products |
8.3 |
11.3 |
17.4 |
20.0 |
25.9 |
|
of which: Iron and Steel |
3.6 |
8.1 |
6.0 |
34.2 |
21.0 |
vi. |
Non-Metallic Mineral Products |
2.5 |
9.0 |
3.6 |
6.0 |
2.0 |
|
of which: Cement |
1.7 |
11.6 |
3.2 |
5.1 |
1.2 |
vii. |
Machinery and Machine Tools |
8.4 |
8.1 |
8.6 |
3.6 |
3.2 |
|
of which: Electrical Machinery |
5.0 |
12.9 |
6.7 |
4.9 |
2.2 |
viii. |
Transport Equipment and Parts |
4.3 |
2.0 |
1.2 |
4.7 |
2.1 |
Memo: |
|
|
|
|
|
|
Food Items (Composite) |
26.9 |
7.3 |
31.2 |
7.3 |
25.3 |
|
WPI Excluding Food |
73.1 |
5.5 |
68.8 |
7.5 |
74.7 |
|
WPI Excluding Fuel |
85.8 |
7.4 |
96.0 |
7.6 |
80.6 |
WC : Weighted Contribution.
P : Provisional. |
to reach 6.7 per cent on March 29, 2008 (Table 41). The increase since November 2007 could be attributed to further increases in the prices of some petroleum products such as naphtha, furnace oil, aviation turbine fuel (ATF) and bitumen as well the upward revision in the domestic prices of petrol and diesel by Rs. 2 a litre and by Rs. 1 per litre, respectively, effective February 15, 2008 (which came after a gap of almost one year when the prices were cut). In this context,
it may be noted that international crude oil prices (Indian basket) increased by almost 76 per cent from US $ 56.6 a barrel in February 2007 to US $ 99.3 a barrel level in March 2008. In rupee terms, the increase in international crude (Indian basket) prices worked out to almost 61 per cent over the same period, while the mineral oil (monthly average) index in the WPI increased by only about 9 per cent. However, the freely priced items (such as naphtha, furnace oil, ATF, etc.) within the mineral oil group have increased within a range of 38.7-44.0 per cent since February 2007. It may be noted that while domestic petrol and diesel prices have been adjusted partially, prices of kerosene and liquefied petroleum gas (LPG) have not been raised by the Government since April 2002 and November 2004, respectively, on grounds of societal concerns. In order to contain fuller pass-through of higher international crude prices to domestic prices, the Government, however, has extended the subsidy schemes for these products, which were available through the public distribution system (PDS) to March 2010. The schemes were earlier available up to March 2007. Furthermore, in October 2007, the Government had also announced to bear the burden to the extent of 42.7 per cent of the under-recoveries in the retail sale of petroleum products by oil marketing companies through issuance of oil bonds. Thus, inflation risks on account of oil prices remain incipient.
Manufactured products inflation, y-o-y, eased from 6.4 per cent at the beginning of the year to 3.5 per cent by November 24, 2007 (5.3 per cent a year ago) led by decline in the prices of sugar, textiles and non-ferrous metals as well as base effects. Subsequently, manufacturing inflation increased to 7.1 per cent by March 29, 2008, mainly reflecting the continued rise in the prices of edible oils/oil cakes, basic heavy inorganic chemicals, and basic metals and alloys. These commodities together contributed almost 45 per cent to the overall WPI inflation on March 29, 2008. The increase in domestic edible oil/oil cakes prices, year-on-year, by 20.1 per cent and 27.2 per cent, respectively, on March 29, 2008 (on top of 14.1 per cent and 32.9 per cent, respectively, a year ago) reflected surge in demand, lower domestic rabi 2007 oilseeds production as well as sharp increase in international prices (Chart 26). It may be noted that India has imported large quantities of edible oils at progressively higher prices since November 2007. According to the Solvent Extractors’ Association of India, import of edible oils increased by 38 per cent to 1.9 million tonnes during November 2007-March 2008. During this period, international edible oil prices also increased in a range of about 26-31 per cent.
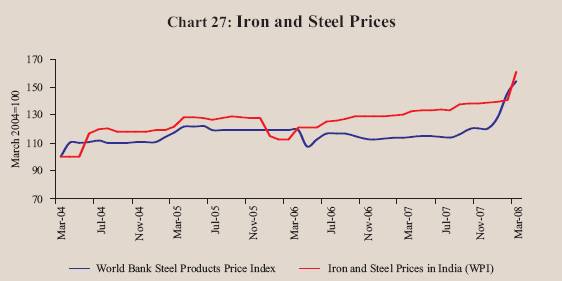
Within manufactured products, basic metals and alloy prices increased sharply (21.4 per cent) during March 29, 2008 over end-February 2008 led by iron and steel (24.8 per cent), which pushed the year-on-year increase in metals group inflation to 20.0 per cent on March 29, 2008 on top of 11.3 per cent increase a year ago (see Table 41). This, along with iron ore, was primarily

responsible for the sharp jump in headline inflation from 5.0 per cent at end-February 2008 to 7.4 per cent on March 29, 2008. The sharp increase in domestic iron and steel prices was in line with the recent hardening of international steel prices (Chart 27). The continued hardening of electrical machinery prices (4.9 per cent on March 29, 2008 on top of 12.9 per cent recorded a year ago) reflected higher input prices as well as investment demand. The continued firming up of cement prices could be attributed largely to the strong demand from the construction sector and high capacity utilisation rates in the cement industry [93 per cent during 2007-08 (April-February) as compared with 90 per cent a year ago]. Basic heavy inorganic chemicals prices also
increased sharply by 33.2 per cent, year-on-year, on March 29, 2008 as against a decline of 3.5 per cent recorded a year ago. Amongst other manufactured products, domestic prices of non-ferrous metals declined on a year-on-year basis, although international prices, which had eased up to December 2007, have firmed up from January 2008. Sugar prices remained flat reflecting higher domestic production, although international prices have firmed up in recent months. Despite higher domestic raw cotton prices, cotton textiles prices have declined year-on-year by 5.1 per cent on March 29, 2008 possibly reflecting competitive pressures from the global market and lower export demand.
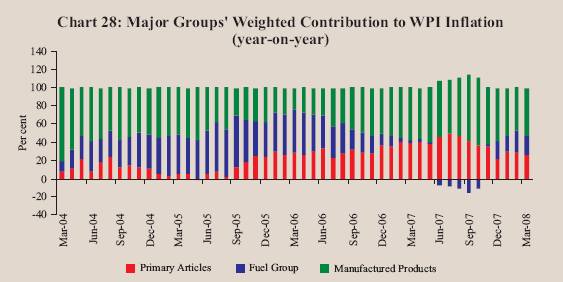
Overall, manufactured products were the major driver of annual year-on-year WPI inflation as on March 29, 2008 with weighted contribution of 53.5 per cent (57.3 per cent a year ago), followed by primary articles at 27.1 per cent (39.0 per cent) and the fuel group at 19.4 per cent (4.0 per cent) (Chart 28).
In order to contain inflationary pressures, the Government initiated a number of fiscal and supply augmenting measures during 2007-08. On April 3, 2007, the Government decided to exempt import of portland cement from countervailing duty and special additional customs duty; it was earlier exempted from basic customs duty in January 2007. The Government also took several measures with the aim of containing food price inflation. The Government reduced customs duty on palm oils by 10 percentage points across the board in April 2007 and import duty on various edible oils in a range of 5-10 percentage points in July 2007. It also withdrew the 4 per cent additional countervailing duty on all edible oils. Import of wheat at zero duty, which was available up to end-December 2006, was extended further to end-December
2007. Customs duty on import of pulses was reduced to zero on June 8, 2006 and the period of validity of import of pulses at zero duty, which was initially available up to March 2007, was first extended to August 2007 and further to March 2009. A ban was imposed on export of pulses with effect from June 22, 2006 and the period of validity of prohibition on exports of pulses, which was initially applied up to end-March 2007, was further extended up to end-March 2008. In order to increase the availability of onion, the National Agricultural Cooperative Marketing Federation of India Ltd. (NAFED) increased the minimum export price (MEP) by US $ 100 per tonne for all destinations from August 20, 2007 and by another US $ 50 per tonne with effect from October 2007 for restricting exports and augmenting availability in the domestic market. The minimum support price (MSP) for paddy was raised by Rs. 125 per tonne for this year and for wheat by Rs. 150 for 2007-08 and further by Rs. 150 for 2008-09.
In March 2008, the customs duty on semi-milled or wholly-milled rice was reduced from 70 per cent to zero per cent up to March 2009; customs duties on crude and refined edible oil were reduced from a range of 40-75 per cent to 20-27.5 per cent. The export of all edible oils were prohibited with immediate effect from March 17, 2008. Furthermore, on April 1, 2008, the Government announced a ban on the export of non-basmati rice and raised the minimum export price (MEP) to US $ 1,200 per tonne in respect of basmati rice. The Government also announced to allow import of crude form of edible oil at zero duty and refined form of edible oil at a duty of 7.5 per cent. The ban on export of pulses was also extended for one more year beginning April 1, 2008. These measures are expected to help in containing inflation and inflationary expectations.
As per the latest available information on WPI, headline inflation eased marginally to 7.3 per cent during the week ended April 12, 2008 from 7.4 per cent at end-March 2008.
Consumer Price Inflation
Inflation based on year-on-year variation in consumer price indices (CPIs) had eased up to January 2008, mainly reflecting the deceleration in food price inflation. Subsequently, there has been some increase in CPI inflation measures mainly due to food and fuel prices. Various measures of consumer price inflation were placed in the range of 5.5-7.9 per cent during February/March 2008 as compared with 6.7-9.5 per cent in March 2007. Disaggregated data show that food group inflation in various CPI measures eased to a range of 6.2-8.5 per cent in February/March 2008 from 10.9-12.2 per cent in March 2007 (Table 42).
Table 42 : Consumer Price Inflation : Major Groups |
(Year-on-year variation in per cent) |
CPI Measure |
Weight |
Mar-03 |
Mar-04 |
Mar-05 |
Mar-06 |
Mar-07 |
Jun-07 |
Sep-07 |
Dec-07 |
Feb-08 |
Mar-08 |
1 |
2 |
3 |
4 |
5 |
6 |
7 |
8 |
9 |
10 |
11 |
12 |
CPI-IW (Base: 2001=100)# |
General |
100.0 |
4.1 |
3.5 |
4.2 |
4.9 |
6.7 |
5.7 |
6.4 |
5.5 |
5.5 |
-- |
Food Group |
46.2 |
3.7 |
3.1 |
1.6 |
4.9 |
12.2 |
8.1 |
8.7 |
6.2 |
7.0 * |
-- |
Pan, Supari etc. |
2.3 |
1.9 |
4.2 |
2.1 |
3.1 |
4.4 |
9.6 |
10.3 |
10.3 |
11.9 * |
-- |
Fuel and Light |
6.4 |
6.3 |
6.5 |
4.9 |
-2.9 |
3.2 |
1.6 |
2.3 |
2.3 |
2.3 * |
-- |
Housing |
15.3 |
5.4 |
3.9 |
20.4 |
6.6 |
4.1 |
4.1 |
4.0 |
4.0 |
4.7 * |
-- |
Clothing, Bedding etc. |
6.6 |
1.5 |
2.1 |
2.3 |
3.0 |
3.7 |
4.4 |
5.3 |
3.5 |
3.5 * |
-- |
Miscellaneous |
23.3 |
5.3 |
3.2 |
3.9 |
4.6 |
3.3 |
4.0 |
4.0 |
4.7 |
5.5 * |
-- |
CPI-UNME (Base: 1984-85=100) |
General |
100.0 |
3.8 |
3.4 |
4.0 |
5.0 |
7.6 |
6.1 |
5.7 |
5.1 |
5.2 |
6.0 |
Food Group |
47.1 |
2.6 |
3.0 |
2.2 |
5.3 |
10.9 |
7.7 |
7.7 |
6.2 |
6.2 |
-- |
Fuel and Light |
5.5 |
3.1 |
3.2 |
9.6 |
1.9 |
6.4 |
7.2 |
7.0 |
5.4 |
5.2 |
-- |
Housing |
16.4 |
6.3 |
5.2 |
7.5 |
5.5 |
5.6 |
5.6 |
4.9 |
4.7 |
4.0 |
-- |
Clothing, Bedding etc. |
7.0 |
2.6 |
2.6 |
2.0 |
2.9 |
3.6 |
4.3 |
4.0 |
4.1 |
4.4 |
-- |
Miscellaneous |
24.0 |
6.0 |
2.8 |
4.4 |
5.1 |
4.4 |
3.7 |
3.2 |
3.8 |
4.2 |
-- |
CPI-AL (Base: 1986-87=100) |
General |
100.0 |
4.9 |
2.5 |
2.4 |
5.3 |
9.5 |
7.8 |
7.9 |
5.9 |
6.4 |
7.9 |
Food Group |
69.2 |
6.0 |
1.6 |
2.2 |
5.5 |
11.8 |
8.8 |
8.8 |
6.2 |
6.7 |
8.5 |
Pan, Supari etc. |
3.8 |
3.5 |
4.7 |
-1.3 |
6.6 |
5.7 |
9.1 |
11.1 |
11.3 |
10.2 |
10.4 |
Fuel and Light |
8.4 |
4.8 |
3.0 |
3.0 |
4.3 |
6.9 |
7.4 |
7.2 |
6.3 |
8.0 |
8.0 |
Clothing, Bedding etc. |
7.0 |
3.0 |
4.1 |
2.5 |
2.2 |
3.5 |
2.7 |
1.9 |
1.3 |
1.8 |
1.8 |
Miscellaneous |
11.7 |
3.1 |
2.7 |
5.5 |
5.5 |
6.8 |
6.7 |
5.5 |
5.2 |
5.9 |
6.1 |
CPI-RL (Base: 1986-87=100) |
General |
100.0 |
4.8 |
2.5 |
2.4 |
5.3 |
9.2 |
7.5 |
7.6 |
5.6 |
6.1 |
7.6 |
Food Group |
66.8 |
5.6 |
1.9 |
1.9 |
5.8 |
11.5 |
8.5 |
8.8 |
6.2 |
6.7 |
8.2 |
Pan, Supari etc. |
3.7 |
3.5 |
4.7 |
-1.0 |
6.3 |
5.7 |
9.3 |
11.6 |
11.5 |
10.4 |
10.6 |
Fuel and Light |
7.9 |
4.8 |
3.0 |
2.9 |
4.0 |
6.9 |
7.4 |
7.2 |
6.3 |
8.0 |
8.0 |
Clothing, Bedding etc. |
9.8 |
3.3 |
3.4 |
2.8 |
2.7 |
3.1 |
2.6 |
2.1 |
2.6 |
2.8 |
2.8 |
Miscellaneous |
11.9 |
3.1 |
3.0 |
5.5 |
5.2 |
6.3 |
6.2 |
5.3 |
5.0 |
5.9 |
6.2 |
Memo: |
|
|
|
|
|
|
|
|
|
|
|
WPI Inflation (End of period) |
|
6.5 |
4.6 |
5.1 |
4.1 |
5.9 |
4.4 |
3.4 |
3.8 |
5.0 |
7.4 |
GDP Deflator based Inflation @ |
|
3.9 |
3.7 |
4.2 |
4.9 |
5.5 |
5.6 |
4.1 |
2.7 |
-- |
3.9 |
# : Data prior to January 2006 are based on the old series (Base: 1982=100).
* : January 2008. @ : Data for March pertain to full year. IW : Industrial Workers. UNME : Urban Non-Manual Employees. AL : Agricultural Labourers. RL : Rural Labourers. |
Asset Prices
Domestic equity prices, which had recorded further gains up to early-January 2008, witnessed sharp corrections thereafter on the back of heightened uncertainties in the global financial markets and concerns about some slowdown in the domestic economy (see Chapter V). Domestic gold prices, mirrored movements in international prices during 2007-08. Domestic gold prices
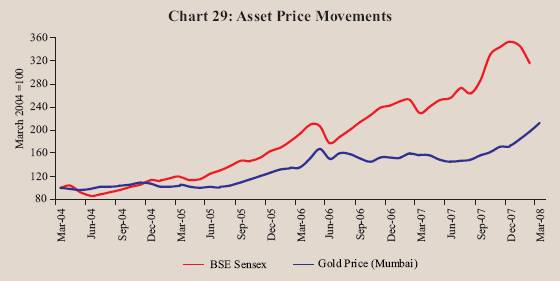
increased by about 36 per cent, y-o-y, to around Rs. 12,739 per 10 grams in March 2008 in line with movement in international prices, which increased by almost 48 per cent over the same period (Chart 29). International gold prices touched a peak of US $ 1,011 per ounce on March 17, 2008, reflecting weakening of US dollar, hardening of oil prices and increased investor interest following uncertainties surrounding the global financial markets.
|