Interest rates generally firmed up further across the spectrum during Q1 of 2011-12 as monetary
transmission strengthened in a liquidity deficit mode. Equity markets remained sluggish but
rallied towards the end of the quarter with valuations turning attractive. The Rupee exhibited
two-way movement. Financial asset prices generally remained range bound, though property
prices stayed on up-course in Q4 of 2010-11. Going forward, the possibility of delayed exit
from monetary easing by advanced economies, sovereign default risks in the Euro zone and the
possibility of rating downgrades for major economies will have ramifications for capital flows
and financial markets.
Global financial market conditions
remained tepid in Q1 of 2011-12
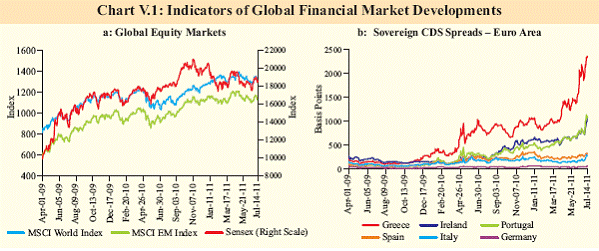
V.1 Global financial markets were generally
in a corrective mode since end-April 2011
(Chart V.1a). Stagnant real estate markets, high
unemployment and weak sovereign balance
sheets in Advanced Economies (AEs) continue
to pose major concerns for the financial markets.
In the IMF June 2011 Market Update of the
Global Financial Stability Report, a rise in the
financial risks was reported due to (i) downside
risks to the multi-speed recovery baseline; (ii)
concern about debt sustainability in Europe’s
periphery; and (iii) “search for yield” pushing
investors into riskier assets. The flattening of
yield curves in both AEs as well as Asian
Emerging Market Economies (EMEs),
particularly since end-March 2011 suggest
moderation in economic growth, albeit
differentially, during 2011-12.
Widening credit spreads, rating
downgrades reflect micro and macro
prudential risks
V.2 On an average, credit spreads widened
during Q1 of 2011-12 as balance sheet risks
came to fore. Sovereign Credit Default Swap
(CDS) spreads rose sharply in the Euro Area
following the accentuation of the Greek debt
crisis and the indications that the crisis may
spread from periphery to some core Euro zone
countries (Chart V.1b). Rating downgrades or
downward revision of outlook in case of the
US, Japan, Spain and Italy impacted financial
market confidence that were reflected in
widening spreads. Amplification of refinancing
risks in Greece and Portugal and the sharp fournotch
downward revision by Moody’s of
Portugal’s credit rating to junk status with a
negative outlook in early July reconfirmed the
Euro zone fragilities.
 |
V.3 Recapitalisation of the banking system in
the fragile Euro zone countries is the most
important element of an enduring Euro zone
solution. The stress tests conducted by the
European Banking Authority (EBA) have not
succeeded in restoring confidence amongst
investors and creditors. The EU needs to deal
with capital shortfalls for banks that fail stress
tests, but market access is limited for weaker
sovereigns like Greece, Portugal and Ireland.
On the other hand, with hardly any fiscal space
and the potential moral hazard risk from
bailouts, the solution is not easy. Euro zone risks
may lead to global financial market volatility.
Financial risks increased while interest
rates softened
V.4 While interest rates are firming up in the
Indian economy, global financial markets
witnessed rising financial risks and softening
interest rates in Q1 of 2011-12. Libors for 1-
month to 1-year tenors edged down marginally
even from the low prevailing rates. G-sec yields
across maturity spectrum eased by 30-50 bps
in 5-10 year segment for the US, the UK and
Germany. Falling interest rates co-existed with
(1) policy rate hikes by some AE central banks,
most notably by the ECB in April and again in
July, (2) rising sovereign and credit spreads and
(3) inflation in the AEs with escalating energy and food prices that have spilled over to rising
producer price and headline inflation. It remains
to be seen whether the movements in interest
rates reflect temporary overreaction or are on
the basis of expectations of future global
growth.
Indian financial markets remain orderly
and range bound
V.5 Even as domestic and global factors
resulted in two-way movements in the Indian
financial markets, asset price movements
remained broadly range-bound and orderly. This
was despite the challenges posed by persistent
inflation, tight liquidity conditions and
uncertainty in the international markets on
account of Greek sovereign debt crisis and
slowdown in AEs.
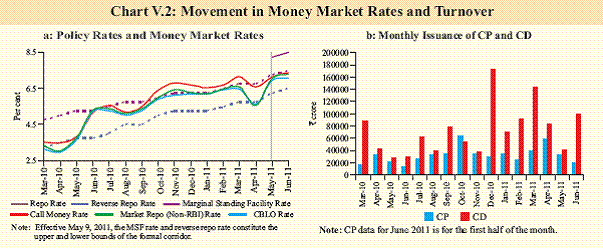
V.6 The call rate declined in the beginning of
Q1 of 2011-12 on the backdrop of surplus
liquidity, but firmed up thereafter, in step with
policy rate hikes since May 2011. The interest
rates on commercial paper (CP) and Certificates
of Deposit (CDs) moved in tandem with the
overnight money market rates. The yield curve
for Government securities (G-sec) shifted
upwards during the first two months of the
quarter in line with the policy rate hike, but
moderately shifted downwards in June 2011.
Table V.1: Stock Price Movement and PE Ratios in EMEs (Year-on-Year Variations) |
Items |
Stock Price Variations (Per Cent) |
P/E- Ratios |
End-Mar
2010@ |
End-Mar
2011@ |
End-Jun
2011* |
End-Mar
2010 |
End-Mar
2011 |
End-Jun
2011 |
1 |
2 |
3 |
4 |
5 |
6 |
7 |
Indonesia (Jakarta Composite) |
93.7 |
32.5 |
5.7 |
16.6 |
16.9 |
17.9 |
Brazil (Bovespa) |
71.9 |
-2.5 |
-9.0 |
16.2 |
10.9 |
9.8 |
Thailand (SET Composite) |
82.6 |
32.9 |
-0.6 |
12.4 |
13.3 |
13.3 |
India (BSE Sensex) |
80.5 |
10.9 |
-3.1 |
17.7 |
17.6 |
17.1 |
South Korea (KOSPI) |
40.3 |
24.4 |
-0.3 |
12.2 |
13.8 |
13.9 |
China (Shanghai Composite) |
31.0 |
-5.8 |
-5.7 |
23.0 |
16.3 |
15.4 |
Taiwan (Taiwan Index) |
52.0 |
9.6 |
-0.4 |
19.1 |
15.7 |
15.5 |
Russia (RTS) |
128.0 |
30.0 |
-6.7 |
9.0 |
8.4 |
7.6 |
Malaysia (KLCI) |
51.3 |
17.0 |
2.2 |
18.9 |
17.0 |
16.8 |
Singapore (Straits Times) |
69.9 |
7.6 |
0.5 |
13.4 |
10.3 |
10.5 |
@: Year-on-year variation. *: Variation Over End-March 2011.
Source: Bloomberg. |
 |
V.7 Stock prices fell during Q1 of 2011-12,
albeit at a lesser pace than that of other BRIC
nations, influenced by domestic and global
concerns. There was, however, some rally
towards the end of the quarter due to FII inflows.
The P-E ratio of Indian equities was higher than
those of other BRIC nations (Table V.1). On a
quarter-on-quarter basis, prices in the housing
market firmed up during Q4 in majority of cities
tracked by the Reserve Bank after showing signs
of moderation during Q3 of 2010-11.
Money market rates firm up on tight
liquidity and rate hikes but do not exhibit
signs of stress
V.8 Short-term rates moved up further, but
there were no signs of stress in money markets.
The interest rate movement tracked the 75 bps repo rate hike during the quarter and the tight
liquidity conditions. Monetary transmission
strengthened further during Q1 of 2011-12. The
call rate, which had declined in April 2011 on
the back of easing of liquidity conditions, firmed
up thereafter, in response to the increase in the
repo rate in May and June 2011 (Chart V.2a,
Table V.2). The rates in the collateralised
segments (i.e., CBLO and market repo) moved
in tandem with the call rate, but generally
remained below it.
Table V.2: Domestic Financial Markets at a Glance |
|
Money Market |
Bond Market |
Forex Market |
Stock Market Indices |
Call Rate* (Per cent) |
Market Repo Rate (Non-RBI)
(Per cent) |
CBLO Rate (Per cent) |
Commercial Paper WADR
(Per cent) |
Certificates of Deposit WAEIR (Per cent) |
G-Sec 10-year yield@(Per cent) |
Corporate Bonds Yield AAA 5-Yr bond (Per cent) |
Exchange Rate@@
(`/US$) |
CNX Nifty# |
BSE Sensex# |
1 |
2 |
3 |
4 |
5 |
6 |
7 |
8 |
9 |
10 |
11 |
Mar-10 |
3.51 |
3.32 |
3.15 |
6.29 |
6.07 |
7.94 |
8.61 |
45.50 |
5178 |
17303 |
Mar-11 |
7.15 |
6.56 |
6.46 |
10.40 |
9.96 |
8.00 |
9.23 |
44.99 |
5538 |
18457 |
Apr-11 |
6.58 |
5.55 |
5.63 |
8.62 |
8.66 |
8.05 |
9.25 |
44.37 |
5839 |
19450 |
May-11 |
7.15 |
7.05 |
6.94 |
9.49 |
9.30 |
8.31 |
9.48 |
44.90 |
5492 |
18325 |
Jun-11 |
7.38 |
7.30 |
7.06 |
10.15^ |
9.61 |
8.28 |
9.63 |
44.85 |
5473 |
18229 |
*: Average of daily weighted call money borrowing rates. #: Average of daily closing indices.
@: Average of daily FIMMDA closing rates. @@: Average of daily RBI reference rate.
^: As at mid-June 2011.
WADR: Weighted Average Discount Rate.
WAEIR: Weighted Average Effective Interest Rate. |
V.9 Transaction volumes in the CBLO and
market repo segments were higher during the
Q1 of 2011-12 than in the preceding quarter
(Table V.3). During the quarter, banks and
primary dealers were the major groups of
borrowers in the collateralised segments whereas mutual funds (MFs) contributed nearly
three-fourth of the total lending in CBLO, and
more than half in market repo segment. The
collateralised segment of the overnight money
market remained dominant, accounting for more
than 80 per cent of the total volume during Q1
of 2011-12.
Table V.3: Average Daily Volumes in Domestic Financial Markets |
(` crore) |
| |
Money Market |
Bond Market |
Forex
Market |
Stock
Market# |
LAF |
Call
Money |
Market
Repo |
CBLO |
Commercial
Paper* |
Certificates
of Deposit* |
G-Sec@ |
Corporate
Bond |
Inter-bank
(US$ mn) |
1 |
2 |
3 |
4 |
5 |
6 |
7 |
8 |
9 |
10 |
11 |
Mar-10 |
37,640 |
8,812 |
19,150 |
60,006 |
75,506 |
3,41,054 |
6,621 |
1,598 |
16,082 |
9,191 |
Mar-11 |
-80,963 |
11,278 |
15,134 |
43,201 |
80,305 |
4,24,740 |
8,144 |
1,314 |
22,211 |
7,276 |
Apr-11 |
-18,809 |
13,383 |
14,448 |
56,160 |
1,24,991 |
4,47,354 |
6,928 |
1,053 |
25,793 |
8,277 |
May-11 |
-54,643 |
10,973 |
15,897 |
40,925 |
1,21,221 |
4,33,287 |
7,356 |
691 |
24,167 |
6,668 |
Jun-11 |
-74,125 |
11,562 |
16,650 |
41,313 |
1,23,400^ |
4,23,767 |
12,844 |
1,168 |
19,099** |
6,404 |
*: Outstanding position. @: Average daily outright trading volume in Central Government dated securities.
#: Volumes in BSE and NSE. ^: As at mid-June 2011. **: Up to June 24, 2011.
Note: In col. 2, (-) ve sign indicates injection of liquidity while (+) ve sign indicates absorption of liquidity. |
V.10 With from strong growth in retail deposit
mobilisation, banks offered a relatively lower
rate of interest on CDs during 2011-12 so far
(up to June 17) compared with the previous
quarter. The CD issuance declined in Q1 of
2011-12. In contrast, the CP issuance increased.
The ‘leasing and finance’ and ‘manufacturing
companies’ were the major issuers of CPs
(Chart V.2b, V.3).
V.11 Primary yields on Treasury Bills (TBs)
firmed up during Q1 of 2011-12 in line with the spike in short-term interest rates (Table
V.4). The rise in yields reflected a sharp
increase in Government short-term borrowing,
through issuances of TBs over and above the
amount as per the indicative calendar
announced in March 2011 as also through
issuances of Cash Management Bills (CMBs)
to meet the unanticipated sharp cash flow
mismatches, particularly, in the wake of large
tax refunds.
Yield curve flattens with sharper rise at the
short end
V.12 Reflecting the larger than anticipated
issuances of TBs and CMBs by the
Government, and the higher than expected hike
in the Reserve Bank’s policy rate in May 2011,
the G-sec yield curve shifted up, particularly at
the short end, flattening the yield curve. The
rise in yields across the maturity spectrum also reflected the increase in the global commodity
prices, including crude oil, and persistent high
inflation. The yield curve, however, moved
downward thereafter in the wake of growth
concerns and moderation in crude oil prices
(Chart V.4a).
Table V.4: Treasury Bills in the
Primary Market |
Year/
Month |
Notified
Amount
(` crore) |
Average Implicit Yield at
Minimum Cut-off Price (Per cent) |
91-day |
182-day |
364-day |
1 |
2 |
3 |
4 |
5 |
2009-10 |
3,80,000 |
3.57 |
3.97 |
4.38 |
2010-11 |
3,03,000 |
6.18 |
6.48 |
6.56 |
Apr-11 |
30,000 |
7.32 |
7.60 |
7.65 |
May-11 |
44,000 |
8.05 |
8.24 |
8.25 |
Jun-11 |
53,000 |
8.21 |
8.19 |
8.32 |
Jul-11* |
20,000 |
8.16 |
8.27 |
8.27 |
*: Up to July 15, 2011. |
V.13 In the context of inflationary pressures
and tight liquidity conditions, the primary
market yields moved up. The weighted average
yield in primary auctions firmed up during Q1
of 2011-12 (Table V.5). The investor sentiment,
however, was largely sustained. The bid-cover
ratio stood in the range of 1.39-3.20 during Q1
of 2011-12 as against 1.39-3.87 during the
corresponding quarter of the previous year. In
view of the flattening yield curve, more long
dated securities were issued and accordingly,
the weighted average maturity of the dated
securities issued during Q1 of 2011-12
increased.
V.14 During 2011-12 so far (up to July 15,
2011), 13 States raised `31,773 crore on a gross
basis as compared with `28,210 crore raised
during the corresponding period of 2010-11.
V.15 The spreads of 5-year corporate bonds
over comparable G-secs decreased during
May 2011, reflecting the impact of
unanticipated increase in Government shortterm
borrowing. The spreads increased in June
mainly reflecting the hardening of corporate
bond yields (Chart V.4b).
Monetary transmission strengthens with
rates hardening in the credit market
V.16 Monetary policy transmission to credit
market strengthened further during Q1 of 2011-
12 as banks increased their deposit and lending
rates in response to the increase in the policy
rate by the Reserve Bank (Table V.6). During
Q1 of 2011-12, deposit rates of banks were
increased in the range of 10-300 basis points
(bps) across all maturities. Twenty-three major
banks accounting for around 65 per cent of the
total bank deposits raised their deposit rates in
the range of 25-175 bps. The rise in deposit rates
was relatively sharper for maturities up to 1 year
for all categories of banks. As savings account
deposits constitute around a quarter of total
deposits, the 50 bps hike in the savings deposit
rate also increased the cost of funds for the
banks. During the quarter, all scheduled commercial banks increased their Base Rates
in the range of 25-225 bps, of which 47 major
banks with a credit share of around 98 per cent
raised their Base Rates by 50-125 bps.
Table V.5: Issuances of Central and State
Government Dated Securities |
Item |
2009-10 |
2010-11 |
2011-12* |
1 |
2 |
3 |
4 |
Central Government |
|
|
|
Gross amount raised (` crore) |
4,51,000 |
4,37,000
|
1,59,000 |
Devolvement on Primary
Dealers (` crore) |
7,219 |
5,773 |
1,506 |
Bid-cover ratio (range) |
1.44-4.32 |
1.39-3.88 |
1.39-3.20 |
Weighted average maturity (years) |
11.16 |
11.62 |
12.35 |
Weighted average yield (per cent) |
7.23 |
7.92 |
8.38 |
State Governments |
|
|
|
Gross amount raised (` crore) |
1,31,122 |
1,04,039 |
31,773 |
Cut-off yield range (per cent) |
7.04-8.58 |
8.05-8.58 |
8.36-8.69 |
Weighted average yield (per cent) |
8.11 |
8.39 |
8.57 |
*: Up to July 15, 2011. |
Table V.6: Deposit and Lending Rates of Banks |
(Per cent) |
|
Sep-10 |
Dec-10 |
Mar-11 |
Jun-11 |
1 |
2 |
3 |
4 |
5 |
Domestic Deposit Rate (1-3 years tenor) |
|
|
|
|
(i) Public Sector Banks |
6.75-7.75 |
7.00-8.50 |
8.00-9.75 |
8.25-9.75 |
(ii) Private Sector Banks |
6.50-8.25 |
7.25-9.00 |
7.75-10.10 |
8.00-10.50 |
(iii) Foreign Banks |
3.00-8.00 |
3.50-8.50 |
3.50-9.10 |
3.50-10.00 |
Base Rate |
|
|
|
|
(i) Public Sector Banks |
7.50-8.25 |
7.60-9.00 |
8.25-9.50 |
9.25-10.00 |
(ii) Private Sector Banks |
7.00-8.75 |
7.00-9.00 |
8.25-10.00 |
8.50-10.50 |
(iii) Foreign Banks |
5.50-9.00 |
5.50-9.00 |
6.25-9.50 |
6.25-9.50 |
Median Lending Rate* |
|
|
|
|
(i) Public Sector Banks |
7.75-13.50 |
8.75-13.50 |
8.88-14.00 |
- |
(ii) Private Sector Banks |
8.00-15.00 |
8.25-14.50 |
9.00-14.50 |
- |
(iii) Foreign Banks |
7.25-13.00 |
8.00-14.50 |
7.70-14.05 |
- |
* : Median range of interest rates at which at least 60 per cent of business has been contracted.
-: Not available.
Note: Bank group-wise variations in deposit interest rates worked out from the table would differ from those reported
in the text as the
latter are based on bank-wise and tenor-wise variations in deposit interest rates. |
Exchange rate remains flexible with less
volatility
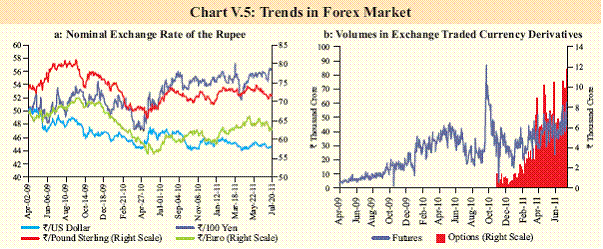
V.17 During 2011-12 so far (up to July 20,
2011), the rupee appreciated marginally
against all major currencies barring the
Japanese Yen, reflecting in part the dollar’s
movement in the international currency
markets due to uncertainty of growth prospects
in the US (Chart V.5a). The average daily
turnover in the interbank segment of the
foreign exchange market was higher while it was lower in the merchant segment than that
in the preceding quarter. The 1-month, 3-month
as well as 6-month forward premia declined
significantly during the quarter, reflecting an
increased supply by exporters in the forward
market. The Reserve Bank did not intervene
in the forex market during 2011-12 so far.
V.18 The average daily turnover in the
exchange traded currency derivatives grew by
1.7 per cent when compared with the negative
growth of 2.8 per cent in the previous quarter
(Chart V.5b). Options recorded a higher growth
rate than futures. In the OTC currency
derivatives, the swap segment continued to
dominate. The average daily turnover in the OTC market grew by around 14.8 per cent
during Q1 of 2011-12 as compared with a
negative growth of 3.7 per cent during the
previous quarter.
 |
Table V.7: Key Stock Market Indicators |
Indicator |
BSE Sensex |
NSE Nifty |
2010-11 |
Apr-Jun
2011-12 |
2010-11 |
Apr-Jun
2011-12 |
1 |
2 |
3 |
4 |
5 |
BSE Sensex/NSE Nifty |
|
|
|
|
(i) End-period |
19445.22 |
18845.87 |
5833.75 |
5647.40 |
(ii) Average |
18605.18 |
18617.73 |
5583.54 |
5585.97 |
Coefficient of Variation |
6.32 |
3.28 |
6.40 |
3.31 |
Price-Earning Ratio@ |
21.25 |
19.94 |
22.14 |
20.82 |
Price-Book Value Ratio |
3.70 |
3.48 |
3.70 |
3.50 |
Market Capitalisation to
GDP Ratio (per cent)@ |
86.80 |
74.90 |
85.10 |
73.20 |
@: As at end-period.
Source: Bombay Stock Exchange Ltd. (BSE) and National Stock
Exchange of India Ltd. (NSE). |
Equity markets remained sluggish and less
volatile
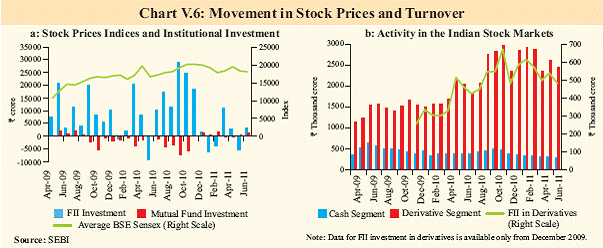
V.19 Volatility in equity markets declined
substantially in the post-crisis period. This
declining trend continued into Q1 of 2011-12.
Although, in relative terms, the performance of
the Indian equity markets was better than that of
other BRIC nations during Q1, the two key
indices, Sensex and Nifty, declined by about 3
per cent (Table V.7). Rising crude oil prices,
persistently high inflation, successive policy rate
hikes by the Reserve Bank, domestic political
developments and the worsening Greek
sovereign debt crisis affected market sentiment negatively. Net investment by FIIs in equity and
debt segments was US$ 1.0 billion during Q1 of
2011-12, of which flows to equity market
amounted to US$ 0.8 billion (Chart V.6). Equity
markets, however, rallied towards end-June with
a revival in FII investments.
 |
V.20 Stock price returns are affected by stock
return volatility, and the extent of impact
depends crucially on the permanence of shocks
to the variance in returns. An analysis of the
returns from the broad based S&P CNX Nifty
index against the backdrop of the financial crisis
and monetary policy action demarcates the time
varying volatility persistence in the returns data
(Chart V.7 a and b). The variability in returns,
controlling for all other past factors, shows a
sharp decline from the crisis period and appears
to be moderating.
V.21 Turnover in the equity derivatives
segment constituting almost 90 per cent of the
overall investments, witnessed some
moderation during Q1 of 2011-12. Volatility in
Nifty index options as measured by the India
Volatility Index (VIX) was lower in Q1 of 2011-
12 than Q4 of 2010-11.
V.22 The resource mobilisation in the primary
segment of the domestic capital market through
public issues was lower during Q1 of 2011-12
than the corresponding quarter of the previous
year (Table V.8). Poor performance of the IPOs
after their listing affected investor and promoter
sentiments.
V.23 Resource mobilisation by mutual funds
during April-June 2011 was higher than that
during the corresponding period of the previous
year, although there were net outflows during
May-June 2011, particularly in debt mutual
funds. The increase in dividend distribution tax
for non-retail investors in liquid/debt mutual
funds effective from June 1, 2011 and the cap
of 10 per cent of net worth placed on banks’
investment in liquid/debt funds which will be
made effective over a six-month period
beginning July 5, 2011, could have affected
flows into debt mutual funds.
Table V.8: Resource Mobilisation from
Capital Market |
(` crore) |
Category |
2010-11
(Apr-Mar) |
2010-11
(Apr-Jun) |
2011-12
(Apr-Jun) |
1 |
2 |
3 |
4 |
Prospectus and Rights Issues* |
37,620 |
7,737 |
7,000 |
1. Private Sector (a+b) |
24,831 |
7,737 |
2,422 |
(i) Financial |
4,335 |
2,550 |
901 |
(ii) Non-financial |
20,496 |
5,187 |
1,521 |
2. Public Sector |
12,790 |
0 |
4,578 |
Euro Issues |
9,441 |
4,844 |
1,237 |
Mutual Fund |
|
|
|
Mobilisation(net)@ |
-49,406 |
3,547 |
73,039 |
1. Private Sector |
-19,215 |
14,109 |
64,425 |
2. Public Sector# |
-30,191 |
-10,562 |
8,614 |
*: Excluding offer for sale.
@: Net of redemptions.
#: Including UTI Mutual fund.
Source: Mutual Fund data are sourced from SEBI and exclude
funds
mobilised under Fund of Funds Schemes. |
Housing prices and transaction volumes
rise in Q4 of 2010-11
V.24 Property prices increased during 2010-11,
despite firming up of mortgage rates. The
Reserve Bank’s Quarterly House Price Index
(HPI) based on data in respect of seven cities
collected from the Department of Registration
and Stamps (DRS) of the respective State
Governments show that house prices in five of
the seven major cities were higher on a quarterover-
quarter basis in Q4 of 2010-11, but were
flat in Ahmedabad and had continued to fall in
Chennai (Chart V.8). The data on volume of
transactions show that after stalling in Q3,
transactions increased during Q4 of 2010-11.
On a year-on-year basis, there has been an
increase in housing prices in Q4 in six cities
(i.e., barring Chennai). Housing transactions,
however, fell in five of the seven cities (i.e.,
barring Delhi and Mumbai).
Market volatility could resurface if macro
conditions deteriorate
V.25 The subdued current market volatility is
no guidance for future. Financial market
volatility can return if macro conditions worsen.
V.26 Indian financial markets would continue
to be influenced by the global as well as
domestic factors. Money market rates would
continue to be conditioned by monetary policy actions. If prolonged inflation feeds into
inflationary expectations, it would affect all
segments of the markets, particularly the
G-sec markets. A widening of the fiscal
deficit leading to a higher than budgeted market borrowings could also exert upward
pressure on G-sec yields. A slowdown in
economic growth could affect corporate
performance which, in turn, would weigh on
equity markets.
|