Policy actions, both domestic and global, augured well for the Indian financial markets in
Q3 of 2012-13. With aggressive monetary-easing measures by central banks of advanced
economies and some policy initiatives in distressed euro area economies, capital flows surged
into emerging economies. The Indian rupee and equity markets greatly benefitted from the
improved investor optimism. Despite the domestic macroeconomic stress, expectations of a
turnaround in the economy drove the rally in the Indian markets. Improved investor confidence
was also visible from the pick-up in the IPO market after a subdued year.
Global financial markets improve on
euro area policy action and fiscal cliff
agreement
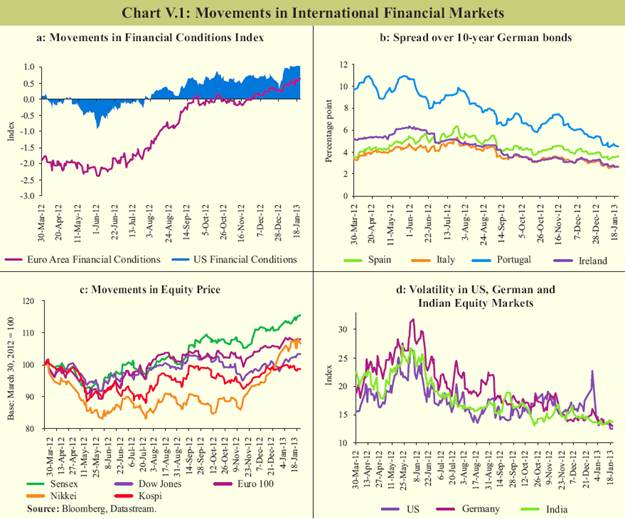
V.1 International financial market conditions
improved in Q3 of 2012-13 despite a fragile
global economic outlook. Recent financial
market developments indicate a perceived
reduction in some major downside risks to
the world economy. The easing of stress
can be seen in the positive streak shown by
Bloomberg’s Composite Financial Conditions
Index (BFCIUS Index) that tracks the overall
stress in money, bond, and equity markets,
thereby enabling assessment of the availability
and cost of credit (Chart V.1a).
V.2 The possibility of a near-term
worsening of the euro area crisis also
appears to have declined following new
policy announcements and the extension
of financial help to troubled periphery
economies. In December 2012, the euro area
finance ministers empowered the European
Central Bank (ECB) as the common bank
supervisor from 2014. They also approved
€39.5 billion aid to Spanish banks. International
leaders also agreed upon a deal to again
restructure Greece’s debt, with further large
hair cuts that paved the way for the release
of €34.4 billion in aid payment. Following
these developments, credit default swap
(CDS) spreads for European economies have
reduced.
V.3 With the improvement in borrowing
conditions in the financial markets, the 10-year
G-sec interest rate spread between distressed
euro area countries such as Spain, Italy, Ireland
and Portugal, and Germany declined (Chart
V.1b). The Italian and Spanish governments
were also able to raise longer-maturity debt
from the markets with improvements in
funding conditions.
V.4 Global equity prices showed major
gains in 2012, as investor preference to hold
risky assets increased following quantitative
stimuli announced by major central banks,
despite weak corporate earnings. The minifiscal
deal clinched by the US also aided the
rally in global markets in 2013 so far (Chart
V.1 c). Stock market uncertainty, as measured
by implied volatility, also decreased during the
period under review (Chart V.1d).
AE central banks’ unconventional policy
stimuli boost market sentiments
V.5 Unprecedented monetary stimuli by
central banks of advanced economies (AEs),
which include QE3 and recently announced
additional purchase of long-term treasury
securities to the tune of US$ 45 billion per month
by the US Federal Reserve (Fed), the outright
monetary transactions (OMT) programme by
the ECB and the asset purchase programme by
the Bank of Japan (BoJ), as well as measures
taken by the European Union to contain the euro area debt crisis, have helped revive global
financial market sentiments. Concomitantly,
the balance sheets of these central banks have
expanded significantly (Chart V.2).
 V.6 Despite the positive impact of central
banks’ unconventional monetary policy actions, the future impact of such policy is of concern as
latter rounds of QE had a subdued effect (Chart
V.3a). Monetary policy stimuli in Q4 of 2012
did not necessarily have a dampening effect on
the long-term treasury yield in the US (Chart
V.3b). This could be because, in the absence
of a credible long-term fiscal consolidation
plan, yields may have become less responsive
to central bank actions. On the whole, the
evaluation of the success of QE would require
further research.
Buoyant capital flows drive asset prices in
EMDEs
V.7 Excessive global liquidity arising from
the easy monetary policy pursued by central
banks in AEs, along with the lack of investment
opportunities, channelled funds into the
emerging market and developing economies (EMDEs) in search of higher returns. India and
other Asian countries, such as South Korea,
Philippines and Thailand, received higher FII
inflows in 2012 than in 2011 (Chart V.4).
V.8 Apart from the push factors discussed
above, various pull factors emanating from
domestic factors, such as the continued
dependence of the Indian economy on
domestic consumption unlike other exportdriven
economies and the relatively stable
earnings of listed companies, aided the surge
in flows into India. The domestic reform
measures announced by the government since
mid-September 2012 also boosted investor
sentiments. Indian equity markets showed
significant turnaround, while the rupee
remained range-bound.
Money markets remained stable despite
liquidity deficit
V.9 Notwithstanding tight liquidity
conditions due to advance tax payments,
high government cash balances and rise in
currency in circulation, the weighted average
call money rate generally remained around the
repo rate in Q3 of 2012-13. The rates in the
collateralised segments i.e., CBLO and market
repo, which constitute the predominant share
(around 80 per cent) of the overnight money
market, moved in tandem with the call money
rate (Chart V.5).
V.10 The amount of outstanding certificates
of deposits (CDs) witnessed a fall during 2012-
13. The weighted average effective interest rate (WAEIR) of aggregate CD issuances decreased
to 8.7 per cent at end-December 2012 from
11.1 per cent at end-March 2012 (Table V.1).
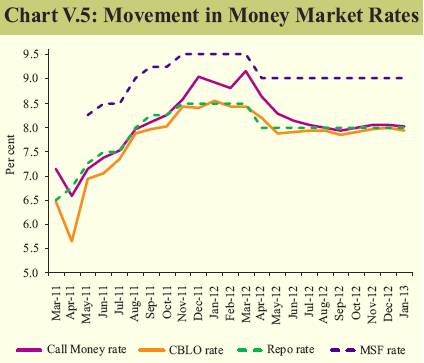
Table V.1: Average Daily Volume in Domestic Financial Markets |
(in ` billion) |
Month |
Money Market |
Bond Market |
Forex Market inter-bank (US$ bn) |
Stock
Market ## |
LAF |
Call Money |
Market Repo |
CBLO |
Commercial Paper* |
Certificates of Deposits* |
G-Sec** |
Corporate Bond# |
1 |
2 |
3 |
4 |
5 |
6 |
7 |
8 |
9 |
10 |
11 |
Mar-12 |
–1574 |
175 |
112 |
380 |
912 |
4195 |
99 |
26 |
21 |
152 |
Jun-12 |
–913 |
152 |
180 |
376 |
1258 |
4252 |
258 |
30 |
19 |
117 |
Sep-12 |
–517 |
143 |
185 |
502 |
1706 |
3572 |
260 |
36 |
21 |
143 |
Oct-12 |
–671 |
150 |
218 |
436 |
1941 |
3531 |
230 |
39 |
20 |
139 |
Nov-12 |
–941 |
141 |
207 |
368 |
1994 |
3066 |
157 |
25 |
18 |
128 |
Dec-12 |
–1231 |
142 |
147 |
398 |
1818 |
3328 |
197 |
28 |
19 |
145 |
*: Outstanding position. ** : Average daily outright volume traded in central government dated securities.
# : Average daily trading in corporate bonds. ## : Average daily turnover in BSE and NSE.
Note: (–) ve figure under LAF indicates injection of liquidity into the system. |
V.11 Increased risk aversion by banks to lend
to the corporate sector, as evident from the
moderation in credit off-take, also manifested
in a significant uptick in the size of fortnightly
issuance of commercial paper (CP). The
weighted average discount rate (WADR) of
aggregate CP issuances decreased to 9.0 per
cent at end-December 2012 from 12.2 per cent
at end-March 2012.
Yield curve gets inverted on economic slack
and as borrowing programme stays on track
V.12 During Q3 of 2012-13, G-sec yields
firmed up in October, but declined markedly since December, with bonds rallying in
response to four major factors. First, the
market assessed that the year may pass
without additional market borrowing.
Second, expectations of a rate cut were built
on moderating inflation. Third, resumption
of OMO purchases by the Reserve Bank
also led to a rally in G-sec market. Fourth,
on review of the government’s cash position,
the auction of dated securities scheduled
for January 4, 2013 got postponed to late
February 2013, which also caused the
yields to soften. The 10-year generic yield
declined from 8.63 per cent at end-March
2012 to 7.99 per cent on January 1, 2013 and
further to 7.88 per cent as on January 24, 2013
(Chart V.6).
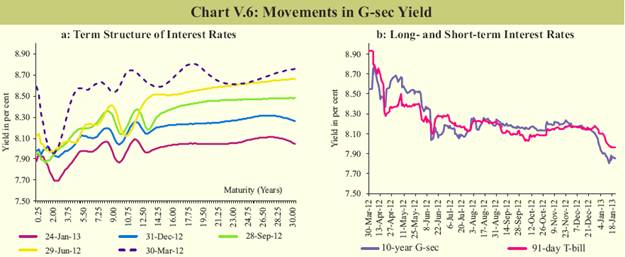 V.13 However, during Q3, the fall in short
term yields was not as significant, largely on
account of persistent tightness in liquidity
and the government’s decision to increase
the quantity of T-bill issuances during the last
quarter of the fiscal. With the spread between
the yield on the 10-year G-sec and 91-day
T-bill turning negative, the G-sec market
showed an inverted yield curve. During
the financial year, up to January 21, 2013,
the weighted average maturity of the dated
securities issued has increased to 13.5 years
from 12.5 years during the corresponding
period last year. The bid-cover ratio stood in
the range of 1.36-4.10 as against 1.39-5.12 in
the previous year (Table V.2).
V.14 In the same period, 27 states have
raised `1.3 trillion on a gross basis compared
with around `1.1 trillion raised during the
corresponding period of the previous year.
Rupee exchange rate remained range
bound in Q3 of 2012-13
V.15 Various reform measures, including
liberalised FDI limits for certain sectors and
the announcement of a fiscal consolidation
path, enhanced global investor confidence
in the Indian economy. This, along with
announcements of quantitative easing by the
US Fed and the BOJ, boosted capital inflows
to India and aided the recovery of the rupee.
Table V.2: Issuances of Central and State
Government Dated Securities |
Item |
2011-12 |
2012-13* |
1 |
2 |
3 |
Central Government |
|
|
Gross amount raised (` billion) |
5,100.0 |
5,220.0 |
Devolvement on primary dealer (` billion) |
121.1 |
18.3 |
Bid-cover ratio (range) |
1.39-5.12 |
1.36-4.10 |
Weighted average maturity (years) |
12.66 |
13.48 |
Weighted average yield (per cent) |
8.52 |
8.39 |
State government |
|
|
Gross amount raised (` billion) |
1,586.3 |
1,312.3 |
Cut-off yield range (per cent) |
8.36-9.49 |
8.58-9.31 |
Weighted average yield (per cent) |
8.79 |
8.92 |
* Up to January 21, 2013. |
Following the significant appreciation in
September 2012, the rupee movement turned
range bound with a weakening bias, reflecting
the wide trade deficit (Chart V.7).
V.16 As on January 23, 2013, the rupee
showed lower depreciation over end-March
2012 compared to other major EMDEs
like Brazil, South Africa and Argentina
(Table V.3).
Table V.3: Movement in Exchange Rates of Select EMDEs against the US dollar |
Appreciation (+)/Depreciation (-) in per cent |
Currency |
2010-11 |
2011-12 |
Jan 23, 2013
over end-
March 2012 |
1 |
2 |
3 |
4 |
|
Current Account Deficit Countries |
|
|
|
1. |
Brazilian Real |
9.7 |
-10.8 |
-10.4 |
2. |
Indian Rupee |
1.1 |
-12.7 |
-4.9 |
3. |
Mexican Peso |
4.3 |
-7.0 |
1.2 |
4. |
South African Rand |
8.0 |
-11.5 |
-14.3 |
5. |
Turkish Lira |
-4.8 |
-10.5 |
0.6 |
|
Current Account Surplus Countries |
|
|
|
1. |
Argentina |
-4.3 |
-7.5 |
-11.7 |
2. |
Indonesian Rupiah* |
4.7 |
-5.1 |
-4.7 |
3. |
Malaysian Ringgit |
8.2 |
-1.4 |
1.0 |
4. |
South Korea Won |
2.2 |
-2.7 |
6.9 |
5. |
Thai Baht |
6.7 |
-1.8 |
3.6 |
6. |
Russian Rouble |
3.4 |
-2.8 |
-3.0 |
7. |
Euro |
5.4 |
-6.0 |
-0.2 |
8. |
China |
4.1 |
4.2 |
0.3 |
*: Since Q4 of 2011 Indonesia has turned into a current account deficit country. |
Domestic equity markets firmed up as
market liquidity improved with FII flows
V.17 As on January 24, 2013, the domestic
equity markets witnessed a y-o-y gain of 17.2
per cent with a 6.2 per cent gain over end-
September 2012. Following the global equity
market rally driven by a spate of generally
better international economic data and policy
actions, the Indian bourses also picked up. The
BSE Sensex and S&P CNX Nifty crossed the
20,000 and 6,000 mark, respectively after two
years. The BSE Sensex closed at 19,924 on
January 24, 2013.
V.18 Various factors, including recent reform
measures such as the diesel price hike, cap on
subsidised LPG, permission for FDI in retail
and aviation and the passing of the Banking
Laws (Amendment) Bill, 2011 in Parliament,
along with hopes of a cut in the policy rate by the
Reserve Bank in January 2013, and sustained
FII inflows helped revive the domestic equity
market.
V.19 Market indicators, such as market
capitalisation and daily turnover, have shown
an increasing trend in 2012, reflecting the
positive sentiment in the Indian stock market.
Further, the PE ratio of the BSE Sensex
increased in 2012, indicating a rise in the
valuation of Indian stock over the year.
V.20 During 2012-13 (up to January 23,
2013), FIIs made net investments of `1,190
billion in the capital market (both equity and
debt) compared with that of `520 billion during
the corresponding period in the previous year.
FIIs made net investments of `1,011 billion in
the equity markets compared with `27 billion
last year.
V.21 Domestic institutional investors
(DIIs) (comprising banks, domestic financial
institutions, insurance companies, new
pension fund and mutual funds) made net
sales during 2012-13 (up to January 23, 2013)
(Chart V.8).
Bankex outperformed Sensex
V.22 As at end-December 2012, the BSE
Bankex, which represents major banks in
India, recorded much higher y-o-y gains
of 57 per cent than the BSE Sensex (26
per cent), despite concerns about modest
loan growth, deterioration in asset quality
and alleviated risks. The factors that
influenced the BSE Bankex favourably
are the strong balance sheet performance
by some private sector banks, stable net
interest margin owing to a reduction in
the CRR by 175 basis points of NDTL and
expectation of treasury profit as bonds rallied.
The Bankex also benefitted from the positive
sentiments in the overall Indian equity
markets.
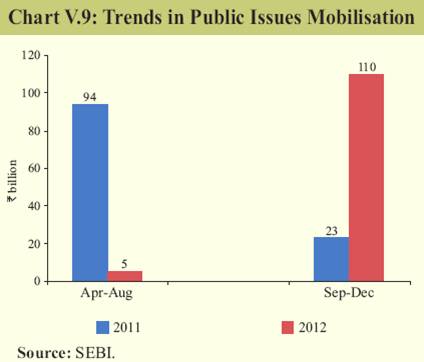
Table V.4: House Price and Transaction Volume Indices (Base Q4:2008-09 = 100) |
Quarter |
Mumbai |
Delhi |
Bengaluru |
Ahmedabad |
Lucknow |
Kolkata |
Chennai* |
Jaipur |
Kanpur |
All India |
1 |
2 |
3 |
4 |
5 |
6 |
7 |
8 |
9 |
10 |
11 |
House Price Index |
|
|
|
|
|
|
|
|
|
|
Q1:2011-12 |
191.6 |
152.8 |
116.9 |
152.3 |
149.3 |
157.0 |
106.3 |
161.1 |
135.4 |
152.0 |
Q2:2011-12 |
206.1 |
153.0 |
116.0 |
162.8 |
159.2 |
159.0 |
113.9 |
165.1 |
138.3 |
157.8 |
Q3:2011-12 |
191.7 |
168.6 |
146.1 |
171.8 |
172.3 |
155.0 |
120.3 |
163.5 |
140.0 |
164.1 |
Q4:2011-12 |
224.7 |
195.3 |
140.6 |
177.2 |
169.7 |
158.4 |
117.0 |
164.4 |
148.7 |
176.9 |
Q1:2012-13 |
231.8 |
217.3 |
140.2 |
176.6 |
179.4 |
204.2 |
133.9 |
171.9 |
144.9 |
188.6 |
Q2:2012-13 |
232.4 |
225.2 |
143.0 |
183.4 |
208.9 |
226.9 |
129.5 |
177.7 |
135.8 |
194.3 |
Growth in per cent |
|
|
|
|
|
|
|
|
|
|
y-o-y |
12.8 |
47.2 |
23.2 |
12.7 |
31.3 |
42.7 |
13.7 |
7.6 |
–1.8 |
23.1 |
q-o-q |
0.3 |
3.6 |
2.0 |
3.9 |
16.4 |
11.1 |
–3.3 |
3.4 |
–6.3 |
3.0 |
House Transactions Volume Index |
|
|
|
|
|
|
|
|
|
|
Q1:2011-12 |
89.5 |
149.4 |
100.8 |
134.3 |
93.9 |
107.9 |
80.3 |
243.1 |
208.4 |
123.2 |
Q2:2011-12 |
79.0 |
165.5 |
123.5 |
154.1 |
106.7 |
139.2 |
85.5 |
239.1 |
131.1 |
129.1 |
Q3:2011-12 |
75.9 |
195.9 |
84.6 |
131.2 |
165.1 |
108.9 |
130.9 |
222.0 |
120.6 |
128.9 |
Q4:2011-12 |
108.6 |
149.8 |
70.8 |
122.2 |
153.0 |
128.5 |
99.0 |
247.5 |
172.1 |
126.5 |
Q1:2012-13 |
153.2 |
133.6 |
81.6 |
140.1 |
151.9 |
98.2 |
80.9 |
296.7 |
154.9 |
134.6 |
Q2:2012-13 |
100.4 |
142.6 |
112.6 |
130.5 |
233.7 |
96.9 |
68.2 |
322.6 |
409.2 |
145.4 |
Growth in per cent |
|
|
|
|
|
|
|
|
|
|
y-o-y |
27.1 |
–13.8 |
–8.8 |
–15.3 |
119.1 |
–30.4 |
–20.2 |
34.9 |
212.1 |
12.6 |
q-o-q |
–34.5 |
6.7 |
38.0 |
–6.9 |
53.9 |
–1.3 |
–15.7 |
8.7 |
164.1 |
8.0 |
Note: *Chennai index is based on both residential and commercial properties.
All-India index is a weighted average of city indices, weights based on population proportion. |
Signs of IPO market revival in December
2012 after a subdued period
V.23 During September–December 2012,
`110 billion was mobilised through 18 issues
compared to `23 billion mobilised through
11 issues during the corresponding period
last year (Chart V.9). Various measures taken
by SEBI, such as allowing qualified foreign
investors (QFIs) to invest in the primary as
well as secondary markets, electronic initial
public offers (e-IPOs), requiring companies to
attain the minimum public shareholding of 25
per cent by June 2013, introduction of the Rajiv
Gandhi Equity Savings Scheme, 2012 and the
disinvestment programme by the government
may also enhance primary market activity.
House prices show slight moderation, but
with increasing volumes
V.24 The annual growth in the Reserve
Bank’s quarterly House Price Index at the all-
India level remains strong at 23 per cent in
Q2 of 2012-13. The q-o-q increase, however,
moderated to 3 per cent, the lowest in the past
seven quarters. Transaction volumes have picked up and showed an annual growth of
over 12 per cent in Q2 (Table V.4).
Markets improve, but uncertainty still
significant for 2013
V.25 Reduced fiscal space in several AEs and
limited scope for monetary policy actions due to
the enlarged balance sheets of central banks are
expected to keep sentiments and markets range
bound. The stress in the global financial markets
has eased in view of reduced uncertainties in
the euro area and the temporary resolution of
the fiscal cliff in the U.S. However, a credible
fiscal consolidation by the US can generate a
more significant impact. Quantitative easing
by the AEs has translated into higher capital
flows to EMDEs, including India, which may
witness some moderation going forward, but
is nevertheless, likely to remain positive in the
near term.
V.26 Looking at domestic factors, commitment
to reforms and efforts for sustainable fiscal
consolidation would provide a positive impetus
to the markets. Stronger signs of global and
domestic recovery are crucial to support
investor optimism. |