Press Release RBI Working Paper Series No. 02
Financial Structures and Economic Development in India: An Empirical Evaluation
@Satyananda Sahoo ';Finance is, as it were, the stomach of the country, from which all the other organs take their tone.';
- William Ewart Gladstone, 1858 Abstract 1The paper empirically evaluates the role of financial structures in economic development of India. An assessment of various indicators of financial development reveals that both the bank-based and market-based intermediation processes have undergone remarkable improvements in the last six decades. While credit disbursement by Indian banks has increased sharply in the past decades, it is still far below the world average level and even below the level in its EDEs peers. However, in the recent years, the market capitalization of Indian stock market has increased sharply reflecting more reliance on market-based sources of funding. One-way Granger causality running from private sector credit to real GDP confirms the supply-leading process of bank intermediation, while the ARDL cointegration test suggests that both the bank-based and market-based financial deepening have positive roles in driving India’s economic development. The findings indicate that in a relatively bank-centric financial sector, Indian banks have the potential of further channelization of credit to the productive sectors of the economy. Key Words: Financial institutions, economic development JEL Classification: G2, O16 I. INTRODUCTION The global financial crisis has posed renewed concerns on the role of financial structures in fostering economic development. As the growth momentum slowed down globally, policymakers around the world haveconfronted with increasingly difficult challenges. Governments and monetary authorities have had to manage the balance between fiscal and monetary policies notwithstanding the conflict between each other in achieving high growth and price stability together. Globally, policy makers also resorted to various crisis intervention measures and regulatory reforms to prevent derailment of the growth process, which could have a crucial impact on the structure of the financial system. As a result, the changing financial structure could further affect economic growth, volatility and financial stability (IMF, 2012). The recent crisis also raised concerns about the threshold level of financial deepening beyond which its impact on economic development is negligible. Furthermore, there has been a debate whether to rely on a bank-based or a market-based financial structure in fostering economic development. Against this backdrop, this study examines whether various forms of financial structure has a role in economic development of India. The role of the financial structures in economic development is not a new theme in the economics literature. More than a century ago, Schumpeter (1911) argued that financial markets play an important role in the growth process by channeling funds to the most efficient investors and by fostering entrepreneurial innovation. He developed his case in vivid language: “The banker… is not so much primarily a middleman in the commodity ‘purchasing power’ as a producer of this commodity… He stands between those who wish to form new combinations and the possessors of productive means. He is essentially a phenomenon of development, though only when no central authority directs the social process. He makes possible the carrying out of new combinations, authorizes people, in the name of society as it were, to form them. He is the ephor [overseer] of the exchange economy.” Subsequently, there have been two schools of thought with differing views on the role of finance in economic growth. Robinson (1952) argued that due to economic prosperity financial development passively follows economic growth by responding to the increasing demand for funds. Lucas (1988) rejected the finance-growth relationship by stating that finance as an “over-stressed” determinant of economic growth. It is, however, now widely recognized that the financial system contributes to economic growth by acting as an efficient conduit for allocating resources among competing uses. This view of the role of financial intermediation in the growth process has evolved over time. Till the late 1960s, the role of financial intermediaries in general, and banks in particular, in the process of economic growth of a country was largely ignored. Influential work during the late 1960s and early 1970s showed that there exists a strong positive correlation between financial development and economic growth and highlighted the negative impact of ‘financial repression’ on the growth process (Goldsmith, 1969; McKinnon and Shaw, 1973). Subsequently, it was argued on the basis of the tenets of endogenous growth theories that with positive marginal productivity of capital, development of financial markets induces economic growth in the short as well as the long run by improving efficiency of investment (Bencivenga and Smith, 1991). While the debate on causality is still unsettled, existing historical and econometric evidence suggests that better functioning financial markets, i.e., markets that are able to meet the needs of savers and investors efficiently, have a positive effect on future economic growth (King and Levine, 1993; Levine, et. al 1999; Levine, 2004). An efficient financial system has, thus, come to be regarded as a necessary pre-condition for higher growth. Propelled by this ruling paradigm, several developing countries undertook programs for reforming their financial systems. Since the late 1970s, financial sector reforms encompassing deregulation of interest rates, dismantling of directed credit, easing of policy pre-emptions and measures to promote competition in the market for financial services became an integral part of the overall structural adjustment programs in many developing economies. More recently, the weight of opinion has swung even further with financial intermediation being regarded as playing a greater role in economic growth than the traditional determinants (Gorton and Winton, 2002; Boyreau-Debray, 2001; Levine, 1997; and Levine, et. al 1999). The Indian financial sector has undergone radical transformation over the 1990s. Reforms have altered the organizational structure, ownership pattern and domain of operations of institutions and infused competition in the financial sector. This has forced financial institutions to reposition themselves in order to survive and grow. The extensive progress in technology has enabled markets to graduate from outdated systems to modern business processes, bringing about a significant reduction in the speed of execution of trades and in transaction costs. However, there is hardly any study that makes a clear comparison between the bank-based and market-based financial system in India and those examine the direction of causality between finance and growth. Against this backdrop, this paper argues that the financial sector in India can play a critical role in channeling resources among various sectors - either in a supply-leading or demand-following sequence or both - so as maximize and broad-base the economic development of India. The paper finds that although both forms of financial structure have positive contributions in economic progress, the bank-based financial deepening is found to be superior over the market-based one in driving economic development. The paper is structured as follows. Section II of the paper gives a brief summary of the various functions of the financial system and the mechanisms of transmission through which financial intermediation can enhance economic activity. Section III offers an inter-temporal analysis of banking and financial system developments in India since the 1980s. A brief survey of literature on the concerned issue is given in Section IV. The econometric method followed in the paper is discussed in Section V. Empirical analysis and a detailed econometric evaluation of the central argument of this paper referred to earlier is set out in Section VI. The final section, i.e., Section VII summarizes the paper and offers some concluding observations. II. FINANCIAL SYSTEM AND ECONOMIC DEVELOPMENT – THE LINKAGE Theoretical models show that financial instruments, markets, and institutions may arise to mitigate the effects of information and transaction costs. In emerging to ameliorate market frictions, financial arrangements change the incentives and constraints facing economic agents. Thus, financial system may influence saving rates, investment decisions, technological innovation, and hence long-run growth rates. A comparatively less well-developed theoretical literature examines the dynamic interactions between finance and growth by developing models where the financial system influences growth, and growth transforms the operation of the financial system. Furthermore, an extensive theoretical literature debates the relative merits of different types of financial systems. Some models stress the advantages of bank-based financial system, while others highlight the benefits of financial system that rely more on securities markets. Finally, some new theoretical models focus on the interactions between finance, aggregate growth, income distribution, and poverty alleviation. In all of these models, the financial sector provides real services, i.e., it ameliorates information and transactions costs. Thus, these models lift the veil that sometimes rises between the so-called real and financial sectors. The financial system interacts with real economic activity through its various functions by which it facilitates economic exchange. First, the financial system facilitates trade of goods and services. An efficient financial system reduces information and transaction costs in trade and helps the payments mechanism. Second, it increases saving mobilization by an improvement of the savers confidence. By facilitating portfolio diversification, financial intermediaries allow savers to maximize returns to their assets and to reduce risk. Third, it plays an important role in mobilizing funds and transforming them into assets that can better meet the needs of investors either by direct, market-based financing or by indirect, bank-based finance. Financial intermediaries transfer resources across time and space, thus allowing investors and consumers to borrow against future income and meet current needs. This enables deficit units (those whose current expenditures exceed current income) to overcome financing constraints and the difficulties arising from mismatches between income and expenditure flows. Fourth, financial institutions play an important role in easing the tension between savers’ preference for liquidity and entrepreneurs’ need for long-term finance. Therefore, at any given level of saving, an efficient financial system will allow for a higher level of investment by maximizing the proportion of saving that actually finances investment (Pagano, 1993). With an efficient financial system, resources will also be utilized more efficiently due to the ability of financial intermediaries to identify the most productive investment opportunities. Fifth, financial system plays an important role in creating a pricing information mechanism. By providing a mechanism for appraisal of the value of firms, financial system allows investors to make informed decisions about the allocation of their funds. Financial intermediaries can also mitigate information asymmetries that characterize market exchange. One party to a transaction often has valuable information that the other party does not have. In such circumstances, there may be unexploited exchange opportunities. In the case of a firm, information imperfections can result in sub-optimal investment. When a manager cannot fully and credibly reveal information about a worthy investment project to outside investors and lenders, the firm may not be able to raise the outside funds necessary to undertake such a project (Myers and Majluf, 1984). A market plagued by information imperfections, the equilibrium quantity and quality of investment will fall short of the economy’s potential. Financial intermediaries can mitigate such problems by collecting information about prospective borrowers. Sixth, the financial system can enhance efficiency in the corporate sector by monitoring management and exerting corporate control (Stiglitz, 1985). Savers cannot effectively verify the quality of investment projects or the efficiency of the management. Financial intermediaries can monitor the behavior of corporate managers and foster efficient use of borrowed funds better than savers acting individually. Financial intermediaries thus fulfill the function of “delegated monitoring” by representing the interests of savers (Diamond, 1984). Financial markets also can improve managerial efficiency by promoting competition through effective takeover or threat of takeover (Jensen and Meckling, 1976). Both market and bank-based financial systems have their own comparative advantages. The choice of a bank-based or market-based financial system emerges from firm-financing preferences, and efficiency of financial and legal systems (Chakraborty and Ray, 2005). For some industries at certain times of their development, market-based financing is advantageous. For example, financing through stock markets is optimal for industries where there are continuous technological advances and where there is little consensus on how firms should be managed. The stock market checks whether the manager's view of the firm's production is a sensible one. On the other hand, bank-based financing is preferable for industries which face strong information asymmetries. Financing through financial intermediaries is an effective solution to adverse selection and moral hazard problems that exist between lenders and borrowers (Holmstrom and Tirole, 1997). Banks, in particular, reduce costs of acquiring and processing information about firms and their managers and thereby reduce agency costs as they have developed expertise to distinguish between good and bad borrowers (Boyd and Prescott, 1986; Diamond, 1984). Furthermore, Boot and Thakor (1997) argue that bank lending is likely to be important when investors face ex post moral hazard problems, with firms of higher observable qualities borrowing from the capital market. In contrast, Allard and Blavy (2011) find that market-based economies experience significantly and durably stronger rebounds than the bank-based ones. Lee (2012) finds that in the US, the UK and Japan, the stock market played an important role in financing economic growth, whereas the banking sector played a more important role in Germany, France, and Korea. Furthermore, the banking sector and the stock market in each country were complementary to each other in the process of economic growth except for the US, where the two sectors were mildly substitutable. The abovementioned argument points out that bank-based finance system outperforms the market-based one for economies with underdeveloped capital market. However, economies that have both well-developed banking sector and capital market have an advantage of following any of the intermediation process. Furthermore, in times of crisis in either system, the other system can perform the function of the famous spare wheel (Duisenberg, 2001). III. FINANCIAL SYSTEM IN INDIA – STYLIZED FACTS Until the early 1990s, the role of the financial system in India was primarily restricted to the function of channeling resources from the surplus to deficit sectors. Whereas the financial system performed this role reasonably well, its operations came to be marked by some serious deficiencies over the years. The banking sector suffered from lack of competition, low capital base, low productivity and high intermediation cost. After the nationalization of large banks in 1969 and 1980, public ownership dominated the banking sector. The role of technology was minimal and the quality of service was not given adequate importance. Banks also did not follow proper risk management system and the prudential standards were weak. All these resulted in poor asset quality and low profitability. Among non-banking financial intermediaries, development finance institutions (DFIs) operated in an over-protected environment with most of the funding coming from assured sources at concessional terms. In the insurance sector, there was little competition. The mutual fund industry also suffered from lack of competition and was dominated for long by one institution, viz., the Unit Trust of India. Non-banking financial companies (NBFCs) grew rapidly, but there was no regulation of their asset side. Financial markets were characterized by control over pricing of financial assets, barriers to entry, high transaction costs and restrictions on movement of funds/participants between the market segments. Apart from inhibiting the development of the markets, this also affected their efficiency (RBI, 2003, 2004). Against this backdrop, wide-ranging financial sector reforms in India were introduced as an integral part of the economic reforms initiated in the early 1990s. Financial sector reforms in India were grounded in the belief that competitive efficiency in the real sectors of the economy will not be realized to its full potential unless the financial sector was reformed as well. Thus, the principal objective of financial sector reforms was to improve the allocative efficiency of resources and accelerate the growth process of the real sector by removing structural deficiencies affecting the performance of financial institutions and financial markets. The main thrust of reforms in the financial sector was on the creation of efficient and stable financial institutions and markets. Reforms in respect of the banking as well as non-banking financial institutions focused on creating a deregulated environment and enabling free play of market forces while at the same time strengthening the prudential norms and the supervisory system. In the banking sector, the focus was on imparting operational flexibility and functional autonomy with a view to enhancing efficiency, productivity and profitability, imparting strength to the system and ensuring accountability and financial soundness. The restrictions on activities undertaken by the existing institutions were gradually relaxed and barriers to entry in the banking sector were removed. In the case of non-banking financial intermediaries, reforms focused on removing sector-specific deficiencies. Thus, while reforms in respect of DFIs focused on imparting market orientation to their operations by withdrawing assured sources of funds, in the case of NBFCs, the reform measures brought their asset side also under the regulation of the Reserve Bank. In the case of the insurance sector and mutual funds, reforms attempted to create a competitive environment by allowing private sector participation. Reforms in financial markets focused on removal of structural bottlenecks, introduction of new players/instruments, free pricing of financial assets, relaxation of quantitative restrictions, improvement in trading, clearing and settlement practices, more transparency, etc. Reforms encompassed regulatory and legal changes, building of institutional infrastructure, refinement of market microstructure and technological upgradation. In the various financial market segments, reforms aimed at creating liquidity and depth and an efficient price discovery process. Reforms in the commercial banking sector had two distinct phases. The first phase of reforms, introduced subsequent to the release of the Report of the Committee on Financial System, 1992 (Chairman: Shri M. Narasimham), focused mainly on enabling and strengthening measures. The second phase of reforms, introduced subsequent to the recommendations of the Committee on Banking Sector Reforms, 1998 (Chairman: Shri M. Narasimham) placed greater emphasis on structural measures and improvement in standards of disclosure and levels of transparency in order to align the Indian standards with international best practices. During the last four decades, particularly after the first phase of nationalization of banks in 1969, there have been distinct improvements in the banking activities which strengthened the financial intermediation process. The total number of offices of public sector banks which was merely at 8262 in June 1969 increased to 62,607 as of June 2011 (Table 1). Similarly, there have been many fold increases in aggregate deposits and credit indicating existence of a vibrant bank-based financial system. Some interesting insights could be drawn while examining various indicators of financial development in India (Table 2). First, an important indicator of bank-based financial deepening, i.e., private sector credit has expanded rapidly in the past five decades thereby supporting the growth momentum. However, the domestic credit provided by the Indian banks still remains at an abysmally low as compared with major emerging market and developing economies (EDEs) and advanced economies (Table 3). Furthermore, the level of credit disbursement is also far below the world average levels. Therefore, there is scope for the Indian banks to expand their business to important productive sectors of the economy. Second, financial innovations have influenced velocity circulation of money by both reducing the transaction costs and enhancing the liquidity of financial assets. A relatively increasing value of velocity could be seen as a representative indicator of an efficient financial sector. Increasing monetization of the economy, which would be particularly relevant for EDEs, may imply falling money velocity. In Indian case, the velocity circulation of broad money has fallen since 1970s partly reflecting the fact that, in the midst of crisis, money injected to the system could not get distributed efficiently from the banking system to non-banks. Sharper fall in the velocity of narrow money reflected reluctance among banks as well as the public to part with liquidity (Pattanaik and Subhadhra, 2011). Third, the market-based indicator of financial deepening, i.e., market capitalization-to-GDP ratio has increased very sharply in the past two decades implying for a vibrant capital market in India (Table 2). Market capitalization as a ratio of GDP fell in 2008 reflecting the peak of the global financial market crisis during the year and sharp decline in major stock indices (Table 4). After a period of broader stability in the global financial markets for about two years, financial markets worldwide fell again in 2011 due to heightened sovereign debt crisis in the euro area. As a result, leading stock markets declined in 2011 and market capitalization fell. Various reform measures undertaken since the early 1990s by the Securities and Exchange Board of India (SEBI) and the Government of India have brought about a significant structural transformation in the Indian capital market. Although the Indian equity market has become modern and transparent, its role in capital formation continues to be limited. Unlike in some advanced economies, the primary equity and debt markets in India have not yet fully developed. The size of the public issue segment has remained small as corporates have tended to prefer the international capital market and the private placement market. The private corporate debt market is active mainly in the form of private placements. A comparison of bank-based indicator reported in Table 3 and market-based indicator in Table 4 provide some useful insights. In Table 3, it may be observed that credit provided by the banking sector as a percentage of GDP has increased steadily over the years from 37.0 percent in 1980 to 75.1percent in 2011. On the other hand, stock market capitalization as a percentage of GDP increased from 11.8 percent in 1990 to 54.9 percent in 2011 (Table 4). It may also be noticed that stock market capitalization as a percentage of GDP increased sharply in 2009 and 2010. These sharp gains in market capitalization to GDP ratio in 2009 could be attributed to valuation gains due to steep rise in share prices from a very low level in 2008 as the global financial crisis heightened. Furthermore, year-wise comparison of ratios in Table 3 and Table 4 reveals that barring a few years, credit to GDP ratio was higher than market capitalization to GDP ratio implying that financial system in India is more biased towards bank-based. IV. FINANCE AND GROWTH – SELECT EMPIRICAL LITERATURE Empirical evidence on the relationship between finance and growth is very recent. Several studies have attempted to examine the relationship between various alternative indicators of financial development (such as the ratio bank credit to GDP and market capitalization to GDP) and growth rates. The empirical study by King and Levine (1993) could be one of the earliest one in which they find a statistically significant positive relationship between the measures of financial development and growth while analyzing 77 countries for the period 1960-1989. Following the work by King and Levine, many studies offered econometric evidence that supports the view that financial development is a potent predictor of future economic growth. Many studies have also made significant progress in establishing that to some extent, the causal relationship runs from financial development to economic growth. The findings based on aggregate data have been supported by studies that use disaggregated data on the industry and firm level. Using a large sample of industries from many countries, Rajan and Zingales (1998) found that financial development mitigates financing constraints for industries that rely most heavily on external finance. They concluded that such industries grow faster in countries with more developed financial systems. Demirgüç-Kunt and Maksimovic (1996); and Levine and Beck (2000) provided further firm-level evidence on the positive effects of access to a well-functioning financial system on firm growth. Rouseau and Sylla (1999) found evidence that supported the hypothesis that early industrial growth in the US was finance-led. These studies concluded that by providing debt and equity finance to the corporate and government sectors, the financial system was critical to the modernization process, which it predated. Using data on the US, the UK, Canada, Norway and Sweden, Rousseau and Wachtel (1998) concluded that financial intermediation was an important factor in the industrial transformation of these countries. Many studies examined the linkage between market-based financial system and economic growth. Levine and Zervos (1995) examined empirical association between stock market development and long-run economic growth. They used pooled cross-country time-series regression of 41 countries from 1976 to 1993 to evaluate this association. Demirgüç-Kunt and Levine (1995) developed a conglomerated index of stock market development by using measures such as stock market size, liquidity and integration with rest of the world markets. The growth rate of GDP per capita was regressed on a variety of control variables, viz., initial conditions, political stability, investment in human capital, and macroeconomic conditions along with the conglomerated index of stock market development. The finding suggested a strong correlation between overall stock market development and long-run economic growth. Demirgüç-Kunt and Levine (1999) used cross-section data of about 150 countries to illustrate how financial system differs across the world. They found that in higher income countries financial system tends to be more market-based as stock markets become more active and efficient than banks. Khan and Senhadji (2000) confirmed the strong positive and statistically significant relationship between financial depth and growth in a cross-section analysis. Caporale, et al. (2004) found that a well-developed stock market can foster economic growth in the long run through faster capital accumulation, and by tuning it through better resource allocation. Antonios (2010) found unidirectional Granger causality from stock market development to economic growth. There are a few studies that have attempted to estimate the threshold level of financial deepening. Cecchetti and Kharroubi (2012) found that the level of financial development is good only up to a point, after which it becomes a drag on growth. Arcand et al. (2012) argues that there is a threshold above which financial development no longer has a positive effect on economic growth. They found that finance starts having a negative effect on output growth when credit to the private sector reaches 100 percent of GDP. Their findings are consistent with the “vanishing effect” of financial development and that they are not driven by output volatility, banking crises, low institutional quality, or by differences in bank regulation and supervision. While a large amount of historical and econometric evidence suggests that financial development facilitates economic growth, it is important to reiterate that this does not rule out the possibility of a causal relationship in the reverse direction. It is perfectly possible that financial systems develop in response to higher economic growth or in anticipation of future prosperity. These two causal processes are not mutually exclusive and may very well be a natural feature of the links between finance and economic growth. Therefore, the issue of direction of causality between finance and growth still remains unsettled. Financial development may promote growth in a supply leading sequence in which financial systems develop in anticipation of future economic growth or in a demand following pattern in which growth creates demand for financial services. While empirical evidence supports a strong and statistically significant relationship for the supply leading sequence, others argue in favour of reverse causality, i.e., it is faster growth that leads to financial deepening. In the Indian context, there are a few studies those have taken either bank-based indicator or market-based indicator per se while linking with economic development. Banerjee (2012) examined the lead-lag pattern in the interaction between credit and growth cycles of India at three levels, i.e., at the aggregate level for annual GDP growth, at the sectoral level across agriculture, industry and services, and also across major industries. The major inference this paper draws is that output leads credit in the post-reform period contrary to the pre-reform period when credit used to lead output growth. This study, however, suffers from the limitation of relying only on Granger causality test while disregarding the role of factors driving output other than bank credit. Therefore, it fails to explain the underlying relationship backed by theory, long-run relationship and other robustness indicators. Furthermore, the Granger causality assumes that both the series to be stationary, i.e., I(0), which involves pre-testing the variables. Sahoo and Patra (2005, 2006) empirically evaluated the role of financial intermediation in the economic development of a federal State, i.e., Odisha. Bi-directional Granger causality between per capita credit and per capita State Domestic Product was found confirming the simultaneity of supply-leading and demand-following sequences between bank intermediation and economic development. The elasticity of per capita credit was found to be higher than the elasticity of rainfall in explaining per capita State domestic product with credit having a persistent positive impact on the State Domestic Product. V. METHODOLOGY The traditional approach in determining long-run and short-run relationships among variables has been using the standard Johanson-Juselius (1990, 1992) cointegration and vector error correction model (VECM) framework. This approach, however, suffers from serious limitations of checking the order of integration (Pesaran et al., 2001). Therefore, we adopt the autoregressive distributed lag (ARDL) model popularized by Pesaran and Shin (1995, 1999), Pesaran, et al. (1996), and Pesaran and Pesaran (1997) to establish relationship between variables. The ARDL method yields consistent and robust results both for the long-run and short-run relationships. This approach does not involve pretesting variables, which means that the test for the existence of relationships between variables is applicable irrespective of whether the underlying regressors are purely I(0), purely I(1), or a mixture of both. ARDL model is extremely useful because it allows us to describe the existence of an equilibrium/relationship in terms of long-run and short-run dynamics without losing long-run information. The ARDL approach consists of estimating the following equation. 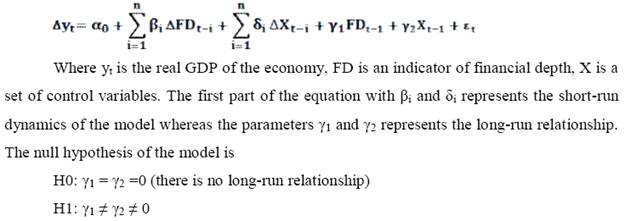
We start by conducting a bounds test for the null hypothesis of no cointegration. The calculated F-statistic is compared with the critical value tabulated by Pesaran and Pesaran (1997), and Pesaran et al. (2001). If the test statistics exceeds the upper critical value, the null hypothesis of a no long-run relationship can be rejected regardless of whether the underlying order of integration of the variables is 0 or 1. Similarly, if the test statistic falls below a lower critical value, the null hypothesis is not rejected. However, if the test statistic falls between these two bounds, the result is inconclusive. When the order of integration of the variables is known and all the variables are I(1), the decision is made based on the upper bound. Similarly, if all the variables are I(0), then the decision is made based on the lower bound. The ARDL method estimates (p+1)k number of regressions in order to obtain the optimal lag length for each variable, where p is the maximum number of lags to be used and k is the number of variables in the equation. The orders of lags in the ARDL model are selected by either the Akaike Information Criterion (AIC) or Schwartz Bayesian Criterion (SBC), before the selected model is estimated by ordinary least squares (OLS). In the second step, if there is evidence of a long-run relationship (cointegration) among the variables, the following long-run model is estimated, 
After ascertaining the evidence of a long-run relationship, the next step involves in estimation of error correction model (ECM), which indicates the speed of adjustment back to long-run equilibrium after a short-term disturbance. The standard ECM involves estimating the following equation. 
To ascertain the goodness of fit of the ARDL model, diagnostic and stability tests are conducted. The diagnostic test examines the serial correlation, functional form, normality, and heteroscedasticity associated with the model. The structural stability test is conducted by employing the cumulative residuals (CUSUM) and the cumulative sum of squares of recursive residuals (CUSUMSQ). VI. DATA AND EMPIRICAL FINDINGS In the empirical analysis, the study makes use of data for the period 1982-83 through 2011-12. The study limits to the starting period as 1982-83 due to the non-availability of data on stock market capitalization prior to this period. Real National GDP at factor cost (GDPR) represents economic development. The ratio of private sector credit to GDP (CREDIT) is used as the indicator of bank-based financial development. The ratio of market capitalization to GDP (MCAP) is used as the market-based financial development. The sum of credit to the private sector and market capitalization as a ratio of GDP (FINDEP) is used as the broad indicator of financial deepening (Demirguc-Kunt and Levine, 1999; Khan and Senhadji, 2000; and Levine, 2004). Four control variables such as policy rate (CALL), growth rate of population (POP), terms of trade (ToT) and world real GDP growth rate (WGROWTH) were also considered while examining their role in the economic development. In the absence of a uniform rate that represents monetary policy stance during the period under study, the call money rate has been used as the proxy for monetary policy stance. World real GDP growth has been considered as a proxy for world demand. In the last decade, a fairly close association could be seen between the real GDP growth rate of India and world real GDP growth rate (Chart 1). The data were collected from Handbook of Statistics on Indian Economy published by the Reserve Bank of India, the National Accounts Statistics published by the Central Statistical Organization, Government of India and World Economic Outlook Database, IMF. Before estimating the ARDL model, we examine the correlation and the causal nexus between financial deepening and economic development. The correlation coefficient among the financial deepening variables and real GDP was found to be very high and statistically significant (Table 5). While applying Granger (1969) causality test, one-way causality running from CREDIT to GDPR was observed implying that bank-based financial deepening leads to economic development and not the vice-versa (Table 6). This finding is well expected in an emerging economy like India where supply-driven growth strategy assumes more important unlike highly demand-driven growth in advanced economies. However, no evidence of causality was found between market-based financial deepening and economic development. This could be due to the fact that the measure of market-based financial deepening is partial in nature as it has considered the market capitalization of Bombay Stock Exchange Limited (BSE) only due to non-availability of data for other stock exchanges. This measure also suffers from the limitation of excluding funds raised in the primary segment of the capital market due to non-availability of data for the entire period. We estimate the following four different ARDL models by taking various definitions of financial deepening. Model I: GDPR = f(CREDIT, RATE, POP, ToT, WGROWTH) Model II: GDPR = f(MCAP, RATE, POP, ToT, WGROWTH) Model III: GDPR = f(CREDIT, MCAP, RATE, POP, ToT, WGROWTH) Model IV: GDPR = f(FINDEP, RATE, POP, ToT, WGROWTH) The empirical estimates of the four models are reported in Table 7. The lag length of the ARDL models was chosen by the SBC. The estimated ARDL models also satisfy the usual efficiency properties. All the three indicators of financial deepening, viz., the bank-based indicator (CREDIT), market-based indicator (MCAP) and the broad indicator (FINDEP) are statistically significant and also have desired positive signs. Among the control variables, we find that the interest rate has the desired negative sign but statistically insignificant. This could be due to the fact that call money rate is more of an indicator of short-term money market rate than policy rate and monetary policy decision has also a transmission lag. Furthermore, investment demand is more dependent on medium to long-term lending rate and risk perceptions. However, the terms of trade has a negative sign but statistically significant. A negative sign for the ToT is against the strategy of export-led growth. But in an emerging economy which is heavily dependent on capital-intensive imports for supporting its domestic production, a negative sign for ToT could be expected. Population growth has a positive and statistically significant sign supporting the hypothesis that India created labour force which has a positive impact on the economic development. Furthermore, India’s changing demographics which are tending towards better quality and younger population create a strong impulse for economic development. World real GDP growth representing global demand has positive but statistically insignificant sign reflecting the negligible impact of global demand in driving economic growth for a small relatively open economy like India. However, it may be more likely that global demand factor could have strongly affected domestic GDP growth in recent years due to greater integration of the Indian economy with the rest of the world. As evident from the estimated cointegrating equations, the long-run coefficients of all the three indicators of financial deepening have the desired signs and are statistically significant (Table 8). All the four specifications have valid error correction model as the ECM parameters have expected negative signs and statistically significant (Table 9). The structural stability property of the abovementioned four models were examined by the CUSUM and CUSUMSQ tests (Charts 2 to 5). Both CUSUM and CUSUMSQ recursive residuals obtained from the each equation are within the error band for all models. VII. CONCLUDING OBSERVATIONS In the context of the ongoing financial crisis and falling growth momentum worldwide, this paper made an attempt to revisit the role of financial structures in economic growth. It empirically re-examined the relationship between financial depth and economic development in the Indian context based on both banking and equity market indicators of financial deepening. Preliminary analysis revealed that credit disbursement by Indian banks has increased sharply in the past decades, although it is still far below the world average level and even below its EDEs peers. However, the market capitalization of Indian stock market is comparable with leading stock markets in the advanced economies as well as in EDEs. The empirical estimation is based on the premise of the endogenous growth theory which postulates that financial development improves the efficiency of capital allocation leading higher long-term growth. The study finds one-way Granger causality from bank-based financial depth to economic development supporting the premise that growth is more of supply-driven. However, no evidence of causality between market capitalization and economic development was found. A detailed analysis based on cointegration method revealed that both the bank-based and market-based indicators of financial depth have positive impact on economic development in India. The empirical findings of the study provide important policy insights in the Indian context. As the Indian financial sector is largely bank-centric, the performance of the banking sector is crucial in the development process of the economy. Given the potential of further credit disbursement by Indian banks, there is still scope for them to channelize credit to the productive sectors of the economy. Therefore, Indian banks need to develop strong linkages with the real sector to develop the ability to maintain high growth levels over a sustained period of time which was one of the critical lessons emerged from the global financial crisis. These linkages should critically determine all aspects of banking operations including the kind of products and services offered, the pricing strategies, delivery channels adopted, sectors/ sub-sectors receiving focused attention and technology platforms adopted (Chakrabarty, 2012). It is worthwhile to mention that there is scope for extending and refining the findings of the study by including broader measures of financial deepening. With the availability of data, the study could be extended by taking the most comprehensive indicator of financial depth such as bond market capitalization as a share of GDP, the role of non-bank financial institutions and funds raised in the primary capital market. The study can also be extended by examining the threshold level beyond which financial development no longer has a positive influence in economic growth. Furthermore, the analysis on financial depth and economic development could be extended to incorporate the inter-linkages between domestic and international financial markets.
REFERENCES Allard, Julien and R. Blavy (2011), “Market Phoenixes and Banking Ducks: Are Recoveries Faster in Market-Based Economies?”, IMF Working Paper No. 213. Antonios, Adamopoulos (2010), “Stock Market and Economic Growth: An Empirical Analysis for Germany”, Business and Economics Journal, Volume 2010: BEJ-1. Arcand, Jean-Louis, E. Berkes and U. Panizza (2012), “Too Much Finance?”, IMF Working Paper No. 161. Banerjee, Krittika (2012), “Credit and Growth Cycles in India: An Empirical Assessment of the Lead and Lag Behaviour”, RBI Working Paper Series No.22. Bencivenga, V. and D. B. Smith (1991), “Financial Intermediation and Endogenous Growth”, Review of Economic Studies, April, Volume 58(2), pp. 195-209. Boot, A. and A.V. Thakor (1997), “Financial System Architecture”, Review of Financial Studies, 10, 693-733. Boyreau-Debray G. (2001), Financial Intermediation and Growth: Chinese Style, World Bank, Washington, DC. Boyd, J.H. and E. Prescott (1986), “Financial Intermediary-Coalitions”, Journal of Economic Theory, 38, 211-232. Caporale, G. M., P. G. A. Howells, and A. M. Soliman (2004), “Stock Market Development and Economic Growth: The Causal Linkage”, Journal of Economic Development, 29(1), 33-50. Cecchetti, S. G. and E. Kharroubi (2012), “Reassessing the Impact of Finance on Growth”, BIS Working Papers No. 381. Chakraborty, Shankha and Tridip Ray (2005), “Bank-based versus Market-based Financial Systems: A Growth-theoretic Analysis”, Journal of Monetary Economics. Chakrabarty, K. C. (2012), “Supporting Explosive Growth: Effective Linkages between the Banking Sector and Real Sector”, RBI Bulletin, December. Demirguc-Kunt, A. and R. Levine (1995), “Stock Markets, Corporate Finance, and Economic Growth: An Overview,” World Bank Working Paper, No 1389. Demirguc-Kunt, A. and V. Maksimovic (1996), “Stock Market Development and Financing Choice of Firms”, World Bank Economic Review, 10(2), 341-70. Demirguc-Kunt, A. and R. Levine (1999), “Bank-based and Market-based Financial Systems: Cross-country Comparisons,” World Bank Working Paper, No 2143. Diamond, D. (1984), “Financial Intermediation and Delegated Monitoring”, Review of Economic Studies, 51, 393-414. Duisenberg, W. F. (2001), “The Role of Financial Markets for Economic Growth”, BIS Review No. 48. Goldsmith, R. W. (1969), Financial Structure and Development, New Haven, CT: Yale University Press. Gorton, Gary and Andrew Winton (2002), “Financial Intermediation”, NBER Working Paper, No. 8928. Granger, C.W.J. (1969), “Investigating Causal Relations by Econometric Models and Cross-Spectoral Models”, Econometrica, 37, pp. 424-38. Holmstrom, B. and J. Tirole (1997), “Financial Intermediation, Loanable Funds, and the Real Sector”, Quarterly Journal of Economics, 112, 663-691. International Monetary Fund (2012), Global Financial Stability Report, October 2012. Jensen, M. and W.H. Meckling (1976), “Theory of the Firm: Managerial Behavior, Agency Costs, and Ownership Structure,” Journal of Financial Economics, 3, 305-360. Johansen S. and Katerina Juselius (1990) “Maximum Likelihood Estimation and Inference on Cointegration with Application to the Demand for Money”, Oxford Bulletin of Economics and Statistics, 52, pp. 169-209. _______(1992) “Testing Structural Hypothesis in a Multivariate Cointegartion Analysis of PPP and the UIP for UK”, Journal of Econometrics, 53, 211-44. Khan M. S. and A. S. Senhadji (2000), “Financial Development and Economic Growth: An Overview”, IMF Working Paper,WP/00/209, International Monetary Fund. King, R.G. and R. Levine (1993), “Finance and Growth: Schumpeter Might Be Right”, Quarterly Journal of Economics, Vol. 108. Lee, Bong-Soo (2012), “Bank-based and Market-based Financial Systems: Time-series Evidence”, Pacific-Basin Finance Journal, 20, 173–197. Levine, R. (2004), ';Finance and Growth: Theory and Evidence';. NBER Working Paper No. 10766. Levine, R., N. Loayza and T. Beck (2000), “Financial Intermediation and Growth: Causality and Causes”, Journal of Monetary Economics, 46, 31-77. Levine, R., N. Loayza and Thorsten Beck (1999), “Financial Intermediation and Growth: Causality and Causes”, World Bank Country Economics Department Papers 2059, Washington, DC. Levine, R. (1997), “Financial Development and Economic Growth: Views and Agenda”, Journal of Economic Literature, 35(2), 688-726. Levine, R., and S.J. Zervos (1995), “Stock Market Development and Long-Run Growth,” World Bank Economic Review, 82(4), 942-963. Lucas, Robert E. Jr. (1988), “On the Mechanics of Economic Development”, Journal of Monetary Economics, XXII, 3(42). McKinnon, R. and E. Shaw (1973), Financial Deepening in Economic Development (New York: Oxford University Press). Myers, S. and N. Majluf (1984), “Corporate Financing and Investment Decisions when Firms have Information that Investors Do not Have,” Journal of Financial Economics, 13, 187-221. Pagano, M. (1993), “Financial Markets and Growth: An Overview”, European Economic Review, 37, 613–22. Pattanaik Sitikantha and Subhadhra S. (2011), “The Velocity Crowding-out Impact: Why High Money Growth is not Always Inflationary”, RBI Working Paper No. 6/2011. Pesaran, H.M. (1997), “The Role of Economic Theory in Modelling the Long-Run”, Economic Journal, 107, 178-191. Pesaran, H.M. and Y. Shin (1995), “Autoregressive Distributed Lag Modelling Approach to Cointegration Analysis”, DAE Working Paper Series No. 9514, Department of Applied Economics, University of Cambridge. Pesaran, H.M. and Y. Shin (1999), “Autoregressive Distributed Lag Modelling Approach to Cointegration Analysis”, Chapter 11, in Storm, S., (ed.), Econometrics and Economic Theory in the 20th. Century: The Ragnar Frisch Centennial Symposium. Cambridge University Press: Cambridge. Pesaran, H.M. and B. Pesaran (1997), Microfit 4.0: Interactive Econometric Analysis, Oxford University Press: England. Pesaran, H.M., Shin, Y. and Smith, R. (1996), “Testing the Existence of a Long-Run Relationship”, DAE Working Paper Series No. 9622, Department of Applied Economics, University of Cambridge. Pesaran, H.M., Shin, Y. and Smith, R.J. (2001), “Bounds Testing Approaches to the Analysis of Level Relationships”, Journal of Applied Econometrics, 16, 289-326. Rajan, R and L Zingales (1998): “Financial Dependence and Growth”, American Economic Review, 88, pp 559–86. Reserve Bank of India (2003), Report on Currency and Finance, 2001-02. Reserve Bank of India (2004), Report on Currency and Finance, 2003-04. Robinson, Joan (1952), “The Generalization of the General Theory”, in The Rate of Interest and Other Essays (London: Macmillan). Rousseaue, P. and P. Wachtel (1998), “Financial Intermediation and Economic Performance: Historical Evidence from Five Industrialized Countries”, Journal of Money, Credit and Banking, 30(4), 657-78. Rousseau, P. L. and R. Sylla (1999), “Emerging Financial Markets and Early U.S. Growth”, National Bureau of Economic Research Working Paper No. 7448. Sahoo, Satyananda and M. D. Patra (2005), “Financial Intermediation and Growth in Orissa: An Empirical Evaluation”, Globalisation and Regional Development, Edited by Sudhakar Panda and Padmaja Mishra, Mayur Publications, 2005. _____ (2006), “Finance and Growth Revisited in Orissa: Some Sub-National Perspectives”, Prajnan, Vol. XXXIV, No.4, 2005-06, 1-18. Schumpeter, Joseph A. (1911), A Theory of Economic Development, Cambridge, MA: Harvard University Press. Stiglitz, Joseph (1985), “Credit Markets and the Control of Capital”, Journal of Money, Credit, and Banking, 17(2), 133-52.
Table 1: State-wise Distribution of Bank Offices, Aggregate Deposits and
Total Credit of Public Sector Banks | | | State/Union Territory | No. of offices
at the end of | Deposits
(Rs. crore)
End of | Bank credit
(Rs. crore)
End of | | June | June | June | June | June | June | | | | 1969 | 2011 | 1969 | 2011 | 1969 | 2011 | | 1. | Andaman & Nicober Islands | 1 | 41 | ... | 1677 | ... | 668 | | 2. | Andhra Pradesh | 567 | 5251 | 121 | 230449 | 122 | 264748 | | 3. | Arunachal Pradesh | ... | 65 | ... | 4838 | ... | 1174 | | 4. | Assam | 74 | 1012 | 33 | 51095 | 13 | 17352 | | 5. | Bihar | 273 | 2628 | 169 | 100349 | 53 | 26990 | | 6. | Chandigarh | 20 | 228 | 35 | 29681 | 64 | 48309 | | 7. | Chhattisgarh | ... | 859 | ... | 48871 | ... | 24811 | | 8. | Dadra & Nagar Haveli | ... | 21 | ... | 1007 | ... | 253 | | 9. | Daman & Diu | ... | 18 | ... | 1414 | ... | 288 | | 10. | Delhi | 274 | 1887 | 360 | 478132 | 245 | 377803 | | 11. | Goa | 85 | 368 | 49 | 27226 | 20 | 7021 | | 12. | Gujarat | 752 | 3881 | 401 | 215358 | 195 | 138429 | | 13. | Haryana | 172 | 1905 | 49 | 89285 | 23 | 74296 | | 14. | Himachal Pradesh | 42 | 867 | 12 | 29796 | 3 | 11927 | | 15. | Jammu & Kashmir | 35 | 342 | 18 | 12193 | 1 | 3381 | | 16. | Jharkhand | ... | 1442 | ... | 67843 | ... | 22792 | | 17. | Karnataka | 756 | 4165 | 188 | 246840 | 143 | 184120 | | 18. | Kerala | 601 | 2611 | 117 | 105657 | 77 | 80141 | | 19. | Lakshadweep | ... | 12 | ... | 470 | ... | 45 | | 20. | Madhya Pradesh | 343 | 3016 | 107 | 122035 | 63 | 72363 | | 21. | Maharashtra | 1118 | 6413 | 903 | 925728 | 912 | 805525 | | 22. | Manipur | 2 | 52 | 1 | 2850 | ... | 1123 | | 23. | Meghalaya | 7 | 147 | 9 | 8485 | 3 | 2022 | | 24. | Mizoram | ... | 35 | ... | 2031 | ... | 830 | | 25. | Nagaland | 2 | 76 | 1 | 4279 | ... | 1270 | | 26. | Odisha | 100 | 1960 | 29 | 85665 | 15 | 42993 | | 27. | Puducherry | 12 | 102 | 5 | 5585 | 5 | 3185 | | 28. | Punjab | 346 | 3142 | 185 | 134505 | 50 | 103498 | | 29. | Rajasthan | 364 | 2799 | 74 | 99778 | 38 | 96206 | | 30. | Sikkim | ... | 73 | ... | 2961 | ... | 1135 | | 31. | Tamil Nadu | 1060 | 4700 | 233 | 234155 | 311 | 274421 | | 32. | Tripura | 5 | 117 | 4 | 6402 | ... | 1573 | | 33. | Uttar Pradesh | 747 | 7217 | 337 | 317369 | 154 | 133102 | | 34. | Uttarakhand | ... | 952 | ... | 43957 | ... | 14458 | | 35. | West Bengal | 504 | 4203 | 456 | 276778 | 526 | 158404 | | | All India | 8262 | 62607 | 3896 | 4014743 | 3036 | 2996655 | Source: Economic Survey 2011-12, Government of India. …: Nil
Note: 1. Data include State Bank of India and its Associates, nationalized banks and IDBI Bank Limited.
2. Deposits exclude inter-bank deposits.
3. Bank credit excludes dues from banks but includes amount of bills rediscounted with RBI/financial institutions. |
| Table 2: Financial Development - Select Indicators | | Item | 1960s | 1970s | 1980s | 1990s | 2000s | | Private Credit/Total Credit (%) | 43.0 | 58.4 | 59.0 | 56.6 | 64.5 | | Private Credit/GDP (%) | 9.5 | 18.8 | 28.7 | 28.6 | 43.0 | | Total credit/GDP (%) | 22.2 | 32.0 | 48.8 | 50.6 | 66.2 | | M3/GDP (%) | 21.2 | 28.4 | 40.8 | 49.9 | 73.5 | | M3 Velocity (times) | 5.0 | 3.9 | 2.7 | 2.2 | 1.5 | | M1 Velocity (times) | 7.0 | 6.7 | 7.1 | 6.4 | 5.4 | | Market Capitalization/GDP (%) | - | - | 8.8 | 35.8 | 58.7 | | Per Capita Real GDP Growth (%) | 1.6 | 0.5 | 3.2 | 3.7 | 5.4 | | Real GDP Growth (%) | 4.0 | 2.9 | 5.6 | 5.8 | 7.2 | Note: Domestic credit to the commercial sector is taken as proxy for private credit.
Source: Handbook of Statistics on Indian Economy, Reserve Bank India and Author's calculations. |
| Table 3: Domestic Credit Provided by Banking Sector | | (% of GDP) | | Country/ Region | 1980 | 1990 | 2000 | 2005 | 2008 | 2009 | 2010 | 2011 | | Brazil | 43.0 | 87.6 | 71.9 | 74.5 | 96.9 | 95.8 | 95.2 | 98.3 | | China | 53.3 | 89.4 | 119.7 | 134.3 | 120.8 | 145.1 | 146.3 | 145.5 | | Euro area | 93.6 | 97.0 | 119.4 | 127.3 | 142.8 | 152.6 | 156.0 | 153.6 | | India | 37.0 | 50.0 | 51.4 | 58.4 | 67.7 | 70.4 | 73.0 | 75.1 | | Japan | 185.7 | 255.3 | 304.7 | 317.6 | 302.4 | 329.8 | 329.0 | 340.9 | | Russia | - | - | 24.9 | 22.1 | 23.9 | 33.7 | 38.4 | 39.6 | | South Africa | 76.4 | 97.8 | 152.5 | 178.5 | 173.8 | 184.2 | 182.4 | 167.0 | | South Korea | 43.4 | 51.9 | 74.7 | 88.3 | 109.4 | 109.4 | 103.1 | 102.3 | | UK | 36.2 | 118.2 | 130.2 | 161.9 | 213.5 | 229.2 | 222.6 | 213.8 | | US | 120.2 | 151.0 | 198.4 | 225.4 | 222.0 | 234.9 | 232.9 | 233.3 | | World | 93.5 | 130.6 | 158.9 | 162.1 | 154.7 | 169.1 | 167.4 | 165.3 | | Source: World Bank Data Base. |
| Table 4: Market Capitalization of Listed Companies | | (% of GDP) | | Country/ Region | 1990 | 2000 | 2005 | 2008 | 2009 | 2010 | 2011 | | Brazil | 3.6 | 35.1 | 53.8 | 35.7 | 72.0 | 72.1 | 49.6 | | China | | 48.5 | 34.6 | 61.8 | 100.3 | 80.3 | 46.3 | | Euro area | 21.1 | 86.9 | 62.7 | 38.1 | 49.6 | 52.1 | 41.9 | | India | 11.8 | 31.2 | 66.3 | 52.7 | 86.6 | 95.9 | 54.9 | | Japan | 94.1 | 66.7 | 103.6 | 66.4 | 67.1 | 74.7 | 60.3 | | South Africa | 123.2 | 154.2 | 228.9 | 179.4 | 249.0 | 278.5 | 209.6 | | South Korea | 42.1 | 32.2 | 85.0 | 53.1 | 100.3 | 107.3 | 89.1 | | Russia | | 15.0 | 71.8 | 23.9 | 70.5 | 67.5 | 42.9 | | United Kingdom | 83.8 | 174.5 | 134.1 | 70.3 | 128.8 | 138.0 | 49.4 | | United States | 53.2 | 152.6 | 135.1 | 82.5 | 108.8 | 118.6 | 103.6 | | World | 47.3 | 101.3 | 96.6 | 58.7 | 83.8 | 88.8 | 66.3 | | Source: World Bank Data Base. |
| Table 5: Correlation Coefficients | | Variable | CREDIT | FINDEP | GDPR | MCAP | | CREDIT | 1.0 | | | | | FINDEP | 0.90 | 1.0 | | | | (0.0) | | | | | GDPR | 0.86 | 0.89 | 1.0 | | | (0.0) | (0.0) | | | | MCAP | 0.83 | 0.99 | 0.87 | 1.0 | | (0.0) | (0.0) | (0.0) | | | Note: Figures in parentheses are probabilities. |
| Table 6: Granger Causality Test | | Null Hypothesis | F-Statistics | Probability | | GDP does not Granger cause PCREDIT | 1.36 | 0.25 | | PCREDIT does not Granger cause GDP | 9.50 | 0.00 | | GDP does not Granger cause MCAP | 0.00 | 0.96 | | MCAP does not Granger cause GDP | 0.17 | 0.68 | | GDP does not Granger cause FINDEF | 0.42 | 0.52 | | FINDEP does not Granger cause GDP | 0.05 | 0.83 | | Note: Granger causality tests are based on one lag with I(0) series. |
| Table 7: Autoregressive Distributed Lag Estimates(Dependent variable: LGDPR) | | Regressor | Model I | Model II | Model III | Model IV | | LGDPRt-1 | 0.7194
(5.5608)*** | 0.8235
(9.0667)*** | 0.6262
(4.1392)*** | 0.7883
(8.4817)*** | | CREDIT | 0.0019
(1.532)* | | -0.0027
(-1.0702) | | | CREDITt-1 | | | 0.0043
(1.6269)* | | | MCAP | | 0.0005
(2.1993)** | 0.0004
(1.7082)* | | | FINDEP | | | | 0.0004
(2.2524)** | | Intercept | 3.2094
(2.203)** | 2.102
(2.033)** | 4.3152
(2.5392)** | 2.4756
(2.3346)** | | CALL | -0.0005
(-0.4425) | -0.001
(-0.8359) | -0.0009
(-0.8246) | -0.0007
(-0.6458) | | TOT | -0.0427
(-0.8151) | -0.0773
(-1.7808)* | -0.0894
(-1.6862)* | -0.0649
(-1.4965)* | | POP | 0.0009
(2.235)** | 0.0006
(1.8301)* | 0.0012
(2.4693)** | 0.0007
(2.1812)** | | WGROWTH | 0.0014
(0.5379) | 0.0013
(0.5402) | 0.0017
(0.6819) | 0.0022
(0.9776) | | | Model performance indicators |  | 0.99 | 0.99 | 0.99 | 0.99 | | Durbin’s h | 1.1289 | 0.3743 | 1.78 | -0.253 | Note: (1) The lag order of models is based on Schwartz Information Criterion. Model I is ARDL (1,1), Models II and IV are ARDL (1,0) and Model III is ARDL(1,1,0).
(2) Figures in parentheses are estimated t-values. *, ** and *** indicate significant at 10, 5 and 1 percent level of significance, respectively. |
Table 8: Estimated Long Run Coefficients using ARDL Approach
(Dependent variable: LGDPR) | | Regressor | Model I | Model II | Model III | Model IV | | CREDIT | 0.0066
(2.1041)** | | 0.0043
(1.6101)* | | | MCAP | | 0.0026
(1.5865)* | 0.0011
(1.3017) | | | FINDEP | | | | 0.002
(1.9014)* | | Intercept | 11.4363
(70.964)*** | 11.9121
(32.4152)*** | 11.5432
(64.2339)*** | 11.6923
(55.4705)*** | | CALL | -0.0019
(-0.4082) | -0.0054
(-0.6775) | -0.0025
(-0.7246) | -0.0034
(-0.5697) | | TOT | -0.1523
(-0.7977)* | -0.4379
(-2.4912)** | -0.2391
(-1.591)* | -0.3066
(-2.0226)** | | POP | 0.0032
(14.7652)*** | 0.0033
(12.4564)*** | 0.0032
(20.7069)*** | 0.0033
(14.01)*** | | WGROWTH | 0.005
(0.5032) | 0.0076
(0.4971) | 0.0045
(0.6455) | 0.0106
(0.8324) | | Note: Figures in parentheses are estimated t-values. *, ** and *** indicate significant at 10, 5 and 1 percent level of significance, respectively. |
Table 9: Error Correction Representation for the Selected ARDL Model
(Dependent variable: ΔLGDPR) | | Regressor | Model I | Model II | Model III | Model IV | | ΔCREDIT | 0.0019
(1.5320)* | | 0.0043
(1.0702)* | | | ΔMCAP | | 0.0005
(2.1993)** | 0.0004
(1.7082)* | | | ΔFINDEP | | | | 0.0004
(2.2524)** | | ΔIntercept | 3.2094
(2.2030)** | 2.102
(2.033)** | 4.3152
(2.5392)*** | 2.4756
(2.3346)** | | ΔCALL | -0.0005
(-0.4425) | -0.001
(-0.8359) | -0.0009
(-0.8246) | -0.0007
(0.6458) | | ΔTOT | -0.0427
(-0.8151) | -0.0773
(-1.7808)* | -0.0894
(-1.6862)* | -0.0649
(-1.4965)* | | ΔPOP | 0.0009
(2.235)*** | 0.0006
(1.8301)* | 0.0012
(2.4693)** | 0.0007
(2.1812)** | | ΔWGROWTH | 0.0015
(0.5379) | 0.0013
(0.5402) | 0.0017
(0.6819) | 0.0022
(0.9776) | | Ecmt-1 | -0.2806
(-2.1693)** | -0.1765
(-1.9428)** | -0.3738
(-2.4712)** | -0.2117
(-2.2782)** | | | Model performance indicators |  | 0.46 | 0.51 | 0.57 | 0.53 | | DW | 1.70 | 1.88 | 1.62 | 2.08 | | Note: Figures in parentheses are estimated t-values. *, ** and *** indicate significant at 10, 5 and 1 percent level of significance, respectively. |
|