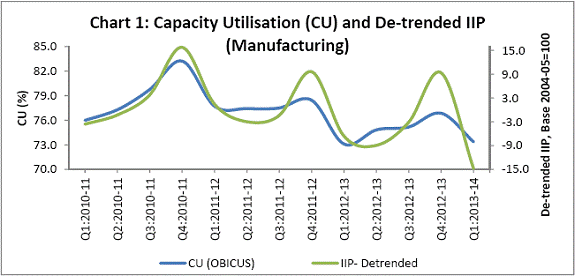
The Order Books, Inventories and Capacity Utilisation Survey (OBICUS), 22nd round in the series, was conducted for Q1:2013-14. In all, 1,082 common manufacturing companies (33 Government companies, 809 public limited companies and 273 private limited companies) responded to the survey. The analysis is based on the data on order books, inventories for raw materials and finished goods, and capacity utilisation, received from these companies for past five quarters, i.e., Q1:2012-13 to Q1:2013-14. Highlights: -
After sequential increase in previous two quarters, the new orders declined in Q1:2013-14 both on quarter-on-quarter sequential basis as well as year-on-year basis (Table 1). -
Capacity utilisation at aggregate level recorded seasonal decline in Q1:2013-14 over the previous quarter (Table 2). -
There is broad co-movement between capacity utilisation and de-trended Index of Industrial Production (IIP)-Manufacturing (Chart 1). -
Finished goods inventory to sales and raw material inventory to sales ratios increased in Q1:2013-14 and were higher than in Q1 of previous year. -
The survey results are in line with Industrial Outlook Survey results for Q1:2013-14. 
Table 1: Order Books (Q1: 2012-13 to Q1: 2013-14) | Quarter ended | Amount in ` billion | Q-o-Q growth (%) | Y-o-Y growth (%) | Avg Backlog order (451) | Avg New Order book (451) | Avg Pending order (451) | Avg Backlog order | Avg New Order book | Avg Pending order | Avg Backlog order | Avg New Order book | Avg Pending order | Q1:2012-13 | 1.42 | 1.18 | 1.49 | -0.3 | -0.2 | 4.4 | 7.4 | 22.1 | 10.3 | Q2:2012-13 | 1.49 | 1.09 | 1.48 | 4.6 | -7.6 | -1.0 | 10.4 | 7.8 | 8.5 | Q3:2012-13 | 1.48 | 1.13 | 1.46 | -1.0 | 3.2 | -1.4 | 8.8 | 1.1 | 1.8 | Q4:2012-13 | 1.45 | 1.16 | 1.35 | -1.6 | 2.5 | -6.9 | 1.6 | -2.6 | -5.1 | Q1:2013-14 | 1.37 | 1.14 | 1.40 | -5.8 | -1.5 | 3.7 | -4.0 | -3.9 | -5.8 | | Figures in parentheses are number of companies reporting order books |
Table 2: IIP-Mfg and Capacity Utilisation (CU) | Quarter | IIP-Mfg (Qtly avg Base 2004-05) | De-trended Qtly IIP-Mfg | CU | Q1:2012-13 | 176.7 | -6.6 | 73.1 | Q2:2012-13 | 175.9 | -8.9 | 74.8 | Q3:2012-13 | 183.3 | -3.1 | 75.2 | Q4:2012-13 | 197.2 | 9.3 | 76.9 | Q1:2013-14 | 174.6 | -14.8 | 73.4 |
Table 3: Average Sales and Inventories and their ratios (Q1: 2012-13 to Q1: 2013-14) | Quarter ended | Amount in ` Billion | Ratio in per cent | Avg Sales (904) | Avg Total Inv (904) | Avg FG Inv (904) | Avg WiP Inv (904) | Avg RM Inv | Total Inv/Sales | FG Inv/Sales | RM Inv/Sales | Q1:2012-13 | 4.39 | 2.34 | 0.79 | 0.38 | 1.18 | 53.4 | 17.9 | 26.9 | Q2:2012-13 | 4.46 | 2.50 | 0.90 | 0.38 | 1.22 | 56.1 | 20.1 | 27.4 | Q3:2012-13 | 4.71 | 2.53 | 0.73 | 0.38 | 1.42 | 53.8 | 15.6 | 30.1 | Q4:2012-13 | 4.76 | 2.48 | 0.85 | 0.37 | 1.27 | 52.1 | 17.8 | 26.6 | Q1:2013-14 | 4.40 | 2.47 | 0.86 | 0.37 | 1.24 | 56.2 | 19.6 | 28.2 | Figures in parentheses are number of companies reporting order books.
RM - Raw Material; WiP - Work in progress; FG - Finished Goods |
|