Growth in India, like in many other EMDEs, has slowed for over two years. The slowdown in
India was led by domestic structural constraints, while global cyclical conditions added to the
drag. However, as some of the structural constraints are starting to get addressed, activity levels
could improve in H2 of 2013-14 and a moderate-paced economic recovery could start taking
shape towards the end of the year. Better crop prospects due to a good monsoon, initiatives
by the government to speed up project implementation and a pick-up in exports, along with a
reduction in external imbalances has set the stage for recovery but sustained ground-level action,
especially in expediting project implementation is needed to achieve a sustainable turnaround.
Global growth likely to remain sluggish in
the near term
I.1 Global growth appears to be on a
sluggish trail despite an improvement in Q2 of
2013 . The International Monetary Fund (IMF)
in its World Economic Outlook in October 2013
revised global growth for 2013 downwards by
0.3 percentage points to 2.9 per cent. This
downward revision is on account of slower
growth in Emerging Market and Developing
Economies (EMDEs), including in China and
India. EMDEs growth projections have been
lowered by 0.5 percentage points to 4.5 per cent,
while the projections for Advanced Economies
(AEs) stays at 1.2 per cent.
I.2 Although both advanced and emerging
economies face the challenge of slower growth,
there was a distinct improvement in growth in
the major advanced economies during Q2 of
2013. In Q2 of 2013, the US GDP grew at 2.5
per cent (seasonally adjusted annualised quarter-on-quarter growth rate, q-o-q saar),
higher than 1.1 per cent in Q1 (Chart I.1a), due
mainly to growth in exports and non-residential
fixed investments on the one hand and a smaller
decrease in federal government spending on the
other. But the US shutdown for sixteen days
might get reflected in lower GDP growth in Q4
of 2013. The imminent risks to the global
economy from a possible US debt default have
been deferred with the US Government signing
a debt deal on October 17, 2013. However,
issues for the sustainability of the US recovery
going forward remained with headwinds to
investment, slack labour market conditions and
a possible rise in mortgage rates.
 I.3 Japan’s economy expanded for the third
straight quarter in Q2 of 2013 at 3.8 per cent.
UK showed improvements for the second
consecutive quarter in Q2 of 2013, growing by
2.7 per cent as against 1.5 per cent in Q1. The
euro area grew by 1.1 per cent (q-o-q saar) in the second quarter of 2013, helped by stronger
growth in the two largest economies, Germany
and France.
Table I.1: Slowdown in growth has been broad-based |
Sector-wise growth rates of GDP (2004-05 prices) |
(Per cent) |
Industry |
2011-12* |
2012-13# |
2012-13 |
2013-14 |
Q1 |
Q2 |
Q3 |
Q4 |
Q1 |
1 |
2 |
3 |
4 |
5 |
6 |
7 |
8 |
1. Agriculture, forestry & fishing |
3.6 |
1.9 |
2.9 |
1.7 |
1.8 |
1.4 |
2.7 |
2. Industry |
2.7 |
1.2 |
-0.2 |
0.5 |
2.3 |
2.0 |
-0.9 |
2.1 Mining & quarrying |
-0.6 |
-0.6 |
0.4 |
1.7 |
-0.7 |
-3.1 |
-2.8 |
2.2 Manufacturing |
2.7 |
1.0 |
-1.0 |
0.1 |
2.5 |
2.6 |
-1.2 |
2.3 Electricity, gas & water supply |
6.5 |
4.2 |
6.2 |
3.2 |
4.5 |
2.8 |
3.7 |
3. Services |
7.9 |
6.8 |
7.6 |
7.1 |
6.2 |
6.3 |
6.2 |
3.1 Trade, hotels, transport & communication |
7.0 |
6.4 |
6.1 |
6.8 |
6.4 |
6.2 |
3.9 |
3.2 Financing, insurance, real estate and business services |
11.7 |
8.6 |
9.3 |
8.3 |
7.8 |
9.1 |
8.9 |
3.3 Community, social & personal services |
6.0 |
6.6 |
8.9 |
8.4 |
5.6 |
4.0 |
9.4 |
3.4 Construction |
5.6 |
4.3 |
7.0 |
3.1 |
2.9 |
4.4 |
2.8 |
4. GDP at factor cost |
6.2 |
5.0 |
5.4 |
5.2 |
4.7 |
4.8 |
4.4 |
*: First Revised Estimates. #: Provisional Estimates.
Source: Central Statistics Office (CSO) |
I.4 Among the EMDEs, China’s GDP in
Q3 of 2013 went up by 9.1 per cent (q-o-q saar)
as compared to 7.8 per cent in Q2 and 6.1 per
cent in Q1. Brazil’s GDP growth at 6.0 per cent
(q-o-q saar) for Q2 of 2013 turned out to be
better than expected (Chart I.1b). With the Fed
tapering plans getting delayed, the EMDEs
need to prepare themselves in the interim for
the challenges that may arise.
I.5 The US labour market conditions still
remain weak with unemployment rate dropped
to 7.2 per cent in September 2013, though
additional non-farm payroll employment at
148,000 was also weak. UK labour markets
witnessed unemployment rate of 7.7 per cent
during June-August, down by 0.1 percentage
points from March-May 2013. In case of Japan,
the unemployment rate increased to 4.1 per cent
in August 2013 from 3.8 per cent in July 2013.
The unemployment rate in the euro area also
remained high and unchanged at 12.0 per cent
in August 2013.
The Indian economy faced broad-based
slowdown during Q1 of 2013-14
I.6 The slowdown facing the Indian
economy extended into 2013-14 with growth in
Q1 of 2013-14 falling to a 17- quarter low of
4.4 per cent (Table I.1). The growth slowdown
was broad-based reflecting moderation in the
services and agricultural sectors, and contraction
in the industrial sector.
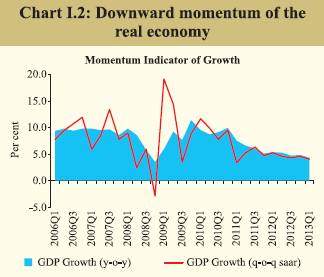
I.7 Since H2 of 2011-12, the seasonally
adjusted annualised q-o-q saar growth rate has
moved in line with declining trends in the year-on-
year (y-o-y) GDP growth rate, confirming
the downward momentum in the real economy
(Chart I.2). The output gap also continued to be
negative (Chart I.3). Supply constraints, high
inflation, cyclical factors and low external
demand contributed to this slowdown.
Agriculture growth expected to be buoyant
I.8 Agricultural production during 2013-14
is expected to record an above-trend growth
(Table I.2). The first advance estimates of
production of foodgrains have placed kharif
foodgrains at 129.3 million tonnes, a 10.3 per cent jump over the first advance estimates of
the previous year and 0.9 per cent growth over
the fourth advance estimate. Oilseeds too are
expected to show a substantial increase.
 I.9 A normal and evenly distributed southwest
monsoon reinforced the possibility of a
good crop. Rainfall during June-September
2013 was 6 per cent above normal. Thirty out
of the 36 meteorological sub-divisions that
constitute 86 per cent of the country’s area
received normal or excess rainfall. Deficiency
in rainfall was limited to areas in the East and
North-East and in Haryana. Prospects for rabi
crops are also good with water storage in the
85 major reservoirs as of October 17, 2013
being 16.3 per cent higher than last year’s level. The Reserve Bank’s production weighted
rainfall index for foodgrains for the period
stood at 102 per cent of the normal as compared
to 87 per cent last year (Chart I.4). The same
index for oilseeds (125), sugarcane (109) and
cotton (126) was also higher. An improved
kharif harvest is expected to help ease food
price pressure.
I.10 The current stock of rice and wheat at
53 million tonnes (mid-October 2013) is
sufficient to meet buffer norms and requirements
under the various poverty alleviation schemes
(Chart I.5). These stocks can be utilised better
in the short-run for price management keeping
in view storage constraints that may emerge
following another bumper crop. However, over
the medium-term a reassessment of the food
management strategy may be required keeping
in view the expected higher off-take with the
phased implementation of the National Food
Security Act at the all-India level.
Industrial activity continues to be
constrained by supply bottlenecks
I.11 The index of industrial production (IIP)
for April-August 2013 grew marginally by 0.1
per cent. Contraction of the mining and
manufacturing sectors has been the main factor
in dampening the overall performance of
industrial growth. Excluding capital goods and
the mining sector, IIP grew by 0.5 per cent during the period (Chart I.6). Excluding volatile
items such as ‘cable, rubber insulated’, ‘atrazin’,
‘vitamins’, ‘food processing machinery’, etc.
truncated IIP (96 per cent of IIP) growth in
April-August 2013 was negative at 0.9 per cent
(Chart I.7).
Table I.2: Initial estimates suggest jump in Kharif production |
Progress of Kharif sowing and production |
(Area in million hectares and production in million tonnes) |
Crops |
Sowing October 25 |
Production |
Percentage Change |
Normal
as on
Date |
2013 |
2012 |
2013-14* |
2012-13* |
2012-13@ |
Sowing
2013
(col 3/col 4) |
Production
2013-14
(col 5/col 6) |
Production
2013-14
(col 5/col 7) |
1 |
2 |
3 |
4 |
5 |
6 |
7 |
8 |
9 |
10 |
Foodgrains |
67.6 |
68.7 |
65.6 |
129.3 |
117.2 |
128.2 |
4.7 |
10.3 |
0.9 |
Rice |
36.6 |
38.4 |
37.5 |
92.3 |
85.6 |
92.8 |
2.4 |
7.8 |
-0.5 |
Coarse Cereals |
20.1 |
19.6 |
17.8 |
31.0 |
26.3 |
29.5 |
10.1 |
17.9 |
5.1 |
Maize |
7.3 |
8.2 |
7.5 |
17.8 |
14.9 |
16.0 |
9.3 |
19.5 |
11.3 |
Pulses |
10.9 |
10.7 |
10.3 |
6.0 |
5.3 |
5.9 |
3.9 |
13.2 |
1.7 |
Tur |
3.8 |
4.0 |
3.7 |
3.0 |
2.8 |
3.1 |
8.1 |
7.1 |
-3.2 |
Urad |
2.4 |
2.6 |
2.5 |
1.3 |
1.1 |
1.4 |
4.0 |
18.2 |
-7.1 |
Oilseeds |
17.8 |
19.5 |
17.7 |
24.0 |
18.8 |
20.9 |
10.2 |
27.7 |
14.8 |
Groundnut |
4.6 |
4.3 |
3.9 |
5.6 |
3.8 |
3.1 |
10.3 |
47.4 |
80.6 |
Soyabean |
9.5 |
12.2 |
10.7 |
15.7 |
12.6 |
14.7 |
14.0 |
24.6 |
6.8 |
Sugarcane |
4.7 |
4.9 |
5.0 |
341.8 |
335.3 |
339.0 |
-2.0 |
1.9 |
0.8 |
Cotton# |
11.6 |
11.5 |
11.7 |
35.3 |
33.4 |
34.0 |
-1.7 |
5.7 |
3.8 |
Jute & Mesta## |
0.9 |
0.9 |
0.9 |
11.2 |
11.3 |
11.3 |
0.0 |
-0.9 |
-0.9 |
All Crops |
102.5 |
105.5 |
100.9 |
- |
- |
- |
4.6 |
- |
- |
#: Million bales of 170 kgs each. ##: Million bales of 180 kgs each. -: Not Available.
*: First Advance Estimates. @: Fourth Advance Estimates
Source: Ministry of Agriculture, GoI. |
 I.12 While the mining sector has been
declining since 2011-12, the contraction in the manufacturing sector during April-August 2013
was driven primarily by declining outputs of
industries like machinery and equipments;
accounting and computing machinery; basic
metals; fabricated metal products; radio, TV,
communication equipments; and motor vehicles.
The decline in the mining sector’s output,
particularly coal, affected thermal power
generation which decelerated to 1.8 per cent
during April-August 2013 from 8.6 per cent last
year. However, hydro-electricity generation is
expected to be distinctly better this year with
the replenishment of water in reservoirs. Hydropower
has grown by 20.2 per cent y-o-y during
April-August 2013.
I.13 In terms of use-based industries,
consumer durables and basic goods, which
together have a 54 per cent weight in IIP,
dragged its overall growth down (Table I.3).
Core industries show some improvement
over last two months
I.14 Output of eight core industries improved
consecutively for two months with a 3.7 per cent
y-o-y growth in August 2013. The latest data shows a pick-up in core industries’ output led
by steel, cement and electricity. However, on a
year-to-date (YTD) basis, the growth of eight
core industries decelerated to 2.3 per cent during
April-August 2013 from 6.3 per cent in the
corresponding period last year (Chart I.8). The
deceleration in thermal electricity during April-
August 2013 was reflected in a reduction in the
all-India plant load factor (PLF) to 64.1 per cent
from 69.8 per cent last year.
Table I.3: Broad-based industrial
slowdown led by contraction in
consumer durables |
Sectoral and use-based classification of IIP |
(Per cent) |
Industry Group |
Weight
in the
IIP |
Growth Rate |
Apr-
Mar
2012-13 |
April-August |
2012-13 |
2013-14P |
1 |
2 |
3 |
4 |
5 |
Sectoral |
|
|
|
|
Mining |
14.2 |
-2.3 |
-1.8 |
-3.4 |
Manufacturing |
75.5 |
1.3 |
0.0 |
-0.1 |
Electricity |
10.3 |
4.0 |
4.8 |
4.5 |
Use-Based |
|
|
|
|
Basic Goods |
45.7 |
2.5 |
2.7 |
0.5 |
Capital Goods |
8.8 |
-6.0 |
-14.4 |
0.8 |
Intermediate Goods |
15.7 |
1.6 |
1.0 |
2.3 |
Consumer Goods (a+b) |
29.8 |
2.4 |
3.2 |
-1.6 |
a) Consumer Durables |
8.5 |
2.0 |
5.1 |
-11.0 |
b) Consumer Non-durables |
21.3 |
2.8 |
1.6 |
6.6 |
General |
100 |
1.1 |
0.2 |
0.1 |
P: Provisional
Source: Central Statistics Office. |
Moderation in Capacity Utilisation
I.15 Capacity utilisation (CU), as measured
by the 22nd round of the Order Books, Inventories
and Capacity Utilisation Survey (OBICUS) of
the Reserve Bank, recorded seasonal decline in
Q1 of 2013-14 over the previous quarter (http://
www.rbi.org.in/OBICUS22). There is a broad
co-movement between CU and de-trended
Index of Industrial Production (IIP) (Chart I.9).
After a sequential increase in the previous two
quarters, new orders declined in Q1 of 2013-14
both on a q-o-q sequential basis as well as on a
y-o-y basis. Finished goods inventory to sales
and raw material inventory to sales ratios
increased in Q1 of 2013-14 and were higher
than the previous year.
Lead indicators portray a mixed picture on
service sector growth
I.16 The services sector grew at 6.2 per cent
during Q1 of 2013-14 compared to 7.6 per cent
during the same period last year. This was largely due to moderation in the growth of
‘construction’ and ‘trade, hotels, restaurant,
transport and communication’ sectors.
Developments in lead indicators of the services
sector portray a mixed picture. Passenger and
commercial vehicles sales and some segments
of the aviation industry contracted even though
indicators like tourist arrivals, railway freight
revenue and steel production showed signs of
improvement (Table I.4). The Reserve Bank’s
services sector composite indicator, which is
based on growth in indicators of construction,
trade and transport and finance, showed a downturn in Q1 of 2013-14, but a modest pickup
in July-August (Chart I.10).
Table I.4: Lead indicators point towards subdued services sector activity |
Indicators of services sector activity |
(Growth in per cent) |
Services Sector Indicators |
2010-11 |
2011-12 |
2012-13 |
April-September 2012-13 |
April-September 2013-14 |
1 |
2 |
3 |
4 |
5 |
6 |
Tourist arrivals |
10.0 |
9.7 |
2.1 |
1.7 |
4.3 |
Cement |
4.5 |
6.7 |
8.4 |
8.3# |
3.2# |
Steel |
13.2 |
10.3 |
2.5 |
2.8# |
4.1# |
Automobile Sales |
16.8 |
11.1 |
2.6 |
3.5 |
1.2 |
Railway revenue earning freight traffic |
3.8 |
5.2 |
4.1 |
4.8 |
6.2 |
Cargo handled at major ports |
1.5 |
-1.6 |
-2.5 |
-3.3 |
2.3 |
Civil aviation |
|
|
|
|
|
Domestic cargo Traffic |
23.8 |
-4.8 |
-3.4 |
3.8* |
-3.0* |
International cargo Traffic |
17.7 |
-1.9 |
-4.2 |
-4.2* |
-1.7* |
International Passenger Traffic |
10.3 |
7.6 |
5.5 |
3.2* |
11.0* |
Domestic Passenger Traffic |
18.1 |
15.1 |
-4.3 |
-0.8* |
2.3* |
#: Data refers to April-August 2013; *: Data refers to April-July 2013.
Source: Ministry of Statistics and Programme Implementation, Ministry of Tourism, SIAM and CMIE |
Employment Scenario remains weak in
Q1 of 2013-14
I.17 As per the Labour Bureau survey in
eight key sectors, moderation in employment
generation that started in 2012 continued in Q1
of 2013-14 (Chart I.11). The decline in
employment generation was particularly sharp
for the IT/BPO sector, reflecting the global
slowdown and rising protectionism. Sector-wise,
except textiles and leather, no other sector
showed any perceptible improvement in
employment generation during Q1 of 2013 on
a sequential basis.
Moderate recovery expected during H2
mainly backed by pick-up in agriculture
and exports
I.18 The Indian economy is expected to
perform better during H2 of 2013-14 on the back of a good monsoon which has boosted the kharif
prospects. A good crop will have a positive
impact on rural demand, which in turn may help
in improving the subdued industrial and services
sectors. Further, improved kharif harvest is also
expected to help ease supply-side constraints
and hence food price pressure. Exports have
picked up with exchange rate adjustment though
global growth remains slow. On the policy front,
the government has started taking several policy
initiatives in certain sectors, especially
infrastructure, which are expected to improve
the overall investment climate. However, these
actions will take some time to translate into
activity at the ground-level. Therefore,
improvements in activity levels during H2 of
2013-14 are expected to stay modest though
recovery could start shaping towards the end of
the year if the current positive momentum is
sustained.
|