by
Deb Kusum Das1 Acknowledgements My first and foremost gratitude is for the team of young scholars who helped me in the compilation work of trade database by industry groups - Stuti Rawat wanted to learn about databases and did a commendable job of leading the creation of a trade data base by industry by mapping several thousands of tariff lines at six digit ITC (HS) codes for total manufacturing and its sub-groups at NIC 1987 and compiling for the 20 years beginning 1990-91. I can never repay my debts to her for her commitment and tireless hard work till the very last minute when she left to pursue research at National University of Singapore. Several others assisted and worked to take this forward at various stages - Pilu Chandra Das who anchored the database creation after Stuti left. Shyamaditya Singh for compiling the export-import data and creating the non-tariff barriers and Keshav Parthasarathy did a summer intern with me on trade dataset. Words cannot express my gratitude. Discussions with Gunajit Kalita helped me to derive several patterns of trade policy behavior and to understand the nuances of panel data econometrics and its applications to examining trade openness for Indian manufacturing. I thank Professor K L Krishna for his insights and comments which helped to improve the presentation of the econometric analysis. I owe special gratitude to B N Goldar and Kunal Sen for encouraging me to update and expand the trade database so that new research issues on aspects of trade liberalization can be addressed. Homagni Choudhury assisted in cross checking several aspects of trade policy statements to see if they tally with the way ITC codes have figured in various documents for tariff and non-tariff barriers- customs tariff manual, DGCI&S data of the Government of India. I owe them a deep gratitude. The estimates of total factor productivity used in the study were provided from a study by Pilu Chandra Das. I thank him for allowing me to use this series for my econometric research. Shri Arunachalaramanan and his colleagues at the RBI for believing that a short study research project on quantifying trade barriers across Indian manufacturing would be a valuable study for India’s apex monetary authorities - the Reserve Bank of India and enabling the funding of this study as a short study research grant. In particular, I would like to thank Dr Ananthaswamy, Balbir Kaur, B M Misra and others for their continued support to the project. I thank participants at RBI for comments received at both work in progress and project ending presentations. These comments have enriched the quality of the final report. Finally, to push forward further research on a Ph.D dissertation completed at the Delhi School of Economics more than a decade back were many. The inspiration I drew when Kaushik Basu asked me to contribute a chapter on “Trade Barriers in Manufacturing” on Oxford Companion to Indian Economy based on my Ph.D work and to several scholars like Rodrik and Subramanian (2005), Kunal Sen (2009) and Kotwal et al (2011) who cited estimates of trade liberalization based on my trade data base for scholarly articles to document India’s efforts at trade liberalization, egged me to push for some new evidence on “Has protection declined substantially in Indian Manufacturing?” Deb Kusum Das
Executive Summary Trade interventions in Indian manufacturing have been of two types: tariff and non-tariff barriers (NTBs). The former remained the most pervasive form of import protection, although NTBs of various forms were often listed as the major constraint. Over the last 40 years, trade barriers in India have fallen to historically low levels, however the role of trade policy reforms in the process of India’s industrial growth and development continues to be widely debated. This study presents industry-level evidence regarding the connection between trade policy reforms and manufacturing performance. It contributes to the existing literature in several respects. The study documents the level of trade liberalization at the level of individual sectors of manufacturing using explicit measures of trade policy orientation. This is done via computation of nominal and effective rates of protection, frequency and import coverage ratios of non-tariff protection and finally imports penetration ratios to assess the joint lowering of both tariff and non-tariff protection. The analysis centers on examining both trends and pattern of trade policy reforms. The impact of trade openness on manufacturing performance is examined via a panel data econometric modeling of trade-industrial productivity linkage alongside incorporating other policies-industrial and macroeconomic environment. The coverage of the study is the organized manufacturing sector and use-based sectors of organized manufacturing and the period extends from 1990-91 to 2009-10 giving us twenty years of trade liberalization efforts. The study observes that removal of restrictions in trade - in terms of lowering of tariff barriers and dismantling of import licensing regime has been substantial since 1990-91 but gain in terms of import penetration has not been of the similar order. In particular, trade protection measured by Nominal import tariff as well as Effective rate of protection (ERP) were brought down substantially in 1990s. Non-tariff protection got almost halved by 1992-93 and become less than 10 per cent by the beginning of 2000-01. Two, Capital goods saw faster reduction in ERP as well as NTBs during 1990s compared to intermediate & consumer goods. Three, at the level of organized manufacturing the change in import penetration rates show a near doubling within 20 years from around 9.7 per cent in 1990-91 to around 18 per cent by the end of 2009-10. We have also compared the period of 1990s versus 2000s in order to understand the manner of lowering of tariff as well as non-tariff barriers. We confirm that there was a sharp fall in tariff levels as well as quantitative restrictions in the 1990s as compared to the 2000s. The periods of 2000s were more aimed at simplifying the trade procedures as well as boosting exports. The examination of the impact of trade openness as captured by various measures of trade policy reforms indicates that a decrease in tariff barrier (captured by effective rate of protection) on industrial productivity is mainly felt with one year lag and the reduction of NTBs captured by import coverage ratio has relatively smaller impact on increase in TFP. The biggest impact of rise in TFP has actually comes from improvement in domestic industrial policy. Therefore, greater internal competitive pressure brought about by reforms in industrial policy acts a spur to productivity growth. We also find a positive impact of increase in capital intensity in capital goods sector and this is mainly driven by substantial lowering of tariff rates on capital goods imports as well relaxing of import controls on machines and equipments since 1991-92. Our quantitative result reinforces not only the role of trade policy reforms but also the literature on roles of industrial as well as trade reforms as complementarities in enhancing manufacturing performance. Our findings have strong policy implications as we have already seen substantial reduction in levels of trade protection across manufacturing groups. Further, the trade policy changes have also been followed by reforms in industrial policy. However, manufacturing performance still remains far below that of other emerging countries especially China. Therefore, we need to address issues which can further magnify the benefits of trade and industrial policy reforms such as easing of supply constraints- transport bottlenecks, power shortages, erratic supply of energy (water and electricity), labor regulations etc. Appropriate policy actions on these fronts along with further easing of trading environment will make India’s manufactured goods internationally competitive.
Trade Policy and Manufacturing Performance: Exploring the Level of Trade
Openness in India’s Organized Manufacturing in the Period 1990-2010 Deb Kusum Das 1. Introduction The Trade regimes in India have remained heavily distorted by both tariff and non-tariff barriers (NTBs) for more than four decades and the actual system of trade restrictions have been pervasive and highly complex. Trade policy reform in the 1990s, given its economy wide impacts, was considered as a key component of the reform process initiated in India. Such reforms were conceived to contribute to improved economic performance in the industrial sector as well as the overall economy.2 To better understand the dynamics of the manufacturing sector and its performance in India, it is important to examine the role of trade in Indian industrialization. It is now well known and documented that trade policy based on import substitution was at the core of India’s attempt at industrialization in 1947. After more than four decades of practicing of an inward looking trade policy, reforms in trade policies formed a significant part of this economic liberalization process in India. The 1980s saw changes in the external and the industrial sector in matters pertaining to licensing for scale and technology as well as quantitative restrictions on imports and tariff rates. The 1990s brought about comprehensive trade liberalization encompassing abolition of non-tariff barriers, reduction of peak tariff rates and dispersion along with devaluation of the rupee. However contrasting views have been documented regarding the impact of trade policy regime changes on Indian manufacturing.3 The manufacturing sector in India underwent a transformation from a highly regulated business environment in Nehru-Mahalanobis framework of planned industrialization to a partially de-licensed regime in the late 1980s. With the advent of reforms in 1990s, manufacturing performance registered a decline in early years; growth rate picked up but decelerated in the late 1990. Currently India’s manufacturing share still remains low compared to other developing countries especially China. Two specific points of manufacturing performance are in order - First, manufacturing productivity still remains very low despite reforms aimed at making this sector competitive (Das et al (2014)). Two, employment generation ability of the manufacturing sector has always remained a question mark. Today the issue is not only about “puzzle of jobless growth”. The creation of good jobs in Indian manufacturing is an important challenge (Kapoor 2014). Apart from issues connected to growth and employment aspect, poor performance of manufacturing in India still continues to be plagued by low technological depth due to very low R & D activities, issues of skill development and labor regulations (Manufacturing Plan - Strategies for Accelerating Growth of Manufacturing in India in the 12th Five Year Plan and Beyond, Planning Commission, Government of India). 1.1 Objective of the Study In the Indian context, there has been extensive research on assessing the levels of protection for the Indian economy. Given the complex nature of trade barriers, most studies have endorsed the adverse impact of protection on the performance of Indian industries.4 Two issues that emerge out of the prevailing studies is that – one, very few studies have attempted to quantify trade barriers by industry using outcomes of trade policy reforms- lowering of tariff and or abolishing of quantitative restriction (QR) [Das (2003) is the only study that have attempted to quantify measures of trade liberalization by select industry groups.5]. Two, though there have been numerous econometric studies trying to assess the impact of trade liberalization on Indian industry most of them use dummy variables as proxy for trade liberalization without using a quantified measure of trade policy by industries.6 Further, India’s attempt at trade liberalization in the 1980s and 1990s resulted in overall changes in the trading regime with substantial lowering of tariffs and near abolition of import control except for a few groups of industries on grounds of health, environment and defense. Further, the trade policies of 1997-98 and 2003-4 attempted to further consolidate the trade liberalizations of 1991-92. The trade regime in India was not only distorted with high tariff rates but there continued to be several exemptions as well as additional charges/surcharges at several points in time which continued to complicate the trading environment despite the lowering of peak rates of customs duty etc. These continued to remain as hurdles in the path of trade liberalization. Further, it is well known by now that both the ad hoc changes in 1980 and the changes in 1990s were mostly limited to tariff lines of intermediate and capital goods, agricultural consumer products and consumer products – durable and non-durables continue to remain with import controls and somewhat higher tariffs in relation to capital and intermediate goods. It was only after 2002-03 we find that substantial changes – tariff as well as NTBs were removed from tariff lines belonging to consumer goods. This is important and hence India’s reforms of its trade regime continued beyond 1990s. This makes it imperative to examine the level of trade liberalization beyond the 1990s into the period of 2000s, 2000-2010 which forms the core of this research. It is generally believed that industrial de-regulations on manufacturing sector along with changes in trading rules and regulations - tariffs, import controls stimulate competitive behavior amongst firms and in turn enhance industrial performance. As indicated earlier numerous studies have attempted to examine the trade- industrial performance for Indian economy. However a major limitation of many of these studies is that they have used a time dummy variable to capture the effect of reforms, which tends to pick up the effect of other changes taking place in the economy and may not properly show the effect of trade reforms. We attempted to overcome this limitation in using quantified measures of trade policy reforms as explanatory variables in our econometric exercise to discern if trade policy changes do have an impact on industrial performance? Objective of the Study is two fold -
To re-examine India’s efforts at trade liberalization for the 20 year period beginning 1990-91 at the level of manufacturing sector, especially in organized manufacturing. We will examine trends and patterns of lowering tariff as well as non-tariff barriers (QRs) at the total manufacturing as well as use-based sectors of manufacturing- intermediate, capital and consumer goods. To do this end, we compute and estimate - nominal as well as effective rate of protection, proxies for NTBs - frequency ratio as well as import coverage ratio. Finally, to assess the impact of simultaneous lowering of tariffs and non-tariff restrictions, we compute and analyze the patterns of import penetration rates. -
An assessment will be made of the impact of these measures on manufacturing performance for the period 1990-2010 through a quantitative framework. In particular, an econometric model based on panel data to explore the impact of trade liberalization on manufacturing indicators for the manufacturing sector in India covering the several phases of trade reforms beyond 1990-91. To assess the impact on manufacturing performance, we use variables that represent trade liberalization along with industrial policy reforms and macroeconomic business environment (including exchange rate uncertainty)7. Both the above objectives cover all sectors of organized manufacturing as well as the time period 1990-2010. The first objective is accomplished at the level of three digit industrial classifications based on NIC 1987 and the second is based on three digit industrial classification based on NIC 1998. Our reasons for using the two industrial classifications are the following- It is well known that Indian industries faced high levels of customs duties and import controls for almost four decades of inward looking development strategy of the Government of India, however when documenting levels of protection by manufacturing categories, it is very important that we acknowledge the differences in tariff rates when examining on the basis of tariff lines. Tariff lines are available at 6 or 8 digit level of disaggregation and a detailed breakdown of manufacturing groups into sub-groups as deep as three and four digit NIC allows a better documentation and examination of protection levels. NIC 1987 in our opinion has a better spread of sub-groups as compared to NIC 1998 three digit levels and hence the preference for NIC 1987. As regards, quantitative exploration through an econometric study, NIC 1987 cannot be extended further as concordance between the two classifications at three digit level is not comparable. Further, indicators of manufacturing performance like productivity, price-cost margins cannot be constructed further as no extension of NIC 1987 through mapping is possible, thereby forcing us to use NIC 1998 database for constructing our dependent variable (TFP in this case) 1.2 Sample and Time Period We compute measures of trade policy reforms- nominal and effective rates of protection (NRP and ERP), non-tariff barriers (FR and MCR) and import penetration ratio (MPR) for all sub-groups of organized manufacturing at three- digit NIC 1987. The three digit industries are covered under the following two digit heads as depicted in the annexure. In all, we have covered the entire organized manufacturing sector. Further, we have also made an attempt to document trade policy indicators by use-based sectors of organized manufacturing based on three digit sub-groups. The period of study extends from 1990-91 to 2009-10 to undertake an analysis of the impact of trade liberalization on manufacturing performance in Indian industry during the period when significant changes took place in the trade and industrial policy framework (trade policy statements of 1991-92) and consolidation of changes took place (trade policy statements of 1997-98 and 2002-03). The significance of the time period lies in the fact that though substantial reforms in trade policy happened in 1991-92, but the 2000s is important as trade policy document of 2003-04 to-2009-10 continues to simplify procedures on customs duties and lessen controls along with measures to boost exports [(Kowalski and Dihel (2009)] which address issues at India’s continued efforts at lowering protection levels in manufacturing. 1.3 Plan of the Study This study is structured in several sections. In the next section, we provide an overview of the research that has already examined the issues mentioned in the two fold objectives. We also highlight some of the major limitation of those studies so that we are put the present research in a better perspective. The methodology of the study is presented in section 3 and we outline the formulas which are used to compute the four measures of trade policy reforms. In section 4, we quantify the trade liberalization attempted so far in terms of the estimates of levels of trade barriers and outline the trends and patterns. The final section provides a detailed examination of the impact of trade reforms on manufacturing performance for the period 1990-2010. The final section concludes the study and lists avenues for future research. 2. Trade Liberalization and Indian Manufacturing - Review of Literature It is well understood by now that India’s attempt at trade liberalization was to create a trade regime devoid of import licensing as well as high rate of tariff on one hand and on the other to boost manufactured exports. Several scholarly writings have addressed the issue of trade policy changes in Indian economy (Panagariya (2004), among others). We attempt here to review the literature on trade liberalization and Indian manufacturing in two parts. First, we document the available literature on quantifying trade barriers and second, we examine the studies which have studied the impact of reforms in trade policy on Indian manufacturing. 2.1 Quantifying Trade Barriers - A Review India has had a very restrictive trade regime since the late 1950s. The major instruments of protection that have been used to regulate import demand have been an extensive import licensing system and high levels of tariffs. The economic costs of India’s trade regime have been a recurring theme in academic research [Bhagwati and Srinivasan (1978), Rao (1985), Pursell (1988)]. Further, the recommendations of official committees [Alexander (1977), Hussain (1984) and Narsimham (1984)] and policy statements have been influential in shaping the Indian thinking on trade liberalization. Starting from the early 1980s, there have been important import policy changes such as expansion of OGL list, shifting of goods from more to less restrictive lists, swifter and less administrative judgments and some reduction in the scope of canalization. In particular, there has been a relaxation of restrictions on capital and intermediate goods import, though primarily of commodities not competing with domestic production. The overall scenario that emerges from the major studies on Indian trade policies is that, the protectionist regime created a large and diversified industrial base and neglected the considerations of costs and comparative advantage, the consequence of which was the inefficient use of resources in Indian industries. There have been several studies documenting the protection accorded to Indian industry. These can be grouped as: (1) studies exploring the structure of nominal tariffs, (2) studies trying to analyze the level and structure of inter-industry protection and (3) those that attempt to quantify the extent of NTBs in Indian industry. Goldar, Narayana and Hasheem (1992) examine the pattern of tariff, statutory and realized during the 1980s at the level of broad groups and detailed product classes whereas Mehta (1999) documents the tariff rates for the 1990s by different sections and chapters of HS classification. The level and structure of inter-industry protection have been examined using both nominal tariffs and effective rate of protection [World Bank (1989), Aksoy (1991), Aksoy and Ettori (1992), Goldar and Hashim (1992), Gang and Pandey (1998) and Hashim (2001)]. Despite attempts to liberalize India’s import trade regime, the structure of import licensing has remained restrictive and complex. There have however been a few attempts to quantify NTBs according to the manufacturing sectors [Aksoy (1991), Mehta (1997), Pandey (1999), Hashim(2001), Das(2006) and Sen (2007)]. Table 2.1 highlights the studies that addressed a range of issues pertaining to the effects of the protectionist trade regime on industrial performance. | Table 2 1: Synoptic view of Studies of Import Protection in Indian Industries | | Study | Objective | Coverage | Measures | Main Findings | | World Bank (1989) | To study the level and structure of protection | Manufacturing
Sub-sectors
1986-87 | NRP and ERP based on Price Comparison | High levels of protection and inability to undertake process and product innovation | | Aksoy (1991) | To quantify the structure of import licensing regime and analyze the structure of tariffs | Input-Output Sectors
1987-88 | Nominal Tariff
& Frequency Ratio | Licensing system does not provide any additional protection. Absolute levels of tariffs are high and high tariffs on capital goods | | Aksoy and Ettori (1992) | To estimate the structure of incentives and protection | Three sectors:
Iron & Steel
Petrochemicals
Capital goods
1986-87 to
1988-89 | Nominal
Rate of Protection | High magnitude and variance of protection rates. | | Goldar and Hashim (1992) | To document the protection | Input-Output Sectors
1980-81;
1983-84;
1988-89. | NRP & ERP
[ Corden Measure] | Increase in Protection across I-O sectors; input based sectors & trade based sectors between 1980-81 to 1988-89 | | Mehta (1997) | To quantify changes in trade protection | Manufacturing sectors
1989-90
1993-94
1995-96 | NRP & ERP [Corden’s Method]
& Frequency Ratio | Significant decline in the level of protection; No QRs on more than 55%
Tariff lines. | | Gang and Pandey (1998) | To study the inter-industry structure of protection | Input-Output Sectors
1979-80
1984-85
1991-92
1996-97 | NRP & ERP
[Balassa and
Corden
Method] | Level of protection varies according to the notion of tariff rate used.
ERP levels indicate positive protection for 32 manufacturing sectors | | Pandey (1999) | To document NTB’s in Indian manufacturing | Input- Output sectors
1994-95
1996-97
1997-98 | Frequency Ratio & Tariff Equivalence
of NTB | Incidence of NTB shows a decline. The tariff equivalence calculated gives an indication of what the tariff rates should be | | Mehta (1999) | To document Tariff
and Non-Tariff
Barriers in the Indian
Economy | Sections of
and Chapters
of HS classification
1993-94 to
1998-99 | Average
Tariff Rate
& Frequency Ratio | Significant decline in average tariff rates, though the dispersion of the tariff rates has not declined. Only 28% of product lines subject to NTB by 98-99 | | Hashim (2001) | To examine the structure of tariffs and NTB’s | Input-Output
Sectors
1987-88
1992-93
1994-95
1997-98 | NRP and ERP
& Imports by Licensing Category | Steady decline in both NRP and ERP. Level and pattern of protection is dependent on choice of tariff rates. | | Source: World Bank (1989), Aksoy (1991), Aksoy and Ettori (1992), Goldar and Hashim (1992), Mehta (1997), Gang and Pandey (1998), Pandey (1999) and Hashim (2001) | Evidence from the studies covering tariff as well as NTBs suggests that there has been a conscious effort to dismantle the import licensing regime via reductions in the number of products listed under banned/ restricted category. The effective tariff structure throughout the 1980s and 1990s has been very complex due to the presence of various exemptions applicable on the basic duty rate. Further, the tariff rates have not only been high but have been covering almost all product categories in intermediate, capital and consumer goods sectors. Efforts have however been made in the 1990s to rationalize the structure of tariffs. Majority of the studies reviewed here have estimated nominal as well as effective rate of protection. Most of the estimates of ERP are either based on tariff data or the collection rate8. One particular study has attempted to use both published and realized tariff data for arriving at ERP estimates. The Corden measure of ERP is used very widely [Goldar and Hasheem (1992b), Gang and Pandey (1998), Mehta (1997), Hashim (2001 and Das (2003)]. The popularity of the Corden’s measure is reflective of the fact that it takes into account both the direct and indirect value added, while the Balassa measure accounts for only the direct value added.9. The extremely high tariffs apart from fulfilling the primary purpose of providing protection were aimed at generating revenue. In the pre-90 period, India’s policy regime for imports was complex and cumbersome. There were different categories of importers, several types of licenses and alternative ways of importing. This made the quantification of QRs very difficult.10 Majority of the studies computed either the frequency ratio or the import coverage ratio. These have been worked out for the whole -economy as well as manufacturing sub branches. Mehta (1997) and Pandey (1999) compute the NTB indices for the use- based sectors, whereas Aksoy (1991) and Hashim (2001) provided estimates of share of imports according to licensing categories for broad manufacturing sub-sectors. A major limitation of these exercises is that all these studies pertain to select time points. The review of the empirical findings points towards substantial reduction in the NTB levels across manufacturing sectors in the 1990s as compared to 1980s. We conclude that tariffs and quantitative restrictions have been important instruments of trade policy and played a crucial role in providing protection to domestic industry throughout the 1980s and part of 90s. It is also widely held that the protective regime has been responsible for inefficiency in resource-use, which constrained the growth performance of Indian industries. These studies however did not explore the effect of the protection on industrial growth and efficiency.11 2.2 Trade Liberalization and Manufacturing Dynamics Several studies have attempted to document trade openness impact on Indian manufacturing sector (Krishna & Mitra (1998), Balakrishnan et al. (2000), (Goldar and Kumari (2003), Topolova (2004), Das (2006), Mitra and Ural (2008), Sivadasan (2006, 2009) Topolova and Khandelwal (2011]. The early generation studies namely- Krishna and Mitra (1998) as well as Bala et al (2000) found a positive impact of trade reforms on manufacturing, but a major limitation of these studies is that it used dummy variables to represent trade policy changes and it may very well have captured other policy changes also. Both studies of Das (2006) and Mitra and Ural (2008) show favorable impact of trade policy reforms on manufacturing – Das (2006) attributes the lowering of NTBs enhances industrial productivity, whereas Mitra and Ural finds tariff cuts as well as lowering of NTBs impacting positively on industrial productivity. Topolova (2004), Topolova and Khandelwal (2011) and Trivedi et al 2011 find significant impact of tariff reduction on productivity growth. The complementarities between trade and industrial polices is well-known.12 Studies have also examined the impact of other policies on manufacturing performances - Mitra and Ural find that industrial deregulation impacts positively on industrial productivity, more so in cases where the labor market institutions are flexible. There is also evidence that fall in capacity utilization can counterbalance the positive impact of changes in trade policy (Goldar and Kumari (2003). Sivadasan (2006, 2009) find significant impact of FDI liberalization on firm level productivity. Our review of the studies based on countries from these studies point towards three important issues encompassing the trade-productivity literature. One, what is the appropriate measure of trade liberalization - use of dummy variables or a properly quantified trade policy outcome variable - like nominal tariffs, effective rates of protection, import penetration ratios! Two, whether the impact holds at all levels of disaggregation-firms versus industrial sub-groups? Finally, what is the nature of specification of the relationship between trade liberalization and performance indicator? Our assessment is the following. The review of the trade liberalization indicators confirms that it is not easy to combine different aspects of trade policy with a single measure. Further, in most developing countries, lowering of both tariff and NTB holds the key to successful trade liberalization. Thus, we ought to construct appropriate “measures” of trade orientation reflecting both the above aspects of trade policy changes. The inter-industry studies confirm that the trade-productivity is not specific to the level of disaggregation, as we observe both positive and negative impact at various levels of disaggregation. Finally, many of the studies recognized the role of non-trade policies particularly the possible influences of industrial structure as well as reforms in industrial policies in explaining productivity growth. 3. Methodology of the Study Trade interventions in developing countries are of two types: tariff and non-tariff barriers.13 The former remains the most pervasive form of import protection, although non- tariff barriers of various forms are common. Import tariffs are simply indirect taxes, which apply on a discriminatory basis, to imports. They may be ad-valorem or specific.14 The range of instruments that qualify as NTB is diverse, with some being fiscal, some quantitative, some involving monitoring and so on. Moreover depending on how one defines NTB, the list could be still longer.15 Findings of Balassa (1982) and Krueger et al. (1981) confirm that the use of NTBs is more pervasive in developing countries than in developed countries. Section 3.1 outlines the method for computing the nominal tariff. The Corden measure of effective rate of protection is discussed in section 3.2. The various measures of NTBs are presented in section 3.3. The final subsection outlines a combined measure of both tariff and non-tariff restrictions-import penetration rates. 3.1: Measuring Nominal Tariffs In terms of frequency, tariffs remain the most widely used instrument of commercial policy in developing countries. A tariff is an indirect tax; its rate is set by the fiscal authorities and is published in the tariff schedule. There is however practical problems involved in measuring nominal tariff.16 A number of methods have been suggested for measuring the nominal rate of protection. First, the published or statutory tariff-rates (the ex-ante rate). Second, the realized tariff rate, which is the amount of import duty actually collected, divided by the value of imports (collection rate). There are certain advantages to each of these measures, and the choice of a tariff measure depends upon the purpose to which these rates are going to be put. The ex-ante tariff gives an idea about the potential protective structure adopted by the Government policy, whereas the ex-post tariff accounts for all the duty exemptions that the Government allows. The protection afforded by the explicit tariff structure is modified by the presence of factors such as QRs, price controls, smuggling and under invoicing [Goldar and Hasheem (1992)]. Ex-post tariffs allow for the possibility of understating protection due to prohibitive tariffs [Greenway (1988)]. With nominal rates, the difference between domestic and world prices is assumed to result from Government policies that affect domestic prices. If nominal protection is positive, the Government is protecting the domestic industry through tariffs. If nominal protection is negative, the Government is taxing local producers. However, the nominal rates, by not taking account of how protection on intermediate products affects the incentive structure, do not accurately portray the degree of protection. The present study computes the nominal tariff rates for the three-digit industries (NIC 1987) by mapping tariff codes (HS)17 to the three-digit industries.18 The nominal tariff rate is computed by taking into account both basic customs duty and auxiliary duty.19 The effective nominal tariff rate is calculated after taking into account exemptions on account of both basic customs duty and auxiliary duty.20 The nominal tariff rate is computed as a simple average of the effective nominal tariff rates of the products situated within the particular industry.21 We calculate the nominal tariff rate for the manufacturing sub-groups and three use-based groups. The tariff rates have been derived from the Customs Tariff Working Schedule, Directorate of Publications, Customs and Central Excise, New Delhi. 3.2: Measuring Effective Rate of Protection Tariff schedules are inadequate guides to nominal protection when quantitative restrictions and not tariffs, are the binding instrument of trade policy22. Further, the nominal protection rate disregards the fact that the degree of protection conferred on an activity will depend not only on the any interventions which affect the price of the final good produced, but also by any interventions which affect the price paid for inputs into the production process. This major shortcoming can be overcome by estimating the effective protection rate23. The concept of effective protection discussed in Meade (1951) has been extensively refined by Johnson (1960) and Corden (1966). The effective rate of protection (ERP) is the per centage excess of domestic value-added, vis-à-vis world value-added, introduced because of tariff and other trade barriers. This measures the distortion introduced due to tariff on the input prices as well as the final output prices, and therefore, measures protection to domestic factors of production. The incentive structure of the domestic production process is described by the return to primary factors of production and the measure of protection based on value added is able to capture it. 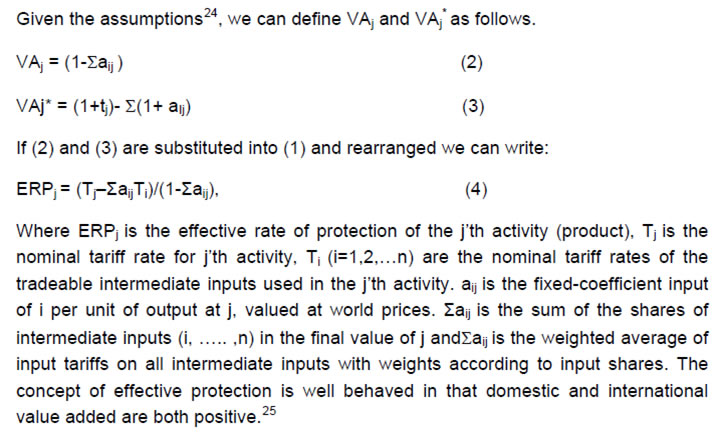 The forgoing aspect of effective rate of protection is predicated on a number of simplifying assumptions, not all of which concur with reality. Thus it is rare to find a production process where some intermediate inputs are non-traded, tariffs are not often the sole form of protection, and tariff imposition itself may have induced exchange rate effects, which influence the net protection conferred on a given activity. The treatment of non-traded intermediate inputs is important and introduces some complication into the calculation of effective rates. This issue is important because value added has to be determined by extracting the primary factors of production.26 It can be argued that we would expect the price of non-traded inputs to increase with protection because of competition for resources and aggregate expenditure effects. The extent to which their price increases then depends upon elasticities of substitution between non-tradable and tradable, both in supply and demand In the case of QRs, it will have a price raising effect. Further, it is difficult to compute the tariff equivalents of QRs. So long as it can be measured, the effective rate of protection would incorporate all interventions that distort domestic and international prices. Finally, protection may induce exchange rate changes. Thus id one group of industries are given protection, whilst some other group is not (say exporters), we might expect the trade balance to improve. Other things being equal, this should result in exchange rate appreciating, thereby eroding some of the benefits of protection. Some analyst attempt to adjust for induced exchange rate changes. Many of the measurement problems are “study specific.”27 The present study constructs the ERP measure based on Corden’s formula: where ERP j is the effective rate of protection for the jth activity (product), Tj is the nominal tariff rate of that activity, Tj (i=1,2,.., n) are the nominal tariff rates of tradable intermediate inputs used in the jth activity and aij (i=1,2,…n) are the cost shares of inputs in total value of production of the jth activity. The cost shares are computed after valuing output and tradable inputs at world prices. The data on costs of production are obtained from the input-output tables28. There are two ways of obtaining the free-trade input coefficients. First is to assume that a developed country (like USA, which has low levels of nominal tariffs) input coefficients could approximate the world input-output coefficient. The second is to assume that free trade prices are equal to the protected prices deflated by appropriate tariff rates. This gives the free trade coefficients as  We compute the Corden measure of ERP for the sample industries numbering 72 in all, as well as the use-based classification- consumer goods, intermediate goods and capital goods sectors for the three phases of trade: minor (1980-81 to 1985-86), moderate (1986-87 to 1990-91), major (1991-91 to 1994-95) and the period 1980-81 to 1994-95. The industry wise ERP’s are calculated by mapping the different tariff codes with the three-digit ASI industries. The detail of the mapping is discussed in Das (2001). The tariff rates for various product categories (items in the tariff working-schedule under BTN or HS codes) have been derived from the Customs Tariff Working Schedule.29 For each product category, the effective rate of duty was arrived at taking into account quantifiable exemptions and was restricted to basic and auxiliary duties. The ERP for a three-digit industry was based on the computed NRP valued at international prices. These ERP estimates are not adjusted for any exchange rate overvaluations, but nonetheless are representative of the sorts of levels and heights of effective protection found in developing countries. 3.3: Measuring Non-Tariff Barriers Non-tariff barriers (NTBs) dominate the trade regimes of most developing countries.30 NTBs consist of all barriers to trade that are not tariffs. It is even more general than that, since the term is often used to include trade interventions such as export subsidies that serve to stimulate rather than retard trade and therefore, are not barriers to trade at all. It also includes well-known trade distorting policies such as import quotas and voluntary export restraints.31 The measures range from narrowly conceived ones affecting particular products, industries and countries to more general ones that are rooted in national, institutions and policies.32 Thus it may be difficult to devise accurate quantification of many of these NTB measures. Some of the barriers may be formal and are explicitly stated in official and governmental mandates.33 It is important to mention that there is no single useful way of measuring the “size” of an NTB. NTBs require several parameters to characterize them fully. In this connection it is important to know the various characteristics of NTBs, even though that it may be difficult to capture them empirically.34 In order to quantify the particular occurrence of an NTB, it is important to look at the specific details of the implementation of that NTB.35 The specific details encompass direct information, which needs to be converted into useful form that can be understood and compared to other forms of trade interventions. There are however serious disadvantages to this direct approach especially as one is looking for a broad measure of NTBs.36 Even though direct information about NTBs is likely to be very accurate, it does not necessarily provide for a good starting point for a general analysis. Four different methods can be used for measuring NTBs. These are classified as: (1) frequency-type measures based upon inventory listings of observed NTBs that apply to a particular sector or categories of trade; (2) price-comparison measures calculated in terms of tariff equivalents or price relatives; (3) quantity-impact measures based upon econometric estimates of models of trade flows; and (4) measures of equivalent nominal rates of assistance.37 An issue that arises in common for all of these methods is how to aggregate the measurements once they have been obtained for disaggregated product categories. The own-country imports and own-country production levels are the weights used in the research but they have their quota of drawbacks.38 It is possible to construct a variety of measures that indicate the frequency of occurrence of NTBs. Such measures may be un weighted, or they may be weighted by imports or by production. The former is defined as frequency ratio and the latter as import coverage ratio. We calculated for purpose of quantifying non-tariff trade barriers, both frequency ratio and import coverage ratio for the 72 three-digit industries and three use-based industry groups for the three phases of the trade reform as well as 1980-9539. Thus, Frequency Ratio is defined as: j stands for a particular industry and i represents a product line within that particular industry. Di is a dummy variable, Ni and ΣNi represents the ith and the total number of product lines in the within a particular industry. Each product line (4-digit HS codes) is given either a number 1 or 0 depending whether the product is affected by a NTB or not. We made the following simplifications, items were treated as affected by NTB if they fall under the category: restricted (R). R covers all of the restrictive lists (banned/restricted, limited permissible and canalized) and hence given a weight of 1. The items under OGL were treated as free (F) and consequently given a weight of 0. Though this has obvious limitations, yet one was constrained to making this simplification in order to build a consistent series for the entire period 1990-2010.40 Thus, Di = 1, if the product is listed under R [banned/restricted, limited permissible, canalized].41 = 0, if the product is listed under F [OGL list]. The import coverage ratio is defined as: Where Di is as usual a dummy variable defined as: Di = 1, if the product is listed under R [banned/restricted, limited permissible, canalized] = 0, if the product is listed under F [OGL list]. j stands for a particular industry and i represent a product line within that particular industry. Mi is the value of imports of the i th product category (4digit HS code) which is subject to NTBs (R in our study) and Σ Mi, is the sum of the value of imports of all the product lines within the industry. The measure has the virtue of simplicity, both in its computation and interpretation, but also has some limitations.42 NTBs can also be gauged in terms of its impact on the domestic price in comparison to some reference price. Price comparisons have provided the basis for much of the general empirical work that has tried to quantify them and not just identify where they occur.43 For computing these measures of NTB according to the three-digit industries, we need the following data: (1) information on the product lines within an industry subject to NTB and (2) import values for product lines. ASI does not provide information on industry according to product lines, thus necessitating a mapping of product lines (4-digit HS codes) to the respective three-digit industries.44 The yearly import-export policy documents, published by the Ministry of Commerce, Government of India were utilized to determine the number of product categories subject to NTB. The import values at four-digit HS codes were obtained from the yearly issues of the Monthly Statistics of Foreign Trade, published by the Directorate General of Commercial Intelligence and Statistics (DGCIS), Ministry of Commerce, Government of India. The calculation of import coverage ratio over a period of time allows us to quantify the change in NTBs over time by industries. Though coverage ratios are useful indicators of NTBs, they do not actually show the impact in terms of the price advantage domestic producers get nor do they give us any idea of its likely impact on industrial performance. Due to lack of suitable time-series data on domestic and international prices by industry groups, we are unable to compute tariff-equivalent indicator of NTB45 3.4: Measuring Import Penetration Rates In the trade regime of India, where both QRs and tariffs played a dominant role, it is important to assess the combined impact of changes in both constituents of trade policy. Lowering of tariffs combined with shifting of products from restricted list to OGL should lead to an increase in the imports. The opposite results from a hike in tariffs and reverse shift in quantitative restrictions. We calculate the import penetration rate for three-digit industry as the ratio of industry imports to domestic availability. Domestic availability is defined as production plus imports minus exports. Aggregating the exports and imports of the product lines situated within a particular industry, we arrive at industry exports and imports.  j stands for the industry. Y, M and X represent production, imports and exports. ASI does not provide values of export and import by industry groups for any level of disaggregation. We generate industry wise export and import data by establishing a mapping between trade data (imports and exports) available at product levels and ASI three-digit industries.46 Value of the gross output is used, as information on physical production by industry groups is not available. The yearly data on import and export data is available in the Monthly Statistics of Foreign Trade whereas the production data is proxied by the gross output from ASI. 4: Empirical Measures of Trade Liberalization The following sections document and analyze the trends in the important indicators of trade liberalization for the three digit manufacturing groups as well as use-based industries covering the entire organized manufacturing of India for the phases of trade reforms as indicated by various trade policy stance of the Government during the period 1990-2010.As an indicator of trade policy measure based on solely on tariff, the nominal tariff and effective rate of protection have been computed. As a proxy for non-tariff based trade policy measure, we document both frequency as well as import coverage ratio for the above mentioned industry groups and time periods. Finally, to assess the joint effects of both tariffs as well as non-tariff protection, we computed the import penetration ratios. To understand the significance of these indicators of trade policy reforms and its impact on manufacturing sector, it is essential to view the progress of the manufacturing sector. The listing of India in the ranks of emerging nations of the world has been considerably driven by service sector performance as engine of growth. India’s manufacturing sector on the other hand contributes about 16 per cent to the GDP, and India’s share in world manufacturing is only 1.8 per cent. This is in stark contrast to China; where manufacturing contributes 34 per cent to the GDP and is 13.7 per cent of world manufacturing (Manufacturing Plan, Government of India). The trade and industrial policy reforms since 1991-92 were aimed at making Indian manufacturing competitive and thereby boosting manufactured exports. Figure 4.1 documents the manufacturing growth observed from 1991 with focus on the decades of 1990-2000 and 2000-2010. Interestingly we find that against a growth of around 5 per cent per annum in the 1980s, the manufacturing sector is now growing at 8 per cent per annum. The pertinent question to pose here is that how much of this reflects the long term changes in trade policy – first ad hoc in the 1980s and then substantial in 1991-92 economic reforms. 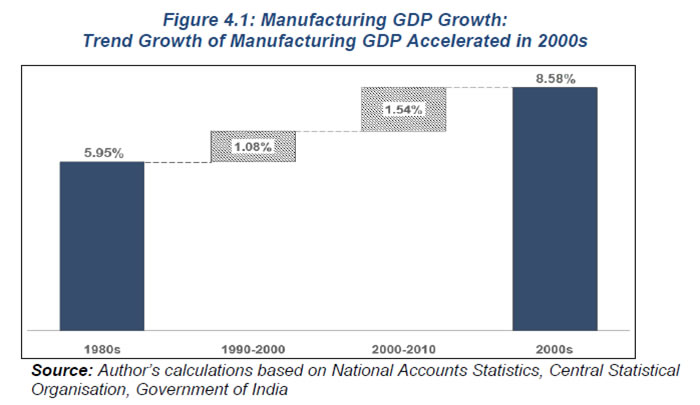 Over the last ten years, India’s merchandise trade increased manifold from US$ 195.1 billion in 2004-05 to US$ 764.6 billion in 2013-14 (Economic Survey 2014-15). The growth in merchandise exports is around 20 per cent and imports around 28 per cent according to the latest economic survey. These numbers reflect the long term impact that have been brought about by changes in the trade policies of 1991-92 and successive trade policy documents that have continued to lower tariffs and reduce the multiple exemptions that encompassed India’s trading regimes. To this end, in Figure 4.2 we document the three measures of trade liberalization- nominal and effective protection rates, NTBs and import penetration rates for the all manufacturing for two points in time 1990-91 and 2009-10. We observe huge downward slides for both the tariff based protection levels (in both cases we find more than 100 per cent declines). In terms of NTBs as captured by frequency and import coverage ratios- we find that only 5 per cent of all manufacturing items are covered by non-tariff based restrictions and given India’s diversified manufacturing base, this shows major liberalization of non-tariff based trade regime. The import penetration though shows an increase from 10 per cent to 15 per cent at the level of all manufacturing, yet the gain here has not been commensurate with the overall lowering of barriers- both tariff and non-tariffs. To conclude, we observe substantial lowering of trade restrictions for manufacturing in India.  To comprehend the extent of these trade liberalization efforts it is necessary to look at the impact in a disaggregated set up. The efforts at trade reforms were sequential- as early as mid- 1980s, Government was making effort in shifting manufacturing products from complicated restricted lists- limited permissible, restricted and banned to open general licensing- where it was freely allowed to be imported with tariff (albeit high tariff rates). After creating this level playing field for domestic entrepreneurs, there was full scale removal of NTBs except for a small restricted list along with lowering of high tariff rates in 1991-92.47 We therefore, need to document the trade liberalization efforts for manufacturing sub-groups, sectors and use-based groups, etc., to gauge who has benefited from the removal of trade restrictions and this is what we have attempted to document in the following sections with each of our three measures of trade liberalization. Section 4.1 documents the trends and patterns of tariff based trade barriers. In section 4.2, we discuss and document the non-tariff based trade barriers and section 4.3, the joint impact of tariff as well as non-tariff restrictions are documented by import penetration rates. 4.1: Tariff Based Trade Liberalization - Trends and Patterns In this section, we present our estimates of tariff based measures of trade liberalization – both nominal as well as effective rates of protection for total manufacturing, use-based groups and three digit manufacturing sub-groups. The estimates are provided for the following periods of trade reforms- 1990-91 to 1996-97, 1997-98 to 2002-03 and 2003-04 to 2009-10. These phases are connected to the trade policy documents of the Government of India, which showcase India’s trade policy regime with respect to export and import. We observe both variations across sectors as well as over time. At the level of total manufacturing, we observe sharp declines in both nominal as well as effective rates of protection from around more than 100 per cent to a drop of around 20 per cent for the overall manufacturing sector. Figure 4.3 shows that the levels of trade protections declined sharply since 1991-92 trade reforms. If we look at the entire period 1990-2010, we find that the rate of decline varies between early 1990s and since 1995-96. The tariff reforms in the 1991-92 were directed more towards the capital and intermediate goods sector and these sectors saw sharp declines to low levels from very high tariff rates. The 1997-98 trade policy reforms brought more sectors into the fold of low tariff levels especially lowering of tariffs on consumer goods. 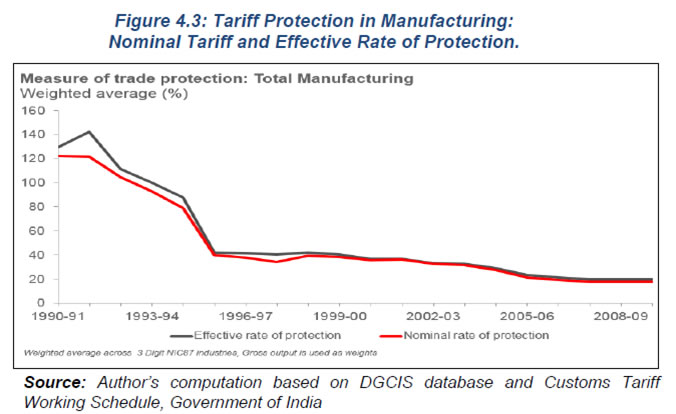 We next document the trends in NRP and ERP in the use-based sectors- capital goods, intermediate goods and consumer goods. As is well known by now, trade policy changes have been substantial beginning 1991-92 economic reforms and this is evident from Figure 4.4. In panel A, we document the NRP levels and in panel B, we provide estimates for ERP. In both panels we find evidence that support each other- both measures of trade liberalization indicate that lowering of protection was much more in the case of capital goods and intermediate goods in relation to consumer goods. Second, the fall in tariff rates were much sharper in the earlier period in comparison to the period after 1996-97. This indicates that after a substantial revamping of the rates of protection, there has been a gradual and steady decline to the prevailing present levels after the mid-1990s. It is also evident from both panels that the tariff levels for consumer goods still remain at a level higher than that of intermediate and capital goods, where the rates seem to steadily merge to very low levels of tariffs. 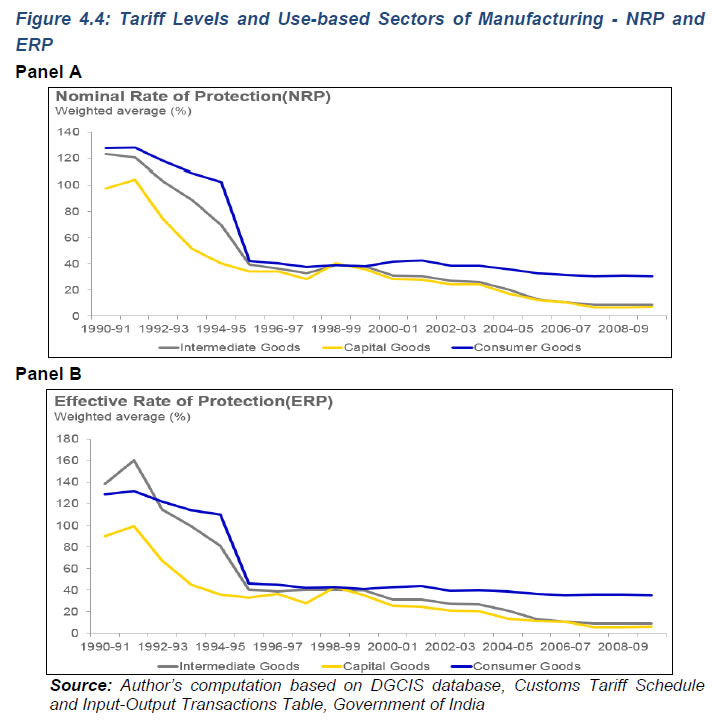 We also look at the distribution of industries across different levels of tariffs for select time points- 1990-91, 1995-96, 2000-01 and 2009-10 (see Figure 4.5). As already indicated major downward revision in tariff rates across industry sub-groups happened with the trade policy reforms of 1991-92. We find from figure below that in 1990-91 around 80 per cent of industry groups- three digit NIC, had tariff levels of more than 100 per cent. This also holds true in terms of ERP. This documents an extremely skewed distribution of tariff levels for Indian manufacturing in the period prior to policy reforms. Following trade reforms, we find in 1995-96, that the all industries were concentrated within the tariff bands of 20-50 per cent, signaling a major downward revision of tariff rates across most tariff lines. The period of 2000s present an even better picture of trade liberalization across industry groups. In 2000-01, we find the number of industries in the tariff band of 30-40 per cent substantial increase from around 23 per cent of all manufacturing to around 65 per cent of total manufacturing. Further, we take the 20-30 per cent band we find that almost 90 per cent of manufacturing groups have low tariff levels. The fall in tariff rates have been substantial by 2009-10 with majority of the industry groups around the 0-10 per cent tariff levels. Panel B of Figure 4.5 documents the trends in terms of effective rates of protection. The difference between the two panels is mainly in terms of the spread of industries according to the rates of effective protection. The story however remains the same in terms of sharp declines in levels of protection. Given that the degree of protection conferred on an industry is a function of both output and input price changes brought about by lowering of tariff rates, measure of tariff reduction based on effective rates of protection sums up adequately India’s attempt at tariff liberalization. The final picture that emerges is that from around 82 per cent industries exhibiting ERP levels of more than 100 per cent in 1990-91 to around 80 per cent of industries having ERP levels of less than 20 per cent in 2009-10. We observe that within the category of less than 20 per cent protection, the proportion of industries differ for NRP and ERP and this has implications for trade reforms. This conveys and sums up India’s efforts at not only reducing the complexities of rules and regulations governing tariff rates but also the opening of the economy. 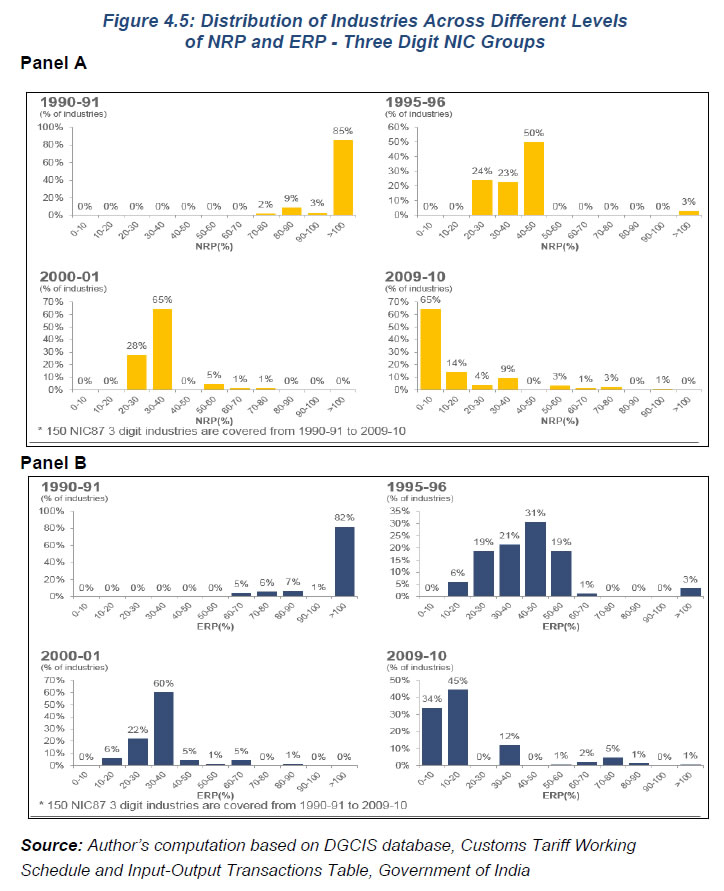 Appendix Tables A1 and A2 shows the NRP and ERP for all manufacturing sub-groups listed under heads of use-based classifications. As can be seen, we observe wide variations across use-based groups as also within sub-sectors of each group. We also observe that there is a pattern of successive decline in tariffs for majority of sectors since the first period (1990-91 to 1996-97). This is evident for both nominal as well as effective rates of protections. The extent of decline across intermediate and capital goods sub-groups is more than that of consumer goods. It has to be kept in mind that most of the consumer goods sector did not experience substantial tariff reforms as in the other two sectors – capital and intermediate for much of 1990s. The trade policies of 1997-98 and 2003-04 however show lowering of tariffs for many of the tariff lines belonging to consumer goods. ERP estimates across manufacturing sub-groups show that despite the substantial across the board lowering of tariff rates the protection levels were rather high in the first period. It is only from the second period, that we find evidence of systematic decline for most industry groups. There is further consolidation of the decline in the 2000s. In the 2000s, interestingly, we find evidence of an increase in protection levels for some items of manufacturing belonging to consumer goods- food, beverages etc - two digit groups 20, 21 and 22. This is evident across nominal tariff rates as well as ERP levels. In contrast, manufacturing items belonging to intermediate and capital goods have protection levels as low as less than 15 per cent per annum. Figure 4.6 compares the decades of 1990s with those of 2000s with respect to nominal rate of protection levels of manufacturing sectors. The figure shows that there was a sharp fall in tariff levels in the 1990s especially since the trade policy reforms of 1991-92 as compared to the 2000s. As of 2000-01, there were just four major tariff categories: 35 per cent, 25 per cent, 15 per cent and 5 per cent. The majority of the manufacturing subgroups are in the 3rd quadrant reflecting much steeper falls in 1990s as compared to 2000s. This is because tariff levels dropped from very high levels post 1991-92 reforms as a policy of phased reduction in maximum tariff rate was combined with a reduction in the average level as well as in dispersion of rates. Manufacturing groups like metal products, basic metals, rubber/ plastic products, exhibit steep declines in ERP levels in 1990s. 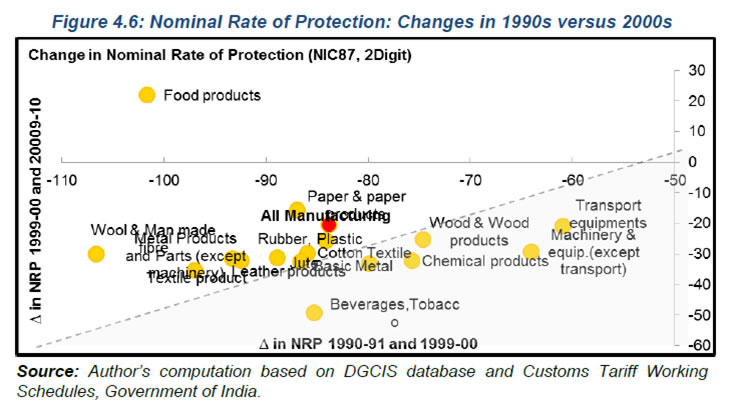 The figure points to some outliers-consumer products. The extreme restrictiveness of the pre-reform regime can be seen from the fact that in 1990-91, the import-weighted average rate of tariff was around 164 per cent, on consumer goods imports (World Bank 2000a, Annex Table 6.6). Further, pre-reform tariff and NTBs on consumer goods were left in place initially in 1991 and reduced only much later. Therefore, the manufacturing sub-groups like beverages and tobacco show sharper decline in 2000s as compared to 1990s. The case of manufacturing sub group-food products however shows an increase in tariff rates in 2000s reflecting an increase in ERP levels. This could partly be explained by the fact that in 2001, India published a list of 300 sensitive goods. Domestics production of these products were protected by use of high tariff rates or various non-tariff measures which are compatible under the article XX b (protection of human, animal or plant life or health) or article XXI (security or defense reasons). In conclusion, we find that external sector reforms since 1991 amongst others showed significant reductions in tariff rates and their dispersion. This is captured by lowering of both nominal tariffs (NRP) as well as effective rates of protection (ERP) across all manufacturing sub-groups and use-based sectors. The 2000s allowed further reduction in levels of tariff based protection48 with existing levels of tariff around 10 per cent on an average. The full impact of India’s attempt at trade liberalization can only be inferred after we have examined the lowering of NTBs (quantitative restrictions) in manufacturing in the next section. 4.2 Non-tariff based Trade Liberalization - Trends and Patterns Non-tariff barriers operating through the import licensing system have long been the principal means of regulating imports and protecting domestic industries.49 The complexity of the import regime makes it very difficult to quantify the impact and significance of the QR.50 We quantify the extent of NTBs by three-digit industries for the period 1990-91 to 2009-10 using the following measures- frequency ratio and import coverage ratio.51 The first attempt at removal of NTBs in Indian manufacturing started in the late 1970s with commissioning of a report by Abid Hussain (1984) to study the existing trade regimes in manufacturing and to shift away from physical controls. Against the backdrop of this development, the second attempt at removal of NTBs started in mid-1980s with the shifting of tariff lines belonging to capital and intermediate goods to the OGL and finally, in 1991-92 trade reforms, India did away with all kinds of quantitative barriers except for categories deemed essential on health, defense and environment grounds. As with tariff based levels of trade protection, the estimates are provided for the following periods of trade reforms- 1990-91 to 1996-97, 1997-98 to 2002-03 and 2003-04 to 2009-10. These phases are connected to the trade policy documents of the Government of India, which showcase India’s trade policy regime with respect to export and import. We observe both variations across sectors as well as over time. At the all manufacturing level, we find from Figure 4.7 that both Frequency Ratio (FR) and Import Coverage Ratio (MCR) show a sharp fall in 1991-92.The pre-reform share of 90 per cent has been significantly reduced to 36 per cent by 1996 and declines to less than 10 per cent by the beginning of 2000-01. Das (2003) provides trends in NTBs for the period of 1980s for select sectors of manufacturing and it is evident that nearly 100 per cent of tariff lines across the select manufacturing sub-groups were under import restrictions of one category or other- limited permissible, restricted and banned and post 1991-92 reforms, substantial decline in the number of items subject to import restrictions have occurred. 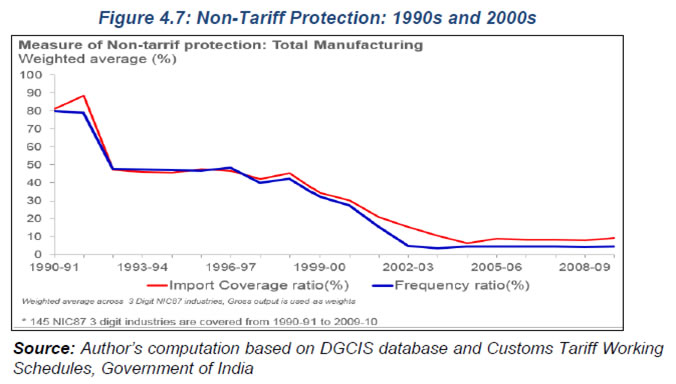 It is evident from the above figure showing the sharp rate of decline in levels of NTBs even beyond 1991-92 reforms. This was addressed in the trade policies of 1997-98 and 2002-03 which lifted the prevailing QRs for many tariff lines belonging to items of consumer good leading to even further lowering of non-tariff protection for the manufacturing sector. We next look at the trends for the use-based sectors of manufacturing. As is evident from Figure 4.8 both FR and MCR show steeper declines for intermediate and capital goods in comparison to consumer goods. The 1992-92 reforms majorly addressed easing of non-tariff restrictions for intermediate and capital goods (refer to 1991-92 trade policy reforms). Whereas a beginning was made in mid 1980s in terms of piecemeal shifts of items to OGL, the 1991-92 policy advocated complete withdrawals of all NTBs except a few prior notified categories and consumer goods. As a result, it is evident from the figure that post 1991-92 there as a divergence between the lowering of QRs for capital/intermediate goods and consumer goods as for much of the 1990s, there was still substantial import restrictions (non-tariff barriers) for consumer goods. It was only after 2002-03 there all three use-based sectors have converged to low levels of FR and MCR. 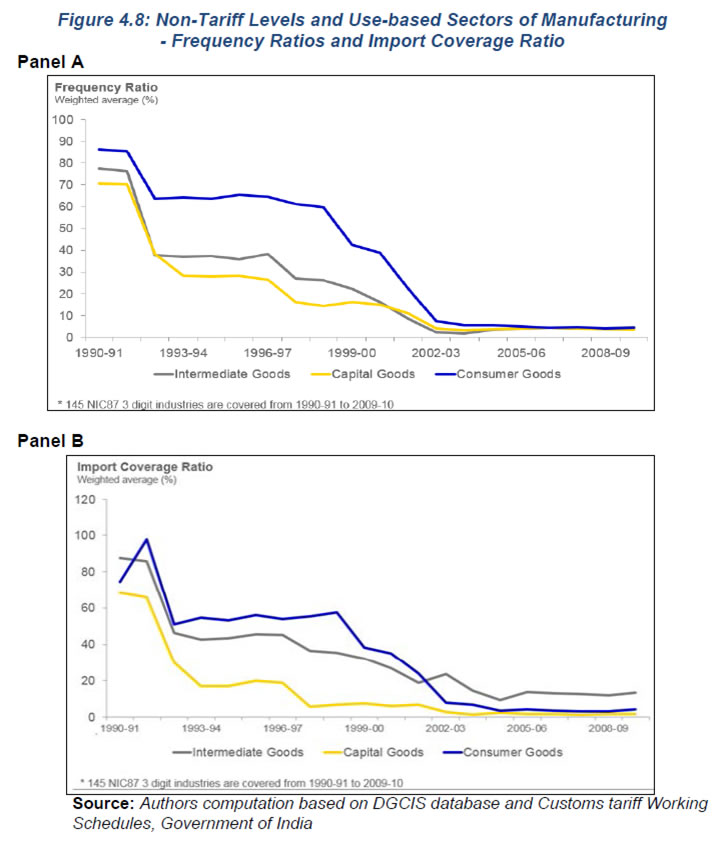 The distribution of industries across different levels of NTBs (both FR and MCR) is highlighted in the Figure 4.9 below. In the upper panel, we cover the frequency ratio and in the bottom panel, import coverage ratio is documented. Observing four different time points-1990-91, 1995-96, 2000-01 and 2009-10, we find that 65 per cent of industries had FR>80 per cent in 1990-91 and by 2009-10 96 per cent of industries had FR<10 per cent (In terms of MCR - 75 per cent of industries had MCR>80 per cent in 1990-91, by 2009-10 83 per cent of industries had MCR<10 per cent). It is interesting to point that though sharp lowering of NTBs has been in place since the 1991-92 reforms, yet at the level of industry groups, we still find that still 50 per cent of manufacturing subgroups have trade protection based on non-tariff levels (based on MCR) of greater than 50 per cent. In 2000-01 however we observe 40 per cent of manufacturing in the 0-10 per cent import restriction levels (see bottom panel). We infer that most of manufacturing subgroups by the end of 2009-10 fall in the lowest slab (0-10 per cent) NTB, however for much of 1990s and early 2000s this groups was essentially from capital and intermediate groups as evident from Appendix Tables A3 and A4. 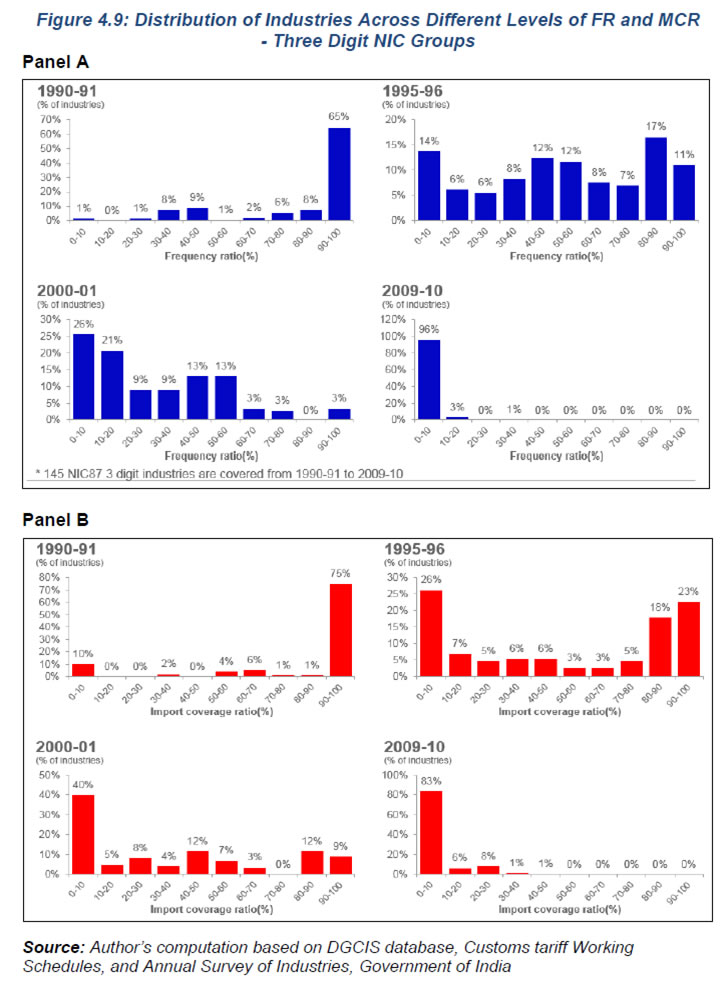 Appendix Tables A3 and A4 quantifies the non-tariff barriers (FR and MCR) by manufacturing sub-groups. As is evident from tariff based protection, there are wide variations across the subgroups even for non-tariff protection. Both FR and MCR indicates that non-tariff protection levels fell sharply for manufacturing subgroups within 30,31,33,34, 35, 36 and 37 as indicated in 1991-92 trade policy and continued to decline in 1990s and by 2009-10 reached the level of near zero. The lowering of QRs for sub-groups in textiles (23, 24 25 26), wood (27), paper (28), cement etc (32) came much later in the period 1997-2002. Further some consumer goods- food, beverages and tobacco (20, 21, and 22) still had around 50 per cent of items under restrictions and it is only after 2002-03 we find lowering of NTBs. Our examination of manufacturing subgroups reveals that the case of dismantling of QRs has happened in a phased manner for many manufacturing sub-groups excluding capital and intermediate groups since 1991-92 We now examine the period of 1990s versus 2000s in order to understand the manner of lowering of NTBs. It is clearly evident from Figure 4.10 that major manufacturing sub-groups like- machinery & equipment, transport equipments, metals experienced massive lowering of QRS in the 1991-92 reforms to almost negligible proportions. Further, it is interesting to observe the extent of decline across major manufacturing sub-sectors. The placing of the some of the capital goods sub-groups shows that lowering of barriers have already started before the 1991-92 reforms as evident from 1985-86 trade policy statement. It can also be seen that some of the labor intensive groups like textiles and food products have declined more in the 2000s as compared to 1990s, the reasons for which have been spelt out earlier. 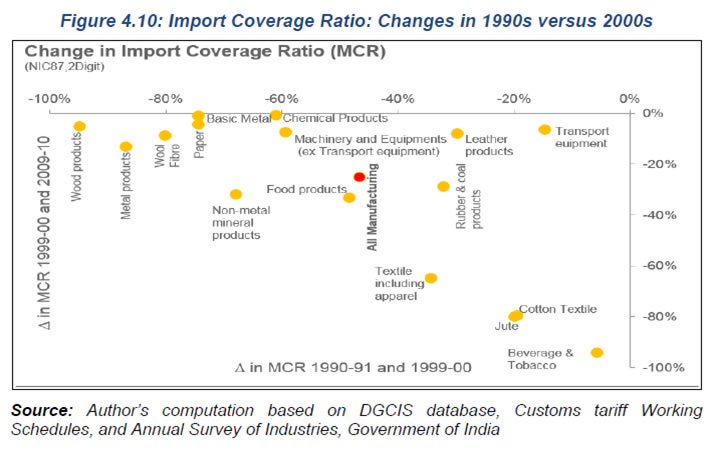 We conclude that it is evident that the trading regime with respect to QRs began to be administered more liberally in the 1980s, but granting of licenses remained discretionary. The first phase of dismantling QRs occurred in the first two years of the 1991-92 reforms when import licensing was virtually abolished for imports of industrial raw materials, intermediates, components, and capital goods and this is reflected in our estimates of both FR and MCR for use-based sectors- capital and intermediate. Our estimates also indicate the vast tariff lines catering to industrial consumer goods remained subject to import controls.52 Continuing with a near infinite protection for consumer goods for much of 1990s, while liberalizing other imports has been widely criticized as illogical because it distorted resource allocation in favor of highly protected consumer goods industries and away from basic and capital goods industries which are otherwise thought to be 'strategically' important (Ahluwalia M 2000) 4.3 Combined Tariff & Non-tariff Trade Liberalization - Import Penetration Rates The import-export policy announced in April 1985 incorporating the recommendations of the Abid Hussein Committee on trade policy reforms (1984) favored a greater role for tariffs in regulating imports. Simultaneously in 1980s there were changes taking place in the import-licensing regime necessitating the shifting of products from one category of licenses to another. The trade liberalization attempt initiated with the announcement of the trade policy changes in 1991-92 aimed at creating a globally competitive environment via reducing the degree of licensing and regulatory controls on foreign trade. A major focus of the new trade regime related to lowering the structure of import duties and quantitative restrictions on imports.53 The lowering of tariffs and abolition of import controls are intended to bring about competition via imports in the manufacturing sectors. We document the import penetration rates (MPR) for the manufacturing and its sub-groups54 for the period 1990-91 to 2009-10 in order to assess the joint impact of reductions in both tariff and NTBs on the manufacturing sector. Figure 4.11 documents the MPR for total manufacturing as well as use-based sectors of manufacturing for the period 1990-91 to 2009-10. At the level of total manufacturing the change in MPR has been from 9.7 per cent in 1990-91 to around 18 per cent by the end of 2009-10, a near doubling within 20 years. Capital goods achieved the highest level of import penetration followed by intermediate and consumer goods in the period 1990-2010. Further, across all the three sectors, the increase has been consistent in the upward direction since the 2000s. 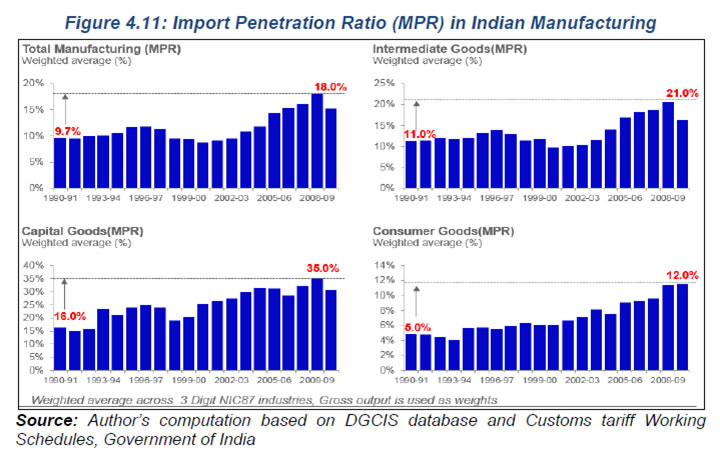 We next look in Figure 4.12 at the distribution of industries across different levels of MPR.55 We look at four time points which represents different phases of trade liberalization- 1990-91 is the era of piecemeal attempt at trade reforms, 1995-96 and 2000-01 is the consolidation of 1991-92 trade policy reforms, 2009-10 reflects the end point reflecting twenty years of trade reforms.56 The overall inter temporal pattern of change in import penetration ratios observed in the figure seems to hold across all sectors of manufacturing. We however conclude that 67 per cent of industries had MPR less than 10 per cent in 1990-91, by 2009-10 it has come down to 42 per cent thereby indicating that a large number of industries are now concentrated outside the lowest slab of MPR. However it remains to be examined which manufacturing subgroups are showing higher levels of import penetration. 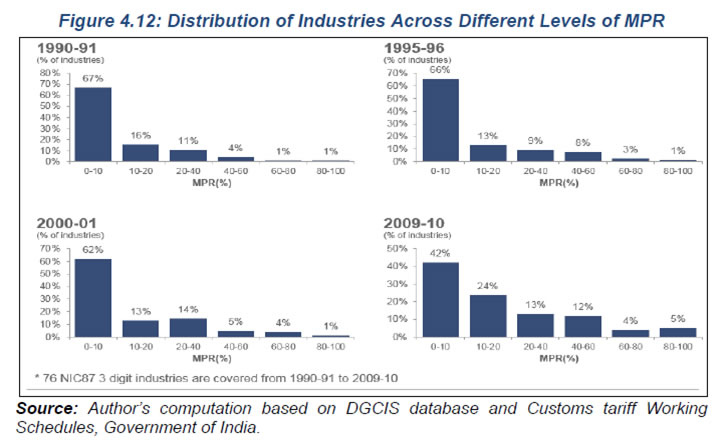 We list the levels of import penetration ratios by manufacturing sub-groups. Appendix Table A5 lists the various manufacturing sub-groups for the three phases of trade liberalization addressed in this report- 1990-96, 1997-2002 and 2003-2010. As is the case with other measures of trade liberalization- tariff and non-tariff, we find that extent of import penetration is higher in capital and intermediate goods manufacturing sub-groups- metal products (33), non-metal products (34), machinery and equipments (35), electrical machinery (36) and transport equipments (37) all show a high ratio of imports to domestic production. This has shown considerable improvements since period 1990-96. However there still remains manufacturing sub-groups which even in period 2003-10 show low levels of import penetration-Food, beverages and tobacco (20-22), spinning of cotton, wool, manmade and jute textile (235, 242, 247, 254), consumer goods (blankets, shawls, carpets), labor intensive categories like (wood, cane bamboo products, leather footwear), The organic and inorganic chemicals have shown a rise in import penetration from 22 per cent to around 50 per cent in the third period. Most of these manufacturing groups have seen substantial reduction in tariff rates as well as removal of import restrictions. Next we do a scatter plot (see Figure 4.13) to examine if there is a link between reduction of tariffs as well as NTBs and rise in import penetration rates. The two scatter diagrams show the relationship between fall in tariff level/ fall in non-tariff levels to changes in import penetration ratio. In the upper panel, as expected we see a positive relationship between falling nominal rate of protection and increase in import penetration ratio. When we compare falling nominal rate of protection across 2-digit NIC87 industries, we can see metal products(34) has observed highest fall in tariff level since 1990-91 which resulted maximum increase in import penetration. But textile sector in spite of experiencing fall in tariff level, import penetration did not improve in the last two decades. We have also tried to capture the level of NTBs across these 2 digit industries using the size of the bubbles, which signifies fall in import coverage ratio since 1990-91. For example: even though leather industries experienced similar level of fall in tariff level since 1990-91 compared to metal products, but fall in NTBs (as represented by the size of the bubble) was much smaller compared to metal products which may explains its relative poor performance in import coverage compared to latter. Similarly in the lower panel, we address the same issue with respect to fall in non-tariff levels (proxied by FR) and rise in import penetration ratio. We have also tried to capture the level of tariff barriers across these 2 digit industries using the size of the bubbles, which signifies fall in nominal rate of protection since 1990-91. The cases of metal products vis a vis transport industries reveal the relatively higher fall in NRP and hence the size of the bubble. 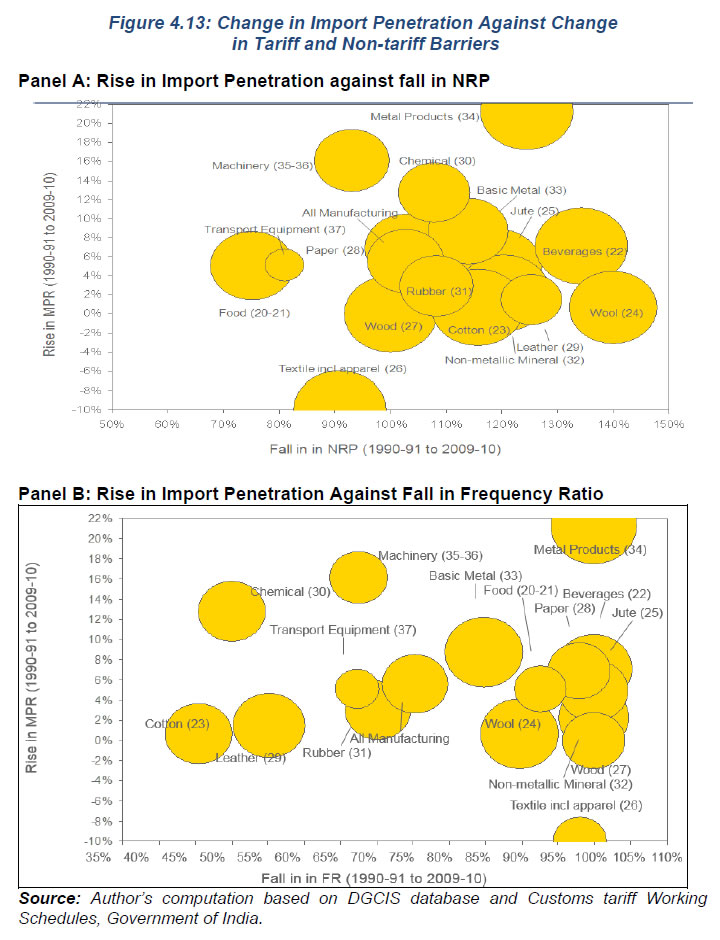 Given that tariffs were reduced and NTBs were eliminated under the reforms, we would expect to see a rise in import penetration across manufacturing sub-sectors of Indian manufacturing. For the empirical analysis, we have used information on both tariff and NTBs by manufacturing groups to assess the impact on import penetration rates (MPR). Our estimates show that for total manufacturing, there has been a substantial rise in levels of MPR from 1990-91 and capital goods manufacturing achieved the highest level of import penetration by 2009-10. In conclusion, we state that by end of the first decade of the 2000s, most industries faced very little protection, in contrast to the high rates of protection accorded to the manufacturing sector till the 1991 reforms. One important aspect of trade policy reforms in India to keep in mind is the pace of the reforms differed significantly across capital goods, intermediate goods and consumer goods. The reduction in protection was much more drastic and faster for capital and intermediate goods. In contrast, the consumer goods sector remained protected for much of the 1990s. Our measures of trade liberalization presented in this section bear testimony to this. In particular, trade protection measured by nominal import tariff as well as effective rate of protection were brought down substantially in 1990s. Non-tariff protection got almost halved by 1992-93 and become less than 10 per cent by the beginning of 2000-01.Two, Capital goods saw faster reduction in ERP as well as NTB during 1990s compared to intermediate & consumer goods. Three, at the level of total manufacturing the change in import penetration rates show a near doubling within 20 years from around 9.7 per cent in 1990-91 to around 18 per cent by the end of 2009-10. We have also compared the period of 1990s versus 2000s in order to understand the manner of lowering of tariff as well as NTBs. We confirm that there was a sharp fall in tariff levels as well as quantitative restrictions in the 1990s as compared to the 2000s57. The periods of 2000s were more aimed at simplifying the trade procedures as well as boosting exports. 5: Exploring the Link between Trade Openness and Industrial Performance An important issue for developing countries is the link between trade policy regime and industrialization. The role of unilateral trade liberalization in the process of industrial growth in developing countries however continues to be widely debated. Exposure to international competition forces domestic producers to raise their productivity performance to international levels and the expansion of market size beyond the national borders through exports allows scale economies to be realized. The proponents of import substitution based their policies partially on infant industry protection and rapid growth in productivity was expected when industrial skills along with modern technology were mastered. There have been many attempts to investigate the possible links between trade policy and productivity growth [See Pack (1988), Havrlyshyn (1990) and Tybout (1992)]. The first major NBER project conducted by Bhagwati and Krueger in the 1970s failed to find any firm support for the hypothesis that trade liberalization stimulates productivity growth. However, there are a number of studies that correlate aspects of policy regimes with measured changes in total factor productivity at the industry level. Helleiner (1994)58 presents empirical evidence for selected countries covering the period of 1980s and observes that the relationship between TFP growth and trade regime is by and large inconclusive. In the macro economically turbulent 1970s and 1980s, trade policy did not generally play a major role in the growth and development experiences of the selected countries. External-shocks, debt crises necessitated macroeconomic policy responses that dominated other determinants of industrial and overall economic performance. Industrial productivity growth was typically associated strongly with output growth; its relationship with the trade policy regime or the trade orientation of the individual industries was unclear. Thus the empirical verification of the impact of trade liberalization on industrial productivity growth is far from resolved. This study seeks to address this problem in the Indian context. 5.1 Modeling the Impact of Trade Liberalization on Productivity Growth Static and dynamic effects of trade policy changes are conceptually distinct in that the latter involve a time dimension. However, all responses to policy take time, even those that can be analytically described with a static model. Trade Liberalization brings about competition within the industries, however response of firms often depends on entry/exit barriers, scale economies and form of protection- tariffrΔ versus quotarΔ. The standard argument is that foreign competition drives inefficient domestic producers to exploit scale-economies, eliminates waste, adopt best practice technologies or shut down.59 Further, given the short time-periods spanned by micro-data, it is rarely possible to distinguish transitory one-shot adjustments in productivity levels from lasting changes in the rate of productivity growth60. Recently endogenous growth- trade theorists have formulated a range of models, in which trade contributes to productivity growth via increasing the quantity and variety of intermediate inputs, diffusion of technology, amplifying learning by doing and increasing the market size61. One route that has attracted attention is whether trade protection induces technologically backward industries to catch-up.62 In this connection, technology diffusion constitutes an important channel for capturing the dynamic effect of trade liberalization on productivity growth. There can be several routes for diffusion: trade, foreign direct investment and learning by doing.63 We wish to analyze the impact of trade liberalization on the productivity growth of organized manufacturing (TFPG). Further, it is important that the model specification incorporates the industrial policy reforms and macroeconomic environment as these often supplement trade reform.64 Thus we specify TFPG as a function of a combination of factors representing trade policy changes, industrial policy reforms and macro environment.65 That is, TFPG = f (Changes in Trade Policy, Changes in Industrial Policy and Macroeconomic Environment) The variables representing trade policy orientation are; effective rate of protection (ERP), import coverage ratio (MCR) and export growth (EG). The advocates of a neutral trade regime expect greater improvements in TFP when an outward oriented trade policy is followed than when import substituting trade restrictions are in operation. Two major studies, Weiss (1992) and Iscan (1998) found evidence for a lagged impact of trade liberalization on TFP growth. We allow for lagged impact of variables measuring the trade policy changes.66 To reflect the outcomes of industrial policy reforms, we include two variables, namely; the price–cost margins (PCM)67, and capital intensity (K/L)68. Output growth (OG) reflects the effects of scale with an expected significant positive relationship with TFP growth. The macroeconomic uncertainty is proxied by the level of inflation uncertainty (INFLu)69. We thus arrive at a more concrete specification: 5.2 Data Base and Descriptive Statistics The data set consists of a balanced panel of 43 three-digit industries (in NIC98) for 20 years (1990-91 to 2009-10). We also undertake separate analysis of panels of capital, intermediate and consumer goods industries. Table 5.1 gives the basic statistical characteristics of dependent and explanatory variables: We use productivity growth as a measure of manufacturing performance. Several studies have attempted to analyze the productivity performance of organized manufacturing in India during the pre and post reforms period- 1980s and 1990s. Majority of the studies observe that reforms have not enhanced productivity performances.70 For the present study, we compute TFP growth for 43 manufacturing groups in the organized sector and also use-based sectors- capital, intermediate and consumer goods. The TFP estimates are computed using a growth accounting methodology based on KLEMS production as the underlying production framework.71 Our estimates show modest TFP growth of one per cent for the period 1990-91-2009-10 for aggregate manufacturing. From appendix table A8, it can be seen that only a small subset of manufacturing groups- mostly machinery and equipments, electronic items belonging to capital goods industries and wood products score high on TFP growth, whereas in majority of sectors, either we see a negligible improvement in TFP or no growth at all. Figure 5.1 below shows the yearly movement of the use-based and aggregate manufacturing. As is evident from table A8, sectors belonging to capital goods sector show higher TFP growth since 1991-92. This is may be attributed to far reaching changes in trade policy towards capital equipments and import of technology embodied in new and better machines and equipment. Intermediate goods and consumer goods productivity improvements lag behind capital goods, however it may be pointed out that only towards the end of 1990s especially 1997-2002 trade policy rules and regulations allowed lifting of import restrictions along with lowering of tariff rates for consumer goods. 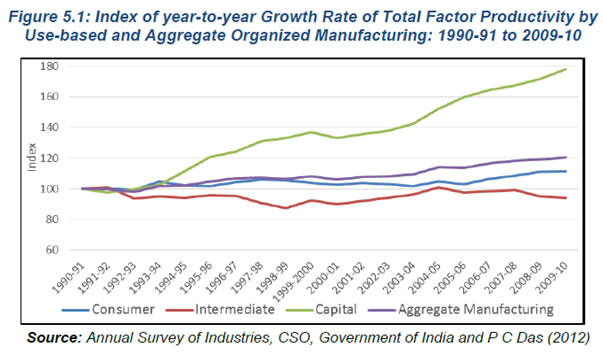 Annexure A9 show the TFP performance of the entire manufacturing sub-groups and results do not reflect substantial improvement even for all manufacturing sub-groups. The TFP growth still remains modest at slightly over 1 per cent. We also compare our estimates for organized manufacturing with India KLEMS manufacturing sub-groups72 and find our estimates to follow closely that of India KLEMS all manufacturing, which is inclusive of informal manufacturing also. It is evident from our comparison that when it comes to all manufacturing, though informal sector absorbs more than 80 per cent of employment, on grounds of productivity it still remains weak and much of the aggregate manufacturing TFP performance is led by organized manufacturing. | Table 5.1: Summary Statistics of Dependent and Explanatory Variables - 1990-91 to 2009-10 | | | Number of Observations | Mean | Standard
Deviation | Minimum | Maximum | | Dependent variable: Total Factor Productivity(TFP): 1990-91=100 | | All Industries | 860 | 114.9 | 52.5 | 39.3 | 613.1 | | Consumer goods | 420 | 107.1 | 26.4 | 50.8 | 233.5 | | Intermediate goods | 220 | 98.1 | 22.7 | 39.3 | 152.7 | | Capital goods | 220 | 146.6 | 86.9 | 80.8 | 613.1 | | Independent variables: Trade policy measures for all industries | | ERP (%) | 860 | 49.3 | 45.9 | 0.3 | 342.2 | | MCR (%) | 860 | 25.5 | 34.5 | 0.0 | 100.0 | | Exports (INR crore) | 860 | 664422.3 | 1242560.0 | 0.0 | 13300000.0 | | Independent variable: Industry Policy reform73 | | PCM (%) | 860 | 15.1 | 5.7 | 1.6 | 39.8 | | KL (ratio) | 860 | 11.1 | 17.4 | 0.3 | 157.5 | | Independent variable: Macroeconomic uncertainty | | INFLu (%) | 860 | 5.18 | 4.95 | 0.00 | 63.16 | | Independent variables: Scale | | Output (INR crore) | 860 | 4012492.0 | 6187105.0 | 13023.3 | 55000000.0 | | Source: Author’s computations based on DGIS database, Custom Tariff Schedules, Input-Output Tables, Government of India, Das (2012), and Annual survey of Industries | We transform the each series across all the industries into their natural logarithmic form before being put into use for our model. Logarithmically transforming variables in a regression model is a very common way to handle situation where a non-linear relationship exists between the independent and dependent variables. Logarithmic transformations are also a convenient means of transforming a highly skewed variable into one that is more approximately normal as well as handle data base which come with different units. The idea behind in our current model structure is to achieve the flexibility of handling both level and growth variable together. The choice of level vs difference of level (in this case difference of natural logarithmic variable would be the growth of that variable) would be taken based on the underlying time series characteristics of our variables and diagnostic steps undertaken on the panel structure (details in subsequent section). 5.3 Methodology for Model Selection and Diagnostics Based on the availability of data across 43 industries in 3 Digit NIC 1998 classification from 1990-91 to 2009-10, the current study uses a cross sectional-time series panel structure to capture impact of trade policy changes on productivity (TFP) growth. The exact specification of the panel model structure is based on the statistical characteristics of underline data. The selection of panel model specification depends on the results of following diagnostic steps as highlighted in the Figure 5.2 below: 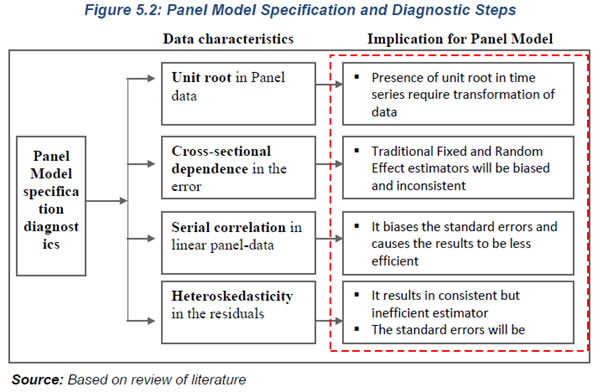 Cross-sectional Dependence: A growing body of the panel-data literature concludes that panel-data models are likely to exhibit substantial cross-sectional dependence in the errors, which may arise because of the presence of common shocks and unobserved components that ultimately become part of the error term, spatial dependence, and idiosyncratic pairwise dependence in the disturbances with no particular pattern of common components or spatial dependence (De Hoyos, R., and V. Sarafidis, 2006). Based on the nature of our dataset where we are trying to understand the impact of trade policy liberalization on TFP growth; the presence of cross-sectional dependence cannot be ruled out. This is more so when trade policy reforms were introduced after 1991 and followed a gradual process during 1990s impacting across all manufacturing sectors. Moreover, if the unobserved components that create interdependencies across cross sections are correlated with the included regressors, the traditional FE and RE estimators will be biased and inconsistent. Testing cross-sectional dependence when T>N, where T is the time dimension of the data and N is number of cross-sectional units, one may use for these purposes the Lagrange multiplier (LM) test, developed by Breusch and Pagan (1980). On the other hand, when T < N, the LM test statistic enjoys no desirable statistical properties in that it exhibits substantial size distortions. We have used Pesaran’s (2004) cross-sectional dependence (CD) test designed to test for cross-sectional dependence in large-N, small-T panels. Pesaran’s CD test was applied to our standard74 RE and FE panel model with Ho: Cross-sectional independence. Pesaran (2004) has proposed the following CD statistics:
| Table 5. 2: Cross-sectional Dependence Tests | | Test applied to: | Pesaran’s CD statistics | p-Value | Average absolute value of the off-diagonal elements | | Random Effect (RE) Model | 5.478 | 0.000 | 0.409 | | Fixed Effect (FE) Model | 5.167 | 0.000 | 0.411 | | Source: Author’s computations | As we can see, the CD test strongly rejects the null hypothesis of no cross-sectional dependence. Panel Unit Root: The econometric theory for panel data was largely developed for survey data where T, the number of time-series observations, was small but N the number of groups or individuals was large. But use of macro panel structure like in our current model can have problem of unit roots on the time-series components. Time-series data tend to be non-stationary, determining the order of integration or cointegration of the variables becomes important. The order of integration is the number of times a time-series must be differenced to make it stationary. Many economic time-series appear to be integrated of order one, I(1), needing to be differenced once to make them stationary. Further, Cross-section dependence can pose serious problems for testing the null hypothesis that all units in a panel are nonstationary. We have used Fisher-type (Choi 2001) tests for panel unit root test for all the concerned variables. Following Levin, A. et al. (2002), impact of cross sectional dependence can be mitigated under Fisher-type test by subtracting the cross-sectional averages from the series. We use Phillips-Perron unit-root test to perform unit-root tests on each panel; denote the p-value for the respective test on the ith panel as pi, then The Ho: All Panels contains unit roots. Table 5.3 shows results of the Panel unit root test: | Table 5.3: Panel Unit Root Tests | | | Inverse chi-squared | Modified inv. chi-squared | | Natural log: | P Statistics | p-Value | Pm Statistics | p-Value | | TFP | 118.8 | 0.011 | 2.5 | 0.006 | | ERP | 146.3 | 0.000 | 4.6 | 0.000 | | MCR | 190.5 | 0.000 | 7.9 | 0.000 | | PCM | 319.7 | 0.000 | 17.8 | 0.000 | | KL | 199.3 | 0.000 | 8.6 | 0.000 | | INFLu | 205.2 | 0.000 | 9.0 | 0.000 | | Export | 135.1 | 0.000 | 3.7 | 0.000 | | Output | 146.5 | 0.000 | 4.6 | 0.000 | Note: AR Parameter: Panel specific, Panel means: included, Time trend: Not included
Source: Author’s computations | The panel unit root test shows that controlling for cross-sectional dependence; the natural logarithmic level variables are panel stationary. This allows using levels of the natural logarithmic transformation of the variable in our panel structure.
| Table 5.4: Serial Correlation Test Wooldridge Test for Autocorrelation in Panel Data | | | F-Statistics | Prob>F | | Ho: no first-order autocorrelation | 85.889 | 0.0000 | Linear regression in first-difference Pooled OLS: Dependent variable: ΔlnTFP | Δln | Coefficient | Robust Standard Error | t-statistic | P>|t| | | ERP | -0.0131 | 0.0077 | -1.700 | 0.0970 | | MCR | 0.0017 | 0.0024 | 0.720 | 0.4750 | | KL | -0.0537 | 0.0171 | -3.140 | 0.0030 | | PCM | 0.1163 | 0.0109 | 10.660 | 0.0000 | | INFLu | -0.0449 | 0.0059 | -7.550 | 0.0000 | | Export | 0.0026 | 0.0078 | 0.330 | 0.7440 | | Output | 0.0700 | 0.0139 | 5.030 | 0.0000 | Note: Std. Err. Adjusted for 43 clusters
Source: Author’s computation | The null hypothesis of no serial correlation is strongly rejected. Also, the output from the first-differenced regression includes standard errors that account for clustering within the panels. If there is serial correlation in the idiosyncratic error term, clustering at the panel level will produce consistent estimates of the standard errors. Heteroskedasticity: Both the error component models (fixed effects and random effects) assume that the regression disturbances are homoskedastic with the same variances across time and industries. This may be a restrictive assumption when the cross-sectional units, three-digit level manufacturing industries, in this case, are of varying size and as a result may have unequal disturbance variances. The error process may be homoskedastic within cross-sectional units, but its variance may differ across units: a condition known as group-wise heteroskedasticity. Assuming homoskedastic disturbances when heteroskedasticity is present will still result in consistent estimates of the regression coefficients, but these estimates will not be efficient. Also the standard errors of these estimates will be biased. Correction of the standard errors for the possible presence of heteroskedasticity is desirable.76 A modified Wald statistic for group-wise heteroskedasticity in the residuals of a fixed-effect regression model77 was calculated, following Greene (2000). The null hypothesis specifies that σi2= σ2 for i = 1 to N, where N is the number of cross-sectional units. We can also undertake Likelihood-ratio (LR) test for panel-level (or group-wise) Heteroscedasticity using iterated generalized least square (GLS) method. Since iterated GLS with only Heteroscedasticity produces maximum-likelihood parameter estimates, we can easily do an LR test. We can achieve this by fitting two separate models with and without panel-level Heteroscedasticity and save the likelihoods. The result of LR test on iterated GLS model applied on our standard structure used across all the diagnostic tests. Table 5.5 presents the results of the Modified Wald Statistics and the LR tests | Table 5.5: Heteroscedasticity Test | | Modified Wald test for group-wise Heteroscedasticity in fixed effect regression model | | | Modified Wald-Statistics
(chi2) | Prob> chi2 | | H0: σi2= σ2 for i = 1 to N | 5717.89 | 0.0000 | | Likelihood Ratio (LR) test after iterated GLS with heteroskedastic panels | | | LR chi2 | Prob> chi2 | | LR Test (Homoskedastic nested in heteroskedastic panels) | 1001.43 | 0.0000 | | Source: Author’s computations | The two tests clearly confirm the presence of panel-level Heteroscedasticity in our panel structure. Thus from above diagnostic tests conducted on our panel structure indicate that traditional fixed or random effect panel model is not applicable to our data. The feasible generalized least square (FGLS) structure in the family of panel data model allows estimation in the presence of AR(1) autocorrelation within panels and cross-sectional correlation and Heteroscedasticity across panels. But FGLS approach must estimate additional variance and covariance parameters in the presence of Heteroscedasticity and contemporaneous correlation at panel level. There must be sufficient degrees of freedom for these estimates, or the covariance matrix will be singular. This means that the panel structure must have at least as many time periods as there are cross-sectional units in the dataset, T>=N. The way around to this problem would be to use model structure of linear regression with panel-corrected standard errors (PCSE). It is an alternative to FGLS for fitting linear cross-sectional time-series models when the disturbances are not assumed to be independent and identically distributed (i.i.d.). It calculates panel-corrected standard error (PCSE) estimates for linear cross-sectional time series models where the parameters are estimated by either OLS or Prais–Winsten regression. When computing the standard errors and the variance–covariance estimates, it assumes that the disturbances are, by default, heteroskedastic and contemporaneously correlated across panels. The disturbances may also be assumed to be auto correlated within panel, and the autocorrelation parameter may be constant across panels or different for each panel. It produces OLS estimates of the parameters in the absence of serial autocorrelation, or Prais–Winsten estimates when we observe autocorrelation within panel. 5.4 Empirical Results The current panel structure of 43 NIC98 3 digit industries across 20 years (1990-91 to 2009-10), characterized by panel Heteroscedasticity, panel autocorrelation, and contemporaneous correlation (HPAC) imposes restriction of using linear regression with panel-corrected standard errors (PCSE). One very import point to be noted in HPAC structure is that estimates cannot give a unique value of R-square. The concept of explained variance in HPAC structure does not exist because the data are not independent and identically distributed. The disturbance variance is not well defined and it varies from one observation to another, so there is no single number to quantify the same. Based on the model specification, the standard model framework for our empirical test of impact of trade policy reform on productivity changes are: 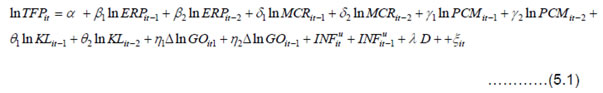 Where i represents industry and t stands for year, ξ it is the error term which is not independent and identically distributed. We will also introduce, industry fixed effect and time dummies for phases of reform. We include a period dummy D defined in terms of reform in 1990s vs 2000s to control for any structural breaks in the overall period. Further, to check whether the trade liberalization impacts are period (phase) specific, we include interactive dummies for effective rate of protection. We would also test for Import Penetration (MPR) which is an outcome variable for ERP and MCR as part of explanatory variables. The idea of introduction of lagged level variable is based on theoretical underpinning of transmission of impact of relaxation of trade restriction on productivity. Expected signs of the coefficients of the explanatory variables are shown below: | Table 5.6: Expected Signs of the Coefficients of the Explanatory Variables in the TFP Equations | | Impact on Total factor productivity | | Explanatory Variable | Expected sign of coefficient | Conjecture | | ERP | - | Lowering of protection will enhance productivity | | MCR | - | Removal of NTB’s will enhance productivity | | EG | + | Increase in exports will raise productivity | | PCM | - | Fall in mark-up (increase in competition) will raise productivity | | KL | + | Increased capital intensity will raise productivity | | GO | + | Increased output growth will reflect higher productivity growth (Verdoorn's law) | | INFLu | - | Lowering of inflation uncertainty will raise productivity | | MPR | + | Increase in imports will enhance productivity | The variables representing trade policy reforms cover the following routes to productivity enhancement- competition and scale. First, the changes in both tariff- based protection and the import coverage ratios are our measures of increased exposure to foreign competition. We expect the coefficients of both Δ ERP and Δ MCR to be negative. The coefficient of Δ EG is expected to be positive, reflecting that higher exports reflect higher productivity growth. Output growth (OG) reflects the effects of scale with a significant positive relationship with TFP growth interpreted as the existence of dynamic increasing returns or the Verdoorn relationship [Nishimizu and Robinson (1986)]. Most empirical studies of the determinants of TFP growth find the output growth to be by far the single most important explanatory variable. The change in price-cost margin for an industry is defined as the ratio of (value added –total emoluments) to the value of output is used as a measure of the change in domestic competitive pressure, with a decrease reflecting a drop in monopolistic mark-ups. If greater internal competitive pressure brought about by reforms in industrial policy acts a spur to productivity growth, the sign on the Δ PCM coefficient will be negative. The change in the capital-labor ratio (also capital-output ratio) is used as a measure of capital intensity with the expectation that increased capital use relative to labor will raise productivity as a result of superior technology embodied in the capital inputs. The variable representing the macro-environment i.e. inflation uncertainty (INFLu) is expected to have a negative sign with a decrease in uncertainty reflecting an improved productivity growth. | Table 5.7: Trade Liberalization and Productivity Growth: Empirical Results | | Regression Results - Dependent variable: lnTFP (All Manufacturing) | | | Model-I | Model-II | Model-III | Model-IV | | lnERPt-1 | -0.0272*** | -0.0289*** | -0.0309*** | | | (0.0104) | (0.00721) | (0.00753) | | | lnERPt-2 | -0.0152 | -0.0166** | -0.0198*** | | | (0.0104) | (0.00703) | (0.00752) | | | lnMCRt-1 | -0.00697*** | -0.00779*** | -0.00363 | | | (0.00246) | (0.00217) | (0.00226) | | | lnMCRt-2 | -0.00854*** | -0.00983*** | -0.00718*** | | | (0.00245) | (0.00216) | (0.00218) | | | lnPCMt-1 | -0.0466*** | -0.0427*** | -0.0549*** | -0.0522*** | | (0.0120) | (0.0112) | (0.0124) | (0.0123) | | lnPCMt-2 | -0.000142 | 0.00344 | -0.0143 | -0.0129 | | (0.0117) | (0.0113) | (0.0127) | (0.0126) | | lnKLt-1 | 0.0526*** | 0.0464*** | 0.0271* | 0.0229 | | (0.0133) | (0.0119) | (0.0155) | (0.0150) | | lnKLt-2 | -0.000547 | 0.00339 | -0.00556 | -0.0109 | | (0.0134) | (0.0123) | (0.0156) | (0.0146) | | lnINFLu | -0.0376*** | -0.0374*** | -0.0337*** | -0.0341*** | | (0.00476) | (0.00427) | (0.00426) | (0.00423) | | lnINFLt-1u | -0.00811 | -0.00757* | -0.00687 | -0.00775* | | (0.00509) | (0.00427) | (0.00425) | (0.00424) | | Δ ln GO | 0.0402*** | 0.0458*** | 0.0480*** | 0.0453*** | | (0.0121) | (0.0101) | (0.0117) | (0.0115) | | ΔlnGOt-1 | 0.0230* | 0.0269*** | 0.0272** | 0.0236** | | (0.0125) | (0.0102) | (0.0118) | (0.0116) | | ΔlnEG | | -0.000902 | -0.00134 | -0.00165 | | | (0.00751) | (0.00747) | (0.00738) | | ΔlnEGt-1 | | 0.00125 | 0.00163 | 0.000840 | | | (0.00772) | (0.00762) | (0.00768) | | D(1990s) | | 0.0214** | | | | | (0.0102) | | | | lnNRPt-1 | | | | -0.0403*** | | | | | (0.00864) | | lnNRPt-2 | | | | -0.0122 | | | | | (0.00853) | | lnFRt-1 | | | | -0.00516 | | | | | (0.00358) | | lnFRt-2 | | | | -0.0100*** | | | | | (0.00372) | | Constant | 4.975*** | 4.961*** | 5.124*** | 5.164*** | | (0.0578) | (0.0559) | (0.0880) | (0.0872) | | Observations | 772 | 764 | 764 | 764 | | Industry Fixed effect | No | No | Yes | Yes | | Number of industries | 43 | 43 | 43 | 43 | Note: Panel corrected standard errors in parentheses *** p<0.01, ** p<0.05, * p<0.1
Source: Author’s estimations based on model (5.1) and variables listed in Table 5.6 | We have undertaken estimation of 4 versions of the standard HPAC model specified in the previous section. All the 4 models are estimated on natural logarithmic levels of the variables for all NIC98 industries in the panel. Model-I and Model-II differ in terms of the time dummy D for 1990-91 and 1999-00 period. In Model-III, we have introduced industry fixed effect at NIC98 3 digit level. In Model-IV, alternate measure of trade policy measures were introduced, we have used Nominal Tariff rates (NTR) in place of Effective rate of protection (ERP) and Frequency ratio (FR) instead of Import Coverage ratio (MCR). Looking at the regression result for all industries, the effect of decrease in ERP on TFP is mainly felt with one year lag and impact vary from 0.27 per cent to 0.30 per cent increase in TFP with 10 per cent fall in ERP. The reduction of NTBs captured by MCR has relatively smaller impact on increase in TFP. A 10 per cent fall in MCR increases TFP between 0.07 per cent and 0.09 per cent with 2 years lag. The biggest impact of rise in TFP has actually come from improvement in domestic industrial policy. We have tried to capture domestic level of competition using Price Cost Margin (PCM). A 10 per cent fall in PCM increases TFP between 0.4 per cent and 0.6 per cent with 1 year lag. We can also observe that increase in output growth has the second highest impact on TFP change. The impact of changes in trade policy measures and domestic industrial policy is statistically significant in 1990s, evident from the time dummy D. 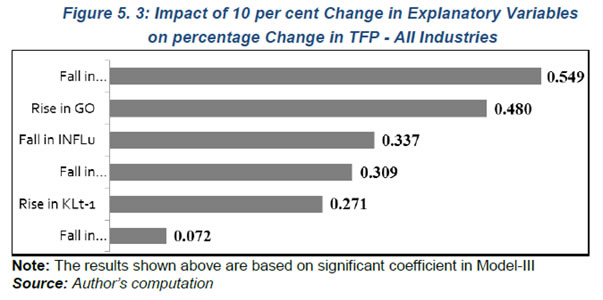
| Table 5.8: Regression Results - Dependent Variable: lnTFP (Used-based Manufacturing) | | | Consumer goods | Intermediate goods | Capital goods | | lnERPt-1 | -0.00937 | -0.0282* | -0.0627*** | | (0.0110) | (0.0161) | (0.0188) | | lnERPt-2 | -0.00317 | 0.0121 | -0.0740*** | | (0.0114) | (0.0153) | (0.0183) | | lnMCRt-1 | -0.0141*** | -0.00567* | 0.00100 | | (0.00525) | (0.00321) | (0.00411) | | lnMCRt-2 | -0.00772 | -0.00404 | -0.00552 | | (0.00521) | (0.00318) | (0.00424) | | lnPCMt-1 | -0.0529*** | -0.0520** | -0.0797*** | | (0.0164) | (0.0210) | (0.0254) | | lnPCMt-2 | -0.0102 | -0.0272 | 0.00843 | | (0.0160) | (0.0199) | (0.0271) | | lnKLt-1 | -0.00244 | 0.0414 | 0.0952*** | | (0.0249) | (0.0358) | (0.0260) | | lnKLt-2 | -0.0548** | -0.0563 | 0.0402 | | (0.0251) | (0.0389) | (0.0275) | | lnINFLu | -0.0424*** | -0.0312*** | -0.0111 | | (0.00634) | (0.00762) | (0.00936) | | lnINFLt-1u | -0.0105* | -0.00523 | -0.00352 | | (0.00637) | (0.00879) | (0.00974) | | ΔlnGO | 0.0192 | 0.104*** | 0.0818*** | | (0.0157) | (0.0326) | (0.0298) | | ΔlnGOt-1 | 0.0162 | 0.0672** | 0.0186 | | (0.0143) | (0.0326) | (0.0286) | | ΔlnEG | -0.0329** | -0.000296 | -0.0168 | | (0.0133) | (0.00829) | (0.0221) | | ΔlnEGt-1 | -0.0173 | -0.00180 | -0.0102 | | (0.0133) | (0.00849) | (0.0220) | | Constant | 5.157*** | 4.128*** | 5.202*** | | (0.115) | (0.0892) | (0.152) | | Observations | 370 | 196 | 198 | | Industry Fixed effect | Yes | Yes | Yes | | Number of industries | 21 | 11 | 11 | Note: Panel corrected standard errors in parentheses *** p<0.01, ** p<0.05, * p<0.1
Source: Author’s computation | We have estimated Model-III separately for 3 use-based industry groups for period 1990-91 to 2009-10. From the results it is evident that impact of fall in ERP is not significant in consumer goods sector and highest in capital goods sector. A 10 per cent fall in ERP increases TFP by almost 0.6 per cent and for intermediate goods the impact is around 0.3 per cent with 1 year lag. The impact of ERP in capital good sector is more with 2 years lag. On the other hand fall in non-tariff restriction is significant in consumer goods sector with 1 year lag but has no impact on capital goods sector. One of the very significant results is impact of increase in capital intensity in capital goods sector, 10 per cent increase in capital intensity in capital goods sector increase TFP by almost 1 per cent. In conclusion, the results suggest that the trade policy reforms of the 1990s and further changes in trading rules and regulations in 2000s did contribute to improvements in productivity growth via the removal of both tariff and non-tariff based barriers. This holds for the all industries as well as capital goods industries, one of the three-use-based sectors analyzed in the study. We find that lowering of trade barriers is consistent with the competitive effect of trade liberalization. Our results are also in line with those from other studies on South Asia [India-Ahluwalia (1994), Krishna and Mitra (1998), Sri Lanka–Athukorala and Rajapatirana (2000)] and majority of the studies surveyed in the literature The econometric exercise confirms that trade policy reforms have significant positive impact on productivity yardstick of manufacturing performance. 6: Conclusion The study examined India’s efforts at trade liberalization for the 20 year period beginning 1990-91 at the level of industrial sector, especially in organized manufacturing. This was done via examining the trends and patterns of lowering tariff as well as non-tariff barriers (QRs) at the total manufacturing as well as use-based sectors of manufacturing- intermediate, capital and consumer goods. To do this end, we computed and estimated- nominal as well as effective rate of protection, proxies for NTBs - frequency ratio as well as import coverage ratio. Finally, an assessment of the impact of simultaneous lowering of tariffs and non-tariff restrictions was done by examining the import penetration rates. Further, using a quantitative framework, an assessment was made of the impact of these measures of trade liberalization on manufacturing performance for the period 1990-2010. In particular, an econometric model based on panel data to explore the impact of trade liberalization on performance indicators (total factor productivity) for the manufacturing sector in India covering the several phases of trade reforms beyond 1990-91. To assess the impact on manufacturing performance, we used variables that represent trade liberalization along with industrial policy reforms and macroeconomic business environment. The study observed that removal of restrictions in trade-in terms of lowering of tariff barriers and dismantling of import licensing regime has been substantial since 1990-91 but gain in terms of import penetration has not been of the similar order. In particular, One, trade protection measured by Nominal import tariff as well as Effective rate of protection were brought down substantially in 1990s. Non-tariff protection got almost halved by 1992-93 and become less than 10 per cent by the beginning of 2000-01. Two, Capital goods saw faster reduction in ERP as well as NTB during 1990s compared to intermediate & consumer goods. Three, at the level of total manufacturing the change in import penetration rates show a near doubling within 20 years from around 9.7 per cent in 1990-91 to around 18 per cent by the end of 2009-10. We have also compared the period of 1990s versus 2000s in order to understand the manner of lowering of tariff as well as NTBs. We confirm that there was a sharp fall in tariff levels as well as quantitative restrictions in the 1990s as compared to the 2000s. The periods of 2000s were more aimed at simplifying the trade procedures as well as boosting exports. The examination of the impact of trade openness as captured by various measures of trade policy reforms indicates that of decrease in tariff barrier (captured by effective rate of protection) on industrial productivity is mainly felt with one year lag and the reduction of NTBs captured by import coverage ratio has relatively smaller impact on increase in TFP. The biggest impact of rise in TFP has actually comes from improvement in domestic industrial policy. Therefore, greater internal competitive pressure brought about by reforms in industrial policy acts a spur to productivity growth. We also find a positive impact of increase in capital intensity in capital goods sector and this is mainly driven by substantial lowering of tariff rates on capital goods imports as well relaxing of import controls on machines and equipments since 1991-92. Our quantitative result reinforces not only the role of trade policy reforms but also the literature on roles of industrial as well as trade reforms as complementarities in enhancing manufacturing performance. We conclude that from a piecemeal trade liberalization effort in the 1980s, we have come a long way in reforming our trading regimes during the period 1990s- 2010 with respect to tariff and non-tariff restrictions. In terms of the MFN tariffs, India is not out of line with the other Asian countries- China: 8.7 (2009); Thailand: 8.0 (2011); and Malaysia: 5.8 (2010). Our tariffs on capital goods have also been considerably lowered in successive trade policy documents since 1991-92. We have also seen the full-scale dismantling of the remaining import curbs in the Export-Import (EXIM) Policy for 2001-02 announced by the Government of India on March 31, 2001. What remains worrisome is that despite all these efforts at trade liberalization, the rate of change in import penetration ratios is not in line with the other measures of trade liberalization. This needs to be examined in greater depth and will form the core of further research. It is a well documented fact that Indian manufacturing still contributes an insignificant share of world manufacturing and services sector leading the engine of growth. It needs an examination as to why Indian manufacturing is still far from the levels achieved by either Asian economies like Thailand, Malaysia or Taiwan or even countries like Brazil and Mexico. The Government of India (The Manufacturing Plan, Planning Commission, GoI) attributes poor manufacturing performance to poor implementation and outlines two causes - inadequate consensus amongst stakeholders for policy changes, and very poor coordination amongst agencies in execution. Further it suggests that longer time frame national manufacturing policy. We assert that with the substantial changes in trade and industrial policies, it is essential that we look for factors which still constrain manufacturing growth and productivity and suggest appropriate policy changes in those areas which still constrain manufacturing performance. Finally, as we have already seen substantial reduction in levels of trade protection across manufacturing groups and the trade policy changes have also been followed by reforms in industrial policy. Therefore, we now need to address issues which can further magnify the benefits of trade and industrial policy reforms such as easing of supply constraints and appropriate policy changes to remove bottlenecks transport, power shortages, erratic supply of energy (water and electricity) as well as labor regulations etc. Appropriate policy actions on these fronts along with further easing of trading environment will make India’s manufactured goods internationally competitive.
Annexure | Table A 1: Nominal Rate of Protection (per cent) in Indian Industries: Use-Based Classification | | Code NIC 87 | Three-Digit Classification Description | 1990-91 to 1996-97 | 1997-98 to 2002-03 | 2003-04 to 2009-10 | | Intermediate Goods industries | | 230 | Cotton ginning, spinning and bailing | 75.46 | 34.38 | 14.97 | | 231 | Cotton spinning other than in mills | 75.46 | 34.38 | 14.97 | | 235 | Cotton spinning, weaving and processing in mills | 75.46 | 34.38 | 14.97 | | 240 | Preparing of raw wool, silk and textile fibers for spinning | 96.06 | 33.15 | 14.61 | | 241 | Wool spinning, weaving and finishing other than in mills | 77.49 | 33.72 | 14.87 | | 242 | Wool spinning, weaving and finishing in mills | 77.49 | 33.72 | 14.87 | | 244 | Spinning, weaving & finishing of silk other than in mills | 87.71 | 31.57 | 14.20 | | 245 | spinning, weaving and finishing of silk in mills | 87.71 | 31.57 | 14.20 | | 247 | spinning, weaving and processing of man-made textiles | 122.97 | 34.16 | 14.75 | | 248 | spinning, weaving & processing of artificial/synthetic textiles | 122.97 | 34.16 | 14.75 | | 250 | Jute and Mesta pressing and bailing | 104.26 | 38.53 | 15.53 | | 251 | Preparatory operations of jute and Mesta fibers | 104.26 | 38.53 | 15.53 | | 252 | Preparatory operations of coir fibers | 104.26 | 38.53 | 15.53 | | 253 | Preparatory operations of other vegetable fibers | 104.26 | 38.53 | 15.53 | | 254 | Spinning, weaving and finishing of jute and Mesta textiles | 104.26 | 38.53 | 15.53 | | 255 | Spinning, weaving and finishing of coir textiles | 104.26 | 38.53 | 15.53 | | 256 | Spinning, weaving and finishing of vegetable fiber textiles | 104.26 | 38.53 | 15.53 | | 270 | Sawing and planking of wood | 85.83 | 33.09 | 15.41 | | 271 | Manufacture of veneer sheets | 85.83 | 33.09 | 15.41 | | 272 | Manufacture of structural wooden goods | 85.83 | 33.09 | 15.41 | | 280 | Manufacture of pulp, paper and paper board | 94.49 | 27.72 | 14.03 | | 281 | Manufacture of container and boxes of paper | 94.49 | 27.72 | 14.03 | | 282 | Manufacture of paper and paper board NEC | 94.49 | 27.72 | 14.03 | | 290 | Tanning, curing, finishing of leather | 79.31 | 32.15 | 14.73 | | 300 | Industrial organic and inorganic chemical | 82.63 | 35.48 | 14.15 | | 301 | Fertilizers and pesticides | 63.59 | 29.02 | 11.84 | | 302+306 | Synthetic rubber Man-made Fibers | 82.46 | 35.78 | 14.37 | | 303 | Paints, varnishes and related products, | 99.29 | 36.32 | 15.17 | | 308 | Explosives and Fireworks | 79.97 | 33.98 | 15.80 | | 309 | Chemical Products n.e.c | 79.97 | 33.98 | 15.80 | | 310 | Tyre and tubes | 88.89 | 40.34 | 15.41 | | 312 | Rubber product n.e.c | 88.89 | 40.34 | 15.41 | | 313 | Plastic products n.e.c | 91.39 | 37.47 | 15.53 | | 314 | Refined petroleum product | 68.91 | 23.26 | 11.22 | | 316 | Refined petroleum products n.e.c | 68.91 | 23.26 | 11.22 | | 318 | Coke-oven products | 61.55 | 33.94 | 15.19 | | 319 | Other coal and coal tar product n.e.c | 61.55 | 33.94 | 15.19 | | 324 | Manufacture of cement, lime and plasters | 105.57 | 38.33 | 15.14 | | 325 | Manufacture of mica products | 103.43 | 36.83 | 15.72 | | 326 | Manufacture of structural stone goods and stone ware | 103.43 | 36.83 | 15.72 | | 327 | Manufacture of asbestos cement and other cement products | 105.57 | 38.33 | 15.14 | | 329 | Manufacture of misc. non metallic mineral products n.e.c | 103.43 | 36.83 | 15.72 | | 330 | Iron and steel primary/semi finished forms | 76.87 | 35.28 | 14.33 | | 331 | Semi finished iron and steel products | 76.87 | 35.28 | 14.33 | | 332 | Ferro Alloys | 67.04 | 31.78 | 12.77 | | 333 | Copper manufacturing | 69.40 | 32.55 | 11.57 | | 335 | Aluminum manufacturing | 69.40 | 32.55 | 11.57 | | 336 | Zinc manufacturing | 69.40 | 32.55 | 11.57 | | 338+339 | Metal products and Non Ferrous metals | 69.40 | 32.55 | 11.57 | | 340 | Fabricated structural metal products | 87.43 | 36.43 | 15.36 | | 341 | Fabricated metal products, n.e.c | 87.43 | 36.43 | 15.36 | | 343+349 | Hand-tools, weights etc | 72.31 | 35.75 | 15.49 | | Capital Goods industries | | 350 | Agri machinery and equipments and parts thereof | 50.66 | 29.29 | 14.04 | | 351 | Construction and mining industries | 51.24 | 27.28 | 13.73 | | 352 | Prime movers, boilers, steam generating plants nuclear reactors | 51.24 | 27.28 | 13.73 | | 353 | Industrial machinery for food and textile industry | 51.42 | 28.72 | 13.76 | | 354 | Industrial machinery other than food and textile | 51.24 | 27.28 | 13.73 | | 356 | General purpose Machinery | 58.94 | 29.26 | 13.86 | | 357 | Machine tools parts and accessories | 54.41 | 27.00 | 13.71 | | 358 | Office, computing and accounting machinery and parts | 73.39 | 30.80 | 7.49 | | 359 | Special purpose machinery and equipment /component/accessories | 58.94 | 29.26 | 13.86 | | 360 | Electrical industrial machinery | 56.99 | 28.46 | 13.74 | | 361 | Insulated wires and cables | 82.57 | 40.06 | 13.45 | | 362 | Primary cells and primary batteries | 93.71 | 40.72 | 15.17 | | 365+366 | Radio and TV apparatus | 76.05 | 28.13 | 8.64 | | 368 | Electronic valves and tubes | 76.05 | 28.13 | 8.64 | | 369 | X ray Machines and Electrical equipment’s n.e.c | 76.05 | 28.13 | 8.64 | | 370 | Ship and boat building | 57.67 | 34.60 | 14.28 | | 371 | Locomotives and parts | 53.46 | 28.77 | 14.79 | | 372 | Railway/tramway wagons and coaches | 53.46 | 28.77 | 14.79 | | 377 | Aircraft, spacecraft and parts | 83.53 | 40.65 | 15.53 | | 379 | Transport and equipment’s and parts | 83.53 | 40.65 | 15.53 | | Consumer Goods industries | | 200 | Slaughtering, preparation and preservation of meat | 101.60 | 28.86 | 32.26 | | 201 | Manufacture of dairy products | 101.60 | 28.86 | 32.26 | | 202 | Canning and preservation of fruits and vegetables | 101.60 | 28.86 | 32.26 | | 203 | Processing, canning and preservation of fish, crustacean | 101.60 | 28.86 | 32.26 | | 204 | Grain milling | 101.60 | 28.86 | 32.26 | | 205 | Manufacture of bakery products | 101.60 | 28.86 | 32.26 | | 206 | Manufacture and refining of sugar (vacuum pan sugar factories) | 83.14 | 48.24 | 61.46 | | 207 | Production of indigenous sugar, ‘Boora’, ‘Khandsari’, ‘Gur’ etc. | 83.14 | 48.24 | 61.46 | | 208 | Manufacture of common salt | 101.60 | 28.86 | 32.26 | | 209 | Manufacture of cocoa products and sugar confectionery | 101.60 | 28.86 | 32.26 | | 210 | Manufacture of hydrogenated oil and Vanaspati | 107.71 | 33.33 | 90.17 | | 211 | Manufacture of Vegetable oils | 110.43 | 54.08 | 72.59 | | 212 | Manufacture of Animal oils | 110.43 | 54.08 | 72.59 | | 213 | Processing and blending of tea including instant tea | 115.57 | 48.60 | 74.14 | | 214 | Coffee curing, roasting and blending | 115.57 | 48.60 | 74.14 | | 215 | Manufacture of edible nuts | 101.60 | 28.86 | 32.26 | | 216 | Manufacture of ice | 101.60 | 28.86 | 32.26 | | 217 | Manufacture of prepared animal and bird fee | 101.60 | 28.86 | 32.26 | | 218 | Manufacture of Starch | 101.60 | 28.86 | 32.26 | | 219 | Manufacture of food products n.e.c | 101.60 | 28.86 | 32.26 | | 220 | Distilling rectifying and blending of spirits | 204.86 | 94.93 | 50.81 | | 221 | Manufacture of Wine | 204.86 | 94.93 | 50.81 | | 222 | Manufacture of Malt Liquors and Malt | 204.86 | 94.93 | 50.81 | | 223 | Manufacture of Country Liquors | 204.86 | 94.93 | 50.81 | | 224 | Manufacture of Soft drinks and Syrups | 204.86 | 94.93 | 50.81 | | 225 | Tobacco Stemming, redrying and other preparations | 115.57 | 37.23 | 30.17 | | 226 | Manufacture of bidi | 115.57 | 37.23 | 30.17 | | 227 | Manufacture of Cigars, cigarette, cheroots and c tobacco | 115.57 | 37.23 | 30.17 | | 228 | Manufacture of Snuff, Zarda etc | 115.57 | 37.23 | 30.17 | | 229 | Manufacture of Pan masala etc | 115.57 | 37.23 | 30.17 | | 232 | Weaving and finishing of cotton khadi | 75.46 | 34.38 | 14.97 | | 233 | Weaving and finishing of cotton textiles on handlooms | 75.46 | 34.38 | 14.97 | | 234 | Weaving and finishing of cotton textiles on power looms | 75.46 | 34.38 | 14.97 | | 236 | Bleaching, dyeing and pruning of cotton textiles | 75.46 | 34.38 | 14.97 | | 243 | Bleaching and dyeing of woolen textiles | 77.49 | 33.72 | 14.87 | | 246 | Bleaching and dyeing of silk textiles | 87.71 | 31.57 | 14.20 | | 257 | Bleaching, dyeing and printing of Jute and Mesta fibers | 111.49 | 38.68 | 15.53 | | 258 | Bleaching, dyeing and printing of coir fibers | 111.49 | 38.68 | 15.53 | | 259 | Bleaching, dyeing and printing of vegetable fibers nec | 111.49 | 38.68 | 15.53 | | 260 | Manufacture of knitted or crocheted textile products | 93.83 | 40.41 | 15.53 | | 262 | Threads, Cordage, Ropes n Twines | 90.93 | 38.11 | 15.33 | | 263 | Blankets, shawls, carpets, and other similar textile products | 77.41 | 33.73 | 14.87 | | 265 | Textile garments and clothing accessories | 93.83 | 40.41 | 15.53 | | 267 | Made up textiles except apparel | 93.83 | 40.41 | 15.53 | | 268 | Water proof textile fabrics | 90.93 | 38.11 | 15.33 | | 269 | Textiles/ textile products n.e.c. | 90.93 | 38.11 | 15.33 | | 273 | Manufacture of wooden goods | 85.83 | 33.09 | 15.41 | | 274 | Manufacture of wooden industrial goods | 85.83 | 33.09 | 15.41 | | 275 | Manufacture of cork and cork products | 85.83 | 33.09 | 15.41 | | 276 | Manufacture of wooden furniture and fixtures | 115.57 | 38.33 | 15.53 | | 277 | Manufacture of bamboo and cane furniture and fixtures | 115.57 | 38.33 | 15.53 | | 279 | Manufacture of wood, cane, bamboo, reed & grass n.e.c | 115.57 | 38.33 | 15.53 | | 283 | Manufacture of special purpose newspaper-printed or not n.e.c | 94.49 | 27.72 | 14.03 | | 284 | Printing and publishing of newspaper | 69.17 | 22.38 | 11.86 | | 285 | Printing and publishing of periodicals, books, etc | 69.17 | 22.38 | 11.86 | | 286 | Printing of bank notes, currency etc | 69.17 | 22.38 | 11.86 | | 287 | Engraving, etching and block making | 69.17 | 22.38 | 11.86 | | 288 | Book binding on account of others | 69.17 | 22.38 | 11.86 | | 289 | Printing and allied activities NEC | 69.17 | 22.38 | 11.86 | | 291 | Footwear of leather | 91.77 | 40.69 | 15.53 | | 292 | Wearing apparel of leather + leather sub | 79.31 | 32.16 | 14.73 | | 293 | Leather products and substitutes | 79.31 | 32.16 | 14.73 | | 299 | Leather and fur product n.e.c. | 79.31 | 32.16 | 14.73 | | 304 | Drugs and medicines | 81.34 | 36.05 | 14.93 | | 305 | Perfumes, cosmetics and Lotions | 94.01 | 42.35 | 17.69 | | 311 | Rubber and Plastic Footwear | 90.12 | 38.90 | 15.47 | | 321 | Manufacture of glass and glass products | 101.89 | 35.35 | 14.70 | | 322 | Manufacture of earthen and plaster products | 101.89 | 35.35 | 14.70 | | 323 | Manufacture of non structural ceramic ware | 101.89 | 35.35 | 14.70 | | 342 | Furniture’s and fixtures of metals | 85.26 | 36.92 | 15.87 | | 346 | Metal Kitchen ware | 85.26 | 36.92 | 15.87 | | 355 | Manufacture of refrigerators, AC's | 79.03 | 37.79 | 15.09 | | 363+364 | Electric lamps, fans and Domestic Appliances | 79.04 | 37.79 | 15.09 | | 365+366 | Radio and TV apparatus | 76.05 | 28.13 | 8.64 | | 373+374 | Heavy motor vehicles; cars and parts | 74.54 | 42.24 | 28.86 | | 375 | Motor cycles, scooters and parts | 77.53 | 47.88 | 39.99 | | 376 | Bicycles, cycle rickshaws and parts | 65.77 | 40.67 | 15.53 | | Source: Author’s computation based on DGCIS database, Customs Tariff Schedule and Input-Output Transactions table, Government of India. |
| Table A 2: Effective Rate of Protection (per cent) in Indian Industries: Use-Based Classification | | Code NIC 87 | Three-Digit Classification Description | 1990-91 to 1996-97 | 1997-98 to 2002-03 | 2003-04 to 2009-10 | | Intermediate Goods industries | | 230 | Cotton ginning, spinning and bailing | 73.49 | 34.41 | 15.06 | | 231 | Cotton spinning other than in mills | 73.49 | 34.41 | 15.06 | | 235 | Cotton spinning, weaving and processing in mills | 73.49 | 34.41 | 15.06 | | 240 | Preparing of raw wool, silk and textile fibers for spinning | 108.40 | 32.86 | 14.73 | | 241 | Wool spinning, weaving and finishing other than in mills | 64.21 | 33.25 | 14.90 | | 242 | Wool spinning, weaving and finishing in mills | 64.21 | 33.25 | 14.90 | | 244 | Spinning, weaving and finishing of silk other than in mills | 87.76 | 31.31 | 14.23 | | 245 | Spinning, weaving and finishing of silk in mills | 87.76 | 31.31 | 14.23 | | 247 | Spinning, weaving and processing of manmade textiles | 173.22 | 34.04 | 15.06 | | 248 | Spinning, weaving and processing of artificial/synthetic textiles | 173.22 | 34.04 | 15.06 | | 250 | Jute and Mesta pressing and bailing | 108.48 | 39.17 | 15.61 | | 251 | Preparatory operations of Jute and Mesta fibers | 108.48 | 39.17 | 15.61 | | 252 | Preparatory operations of coir fibers | 108.48 | 39.17 | 15.61 | | 253 | preparatory operations of other vegetable fibers | 108.48 | 39.17 | 15.61 | | 254 | Spinning, weaving and finishing of Jute and Mesta textiles | 108.48 | 39.17 | 15.61 | | 255 | Spinning, weaving and finishing of coir textiles | 108.48 | 39.17 | 15.61 | | 256 | Spinning, weaving and finishing of vegetable fiber textiles | 108.48 | 39.17 | 15.61 | | 270 | Sawing and planing of wood | 86.47 | 33.07 | 15.53 | | 271 | Manufacture of veneer sheets | 86.47 | 33.07 | 15.53 | | 272 | Manufacture of structural wooden goods | 86.47 | 33.07 | 15.53 | | 280 | Manufacture of pulp, paper and paper board | 98.61 | 26.30 | 13.91 | | 281 | Manufacture of container and boxes of paper | 98.61 | 26.30 | 13.91 | | 282 | Manufacture of paper and paper board NEC | 98.61 | 26.30 | 13.91 | | 290 | Tanning, curing, finishing of leather | 82.54 | 39.47 | 14.72 | | 300 | Industrial organic and inorganic chemical | 83.81 | 36.14 | 13.40 | | 301 | Fertilizers and pesticides | 57.23 | 31.34 | 13.40 | | 302+306 | Synthetic rubber Man-made Fibers | 82.51 | 36.40 | 14.38 | | 303 | Paints, varnishes and related products, | 136.51 | 37.37 | 15.15 | | 308 | Explosives and Fireworks | 79.38 | 33.93 | 15.54 | | 309 | Chemical Products NEC | 79.38 | 33.93 | 15.54 | | 310 | Tyre and tubes | 92.37 | 43.61 | 15.96 | | 312 | Rubber product n.e.c | 92.37 | 43.61 | 15.96 | | 313 | Plastic products n.e.c | 98.64 | 39.05 | 16.42 | | 314 | Refined petroleum product | 68.72 | 23.04 | 11.18 | | 316 | Refined petroleum products n.e.c | 68.72 | 23.04 | 11.18 | | 318 | Coke-oven products | 60.81 | 34.03 | 15.36 | | 319 | Other coal and coal tar product n.e.c | 60.81 | 34.03 | 15.36 | | 324 | Manufacture of cement, lime and plasters | 109.37 | 38.66 | 15.31 | | 325 | Manufacture of mica products | 115.10 | 37.81 | 16.42 | | 326 | Manufacture of structural stone goods and stone ware | 115.10 | 37.81 | 16.42 | | 327 | Manufacture of asbestos cement and other cement products | 109.37 | 38.66 | 15.31 | | 329 | Manufacture of misc non Metallica mineral products n.e.c | 115.10 | 37.81 | 16.42 | | 330 | Iron and steel primary/semi finished forms | 107.74 | 46.06 | 15.49 | | 331 | Semi finished iron and steel products | 107.74 | 46.06 | 15.49 | | 332 | Ferro Alloys | 64.52 | 31.19 | 12.69 | | 333 | Copper manufacturing | 69.14 | 32.48 | 10.99 | | 335 | Aluminum manufacturing | 69.14 | 32.48 | 10.99 | | 336 | Zinc manufacturing | 69.14 | 32.48 | 10.99 | | 338+339 | Metal products and Non Ferrous metals | 69.14 | 32.48 | 10.99 | | 340 | Fabricated structural metal products | 172.20 | 45.64 | 17.02 | | 341 | Fabricated metal products, nec | 172.20 | 45.64 | 17.02 | | 343+349 | Hand-tools, weights etc | 71.58 | 37.39 | 17.44 | | Capital Goods industries | | 350 | Agri machinery and equipments and parts thereof | 42.05 | 26.20 | 14.17 | | 351 | Construction and mining industries | 41.85 | 24.05 | 14.21 | | 352 | Prime movers, boilers, steam generating plants nuclear reactors | 41.85 | 24.05 | 14.21 | | 353 | Industrial machinery for food and textile industry | 41.70 | 27.19 | 14.30 | | 354 | Industrial machinery other than food and textile | 41.85 | 24.05 | 14.21 | | 356 | General purpose Machinery | 50.90 | 26.82 | 14.41 | | 357 | Machine tools parts and accessories | 45.16 | 23.25 | 13.61 | | 358 | Office, computing and accounting machinery and parts | 72.75 | 29.00 | 3.62 | | 359 | Special purpose machinery and equipment /component/accessories | 50.90 | 26.82 | 14.41 | | 360 | Electrical industrial machinery | 48.91 | 25.02 | 14.22 | | 361 | Insulated wires and cables | 93.42 | 49.49 | 14.17 | | 362 | Primary cells and primary batteries | 107.26 | 48.18 | 17.21 | | 365+366 | Radio and TV apparatus | 78.60 | 23.51 | 3.51 | | 368 | Electronic valves and tubes | 78.60 | 23.51 | 3.51 | | 369 | X ray Machines and Electrical equipments nec | 78.60 | 23.51 | 3.51 | | 370 | Ship and boat building | 49.63 | 34.66 | 14.99 | | 371 | Locomotives and parts | 45.49 | 25.87 | 15.74 | | 372 | Railway/tramway wagons and coaches | 45.49 | 25.87 | 15.74 | | 377 | Aircraft, spacecraft and parts | 89.96 | 43.68 | 10.70 | | 379 | Transport and equipments and parts | 89.96 | 43.68 | 10.70 | | Consumer Goods industries | | 200 | Slaughtering, preparation and preservation of meat | 103.87 | 27.96 | 32.06 | | 201 | Manufacture of dairy products | 103.87 | 27.96 | 32.06 | | 202 | Canning and preservation of fruits and vegetables | 103.87 | 27.96 | 32.06 | | 203 | Processing, canning and preservation of fish, crustacean | 103.87 | 27.96 | 32.06 | | 204 | Grain milling | 103.87 | 27.96 | 32.06 | | 205 | Manufacture of bakery products | 103.87 | 27.96 | 32.06 | | 206 | Manufacture and refining of sugar (vacuum pan sugar factories) | 83.69 | 49.04 | 65.12 | | 207 | Production of indigenous sugar, ‘Boora’, ‘Khandsari’, ‘Gur’ etc. | 83.69 | 49.04 | 65.12 | | 208 | Manufacture of common salt | 103.87 | 27.96 | 32.06 | | 209 | Manufacture of cocoa products and sugar confectionery | 103.87 | 27.96 | 32.06 | | 210 | Manufacture of hydrogenated oil and vanaspati | 109.36 | 30.65 | 110.79 | | 211 | manufacture of Vegetable oils | 111.19 | 55.83 | 77.56 | | 212 | Manufacture of Animal oils | 111.19 | 55.83 | 77.56 | | 213 | Processing and blending of tea including instant tea | 117.17 | 48.93 | 80.73 | | 214 | Coffee curing, roasting and blending | 117.17 | 48.93 | 80.73 | | 215 | Manufacture of edible nuts | 103.87 | 27.96 | 32.06 | | 216 | Manufacture of ice | 103.87 | 27.96 | 32.06 | | 217 | Manufacture of prepared animal and bird fee | 103.87 | 27.96 | 32.06 | | 218 | Manufacture of Starch | 103.87 | 27.96 | 32.06 | | 219 | Manufacture of food products n.e.c | 103.87 | 27.96 | 32.06 | | 220 | Distilling rectifying and blending of spirits | 287.42 | 139.29 | 65.68 | | 221 | Manufacture of Wine | 287.42 | 139.29 | 65.68 | | 222 | manufacture of Malt Liquors and Malt | 287.42 | 139.29 | 65.68 | | 223 | Manufacture of Country Liquors | 287.42 | 139.29 | 65.68 | | 224 | Manufacture of Soft drinks and Syrups | 287.42 | 139.29 | 65.68 | | 225 | Tobacco Stemming, redrying and other preparations | 122.31 | 38.24 | 31.40 | | 226 | manufacture of bidi | 122.31 | 38.24 | 31.40 | | 227 | Manufacture of Cigars, cigarette, cheroots and c tobacco | 122.31 | 38.24 | 31.40 | | 228 | Manufacture of Snuff, Zarda etc | 122.31 | 38.24 | 31.40 | | 229 | Manufacture of Pan masala etc | 122.31 | 38.24 | 31.40 | | 232 | Weaving and finishing of cotton khadi | 75.70 | 34.53 | 15.06 | | 233 | Weaving and finishing of cotton textiles on handlooms | 75.70 | 34.53 | 15.06 | | 234 | Weaving and finishing of cotton textiles on power looms | 73.49 | 34.41 | 15.06 | | 236 | Bleaching, dyeing and pruning of cotton textiles | 73.49 | 34.41 | 15.06 | | 243 | Bleaching and dyeing of woolen textiles | 64.21 | 33.25 | 14.90 | | 246 | Bleaching and dyeing of silk textiles | 87.76 | 31.31 | 14.23 | | 257 | Bleaching, dyeing and printing of Jute and Mesta fibers | 137.24 | 40.08 | 16.15 | | 258 | Bleaching, dyeing and printing of coir fibers | 137.24 | 40.08 | 16.15 | | 259 | Bleaching, dyeing and printing of vegetable fibers n.e.c | 137.24 | 40.08 | 16.15 | | 260 | Manufacture of knitted or crocheted textile products | 101.04 | 45.05 | 16.16 | | 262 | Threads, Cordage, Ropes n Twines | 96.57 | 40.35 | 15.75 | | 263 | Blankets, shawls, carpets, and other similar textile products | 64.21 | 33.25 | 14.90 | | 265 | Textile garments and clothing accessories | 101.05 | 45.06 | 16.16 | | 267 | Made up textiles except apparel | 101.05 | 45.06 | 16.16 | | 268 | Water proof textile fabrics | 96.57 | 40.34 | 15.75 | | 269 | Textiles/ textile products n.e.c. | 96.57 | 40.34 | 15.75 | | 273 | Manufacture of wooden goods | 86.47 | 33.07 | 15.53 | | 274 | Manufacture of wooden industrial goods | 86.47 | 33.07 | 15.53 | | 275 | Manufacture of cork and cork products | 86.47 | 33.07 | 15.53 | | 276 | Manufacture of wooden furniture’s and fixtures | 125.97 | 39.11 | 15.70 | | 277 | Manufacture of bamboo and cane furniture and fixtures | 125.97 | 38.30 | 15.53 | | 279 | Manufacture of wood, cane, bamboo, reed and grass NEC | 125.97 | 39.11 | 15.70 | | 283 | Manufacture of special purpose newspaper-printed or not NEC | 98.61 | 26.30 | 13.91 | | 284 | Printing and publishing of newspaper | 59.15 | 19.23 | 10.45 | | 285 | Printing and publishing of periodicals, books, etc | 59.15 | 19.23 | 10.45 | | 286 | Printing of bank notes, currency etc | 59.15 | 19.23 | 10.45 | | 287 | Engraving, etching and block making | 59.15 | 19.23 | 10.45 | | 288 | Book binding on account of others | 59.15 | 19.23 | 10.45 | | 289 | Printing and allied activites NEC | 59.15 | 19.23 | 10.45 | | 291 | Footwear of leather | 93.02 | 35.91 | 15.85 | | 292 | Wearing apparel of leather + leather sub | 82.54 | 39.47 | 14.72 | | 293 | Leather products and substitutes | 82.54 | 39.47 | 14.72 | | 299 | Leather and fur product n.e.c. | 82.54 | 39.47 | 14.72 | | 304 | Drugs and medicines | 79.17 | 36.93 | 14.43 | | 305 | Perfumes, cosmetics and Lotions | 105.48 | 48.02 | 19.72 | | 311 | Rubber and Plastic Footwear | 95.51 | 41.33 | 16.19 | | 321 | Manufacture of glass and glass products | 109.12 | 35.73 | 14.82 | | 322 | Manufacture of earthen and plaster products | 109.12 | 35.73 | 14.82 | | 323 | Manufacture of non structural ceramic ware | 109.12 | 35.73 | 14.82 | | 342 | Furniture’s and fixtures of metals | 94.44 | 40.59 | 18.17 | | 346 | Metal Kitchen ware | 94.45 | 40.59 | 18.17 | | 355 | Manufacture of refrigerators, AC's | 80.08 | 39.99 | 16.69 | | 363+364 | Electric lamps, fans and Domestic Appliances | 80.07 | 40.00 | 16.69 | | 365+366 | Radio and TV apparatus | 78.60 | 23.51 | 3.51 | | 373+374 | Heavy motor vehicles; cars and parts | 74.16 | 46.77 | 47.38 | | 375 | Motor cycles, scooters and parts | 76.38 | 53.82 | 59.84 | | 376 | Bicycles, cycle rickshaws and parts | 62.84 | 43.86 | 16.24 | | Source: Author’s computation based on DGCIS database, Customs Tariff Schedule and Input-Output Transactions table, Government of India. |
| Table A 3: Frequency Ratio (per cent) in Indian Industries: Use-Based Classification | | Code NIC 87 | Three-Digit Classification Description | 1990-91 to 1996-97 | 1997-98 to 2002-03 | 2003-04 to 2009-10 | | Intermediate Goods industries | | 230 | Cotton ginning, spinning and bailing | 45.45 | 31.57 | 0.00 | | 231 | Cotton spinning other than in mills | 45.45 | 31.57 | 0.00 | | 235 | Cotton spinning, weaving and processing in mills | 45.45 | 31.57 | 0.00 | | 240 | Preparing of raw wool, silk and textile fibers for spinning | 52.16 | 26.98 | 3.03 | | 241 | Wool spinning, weaving and finishing other than in mills | 18.18 | 6.06 | 3.03 | | 242 | Wool spinning, weaving and finishing in mills | 18.18 | 6.06 | 3.03 | | 244 | Spinning, weaving and finishing of silk other than in mills | 72.86 | 61.11 | 0.00 | | 245 | Spinning, weaving and finishing of silk in mills | 72.86 | 61.11 | 0.00 | | 247 | Spinning, weaving and processing of manmade textiles | 43.72 | 11.66 | 0.00 | | 248 | Sinning, weaving and processing of artificial/synthetic textiles | 43.72 | 11.66 | 0.00 | | 250 | Jute and Mesta pressing and bailing | 66.52 | 42.71 | 0.00 | | 251 | Preparatory operations of jute and Mesta fibers | 66.52 | 42.71 | 0.00 | | 252 | Preparatory operations of coir fibers | 66.52 | 42.71 | 0.00 | | 253 | Preparatory operations of other vegetable fibers | 66.52 | 42.71 | 0.00 | | 254 | Spinning, weaving and finishing of jute and Mesta textiles | 66.52 | 42.71 | 0.00 | | 255 | Spinning, weaving and finishing of coir textiles | 66.52 | 42.71 | 0.00 | | 256 | Spinning, weaving and finishing of vegetable fiber textiles | 66.52 | 42.71 | 0.00 | | 270 | Sawing and planing of wood | 49.69 | 6.83 | 0.00 | | 271 | Manufacture of veneer sheets | 49.69 | 6.83 | 0.00 | | 280 | Manufacture of pulp, paper and paper board | 54.91 | 11.01 | 0.00 | | 281 | Manufacture of container and boxes of paper | 54.91 | 11.01 | 0.00 | | 282 | Manufacture of paper and paper board n.e.c | 54.91 | 11.01 | 0.00 | | 290 | Tanning, curing, finishing of leather | 33.04 | 11.79 | 8.93 | | 300 | Industrial organic and inorganic chemical | 5.36 | 4.48 | 2.90 | | 301 | Fertilizers and pesticides | 83.33 | 12.22 | 2.13 | | 302+306 | Synthetic rubber Man-made Fibers | 10.34 | 2.16 | 0.37 | | 303 | Paints, varnishes and related products, | 71.43 | 20.71 | 0.00 | | 308 | Explosives and Fireworks | 48.10 | 20.37 | 15.91 | | 309 | Chemical Products n.e.c | 48.10 | 20.37 | 15.91 | | 310 | Tyre and tubes | 58.77 | 18.75 | 5.99 | | 312 | Rubber product n.e.c | 58.77 | 18.75 | 5.99 | | 313 | Plastic products n.e.c | 61.22 | 21.56 | 6.89 | | 314 | Refined petroleum product | 61.61 | 21.03 | 7.20 | | 316 | Refined petroleum products n.e.c | 61.61 | 23.12 | 7.20 | | 318 | Coke-oven products | 28.57 | 0.00 | 0.00 | | 324 | Manufacture of cement, lime and plasters | 100.00 | 37.22 | 0.00 | | 325 | Manufacture of mica products | 73.82 | 19.63 | 0.00 | | 326 | Manufacture of structural stone goods and stone ware | 73.82 | 19.63 | 0.00 | | 327 | Manufacture of asbestos cement and other cement products | 100.00 | 37.22 | 0.00 | | 329 | Manufacture of misc non metallic mineral products NEC | 73.82 | 19.63 | 0.00 | | 330 | Iron and steel primary/semi finished forms | 33.13 | 6.38 | 4.47 | | 331 | Semi finished iron and steel products | 33.13 | 6.38 | 4.47 | | 332 | Ferro Alloys | 33.04 | 7.07 | 12.24 | | 333 | Copper manufacturing | 24.52 | 17.61 | 10.01 | | 335 | Aluminum manufacturing | 24.52 | 17.61 | 10.01 | | 336 | Zinc manufacturing | 24.52 | 17.61 | 10.01 | | 338+339 | Metal products and Non Ferrous metals | 24.52 | 17.61 | 10.01 | | 340 | Fabricated structural metal products | 28.57 | 0.00 | 0.00 | | 341 | Fabricated metal products, n.e.c | 28.57 | 0.00 | 0.00 | | 343+349 | Hand-tools, weights etc | 79.70 | 30.88 | 0.00 | | Capital Goods industries | | 350 | Agri machinery and equipments and parts thereof | 38.10 | 28.28 | 0.00 | | 351 | Construction and mining industries | 14.29 | 0.01 | 0.00 | | 352 | Prime movers, boilers, steam generating plants nuclear reactors | 14.29 | 0.01 | 0.00 | | 353 | Industrial machinery for food and textile industry | 34.69 | 1.44 | 0.00 | | 354 | Industrial machinery other than food and textile | 14.29 | 0.01 | 0.00 | | 356 | General purpose Machinery | 59.74 | 16.74 | 12.47 | | 357 | Machine tools parts and accessories | 0.00 | 0.00 | 0.00 | | 358 | Office, computing and accounting machinery and parts | 66.33 | 12.51 | 0.00 | | 359 | Special purpose machinery and equipment /component/accessories | 59.74 | 16.74 | 12.47 | | 360 | Electrical industrial machinery | 35.71 | 10.25 | 10.00 | | 361 | Insulated wires and cables | 42.86 | 0.00 | 0.00 | | 362 | Primary cells and primary batteries | 100.00 | 25.00 | 0.00 | | 365+366 | Radio and TV apparatus | 49.11 | 15.79 | 2.98 | | 368 | Electronic valves and tubes | 49.11 | 15.79 | 2.98 | | 369 | X ray Machines and Electrical equipments nec | 49.11 | 15.79 | 2.98 | | 370 | Ship and boat building | 91.43 | 39.67 | 4.29 | | 371 | Locomotives and parts | 35.71 | 0.00 | 0.00 | | 372 | Railway/tramway wagons and coaches | 35.71 | 0.00 | 0.00 | | Consumer Goods industries | | 200 | Slaughtering, preparation and preservation of meat | 91.32 | 49.17 | 9.46 | | 201 | Manufacture of dairy products | 91.32 | 49.17 | 9.46 | | 202 | Canning and preservation of fruits and vegetables | 91.32 | 49.17 | 9.46 | | 203 | Processing, canning and preservation of fish, crustacean | 91.32 | 49.17 | 9.46 | | 204 | Grain milling | 91.32 | 49.17 | 9.46 | | 205 | Manufacture of bakery products | 91.32 | 49.17 | 9.46 | | 206 | Manufacture and refining of sugar (vacuum pan sugar factories) | 28.96 | 0.36 | 0.00 | | 207 | Production of indigenous sugar, ‘Boora’, ‘khandsari’, ‘Gur’ etc. | 28.96 | 0.36 | 0.00 | | 208 | manufacture of common salt | 91.32 | 49.17 | 9.46 | | 209 | Manufacture of cocoa products and sugar confectionery | 91.32 | 49.17 | 9.46 | | 210 | Manufacture of hydrogenated oil and vanaspati | 80.65 | 65.28 | 36.25 | | 211 | Manufacture of Vegetable oils | 86.31 | 30.40 | 2.39 | | 212 | Manufacture of Animal oils | 86.31 | 30.23 | 2.08 | | 213 | Processing and blending of tea including instant tea | 98.51 | 53.58 | 0.00 | | 214 | Coffee curing, roasting and blending | 98.51 | 53.58 | 0.00 | | 215 | Manufacture of edible nuts | 96.30 | 52.50 | 10.10 | | 216 | Manufacture of ice | 93.53 | 49.34 | 8.91 | | 217 | Manufacture of prepared animal and bird fee | 93.53 | 49.34 | 8.91 | | 218 | Manufacture of Starch | 93.53 | 49.34 | 8.91 | | 219 | Manufacture of food products n.e.c | 93.53 | 49.34 | 8.91 | | 220 | Distilling rectifying and blending of spirits | 92.06 | 62.04 | 0.00 | | 221 | Manufacture of Wine | 92.06 | 62.04 | 0.00 | | 222 | Manufacture of Malt Liquors and Malt | 92.06 | 62.04 | 0.00 | | 223 | Manufacture of Country Liquors | 92.06 | 62.04 | 0.00 | | 224 | Manufacture of Soft drinks and Syrups | 92.06 | 62.04 | 0.00 | | 225 | Tobacco Stemming, redrying and other preparations | 100.00 | 69.44 | 0.00 | | 226 | Manufacture of bidi | 100.00 | 69.44 | 0.00 | | 227 | Manufacture of Cigars, cigarette, cheroots and c tobacco | 100.00 | 69.44 | 0.00 | | 228 | Manufacture of Snuff, Zarda etc | 100.00 | 69.44 | 0.00 | | 229 | Manufacture of Pan masala etc | 100.00 | 69.44 | 0.00 | | 232 | Weaving and finishing of cotton khadi | 38.96 | 31.57 | 0.00 | | 233 | Weaving and finishing of cotton textiles on handlooms | 45.45 | 31.57 | 0.00 | | 234 | Weaving and finishing of cotton textiles on power looms | 45.45 | 31.57 | 0.00 | | 236 | Bleaching, dyeing and pruning of cotton textiles | 45.45 | 31.57 | 0.00 | | 243 | Bleaching and dyeing of woolen textiles | 18.18 | 6.06 | 3.03 | | 246 | Bleaching and dyeing of silk textiles | 72.86 | 61.11 | 0.00 | | 260 | Manufacture of knitted or crocheted textile products | 87.54 | 53.05 | 0.78 | | 262 | Threads, Cordage, Ropes n Twines | 76.83 | 44.31 | 2.23 | | 263 | Blankets, shawls, carpets, and other similar textile products | 48.05 | 13.64 | 0.00 | | 265 | Textile garments and clothing accessories | 87.54 | 53.05 | 0.78 | | 267 | Made up textiles except apparel | 87.54 | 53.05 | 0.78 | | 268 | Water proof textile fabrics | 76.83 | 44.31 | 2.23 | | 269 | Textiles/ textile products n.e.c. | 76.83 | 44.31 | 2.23 | | 273 | Manufacture of wooden goods | 49.69 | 6.83 | 0.00 | | 274 | Manufacture of wooden industrial goods | 49.69 | 6.83 | 0.00 | | 275 | Manufacture of cork and cork products | 49.69 | 6.83 | 0.00 | | 276 | Manufacture of wooden furniture’s and fixtures | 86.29 | 34.01 | 0.00 | | 277 | Manufacture of bamboo and cane furniture and fixtures | 86.29 | 34.01 | 0.00 | | 279 | Manufacture of wood, cane, bamboo, reed and grass NEC | 86.29 | 34.01 | 0.00 | | 283 | Manufacture of special purpose newspaper-printed or not NEC | 54.91 | 11.01 | 0.00 | | 284 | Printing and publishing of newspaper | 60.32 | 25.43 | 5.77 | | 285 | Printing and publishing of periodicals, books, etc | 60.32 | 25.43 | 5.77 | | 286 | Printing of bank notes, currency etc | 60.32 | 25.43 | 5.77 | | 287 | Engraving, etching and block making | 60.32 | 25.43 | 5.77 | | 288 | Book binding on account of others | 60.32 | 25.43 | 5.77 | | 289 | Printing and allied activities n.e.c | 60.32 | 25.43 | 5.77 | | 291 | Footwear of leather | 82.14 | 49.44 | 0.00 | | 292 | Wearing apparel of leather + leather sub | 32.14 | 11.79 | 8.93 | | 293 | Leather products and substitutes | 32.14 | 11.79 | 8.93 | | 299 | Leather and fur product n.e.c. | 32.14 | 11.79 | 8.93 | | 304 | Drugs and medicines | 11.69 | 15.90 | 3.06 | | 305 | Perfumes, cosmetics and Lotions | 72.14 | 12.13 | 0.00 | | 311 | Rubber and Plastic Footwear | 60.52 | 26.32 | 5.54 | | 321 | Manufacture of glass and glass products | 76.19 | 38.89 | 0.00 | | 322 | Manufacture of earthen and plaster products | 76.19 | 38.89 | 0.00 | | 323 | Manufacture of non structural ceramic ware | 76.19 | 38.89 | 0.00 | | 342 | Furniture’s and fixtures of metals | 69.64 | 27.13 | 0.00 | | 346 | Metal Kitchen ware | 69.64 | 27.13 | 0.00 | | 355 | Manufacture of refrigerators, AC's | 89.80 | 42.48 | 0.00 | | 363+364 | Electric lamps, fans and Domestic Appliances | 100.00 | 44.80 | 0.00 | | 365+366 | Radio and TV apparatus | 49.11 | 15.79 | 2.98 | | 373+374 | Heavy motor vehicles; cars and parts | 75.32 | 45.02 | 9.09 | | 375 | Motor cycles, scooters and parts | 33.33 | 26.85 | 0.00 | | 376 | Bicycles, cycle rickshaws and parts | 50.00 | 41.67 | 0.00 | | Source: Author’s computation based on DGCIS database, Customs Tariff Schedule, Government of India. |
| Table A 4: Import Coverage Ratio (per cent) in Indian Industries: Use-Based Classification | | Code NIC 87 | Three-Digit Classification Description | 1990-91 to 1996-97 | 1997-98 to 2002-03 | 2003-04 to 2009-10 | | Intermediate Goods industries | | 230 | Cotton ginning, spinning and bailing | 92.83 | 55.58 | 0.00 | | 231 | Cotton spinning other than in mills | 92.83 | 55.58 | 0.00 | | 235 | Cotton spinning, weaving and processing in mills | 92.83 | 55.58 | 0.00 | | 240 | Preparing of raw wool, silk and textile fibers for spinning | 47.75 | 17.78 | 0.00 | | 241 | Wool spinning, weaving and finishing other than in mills | 0.98 | 0.91 | 0.00 | | 242 | Wool spinning, weaving and finishing in mills | 0.98 | 0.91 | 0.00 | | 244 | Spinning, weaving and finishing of silk other than in mills | 83.75 | 67.71 | 0.00 | | 245 | Spinning, weaving and finishing of silk in mills | 83.75 | 67.71 | 0.00 | | 247 | Spinning, weaving and processing of Man-made textiles | 45.38 | 10.60 | 0.00 | | 248 | Spinning, weaving and processing of artificial/synthetic textiles | 45.38 | 10.60 | 0.00 | | 250 | Jute and Mesta pressing and bailing | 88.15 | 70.94 | 0.00 | | 251 | Preparatory operations of Jute and Mesta fibers | 88.15 | 70.94 | 0.00 | | 252 | Preparatory operations of coir fibers | 88.15 | 70.94 | 0.00 | | 253 | Preparatory operations of other vegetable fibers | 88.15 | 70.94 | 0.00 | | 254 | Spinning, weaving and finishing of Jute and Mesta textiles | 88.15 | 70.94 | 0.00 | | 255 | Spinning, weaving and finishing of coir textiles | 88.15 | 70.94 | 0.00 | | 256 | Spinning, weaving and finishing of vegetable fiber textiles | 88.15 | 70.94 | 0.00 | | 270 | Sawing and planing of wood | 36.51 | 0.99 | 0.00 | | 271 | Manufacture of veneer sheets | 36.51 | 0.99 | 0.00 | | 280 | Manufacture of pulp, paper and paper board | 63.64 | 36.65 | 28.87 | | 281 | Manufacture of container and boxes of paper | 63.64 | 36.65 | 28.87 | | 282 | Manufacture of paper and paper board NEC | 63.64 | 36.65 | 28.87 | | 290 | Tanning, curing, finishing of leather | 3.12 | 1.17 | 0.44 | | 300 | Industrial organic and inorganic chemical | 0.29 | 0.64 | 0.37 | | 301 | Fertilizers and pesticides | 88.51 | 11.74 | 1.29 | | 302+306 | Synthetic rubber Man-made Fibers | 4.17 | 0.39 | 0.07 | | 303 | Paints, varnishes and related products, | 84.87 | 15.26 | 0.00 | | 308 | Explosives and Fireworks | 26.26 | 3.18 | 1.58 | | 309 | Chemical Products n.e.c | 26.26 | 3.18 | 1.58 | | 310 | Tyre and tubes | 26.39 | 4.03 | 0.61 | | 312 | Rubber product n.e.c | 26.39 | 4.03 | 0.61 | | 313 | Plastic products n.e.c | 54.87 | 18.45 | 3.82 | | 314 | Refined petroleum product | 97.24 | 74.15 | 41.00 | | 316 | Refined petroleum products n.e.c | 97.24 | 74.15 | 41.00 | | 318 | Coke-oven products | 28.57 | 0.00 | 0.00 | | 324 | Manufacture of cement, lime and plasters | 100.00 | 22.77 | 0.00 | | 325 | Manufacture of mica products | 97.71 | 93.07 | 0.00 | | 326 | Manufacture of structural stone goods and stone ware | 97.71 | 93.07 | 0.00 | | 327 | Manufacture of asbestos cement and other cement products | 100.00 | 22.77 | 0.00 | | 329 | Manufacture of misc non metallic mineral products NEC | 97.71 | 93.07 | 0.00 | | 330 | Iron and steel primary/semi finished forms | 28.81 | 3.67 | 6.63 | | 331 | Semi finished iron and steel products | 28.81 | 3.67 | 6.63 | | 332 | Ferro Alloys | 28.59 | 8.35 | 10.77 | | 333 | Copper manufacturing | 50.26 | 85.74 | 14.37 | | 335 | Aluminum manufacturing | 50.26 | 85.74 | 14.37 | | 336 | Zinc manufacturing | 50.26 | 85.74 | 14.37 | | 338+339 | Metal products and Non Ferrous metals | 50.26 | 85.74 | 14.37 | | 340 | Fabricated structural metal products | 28.57 | 0.00 | 0.00 | | 341 | Fabricated metal products, n.e.c | 28.57 | 0.00 | 0.00 | | 343+349 | Hand-tools, weights etc | 56.33 | 7.39 | 0.00 | | Capital Goods Industries | | 350 | Agri machinery and equipments and parts thereof | 39.75 | 18.38 | 0.00 | | 351 | Construction and mining industries | 16.00 | 0.00 | 0.00 | | 352 | Prime movers, boilers, steam generating plants nuclear reactors | 16.00 | 0.00 | 0.00 | | 353 | Industrial machinery for food and textile industry | 28.49 | 0.10 | 0.00 | | 354 | Industrial machinery other than food and textile | 16.00 | 0.00 | 0.00 | | 356 | General purpose Machinery | 54.69 | 2.11 | 0.07 | | 357 | Machine tools parts and accessories | 0.00 | 0.00 | 0.00 | | 358 | Office, computing and accounting machinery and parts | 30.33 | 0.27 | 0.00 | | 359 | Special purpose machinery and equipment /component/accessories | 54.69 | 2.11 | 0.07 | | 360 | Electrical industrial machinery | 21.09 | 0.84 | 0.04 | | 361 | Insulated wires and cables | 42.86 | 0.00 | 0.00 | | 362 | Primary cells and primary batteries | 100.00 | 19.18 | 0.00 | | 365+366 | Radio and TV apparatus | 19.79 | 6.26 | 4.89 | | 368 | Electronic valves and tubes | 19.79 | 6.26 | 4.89 | | 369 | X ray Machines and Electrical equipments nec | 19.79 | 6.26 | 4.89 | | 370 | Ship and boat building | 88.82 | 12.95 | 2.16 | | 371 | Locomotives and parts | 42.77 | 0.00 | 0.00 | | 372 | Railway/tramway wagons and coaches | 42.77 | 0.00 | 0.00 | | 377 | Aircraft, spacecraft and parts | 99.82 | 34.88 | 0.00 | | 379 | Transport and equipments and parts | 99.82 | 34.88 | 0.00 | | Consumer Goods Industries | | 200 | Slaughtering, preparation and preservation of meat | 92.12 | 54.92 | 6.79 | | 201 | Manufacture of dairy products | 92.12 | 54.92 | 6.79 | | 202 | Canning and preservation of fruits and vegetables | 92.12 | 54.92 | 6.79 | | 203 | Processing, canning and preservation of fish, crustacean | 92.12 | 54.92 | 6.79 | | 204 | Grain milling | 92.12 | 54.92 | 6.79 | | 205 | Manufacture of bakery products | 92.12 | 54.92 | 6.79 | | 206 | Manufacture and refining of sugar (vacuum pan sugar factories) | 29.63 | 0.70 | 0.00 | | 207 | Production of indigenous sugar, ‘Boora’, ‘Khandsari’, ‘Gur’ etc. | 29.63 | 0.70 | 0.00 | | 208 | manufacture of common salt | 92.12 | 54.92 | 6.79 | | 209 | Manufacture of cocoa products and sugar confectionery | 92.12 | 54.92 | 6.79 | | 210 | Manufacture of hydrogenated oil and vanaspati | 82.13 | 58.42 | 47.20 | | 211 | manufacture of Vegetable oils | 92.34 | 31.35 | 0.96 | | 212 | Manufacture of Animal oils | 92.34 | 31.35 | 0.95 | | 213 | Processing and blending of tea including instant tea | 82.83 | 74.48 | 0.00 | | 214 | Coffee curing, roasting and blending | 82.83 | 74.48 | 0.00 | | 215 | Manufacture of edible nuts | 92.12 | 54.81 | 6.79 | | 216 | Manufacture of ice | 93.83 | 55.60 | 6.10 | | 217 | Manufacture of prepared animal and bird fee | 93.83 | 55.60 | 6.10 | | 218 | Manufacture of Starch | 93.83 | 55.60 | 6.10 | | 219 | Manufacture of food products NEC | 93.83 | 55.60 | 6.10 | | 220 | Distilling rectifying and blending of spirits | 98.94 | 77.15 | 0.00 | | 221 | Manufacture of Wine | 98.94 | 77.15 | 0.00 | | 222 | Manufacture of Malt Liquors and Malt | 98.94 | 77.15 | 0.00 | | 223 | Manufacture of Country Liquors | 98.94 | 77.15 | 0.00 | | 224 | Manufacture of Soft drinks and Syrups | 98.94 | 77.15 | 0.00 | | 225 | Tobacco Stemming, redrying and other preparations | 100.00 | 72.03 | 0.00 | | 226 | Manufacture of bidi | 100.00 | 72.03 | 0.00 | | 227 | Manufacture of Cigars, cigarette, cheroots and c tobacco | 100.00 | 72.03 | 0.00 | | 228 | Manufacture of Snuff, Zarda etc | 100.00 | 72.03 | 0.00 | | 229 | Manufacture of Pan masala etc | 100.00 | 72.03 | 0.00 | | 232 | Weaving and finishing of cotton khadi | 78.77 | 55.58 | 0.00 | | 233 | Weaving and finishing of cotton textiles on handlooms | 92.83 | 55.58 | 0.00 | | 234 | Weaving and finishing of cotton textiles on power looms | 92.83 | 55.58 | 0.00 | | 236 | Bleaching, dyeing and pruning of cotton textiles | 92.83 | 55.58 | 0.00 | | 243 | Bleaching and dyeing of woolen textiles | 0.98 | 0.91 | 0.00 | | 246 | Bleaching and dyeing of silk textiles | 83.75 | 67.71 | 0.00 | | 260 | Manufacture of knitted or crocheted textile products | 92.95 | 60.77 | 0.07 | | 262 | Threads, Cordage, Ropes n Twines | 73.13 | 38.34 | 5.84 | | 263 | Blankets, shawls, carpets, and other similar textile products | 32.17 | 8.68 | 0.00 | | 265 | Textile garments and clothing accessories | 92.95 | 60.77 | 0.07 | | 267 | Made up textiles except apparel | 92.95 | 60.77 | 0.07 | | 268 | Water proof textile fabrics | 73.13 | 38.34 | 5.84 | | 269 | Textiles/ textile products n.e.c. | 73.13 | 38.34 | 5.84 | | 273 | Manufacture of wooden goods | 36.51 | 0.99 | 0.00 | | 274 | Manufacture of wooden industrial goods | 36.51 | 0.99 | 0.00 | | 275 | Manufacture of cork and cork products | 36.51 | 0.99 | 0.00 | | 276 | Manufacture of wooden furniture’s and fixtures | 85.52 | 35.57 | 0.00 | | 277 | Manufacture of bamboo and cane furniture and fixtures | 85.52 | 35.57 | 0.00 | | 279 | Manufacture of wood, cane, bamboo, reed and grass NEC | 85.52 | 35.57 | 0.00 | | 283 | Manufacture of special purpose newspaper-printed or not NEC | 63.64 | 36.65 | 28.87 | | 284 | Printing and publishing of newspaper | 52.29 | 18.07 | 30.02 | | 285 | Printing and publishing of periodicals, books, etc | 52.29 | 18.07 | 30.02 | | 286 | Printing of bank notes, currency etc | 52.29 | 18.07 | 30.02 | | 287 | Engraving , etching and block making | 52.29 | 18.07 | 30.02 | | 288 | Book binding on account of others | 52.29 | 18.07 | 30.02 | | 289 | Printing and allied activities NEC | 52.29 | 18.07 | 30.02 | | 291 | Footwear of leather | 29.23 | 10.18 | 0.00 | | 292 | Wearing apparel of leather + leather sub | 3.12 | 1.17 | 0.44 | | 293 | Leather products and substitutes | 3.12 | 1.17 | 0.44 | | 299 | Leather and fur product n.e. | 3.12 | 1.17 | 0.44 | | 304 | Drugs and medicines | 10.16 | 21.05 | 5.58 | | 305 | Perfumes, cosmetics and Lotions | 63.58 | 6.77 | 0.00 | | 311 | Rubber and Plastic Footwear | 39.93 | 19.72 | 1.87 | | 321 | Manufacture of glass and glass products | 30.60 | 2.13 | 0.00 | | 322 | Manufacture of earthen and plaster products | 30.60 | 2.13 | 0.00 | | 323 | Manufacture of non structural ceramic ware | 30.60 | 2.13 | 0.00 | | 342 | Furniture’s and fixtures of metals | 38.08 | 6.69 | 0.00 | | 346 | Metal Kitchen ware | 38.08 | 6.69 | 0.00 | | 355 | Manufacture of refrigerators, AC's | 55.75 | 23.24 | 0.00 | | 363+364 | Electric lamps, fans and Domestic Appliances | 100.00 | 29.48 | 0.00 | | 365+366 | Radio and TV apparatus | 19.79 | 6.26 | 4.89 | | 373+374 | Heavy motor vehicles; cars and parts | 21.15 | 6.38 | 0.00 | | 375 | Motor cycles, scooters and parts | 0.32 | 0.82 | 0.00 | | 376 | Bicycles, cycle rickshaws and parts | 0.00 | 0.12 | 0.00 | | Source: Author’s computation based on DGCIS database, and Customs Tariff Schedule, Government of India. |
| Table A 5: Import Penetration Ratios in Indian Industries: Use-Based Classification | | Code NIC | Three-Digit Classification Description | 1990-91 to 1996-97 | 1997-98 to 2002-03 | 2003-04 to 2009-10 | | Intermediate Goods Industries | | 235 | Cotton spinning ,weaving and processing in mills | 0.002 | 0.003 | 0.011 | | 242 | Wool spinning, weaving and finishing in mills | 0.075 | 0.024 | 0.021 | | 247 | spinning, weaving and processing of manmade textiles | 0.028 | 0.025 | 0.042 | | 248 | spinning, weaving and processing of artificial/synthetic textiles | 0.447 | 0.349 | 2.160 | | 254 | spinning, weaving and finishing of Jute and Mesta textiles | 0.004 | 0.014 | 0.037 | | 270 | Sawing and planing of wood | 0.086 | 0.058 | 0.073 | | 271 | Manufacture of veneer sheets | 0.013 | 0.012 | 0.016 | | 280 | Manufacture of pulp, paper and paper board | 0.130 | 0.147 | 0.191 | | 281 | Manufacture of container and boxes of paper | 0.467 | 0.372 | 0.461 | | 282 | Manufacture of paper and paper board NEC | 0.944 | 0.848 | 0.952 | | 290 | Tanning, curing, finishing of leather | 0.158 | 0.102 | 0.122 | | 300 | Industrial organic and inorganic chemical | 0.352 | 0.487 | 0.776 | | 301 | Fertilizers and pesticides | 0.118 | 0.151 | 0.329 | | 302+306 | Synthetic rubber Man-made Fibers | 0.204 | 0.172 | 0.385 | | 303 | Paints, varnishes and related products, | 0.010 | 0.017 | 0.045 | | 308 | Explosives and Fireworks | 0.749 | 1.213 | 1.589 | | 309 | Chemical Products NEC | 0.237 | 0.343 | 0.496 | | 310 | Tyre and tubes | 0.062 | 0.111 | 0.195 | | 313 | Plastic products n.e.c | 0.049 | 0.056 | 0.101 | | 314 | Refined petroleum product | 0.272 | 0.168 | 0.135 | | 318 | Coke-oven products | 0.143 | 0.501 | 0.430 | | 324 | manufacture of cement, lime and plasters | 0.000 | 0.000 | 0.003 | | 327 | Manufacture of asbestos cement and other cement products | 0.002 | 0.006 | 0.047 | | 330 | Iron and steel primary/semi finished forms | 0.125 | 0.111 | 0.166 | | 331 | Semi finished iron and steel products | 0.362 | 0.325 | 0.473 | | 332 | Ferro Alloys | 0.743 | 0.692 | 1.016 | | 333 | Copper manufacturing | 0.778 | 0.991 | 1.079 | | 335 | Aluminum manufacturing | 0.421 | 0.683 | 0.729 | | 336 | Zinc manufacturing | 0.865 | 0.985 | 1.072 | | 338+339 | Metal products and Non Ferrous metals | 0.971 | 1.008 | 1.099 | | 340 | Fabricated structural metal products | 0.026 | 0.676 | 0.748 | | 341 | Fabricated metal products, nec | 0.019 | 0.567 | 0.648 | | 343+349 | Hand-tools, weights etc | 0.038 | 0.081 | 0.114 | | Capital Goods Industries | | 350 | Agri machinery and equipments and parts thereof | 0.004 | 0.021 | 0.026 | | 351 | construction and mining industries | 0.589 | 1.157 | 1.202 | | 352 | Prime movers, boilers, steam generating plants nuclear reactors | 0.319 | 0.785 | 0.921 | | 353 | Industrial machinery for food and textile industry | 0.315 | 0.758 | 0.790 | | 354 | Industrial machinery other than food and textile | 0.434 | 1.008 | 1.099 | | 356 | General purpose Machinery | 0.485 | 1.075 | 1.242 | | 357 | Machine tools parts and accessories | 0.039 | 0.211 | 0.288 | | 358 | Office, computing and accounting machinery and parts | 1.213 | 1.066 | 1.038 | | 359 | Special purpose machinery and equipment /component/accessories | 0.850 | 1.290 | 1.442 | | 360 | Electrical industrial machinery | 0.056 | 0.113 | 0.178 | | 361 | Insulated wires and cables | 0.023 | 0.046 | 0.096 | | 362 | Primary cells and primary batteries | 0.026 | 0.065 | 0.141 | | 365+366 | Radio and TV apparatus | 0.182 | 0.311 | 0.457 | | 368 | Electronic valves and tubes | 0.735 | 0.669 | 0.778 | | 369 | X ray Machines and Electrical equipments nec | 1.231 | 1.028 | 0.947 | | 370 | Ship and boat building | 0.273 | 0.444 | 1.061 | | 371 | Locomotives and parts | 0.094 | 0.242 | 0.514 | | 372 | Railway/tramway wagons and coaches | 0.039 | 0.057 | 0.157 | | 379 | Transport and equipments and parts | 0.009 | 0.008 | 0.014 | | Consumer Goods Industries | | 201 | Manufacture of dairy products | 0.062 | 0.037 | 0.060 | | 204 | Grain milling | 0.028 | 0.019 | 0.015 | | 206 | Manufacture and refining of sugar (vacuum pan sugar factories) | 0.015 | 0.014 | 0.020 | | 210 | Manufacture of hydrogenated oil and vanaspati | 0.004 | 0.007 | 0.016 | | 211 | Manufacture of Vegetable oils | 0.044 | 0.125 | 0.122 | | 213 | Processing and blending of tea including instant tea | 0.001 | 0.004 | 0.012 | | 220 | Distilling rectifying and blending of spirits | 0.007 | 0.010 | 0.070 | | 221 | Manufacture of Wine | 0.055 | 0.080 | 0.400 | | 222 | manufacture of Malt Liquors and Malt | 0.010 | 0.017 | 0.116 | | 223 | Manufacture of Country Liquors | 0.032 | 0.056 | 0.312 | | 224 | Manufacture of Soft drinks and Syrups | 0.015 | 0.012 | 0.081 | | 225 | Tobacco Stemming, redrying and other preparations | 0.003 | 0.004 | 0.017 | | 226 | manufacture of bidi | 0.001 | 0.002 | 0.008 | | 227 | Manufacture of Cigars, cigarette, cheerots and c tobacco | 0.002 | 0.002 | 0.007 | | 228 | Manufacture of Snuff, Zarda etc | 0.007 | 0.006 | 0.027 | | 229 | Manufacture of Pan masala etc | 0.006 | 0.005 | 0.026 | | 263 | Blankets, shawls, carpets, and other similar textile products | 0.105 | 0.029 | 0.021 | | 276 | Manufacture of wooden furniture’s and fixtures | 0.006 | 0.019 | 0.108 | | 279 | Manufacture of wood, cane, bamboo, reed and grass NEC | 0.024 | 0.030 | 0.126 | | 283 | Manufacture of special purpose newspaper-printed or not NEC | 0.939 | 0.964 | 1.057 | | 284 | Printing and publishing of newspaper | 0.067 | 0.109 | 0.222 | | 285 | Printing and publishing of periodicals, books, etc | 0.139 | 0.254 | 0.492 | | 286 | Printing of bank notes, currency etc | 0.783 | 1.007 | 1.127 | | 287 | Engraving , etching and block making | 1.359 | 1.588 | 2.017 | | 288 | Book binding on account of others | 1.110 | 1.189 | 1.355 | | 289 | Printing and allied activities NEC | 0.114 | 0.140 | 0.158 | | 291 | Footwear of leather | 0.022 | 0.009 | 0.021 | | 304 | Drugs and medicines | 0.100 | 0.131 | 0.319 | | 305 | Perfumes, cosmetics and Lotions | 0.035 | 0.077 | 0.121 | | 321 | Manufacture of glass and glass products | 0.039 | 0.037 | 0.099 | | 323 | Manufacture of non structural ceramic ware | 0.116 | 0.111 | 0.213 | | 342 | Furniture’s and fixtures of metals | 0.801 | 0.163 | 0.140 | | 346 | Metal Kitchen ware | 0.292 | 0.487 | 0.695 | | 355 | Manufacture of refrigerators, AC's | 0.133 | 0.217 | 0.439 | | 363+364 | Electric lamps, fans and Domestic Appliances | 0.118 | 0.247 | 0.455 | | 365+366 | Radio and TV apparatus | 0.182 | 0.311 | 0.457 | | 373+374 | Heavy motor vehicles; cars and parts | 0.041 | 0.052 | 0.080 | | 375 | Motor cycles, scooters and parts | 0.013 | 0.011 | 0.022 | | 376 | Bicycles, cycle rickshaws and parts | 0.029 | 0.022 | 0.049 | | Source: Author’s computation based on DGCIS database, and Customs Tariff Schedule, Government of India. |
| Table A 6: Nominal Rate of Protection, Frequency Ratio and Import Penetration Ratios | | NIC-1998 | Nominal Rates of Protection (%) | Frequency Ratio (%) | Import Penetration Ratios | | P1 | P2 | P3 | P1 | P2 | P3 | P1 | P2 | P3 | | 20 | 97.908 | 32.736 | 38.100 | 78.848 | 39.408 | 7.568 | 0.035 | 0.023 | 0.032 | | 21 | 106.771 | 38.299 | 54.493 | 92.071 | 48.293 | 8.646 | 0.016 | 0.045 | 0.050 | | 22 | 160.215 | 66.080 | 40.490 | 96.030 | 65.740 | 0.000 | 0.014 | 0.019 | 0.106 | | 23 | 75.460 | 34.380 | 14.970 | 44.523 | 31.570 | 0.000 | 0.002 | 0.003 | 0.011 | | 24 | 93.067 | 33.038 | 14.591 | 45.858 | 27.979 | 1.347 | 0.183 | 0.133 | 0.741 | | 25 | 106.429 | 38.575 | 15.530 | 66.520 | 42.710 | 0.000 | 0.004 | 0.014 | 0.037 | | 26 | 90.241 | 38.470 | 15.350 | 77.309 | 43.674 | 1.290 | 0.105 | 0.029 | 0.021 | | 27 | 95.743 | 34.837 | 15.450 | 63.415 | 17.023 | 0.000 | 0.032 | 0.030 | 0.081 | | 28 | 79.298 | 24.516 | 12.728 | 58.156 | 19.662 | 3.462 | 0.605 | 0.662 | 0.803 | | 29 | 81.802 | 33.864 | 14.890 | 42.320 | 19.320 | 7.144 | 0.090 | 0.056 | 0.072 | | 30 | 82.908 | 35.370 | 14.969 | 43.811 | 13.543 | 5.035 | 0.226 | 0.324 | 0.508 | | 31 | 77.526 | 33.931 | 14.330 | 55.867 | 18.504 | 5.544 | 0.132 | 0.209 | 0.215 | | 32 | 103.388 | 36.650 | 15.193 | 81.254 | 31.250 | 0.000 | 0.039 | 0.039 | 0.091 | | 33 | 71.197 | 33.220 | 12.530 | 28.197 | 12.896 | 8.746 | 0.609 | 0.685 | 0.805 | | 34 | 83.538 | 36.490 | 15.590 | 55.224 | 17.028 | 0.000 | 0.235 | 0.395 | 0.469 | | 35 | 58.051 | 29.396 | 13.300 | 39.127 | 11.822 | 2.494 | 0.438 | 0.759 | 0.849 | | 36 | 77.064 | 32.444 | 11.501 | 59.376 | 17.901 | 2.740 | 0.319 | 0.349 | 0.439 | | 37 | 68.686 | 38.029 | 19.913 | 53.583 | 25.535 | 2.230 | 0.071 | 0.119 | 0.271 | Source: Author’s computation based on Appendix Tables A1, A3 and A5
Note: For description of industry codes, see Table A7. P1 is the time period from 1990-91 to 1996-97, P2 refers to the period from 1997-98 to 2002-03 and P3 covers the period 2003-04 to 2009-10. |
| Table A 7: Description of Industry Codes: NIC-1998 Two Digit Industries | | NIC- 98 | Industry Descriptions | | 15 | Manufactures of Food Products and Beverages | | 16 | Manufactures of Tobacco Products | | 17 | Manufactures of Textiles | | 18 | Manufactures of Wearing Apparel; Dressing And Dyeing of Fur | | 19 | Tanning And Dressing of Leather; Manufacture of Luggage, Handbags, Saddlery, Harness And Footwear | | 20 | Manufactures of Wood and of Products of Wood and Cork, Except Furniture; Manufacture of Articles of Straw and Plaiting Materials | | 21 | Manufactures of Paper and Paper Products | | 22 | Publishing, Printing and Reproduction of Recorded Media | | 23 | Manufactures of Coke, Refined Petroleum Products and Nuclear Fuel | | 24 | Manufactures of Chemicals and Chemical Products | | 25 | Manufactures of Rubber and Plastics Products | | 26 | Manufactures of Other Non-Metallic Mineral Products | | 27 | Manufacture of Basic Metals | | 28 | Manufacture of Fabricated Metal Products, Except Machinery And Equipment | | 29 | Manufacture of Machinery And Equipment n.e.c | | 30 | Manufacture of Office, Accounting and Computing Machinery | | 31 | Manufacture of electrical machinery and apparatus n.e.c. | | 32 | Manufacture of Radio, Television and Communication Equipment and Apparatus | | 33 | Manufacture of Medical, Precision and Optical Instruments, Watches and Clocks | | 34 | Manufacture of Motor Vehicles, Trailers and Semi-Trailers | | 35 | Manufacture of Other Transport Equipment | | 36 | Manufacture of furniture; manufacturing n.e.c. | | 37 | Recycling | | Source: Annual Survey of Industries, Central Statistical Organisation, Government of India |
| Table A 8: TFP Estimates for 43 Organized Manufacturing Sub-sectors - 1990-91 to 2009-10 | | NIC 2004 | Industry Description | Classification | GVA Share | TFPG | | 151 | Production, processing and preserving of meat, fish, fruits, veg., oils and fats | Consumer | 1.46 | 1.14 | | 152 | Manufacture of dairy product | Consumer | 1.32 | -0.22 | | 153 | Manufacture of grain mills products, starches and starch products and prepared animal feeds | Consumer | 1.44 | 0.22 | | 154 | Manufacture of other food products | Consumer | 5.01 | -0.69 | | 155 | Manufacture of beverages | Consumer | 1.26 | -0.41 | | 160 | Manufacture of tobacco products | Consumer | 2.37 | -1.39 | | 171 | Spinning, weaving and finishing of textiles | Consumer | 8.02 | 2.06 | | 173 | Manufacture of knitted and crocheted fabrics and articles | Consumer | 0.77 | -2.59 | | 181 | Manufacturing of wearing apparel, except for fur apparel | Consumer | 2.02 | 0.65 | | 182 | Dressing and dyeing of fur, manufacture of articles of fur | Consumer | 0.01 | 2.98 | | 191 | Tanning and dressing of leather, manufacture of luggage hand bags, saddlery & harness | Consumer | 0.24 | -0.16 | | 192 | Manufacture of footwear | Consumer | 0.53 | 0.29 | | 201 | Saw milling and planing of wood | Intermediate | 0.03 | -3.29 | | 202 | Manufacture of products of wood, cork, straw and plaiting materials | Intermediate | 0.19 | -1.96 | | 210 | Manufacture of paper and paper product | Consumer | 2.56 | 1.75 | | 221 | Publishing | Consumer | 0.92 | -3.06 | | 222 | Printing and service activities related to printing | Consumer | 0.60 | -2.22 | | 231 | Manufacture of coke oven products | Intermediate | 0.18 | -2.45 | | 232 | Manufactured refined petroleum products | Intermediate | 4.70 | -1.02 | | 241 | Manufacture of basic chemicals | Intermediate | 10.86 | 0.45 | | 242 | Manufacture of other chemical products | Intermediate | 8.80 | -0.34 | | 251 | Manufacture of rubber products | Consumer | 1.64 | 1.88 | | 252 | Manufacture of plastic products | Consumer | 1.66 | 1.74 | | 261 | Manufacture of glass and glass products | Consumer | 0.54 | 1.98 | | 269 | Manufacture of non-metallic mineral products n.e.c | Intermediate | 4.99 | 0.52 | | 271 | Manufacture of basic iron and steel | Intermediate | 7.12 | 0.89 | | 272 | Manufacture of basic precious and non-ferrous metals | Intermediate | 2.42 | 1.02 | | 281 | Manufacture of structural metal products, tanks, reservoirs and steam generators | Intermediate | 0.89 | 1.65 | | 289 | Manufacture of other fabricated metal products, metal working service activities | Intermediate | 1.77 | 1.11 | | 291 | Manufacture of general purpose machinery | Capital | 2.90 | 1.85 | | 292 | Manufacture of special purpose machinery | Capital | 2.68 | 0.34 | | 293 | Manufacture of domestic appliances, n.e.c | Consumer | 0.59 | 2.49 | | 300 | Manufacture of office, accounting and computer machinery | Capital | 0.52 | 9.54 | | 311 | Manufacture of electric motors, generators and transformers | Capital | 1.10 | 0.82 | | 312 | Manufacture of electricity distribution and control apparatus | Capital | 0.68 | 2.08 | | 313 | Manufacture of insulated wire and cable | Capital | 0.73 | 0.91 | | 314 | Manufacture of accumulators, primary cells and primary batteries | Capital | 0.40 | 2.11 | | 321 | Manufacture of electronic valves and tubes and other electronic components | Capital | 0.88 | 4.27 | | 323 | Manufacture of TV and radio receivers, sound or video recording or reproducing apparatus, and associated goods | Capital | 0.88 | 5.63 | | 341 | Manufacture of motor vehicles | Consumer | 1.94 | 1.36 | | 352 | Manufacture of railway and tramway locomotives and rollick stock | Capital | 0.19 | 4.05 | | 359 | Manufacture of transport equipment n.e.c. | Capital | 1.79 | 1.81 | | 361 | Manufacture of furniture | Consumer | 0.26 | 4.46 | | | Aggregate Manufacturing (43 sectors) | | 89.87 | 0.98 | Note:
1. Aggregate Manufacturing comprises the 43 subgroups included in the sample.
2. Average indicates simple average of 43 sub-groups
3. GVA shares are for 200-01
Source: Annual Survey of Industries and P C Das (2012) |
| Table A 9: TFP Estimates for Organized Manufacturing Sub-sectors - 1990-91 to 2009-10 | | NIC 2004 | Industry Description | GVA Share | TFPG | | 151 | Production, processing and preserving of meat, fish, fruits, veg., oils and fats | 1.46 | 1.14 | | 152 | Manufacture of dairy product | 1.32 | -0.22 | | 153 | Manufacture of grain mills products, starches and starch products and prepared animal feeds | 1.44 | 0.22 | | 154 | Manufacture of other food products | 5.01 | -0.69 | | 155 | Manufacture of beverages | 1.26 | -0.41 | | 160 | Manufacture of tobacco products | 2.37 | -1.39 | | 171 | Spinning, weaving and finishing of textiles | 8.02 | 2.06 | | 172 | Manufacture of other textiles | 0.77 | 2.84 | | 173 | Manufacture of knitted and crocheted fabrics and articles | 0.77 | -2.59 | | 181 | Manufacturing of wearing apparel, except for fur apparel | 2.02 | 0.65 | | 182 | Dressing and dyeing of fur, manufacture of articles of fur | 0.01 | 2.98 | | 191 | Tanning and dressing of leather, manufacture of luggage hand bags, saddlery & harness | 0.24 | -0.16 | | 192 | Manufacture of footwear | 0.53 | 0.29 | | 201 | Saw milling and planing of wood | 0.03 | -3.29 | | 202 | Manufacture of products of wood, cork, straw and plaiting materials | 0.19 | -1.96 | | 210 | Manufacture of paper and paper product | 2.56 | 1.75 | | 221 | Publishing | 0.92 | -3.06 | | 222 | Printing and service activities related to printing | 0.60 | -2.22 | | 231 | Manufacture of coke oven products | 0.18 | -2.45 | | 232 | Manufactured refined petroleum products | 4.70 | -1.02 | | 241 | Manufacture of basic chemicals | 10.86 | 0.45 | | 242 | Manufacture of other chemical products | 8.80 | -0.34 | | 251 | Manufacture of rubber products | 1.64 | 1.88 | | 252 | Manufacture of plastic products | 1.66 | 1.74 | | 261 | Manufacture of glass and glass products | 0.54 | 1.98 | | 269 | Manufacture of non-metallic mineral products n.e.c | 4.99 | 0.52 | | 271 | Manufacture of basic iron and steel | 7.12 | 0.89 | | 272 | Manufacture of basic precious and non-ferrous metals | 2.42 | 1.02 | | 281 | Manufacture of structural metal products, tanks, reservoirs and steam generators | 0.89 | 1.65 | | 289 | Manufacture of other fabricated metal products, metal working service activities | 1.77 | 1.11 | | 291 | Manufacture of general purpose machinery | 2.90 | 1.85 | | 292 | Manufacture of special purpose machinery | 2.68 | 0.34 | | 293 | Manufacture of domestic appliances, n.e.c | 0.59 | 2.49 | | 300 | Manufacture of office, accounting and computer machinery | 0.52 | 9.54 | | 311 | Manufacture of electric motors, generators and transformers | 1.10 | 0.82 | | 312 | Manufacture of electricity distribution and control apparatus | 0.68 | 2.08 | | 313 | Manufacture of insulated wire and cable | 0.73 | 0.91 | | 314 | Manufacture of accumulators, primary cells and primary batteries | 0.40 | 2.11 | | 321 | Manufacture of electronic valves and tubes and other electronic components | 0.88 | 4.27 | | 323 | Manufacture of TV and radio receivers, sound or video recording or reproducing apparatus, and associated goods | 0.88 | 5.63 | | 331 | Manufacture of medical appliances and instruments and appliances for measuring, checking, testing, navigating and other purposes except optical instruments | 0.58 | 1.44 | | 332 | Manufacture of optical instruments and photographic equipment | 0.10 | -0.07 | | 333 | Manufacture of watches and clocks | 0.22 | 4.24 | | 341 | Manufacture of motor vehicles | 1.94 | 1.36 | | 342 | Manufacture of bodies for motor vehicles, trailer and semi-trailers | 0.06 | 1.64 | | 351 | Building and repair of ships and boats | 0.15 | 2.99 | | 352 | Manufacture of railway and tramway locomotives and rollick stock | 0.19 | 4.05 | | 353 | Manufacture of air craft and space craft | 0.04 | 0.33 | | 359 | Manufacture of transport equipment n.e.c. | 1.79 | 1.81 | | 361 | Manufacture of furniture | 0.26 | 4.46 | | 369 | Manufacturing n.e.c | 0.97 | 0.22 | | | All Manufacturing | 92.74 | 1.09 | Note:
1. Aggregate Manufacturing comprises the 43 subgroups included in the sample.
2. Average indicates simple average of 43 sub-groups
3. GVA shares are for 200-01
Source: Annual Survey of Industries and P C Das (2012) |
| Table A 10: TFP Estimates by Industry Groups: NIC-1998 Two Digit Organized Manufacturing Industries and India KLEMS Broad Manufacturing Groups | | Industries | Total Manufacturing (KLEMS Study) | Organized Manufacturing (RBI Study) | | 1990-91 to 1999-00 | 2000-01 to 2009-10 | 1990-91 to 2009-10 | 1990-91 to 1999-00 | 2000-01 to 2009-10 | 1990-91 to 2009-10 | | Food Products, Beverages and Tobacco | -0.48 | -0.07 | -0.26 | -0.35 | -0.12 | -0.23 | | Textiles & Leather Products | 0.19 | 1.43 | 0.84 | 1.23 | 0.54 | 0.87 | | Wood and Products of wood | -8.60 | -1.66 | -4.95 | -6.77 | 1.10 | -2.63 | | Pulp, Paper, Paper products, printing and publishing | -0.87 | 0.31 | -0.25 | -2.18 | -0.27 | -1.18 | | Coke, Refined Petroleum products and Nuclear fuel | -2.25 | -0.60 | -1.38 | -0.88 | -2.51 | -1.74 | | Chemicals and Chemical Products | -1.38 | 1.89 | 0.34 | -1.34 | 1.31 | 0.06 | | Rubber and Plastic Products | -0.21 | 1.42 | 0.65 | 1.67 | 1.93 | 1.81 | | Other Non-Metallic Mineral Products | 0.00 | -0.26 | -0.14 | 0.46 | 1.96 | 1.25 | | Basic Metals and Fabricated Metal Products | 0.53 | -1.01 | -0.28 | 2.13 | 0.30 | 1.17 | | Machinery, n.e.c. | -0.15 | 1.06 | 0.48 | 1.29 | 1.80 | 1.56 | | Electrical and Optical Equipments | -0.23 | 2.20 | 1.05 | 3.95 | 2.33 | 3.10 | | Transport Equipment | 0.44 | 0.76 | 0.61 | 3.39 | 0.80 | 2.03 | | Manufacturing, n.e.c | 1.35 | -0.77 | 0.24 | 4.51 | 0.39 | 2.34 | Note:
1. KLEMS manufacturing covered both organized and unorganized manufacturing and NIC 1998 covers organized manufacturing
2. NIC 1998 organized manufacturing industry groups have been mapped to broad KLEMS manufacturing industry groups.
3. Growth rates are average of annual growth rates. For organized manufacturing we use average of three digit industries to get estimates for above specifying industries
Source: Total manufacturing growth rates are estimated using KLEMS data base (www.rbi.org). Organized manufacturing growth rates are taken from Pilu Chandra Das. (2012), Total factor Productivity in Indian Organized Manufacturing Sector- The Story of the Noughties, Unpublished M.Phil. Dissertation, Delhi School of Economics |
References Ahluwalia, Montek S. 2000. ';India's Economic Reforms: An Appraisal,'; in India in the Era of Economic Reforms. Jeffrey Sachs and Nirupam Bajpa, eds. New Delhi: Oxford University Press, pp. 26-80. Aksoy, A. (1991), ‘The Indian Trade Regime’, Policy Research Working Paper # 989, The World Bank, Washington DC. Aksoy. A. and F.M. Ettori (1992), ‘Protection and Industrial Structure in India’ Policy Research Working Paper # 990, The World Bank, Washington DC. Alexander, P.C. (1977), Report on the Committee on Import-Export Policies and Procedures, Ministry of Commerce, Government of India. Balassa, B. (1965), ‘Tariff Protection in Industrial Countries: An Evaluation’, Journal of Political Economy, 73,573-94. Balassa, B. (1982), ‘Development Strategies and Economic Performance’ in Development Strategies in Semi-industrialization Economies, Oxford University Press, London. Balassa, B. (1985), ‘Exports, Policy Choices and Economic Growth in Developing Countries after the1973 Oil Shock,’ Journal of Development Economics, 18(2), May/June, 23-35. Baltagi, B.H.(1988), ‘An Alternative Heteroscedastic Error Components Model, Problem 88.2.2,’Econometric Theory, 4, 349-350. Baltagi, Badi H & Griffin, James M, 1988. ';A General Index of Technical Change,'; Journal of Political Economy, University of Chicago Press, vol. 96(1), pages 20-41, February. Banga R and A Das (2010), “Role of trade policies in growth of Indian manufacturing sector; Centre for WTO studies, UNCTAD, New Delhi Bhagwati J and T N Srinivasan (1978), Foreign Trade Regimes and Economic Development: India, NBER, New York. Breusch, T S & Pagan, A R, (1980). ';The Lagrange Multiplier Test and Its Applications to Model Specification in Econometrics,'; Review of Economic Studies, Wiley Blackwell, vol. 47(1), pages 239-53, January. Cavallo, D.(1991), ‘Argentina: Trade Reform,1976-82’ in Shepard, G.and C.G. Langoni (eds) Trade Reform: Lessons from Eighteen Countries, ICS Press for International Center for Economic Growth, San Francisco. Choudhury (2010), Trade Reforms and Performance in Indian Manufacturing: An analysis of the impact of the trade reforms on aspects of economic performance of the organized manufacturing sector, Lambert Academic Publishing, 2010. Choudhury (2012), Essays on the Changing Inter-Industry Wage Structure in India, Unpublished PhD Thesis, Department of Economics, Dundee University, UK, March 2012. Corbo, V. and J. Demelo (1987), ‘Lessons from the Southern Cone Policy Reforms,’ The World Bank Research Observer, Vol.2, No.2, 111-142. Cordon, W.M. (1966), ‘The Structure of a Tariff System and the Effective Protection Rate’ Journal of Political Economy, 74, 221-231. Das, D. K. (2001), Some Aspects of Productivity Growth and trade in Indian Industry, unpublished Ph.D dissertation, Delhi school of Economics, Delhi Das, D. K. (2003), “Quantifying Trade Barriers: Has Protection Declined Substantially in Indian Manufacturing’, ICRIER Working Paper 105, Indian Council for Research on International Economic Relations (ICRIER), New Delhi Das D.K (2006). ‘Improving Industrial Productivity: Does Trade Liberalisation Matter? Evidence from Indian Capital and Intermediate Goods Sectors’, in S. Tendulkar, A. Mitra, K. Narayanan, and D.K. Das (ed.), India: Industrialization in a Reforming Economy: Essays for K.L. Krishna, Academic Foundation, New Delhi, 2006, 321–48. Das D K et al (2014), ‘Labour Regulations in India: Exploring The Contract Labour Act (1970) and implication for Formal Manufacturing Employment’ ICRIER working paper, forthcoming Dollar, D. (1992), ‘Outward-Oriented Developing Economies Really Do Grow More Rapidly: Evidence from 95 LDCs, 1976-85’, Economic Development and Cultural Change, 40, 523-544. Deardorff, A. (1987), ‘Why do Governments Prefer Non-tariff Barrier?’, Carnegie- Rochester Conference Series on Public Policy, 26, 191-216. Deardorff, A. and R. Stern (1999), Measurement of Non-tariff Barriers, University of Michigan Press, Ann Arbor. Dutz, A.M.(1996), ‘Oligopolistic Firms’s Adjustment to Quota Liberalisation: Theory and Evidence’, in Roberts, M. and J.R.Tybout (ed.) Industrial Evolutions in Developing Countries: Micro Patterns of Turnover, Productivity and Market Structure, Oxford University Press for the World Bank. Edwards, S. (1992), ‘Trade Orientation, Distortions and Growth in Developing Countries,’Journal of Development Economics, 39, 31-37. Gang, I. and M.Pandey (1998), ‘What was Protected? Measuring India’s Tariff Barriers 1968-1997,’Indian Economic Review, Vol. xxxiii, No.2, 119-152. Goldar (2014), “Productivity in Indian Manufacturing in the Post Reform Period’. In Kathuria V et al (ed.), Productivity in Indian Manufacturing- Measurements, Methods and Analysis, Routledge, India. Goldar B N and A Kumari (2003), ‘Import Liberalization and Productivity Growth in Indian Manufacturing Industries in the 1990s’, The Developing Economies, 41(4), 2003, 436–60. Goldar, B.N., A.V.L.Narayana and S.N.Hashem (1992), ‘Structure of Nominal Tariff Rates in India’, Studies in Industrial Development, Office of the Economic Advisor, Ministry of Industry, Government of India. Goldar, B.N. and V.S. Renganathan (1990), ‘Economic Reforms and R&D Expenditure in Industrial Firms in India,’ Indian Economic Review, Vol.46, No.2, 60-75. Goldar, B.N. and S.N.Hashem (1992), ‘India’s Tariff Structure: Effective Rates of Protection of Indian Industries,’ Studies in Industrial Development, Office of the Economic Advisor, Ministry of Industry, Government of India. Goldar, B.N. and S.N.Hashem (1994), ‘Study of India’s Tariff Structure: Effect of Tariff Protection on Domestic Industries,’ Studies in Industrial Development, Office of the Economic Advisor, Ministry of Industry, Government of India. Greenway, D. (1988), ‘Evaluating the Structure of Production in Less Developed Countries in D.Greenway (ed.) Economic Development and International Trade, Macmillan, London. Greenway, D. and C. Milner (1993), Trade and Industrial Policy in Developing Countries- A Manual for Policy Analysis, Macmillan, London. Griffiths, W. E and J.R. Anderson (1982), ‘Using a Time Series of Cross-Section Data to Estimate a Production Function with Positive and Negative Marginal Risks’, Journal of the American Statistical Association, 77,529-536. Grossman, G. and E. Helpman (1991), ‘Trade Knowledge Spillovers and Growth,’ European Economic Review, 35, 517-526. Gruebel, H. (1971), ‘Effective Tariff Protection: A Non-Specialist Guide to the Theory, Policy Implications and Controversies’, in Gruebel, H. and H. Johnson, Effective Tariff Protection, GATT, Geneva. Hachette, D.(1991), ‘Chile: Trade Liberalization Since 1974’ in Shepard, G. and C.G. Langoni (eds) Trade Reform: Lessons from Eighteen Countries, ICS Press for International Center for Economic Growth, San Francisco. Hashem, S.N. (2001), Protection in Indian Manufacturing: An Empirical Study, Macmillan India Ltd, Delhi. Havyrlyshyn, O. (1990), ‘Trade Policy and Productivity Gains in Developing Countries: A Survey of Literature,’ The World Bank Research Observer, 5(1), 1-24. Helleiner.G.K.(ed.)(1994), Trade Policy and Industrialization in Turbulent Times, Routledge, London and New York. Hoda A and D Rai (2014),’ Trade and Investment Barriers affecting International Production networks in India’. ICRIER working paper 281, New Delhi Hussain, Abid (1984), Report of the Committee on Trade Policies, Ministry of Commerce, Government of India. Johnson, H.G. (1960), ‘The Costs of Protection and Scientific Tariff,’ Journal of Political Economy, 68,327-345. Kathuria V et al (ed.) (2014),” Productivity in Indian Manufacturing- Measurements, Methods and Analysis, Routledge, India. Measurement Kotwal, A., B Ramaswami and W.Wadhwa (2011) ';Economic Liberalization and Indian Economic Growth: What's the Evidence?,'; Journal of Economic Literature, American Economic Association, vol. 49(4), pages 1152-99, December. Kowalski and Dihel (2009). ';India's Trade Integration, Realising the Potential,'; OECD Trade Policy Papers 88, OECD Publishing. Krishna, P. and D. Mitra (1998), ‘Trade Liberalization, Market Discipline and Productivity Growth: New Evidence from India’, Journal of Development Economics, 56, 447-62. Krueger, A. O. (1981), ‘Interactions between Inflation and Trade Objectives in Stabilization Programs ‘in Cline, W. and S. Weintraub (ed), Economic Stabilization in Developing Countries, Brookings Institution, Washington D Krueger, A.O. (1984), ‘Trade Policies in Developing Countries’ in Jones, R.W and P.B.Kennen (ed.) Handbook of International Economics, Vol-1, Elsevier Science Publishers. Mazodier, P. and A.Trognon (1978), ‘Heteroskedasticty and Stratification in Error Components Models,’ Annales de I Insee, 30-31, 451-482. Meade, J. (1951), The Theory of Commercial Policy, Vol-1: The Balance of Payments, Oxford University Press, Oxford. Mehta, R. (1997), ‘Trade Policy Reforms, 1991-92 to 1995-96: Their Impact on External Trade’, Economic and Political Weekly, April 12, 779-784. Mehta, R. and S.K Mohanty (1999), WTO and Industrial Tariffs: An Empirical Analysis for India, Research and Information System for the Non-Aligned and Other Developing Countries, Delhi. Mishra, P. and U. Kumar (2008), Trade liberalisation and wage inequality: evidence from India, Review of Development Economics, Volume 12, Issue 2, May 2008, Pages 291 – 311. Mitra, D. and B.P. Ural (2008) ‘Indian Manufacturing: A Slow Sector in a Rapidly Growing Economy’, Journal of International Trade and Economic Development, 17(4), 525–59. Nambiar, R.G. (1983), ‘Protection to Domestic Industry: Fact and Theory,’ Economic and Political Weekly, 1-8 January, 27-32. Narasimham, M. (1984) Report of the Committee to Examine the Principles of a Possible Shift from Physical to Financial Controls, Government of India. Nishimizu, M. and S. Robinson (1986), ‘Productivity and Growth in Manufacturing’ in Chenery,H., S. Robinson and M.Syrquin (ed.) Industrialization and Growth: A Comparative Study, Oxford University Press, New York. Nishimizu,M. and J.M. Page Jr (1991), ‘Trade Policy, Market Orientation and Productivity Change in Industry’, in DeMelo, J and A. Sapir (ed.) Trade Theory and Economic Reforms, Basil-Blackwell. Pack, H. (1988), ‘Industrialization and Trade’ in Chenery, H. and T.N. Srinivasan (ed), Handbook of Development Economics, Amsterdam, North Holland. Panagariya, A. (2004), India in the 1980s and 1990s: A Triumph of Reforms, IMF Working Paper No. WP/04/03, March Panchmukhi,V.R. (1978), Trade Policies of India: A Quantitative Assessment Concepts Publishing house, New Delhi. Pandey,M. (1999) Trade Liberalization: Non-tariff Barriers in India, Report Submitted to the Ministry of Finance, Government of India. Pursell, G. (1988), ‘Trade Policies and Protection in India’, The World Bank, Washington DC, August. Randolf, W.C. (1988), ‘A Transformation for Heterescedastic Error Component Regression Models’, Economic Letters, 27, 349-354. Rao, N. (1985), Exchange Rate and Commercial Policy in a Controlled Trade Regime: A Case Study of India, Ph.D Dissertation, Oxford University. Rodrik, D. and A. Subramanian (2005), From “Hindu Growth” to Productivity Surge: The Mystery of the Indian Growth Transition, IMF Staff Papers, Volume 52, Number 2, IMF. Roberts, M. and J.R.Tybout (1991), ‘Size Rationalization and Trade Exposure in Developing Countries, in Baldwin (ed.) Empirical Studies of Commercial Policy, University of Chicago Press for NBER. Rodrik, D. (1995), ‘Trade and Industrial Policy Reform’ in Behrman,J and T.N.Srinivasan (ed.) Handbook of Development Economics, Volume-3, Elesvier Science B.V. Romer, P. (1994), ‘New Goods, Old Theory and The Welfare Costs of Trade Restrictions,’ Journal of Development Economics, 43, 5-38. Sen, K. (2009), Trade Policy, Inequality and Performance in Indian Manufacturing, Routledge, Taylor & Francis Group, 2009 Sharma, G. (2006b), Competing or collaborating siblings? Industrial and trade policies in India, Department of Economics Working Paper 06–10, University of Missouri, Columbia. Sivadasan, J. (2006), ‘Productivity Consequences of Product Market Liberalisation: Micro-evidence from Indian Manufacturing Sector Reforms’, Working paper no. 1062, Stephen M. Ross School of Business, University of Michigan, Sivadasan, J. (2009), ‘Barriers to Competition and Productivity: Evidence from India’, The B.E. Journal of Economic Analysis & Policy (electronic journal), 9(1), Article no. 42, 1–62. Srinivasan, T.N. (1993) Agriculture and Trade in China and India- Policies and Performance since 1950, ICEG- California Topalova, P (2004), ‘Trade Liberalisation and Firm Productivity: the Case of India’, IMF Working Paper no. WP/04/28, Washington DC, IMF, 2004. Topalova, P. and A. Khandelwal (2011), ‘Trade Liberalisation and Firm Productivity: the Case of India’, Review of Economics and Statistics, 93(3), 2011, 995–1009. Trivedi, P, A Prakash and D Sinate (2000), “Productivity in Major Manufacturing Industries in India: 1973-74 to 1997-98”, Development Research Group Study, No 20, Department of Economic Analysis and Policy, Reserve Bank of India, Mumbai. Trivedi, Pushpa, et al (2011). ';Productivity, Efficiency, and Competitiveness of the Indian Manufacturing Sector.'; DRG Study No. 37, Reserve Bank of India. Tybout, J.R. (1992), ‘Linking Trade and Productivity: New Research Directions,’ The World Bank Economic Review, 6(2), 189-211. Tybout, J.R. (2000), ‘Manufacturing Firms in Developing Countries: How Well Do They Do, and Why?’, Journal of Economic Literature, Vol. XXXVIII, 11-44. Tybout, J.R. and M.D. Westbrook (1995), ‘Trade Liberalization and the Dimension of Efficiency Changes in Mexican Manufacturing Industries,’ Journal of Development Economics, 39, 53-78. Wansbeek, T.J. (1989), ‘An Alternative Heteroscedastic Error Components Model, Solution 88 1.1’, Econometric Theory, 5,326. World Bank (1989) India-An Industrializing Economy in Transition, A World Bank Country Study, The World Bank, Washington DC. Young, A. (1991), ‘Learning by Doing and the Dynamic Effects of International Trade,’ Quarterly Journal of Economics, 106, 369-405.
List of Abbreviation: • ERP: Effective Rate of Protection • FR: Frequency Ratio • MCR: Import Coverage Ratio • MPR: Import penetration ratio • NRP: Nominal Rate of Protection • NTB: Non-tariff Barrier • OGL: Open General Licensing • QR: Quantitative Restriction • TFP: Total Factor Productivity
|