Today, the Reserve Bank released the results of the September 2017 round of the Inflation Expectations Survey of Households (IESH)1. The survey was conducted in 18 cities and the results are based on responses from 4,996 urban households covering various occupational categories (Table 1). Highlights: -
The proportion of respondents expecting general prices to increase in the next three months went up further in the September 2017 round relative to the previous round of the survey, with more than half of the respondents expecting prices to rise by more than the current rate (Table 2). -
Expectations of higher inflation in the near term strengthened across all product groups (Table 2). -
Similar sentiment prevailed in the case of one year ahead expectations as well (Table 2). -
From quantitative responses, however, it bears out that the median inflation expectations for three months ahead and one year ahead softened by 30 and 60 basis points, respectively, as compared with the June 2017 round, and by 230 and 340 basis points, respectively, from the September 2016 round (Chart 1). 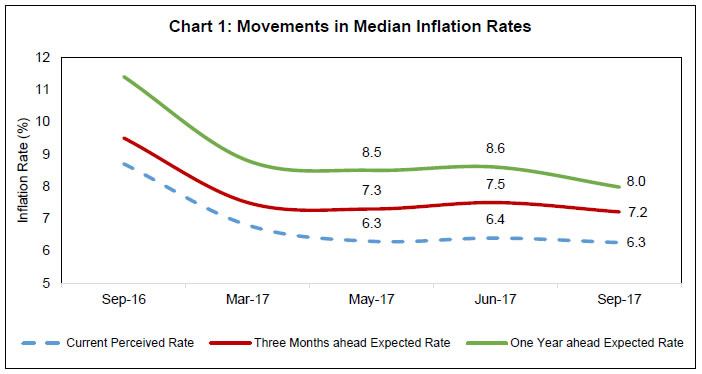
| Table 1: Respondents’ Profile (Category): Share in Total Sample - September 2017 | | Category of Respondents | Share in Total (%) | Target Share (%) | | Financial Sector Employees | 9.9 | 10.0 | | Other Employees | 16.2 | 15.0 | | Self-employed | 19.8 | 20.0 | | Housewives | 28.9 | 30.0 | | Retired Persons | 9.9 | 10.0 | | Daily Workers | 9.9 | 10.0 | | Others | 5.4 | 5.0 |
| Table 2: Product-wise Expectations of Prices for Three Months ahead and One Year ahead | | (Percentage of Respondents) | | Round | Sep-16 | Mar-17 | May-17 | Jun-17 | Sep-17 | Sep-16 | Mar-17 | May-17 | Jun-17 | Sep-17 | | Options: General | Three Months Ahead | One Year Ahead | | Prices will increase | 78.6 | 73.8 | 70.2 | 77.2 | 81.3 | 86.2 | 81.0 | 80.9 | 82.4 | 93.5 | | Price increase more than current rate | 47.0 | 37.9 | 35.9 | 39.9 | 50.5 | 55.0 | 44.5 | 46.3 | 44.1 | 61.2 | | Price increase similar to current rate | 18.5 | 27.3 | 25.0 | 26.6 | 25.4 | 20.4 | 28.5 | 26.4 | 28.3 | 27.3 | | Price increase less than current rate | 13.0 | 8.6 | 9.3 | 10.7 | 5.4 | 10.8 | 8.0 | 8.2 | 10.1 | 5.0 | | No change in prices | 15.7 | 21.5 | 25.2 | 16.8 | 15.8 | 9.2 | 13.6 | 14.3 | 11.2 | 4.1 | | Decline in prices | 5.8 | 4.7 | 4.6 | 6.0 | 2.9 | 4.6 | 5.4 | 4.8 | 6.4 | 2.5 | | Options: Food Product | Three Months Ahead | One Year Ahead | | Prices will increase | 74.7 | 74.2 | 73.7 | 71.6 | 79.5 | 83.1 | 78.0 | 79.8 | 75.8 | 84.8 | | Price increase more than current rate | 42.8 | 39.5 | 38.6 | 39.1 | 47.5 | 51.1 | 39.7 | 42.1 | 38.0 | 51.4 | | Price increase similar to current rate | 19.3 | 24.7 | 23.6 | 21.8 | 24.8 | 20.5 | 29.0 | 27.2 | 26.8 | 27.5 | | Price increase less than current rate | 12.6 | 9.9 | 11.5 | 10.7 | 7.3 | 11.5 | 9.3 | 10.6 | 11.0 | 6.0 | | No change in prices | 16.6 | 16.5 | 18.2 | 14.2 | 13.3 | 10.8 | 12.8 | 11.9 | 12.4 | 9.3 | | Decline in prices | 8.6 | 9.3 | 8.1 | 14.3 | 7.1 | 6.1 | 9.2 | 8.2 | 11.8 | 5.9 | | Options: Non-Food Product | Three Months Ahead | One Year Ahead | | Prices will increase | 63.2 | 69.6 | 66.3 | 72.1 | 74.7 | 72.1 | 72.3 | 73.9 | 74.8 | 81.4 | | Price increase more than current rate | 35.2 | 34.1 | 32.4 | 36.9 | 43.4 | 42.8 | 35.1 | 37.1 | 36.3 | 48.2 | | Price increase similar to current rate | 16.7 | 25.1 | 23.4 | 23.6 | 24.8 | 18.3 | 27.5 | 25.7 | 27.3 | 26.7 | | Price increase less than current rate | 11.3 | 10.4 | 10.6 | 11.6 | 6.6 | 11.0 | 9.7 | 11.1 | 11.2 | 6.5 | | No change in prices | 29.3 | 23.6 | 26.9 | 18.1 | 19.3 | 20.5 | 20.3 | 19.1 | 16.3 | 13.8 | | Decline in prices | 7.6 | 6.8 | 6.8 | 9.8 | 5.9 | 7.4 | 7.4 | 7.0 | 9.0 | 4.8 | | Options: Household Durables | Three Months Ahead | One Year Ahead | | Prices will increase | 54.1 | 54.2 | 51.1 | 65.4 | 61.5 | 68.1 | 60.8 | 62.1 | 70.3 | 70.7 | | Price increase more than current rate | 30.3 | 27.2 | 25.1 | 34.7 | 37.3 | 39.6 | 29.7 | 31.9 | 35.7 | 42.7 | | Price increase similar to current rate | 13.9 | 19.3 | 17.1 | 20.6 | 19.1 | 17.8 | 22.8 | 21.5 | 24.3 | 22.6 | | Price increase less than current rate | 9.9 | 7.6 | 8.9 | 10.1 | 5.1 | 10.8 | 8.3 | 8.8 | 10.3 | 5.4 | | No change in prices | 32.3 | 30.8 | 33.6 | 20.6 | 25.3 | 21.8 | 25.3 | 24.9 | 17.5 | 19.1 | | Decline in prices | 13.6 | 15.1 | 15.3 | 14.0 | 13.2 | 10.1 | 13.9 | 13.0 | 12.2 | 10.2 | | Options: Housing Prices | Three Months Ahead | One Year Ahead | | Prices will increase | 68.7 | 56.7 | 57.3 | 64.3 | 68.9 | 79.1 | 68.7 | 69.7 | 73.4 | 78.9 | | Price increase more than current rate | 44.4 | 32.4 | 33.2 | 37.1 | 44.9 | 54.8 | 39.3 | 39.7 | 42.2 | 53.0 | | Price increase similar to current rate | 15.2 | 16.9 | 17.0 | 18.6 | 19.2 | 15.7 | 21.5 | 22.7 | 22.4 | 20.8 | | Price increase less than current rate | 9.1 | 7.4 | 7.1 | 8.7 | 4.9 | 8.5 | 8.0 | 7.3 | 8.8 | 5.1 | | No change in prices | 22.3 | 24.9 | 26.4 | 22.0 | 20.0 | 13.0 | 16.9 | 17.4 | 15.1 | 12.4 | | Decline in prices | 9.1 | 18.4 | 16.2 | 13.6 | 11.1 | 7.9 | 14.3 | 12.9 | 11.5 | 8.8 | | Options: Cost of Services | Three Months Ahead | One Year Ahead | | Prices will increase | 64.5 | 67.0 | 61.3 | 68.9 | 68.7 | 81.9 | 77.4 | 75.5 | 78.6 | 82.9 | | Price increase more than current rate | 36.9 | 33.6 | 29.4 | 35.1 | 40.7 | 49.3 | 38.5 | 37.3 | 38.8 | 48.6 | | Price increase similar to current rate | 17.6 | 23.8 | 21.7 | 23.7 | 22.5 | 21.3 | 28.5 | 26.8 | 27.8 | 27.9 | | Price increase less than current rate | 10.0 | 9.7 | 10.2 | 10.2 | 5.5 | 11.4 | 10.4 | 11.4 | 12.0 | 6.4 | | No change in prices | 30.3 | 27.5 | 33.0 | 25.3 | 27.3 | 13.6 | 17.4 | 19.1 | 15.6 | 13.5 | | Decline in prices | 5.2 | 5.6 | 5.7 | 5.8 | 4.0 | 4.5 | 5.2 | 5.5 | 5.9 | 3.7 |
| Table 3: Households Expecting General Price Movements in Coherence with Movements in Price Expectations of Various Product Groups: Three Months Ahead and One Year Ahead | | (Percentage of Respondents) | | Round No. | Survey period ended | Food | Non-Food | Households durables | Housing | Cost of services | | Three Months Ahead | | 45 | Sep-16 | 62.6 | 52.2 | 46.2 | 50.1 | 49.3 | | 47 | Mar-17 | 57.1 | 56.7 | 48.1 | 48.3 | 57.7 | | 47B | May-17 | 59.8 | 59.7 | 51.0 | 52.5 | 60.3 | | 48 | Jun-17 | 62.0 | 64.3 | 57.2 | 57.6 | 63.4 | | 49 | Sep-17 | 66.8 | 65.8 | 56.8 | 60.1 | 64.9 | | One Year Ahead | | 45 | Sep-16 | 67.9 | 56.5 | 52.5 | 57.1 | 58.4 | | 47 | Mar-17 | 62.3 | 60.4 | 51.5 | 54.6 | 64.1 | | 47B | May-17 | 66.8 | 64.4 | 56.4 | 58.7 | 67.3 | | 48 | Jun-17 | 68.2 | 67.7 | 62.0 | 63.2 | 70.0 | | 49 | Sep-17 | 72.7 | 69.9 | 60.5 | 67.4 | 69.8 |
| Table 4: Household Inflation Expectations – Current, Three Months and One Year Ahead | | Survey Round | Survey Period Ended | Inflation rate in Per cent | | Current | Three Months Ahead | One Year Ahead | | Mean | Median | Std. Dev. | Mean | Median | Std. Dev. | Mean | Median | Std. Dev. | | 45 | Sep-16 | 9.2 | 8.7 | 4.0 | 9.7 | 9.5 | 4.4 | 11.6 | 11.4 | 3.9 | | 47 | Mar-17 | 7.8 | 6.8 | 4.0 | 8.2 | 7.5 | 4.1 | 9.3 | 8.8 | 4.2 | | 47B | May-17 | 7.5 | 6.3 | 4.0 | 8.1 | 7.3 | 4.2 | 9.2 | 8.5 | 4.3 | | 48 | Jun-17 | 7.3 | 6.4 | 3.8 | 8.1 | 7.5 | 3.9 | 9.1 | 8.6 | 4.1 | | 49 | Sep-17 | 7.6 | 6.3 | 3.9 | 8.2 | 7.2 | 4.0 | 8.7 | 8.0 | 4.5 |
| Table 5: Factors that Explain the Total Variability | | Round No. | Survey Period Ended | Current | Three Months Ahead | One Year Ahead | | 45 | Sep-16 | City, Age-Group | City, Age-Group | City | | 47 | Mar-17 | City, Age-Group | City, Category | City, Category | | 47B | May-17 | City, Gender, Category | City, Category | City, Category | | 48 | Jun-17 | City, Age-Group, Category | City, Age-Group, Category | City, Age-Group, Category | | 49 | Sep-17 | City, Gender, Category | City, Age-Group, Category | City, Gender, Category |
| Table 6 : Various Group-wise Inflation Expectations: September 2017 | | | Current | Three Months Ahead | One Year Ahead | | Mean | Median | Std. Dev. | Mean | Median | Std. Dev. | Mean | Median | Std. Dev. | | Overall | 7.6 | 6.3 | 3.9 | 8.2 | 7.2 | 4.0 | 8.7 | 8.0 | 4.5 | | Gender-wise | | Male | 7.7 | 6.4 | 4.0 | 8.2 | 7.2 | 4.1 | 8.6 | 7.9 | 4.6 | | Female | 7.5 | 6.1 | 3.8 | 8.2 | 7.2 | 3.9 | 8.8 | 8.0 | 4.3 | | Category-wise | | Financial Sector Employees | 7.4 | 6.3 | 3.8 | 7.9 | 6.9 | 3.9 | 8.3 | 7.6 | 4.3 | | Other Employees | 7.7 | 6.5 | 3.9 | 8.3 | 7.5 | 4.0 | 8.9 | 8.3 | 4.5 | | Self Employed | 7.6 | 6.3 | 3.9 | 8.0 | 7.1 | 4.1 | 8.3 | 7.8 | 4.5 | | Housewives | 7.5 | 6.1 | 3.8 | 8.2 | 7.2 | 3.9 | 8.9 | 8.0 | 4.2 | | Retired Persons | 8.1 | 6.7 | 4.2 | 8.7 | 7.6 | 4.3 | 9.2 | 8.4 | 4.7 | | Daily Workers | 7.8 | 6.2 | 4.2 | 8.2 | 7.1 | 4.2 | 8.7 | 8.0 | 4.7 | | Other category | 7.2 | 6.0 | 3.4 | 7.8 | 7.1 | 3.6 | 8.3 | 7.9 | 4.2 | | Age Group-wise | | Up to 25 years | 7.1 | 6.0 | 3.5 | 7.8 | 7.1 | 3.6 | 8.4 | 7.9 | 4.1 | | 25 to 30 years | 7.2 | 6.0 | 3.6 | 7.8 | 6.9 | 3.6 | 8.4 | 7.7 | 4.0 | | 30 to 35 years | 7.6 | 6.2 | 3.9 | 8.1 | 7.3 | 4.0 | 8.7 | 8.1 | 4.5 | | 35 to 40 years | 7.8 | 6.5 | 3.9 | 8.3 | 7.4 | 4.0 | 8.8 | 8.0 | 4.6 | | 40 to 45 years | 7.5 | 6.2 | 4.0 | 7.9 | 6.9 | 4.1 | 8.4 | 7.8 | 4.5 | | 45 to 50 years | 7.8 | 6.2 | 4.1 | 8.3 | 7.3 | 4.2 | 8.7 | 8.2 | 4.6 | | 50 to 55 years | 8.3 | 7.1 | 4.4 | 9.0 | 7.9 | 4.5 | 9.1 | 8.4 | 5.1 | | 55 to 60 years | 8.2 | 6.8 | 4.0 | 9.0 | 8.2 | 4.1 | 9.2 | 8.6 | 4.7 | | 60 years and above | 8.0 | 6.5 | 4.2 | 8.5 | 7.4 | 4.3 | 9.0 | 8.2 | 4.7 | | City-wise | | Ahmedabad | 8.2 | 7.4 | 3.8 | 9.3 | 9.2 | 4.1 | 9.0 | 9.4 | 5.0 | | Bengaluru | 4.4 | 4.3 | 1.8 | 4.9 | 4.7 | 2.2 | 5.0 | 5.1 | 2.9 | | Bhopal | 7.9 | 6.5 | 4.3 | 8.3 | 7.5 | 4.4 | 7.6 | 6.9 | 5.5 | | Bhubaneswar | 9.9 | 10.1 | 4.1 | 11.0 | 10.8 | 4.1 | 11.9 | 12.5 | 4.4 | | Chennai | 9.3 | 8.1 | 4.2 | 10.8 | 10.3 | 4.0 | 12.4 | 12.5 | 3.7 | | Delhi | 6.8 | 6.1 | 3.1 | 7.0 | 6.5 | 3.1 | 7.1 | 6.5 | 3.2 | | Guwahati | 13.4 | 16.0 | 4.1 | 11.1 | 12.4 | 5.7 | 12.6 | 15.3 | 4.9 | | Hyderabad | 5.8 | 5.7 | 0.7 | 6.8 | 6.7 | 0.8 | 8.0 | 7.9 | 1.1 | | Jaipur | 6.7 | 5.9 | 2.0 | 6.6 | 6.0 | 3.3 | 6.5 | 6.5 | 4.0 | | Kolkata | 9.4 | 8.3 | 4.3 | 10.2 | 9.3 | 4.1 | 11.1 | 10.4 | 4.2 | | Lucknow | 7.5 | 5.8 | 4.7 | 8.1 | 6.7 | 4.7 | 8.9 | 8.1 | 4.8 | | Mumbai | 6.8 | 6.6 | 3.0 | 7.5 | 7.4 | 3.1 | 7.9 | 7.8 | 3.8 | | Nagpur | 7.4 | 6.0 | 3.9 | 8.0 | 6.8 | 4.0 | 8.1 | 7.6 | 4.4 | | Patna | 6.4 | 6.2 | 2.0 | 7.0 | 6.8 | 2.3 | 7.5 | 7.4 | 2.8 | | Thiruvananthapuram | 7.7 | 6.6 | 3.6 | 8.5 | 7.8 | 4.0 | 8.6 | 8.5 | 5.0 | | Chandigarh | 5.8 | 5.5 | 1.7 | 6.0 | 5.9 | 1.7 | 6.2 | 6.5 | 2.6 | | Ranchi | 5.3 | 5.4 | 1.4 | 5.8 | 5.6 | 1.5 | 6.7 | 6.0 | 2.1 | | Raipur | 6.0 | 5.5 | 3.1 | 6.7 | 6.1 | 3.3 | 7.1 | 7.1 | 3.9 |
| Table 7: Cross-tabulation of Current and Three Months Ahead Inflation Expectations: September 2017 | | (Number of Respondents) | | Three Months Ahead Inflation Rate (per cent) | | Current Inflation Rate (per cent) | | <1 | 1-<2 | 2-<3 | 3-<4 | 4-<5 | 5-<6 | 6-<7 | 7-<8 | 8-<9 | 9-<10 | 10-<11 | 11-<12 | 12-<13 | 13-<14 | 14-<15 | 15-<16 | >=16 | No idea | Total | | <1 | 18 | 2 | 5 | 1 | 0 | 1 | 0 | 0 | 0 | 0 | 0 | 0 | 0 | 0 | 0 | 0 | 1 | 0 | 28 | | 1-<2 | 7 | 27 | 11 | 5 | 1 | 1 | 0 | 0 | 0 | 0 | 1 | 0 | 0 | 0 | 0 | 0 | 0 | 0 | 53 | | 2-<3 | 1 | 9 | 121 | 61 | 21 | 12 | 0 | 3 | 0 | 0 | 1 | 0 | 1 | 0 | 0 | 0 | 0 | 0 | 230 | | 3-<4 | 4 | 3 | 16 | 116 | 67 | 28 | 7 | 2 | 2 | 1 | 0 | 0 | 0 | 0 | 0 | 0 | 0 | 2 | 248 | | 4-<5 | 2 | 1 | 5 | 14 | 209 | 115 | 59 | 3 | 5 | 2 | 1 | 0 | 0 | 0 | 0 | 0 | 0 | 2 | 418 | | 5-<6 | 10 | 3 | 7 | 18 | 28 | 611 | 350 | 233 | 50 | 4 | 53 | 0 | 1 | 0 | 0 | 6 | 0 | 6 | 1380 | | 6-<7 | 2 | 0 | 0 | 4 | 3 | 20 | 243 | 186 | 56 | 15 | 15 | 3 | 1 | 0 | 0 | 0 | 1 | 2 | 551 | | 7-<8 | 4 | 0 | 1 | 3 | 3 | 3 | 9 | 213 | 113 | 63 | 32 | 4 | 5 | 0 | 1 | 0 | 0 | 1 | 455 | | 8-<9 | 3 | 0 | 2 | 0 | 2 | 5 | 2 | 2 | 161 | 60 | 75 | 6 | 11 | 1 | 0 | 1 | 0 | 0 | 331 | | 9-<10 | 0 | 0 | 0 | 0 | 0 | 0 | 2 | 0 | 0 | 51 | 38 | 17 | 11 | 3 | 3 | 2 | 0 | 0 | 127 | | 10-<11 | 5 | 0 | 1 | 0 | 0 | 5 | 1 | 3 | 3 | 3 | 210 | 35 | 79 | 15 | 11 | 59 | 25 | 1 | 456 | | 11-<12 | 2 | 1 | 0 | 1 | 0 | 1 | 0 | 2 | 1 | 0 | 1 | 19 | 9 | 16 | 3 | 7 | 0 | 0 | 63 | | 12-<13 | 0 | 0 | 0 | 0 | 0 | 0 | 0 | 0 | 1 | 0 | 0 | 0 | 17 | 7 | 5 | 3 | 3 | 1 | 37 | | 13-<14 | 0 | 0 | 0 | 0 | 0 | 0 | 0 | 0 | 0 | 1 | 1 | 0 | 1 | 6 | 2 | 5 | 4 | 0 | 20 | | 14-<15 | 1 | 0 | 1 | 0 | 0 | 2 | 1 | 0 | 0 | 0 | 2 | 0 | 0 | 0 | 9 | 8 | 14 | 2 | 40 | | 15-<16 | 0 | 0 | 0 | 0 | 0 | 2 | 0 | 0 | 2 | 0 | 4 | 1 | 0 | 1 | 0 | 48 | 39 | 4 | 101 | | >=16 | 17 | 0 | 4 | 5 | 0 | 3 | 0 | 0 | 1 | 0 | 18 | 0 | 0 | 0 | 0 | 7 | 388 | 15 | 458 | | Total | 76 | 46 | 174 | 228 | 334 | 809 | 674 | 647 | 395 | 200 | 452 | 85 | 136 | 49 | 34 | 146 | 475 | 36 | 4996 |
| Table 8: Cross-tabulation of Current and One Year Ahead Inflation Expectations: September 2017 | | (Number of Respondents) | | One Year Ahead Inflation Rate (per cent) | | Current Inflation Rate (per cent) | | <1 | 1-<2 | 2-<3 | 3-<4 | 4-<5 | 5-<6 | 6-<7 | 7-<8 | 8-<9 | 9-<10 | 10-<11 | 11-<12 | 12-<13 | 13-<14 | 14-<15 | 15-<16 | >=16 | No idea | Total | | <1 | 18 | 2 | 2 | 0 | 0 | 3 | 0 | 0 | 0 | 1 | 1 | 0 | 0 | 0 | 0 | 0 | 1 | 0 | 28 | | 1-<2 | 15 | 11 | 16 | 6 | 2 | 0 | 2 | 0 | 0 | 0 | 1 | 0 | 0 | 0 | 0 | 0 | 0 | 0 | 53 | | 2-<3 | 28 | 0 | 82 | 27 | 43 | 24 | 12 | 6 | 2 | 0 | 1 | 0 | 1 | 0 | 0 | 0 | 2 | 2 | 230 | | 3-<4 | 30 | 2 | 4 | 81 | 31 | 57 | 16 | 13 | 4 | 1 | 5 | 0 | 1 | 0 | 0 | 0 | 0 | 3 | 248 | | 4-<5 | 33 | 0 | 0 | 1 | 146 | 66 | 88 | 32 | 34 | 3 | 8 | 0 | 3 | 1 | 0 | 1 | 0 | 2 | 418 | | 5-<6 | 80 | 0 | 2 | 11 | 6 | 428 | 139 | 307 | 146 | 91 | 107 | 7 | 18 | 3 | 0 | 17 | 6 | 12 | 1380 | | 6-<7 | 20 | 0 | 0 | 0 | 1 | 2 | 201 | 94 | 123 | 36 | 41 | 4 | 14 | 2 | 1 | 2 | 5 | 5 | 551 | | 7-<8 | 27 | 0 | 0 | 1 | 0 | 1 | 7 | 159 | 79 | 54 | 69 | 15 | 13 | 10 | 7 | 6 | 3 | 4 | 455 | | 8-<9 | 16 | 0 | 1 | 0 | 0 | 3 | 2 | 1 | 109 | 38 | 71 | 22 | 32 | 8 | 8 | 14 | 6 | 0 | 331 | | 9-<10 | 5 | 0 | 0 | 0 | 0 | 0 | 1 | 2 | 1 | 43 | 13 | 15 | 16 | 4 | 11 | 11 | 5 | 0 | 127 | | 10-<11 | 20 | 0 | 0 | 0 | 0 | 5 | 0 | 0 | 5 | 1 | 152 | 16 | 45 | 22 | 19 | 81 | 87 | 3 | 456 | | 11-<12 | 0 | 1 | 0 | 0 | 0 | 1 | 0 | 1 | 1 | 2 | 1 | 19 | 3 | 3 | 7 | 15 | 9 | 0 | 63 | | 12-<13 | 3 | 0 | 0 | 0 | 0 | 0 | 0 | 0 | 0 | 0 | 0 | 0 | 13 | 0 | 4 | 9 | 5 | 3 | 37 | | 13-<14 | 1 | 0 | 0 | 0 | 0 | 0 | 0 | 0 | 0 | 0 | 0 | 0 | 1 | 4 | 2 | 1 | 11 | 0 | 20 | | 14-<15 | 1 | 0 | 0 | 0 | 0 | 1 | 0 | 0 | 0 | 0 | 3 | 0 | 0 | 0 | 10 | 3 | 20 | 2 | 40 | | 15-<16 | 3 | 0 | 0 | 0 | 0 | 1 | 0 | 1 | 2 | 0 | 1 | 0 | 0 | 0 | 1 | 37 | 53 | 2 | 101 | | >=16 | 16 | 0 | 2 | 1 | 0 | 6 | 0 | 0 | 2 | 0 | 5 | 2 | 2 | 0 | 1 | 6 | 387 | 28 | 458 | | Total | 316 | 16 | 109 | 128 | 229 | 598 | 468 | 616 | 508 | 270 | 479 | 100 | 162 | 57 | 71 | 203 | 600 | 66 | 4996 |
|