| ACKNOWLEDGEMENTS This project was made possible because of funding from the Reserve Bank of India, Mumbai, and we greatly appreciate the support received from the Reserve Bank. We also thank both the Bank officials and farmers covered in the study for their valuable time during our field visits. We are especially grateful to the Director, Institute for Social and Economic Change (ISEC), the Registrar and the Accounts Officer, ISEC, for their support. We are also thankful to Ms Suma from the accounts section of ISEC for handling the accounts of the project. We are also most grateful to Mr Devaraju and Mr Jaisimha at ISEC for their assistance in this project, without whose sincere efforts it would not have been completed. Mr Pranav Nagendran at ISEC helped revise and finalise the report and we are most grateful to him too. We also express our gratitude to the two anonymous referees and several RBI officials for their valuable comments. We thank the RBI and the Indian Council of Social Science Research for their support to ISEC. None of the organisations and people mentioned here, however, shares any responsibility for the views expressed or errors that remain. Executive Summary 1. Indian agricultural activity is predominantly carried out on small and marginal land holdings. Farmers in India, at large, have inadequate incomes and, consequently, low to no savings. However, in order to commence cropping, investments are required in the form of seeds, fertilisers, tools and other inputs, while returns on these investments are realised much later at the harvest stage. Insufficient savings lead to a shortage of funds to make these crucial investments; thereby forcing farmers to rely on credit. Previously, funds were predominantly borrowed from village-level moneylenders and other informal agents who charged hefty interest rates. This led to a multitude of travails for the farm sector, since high interest rates left little income for farmers and during periods of crop failure, farmers often found themselves unable to repay their dues. 2. In order to ameliorate the problem of farmer distress, the Government of India has made strides in expanding the formal banking network into rural areas following bank nationalisation (Rajeev and Mahesh, 2014). Additionally, in order to further attract farmers seeking short-term funds for cropping to the formal sector, the government introduced an Interest Subvention Scheme for short term crop loans in 2005 which was fine tuned in subsequent year. Under the scheme, short term credit is made available to farmers by commercial banks at an interest rate of 7 per cent at the ground level, thereby providing a subsidy of 2 percentage points out of the 9 per cent interest rate charged by banks on such loans. As a further incentive aimed at inculcating a habit of prompt repayment, banks have been directed to provide an additional interest subvention of 3 per cent per annum to farmers who have fully repaid their loans within the due date set by the banks, subject to a maximum period of one year. Thus, farmers repaying on time effectively bear only 4 per cent interest rate on credit. 3. The Interest Subvention Scheme for Short Term Crop Loans, which is aimed primarily at alleviating farmer distress and making affordable credit available to poor and vulnerable farmers, requires an assessment of its performance and an examination of its shortcomings, if any. In this respect, this study focuses on the state of Karnataka, which is a drought-prone region with low irrigation; more susceptible to farmer distress; and therefore, is in need of greater support in the form of credit and other inputs. 4. Utilising National Sample Survey Office (NSSO) data from the 70th Round (NSSO, 2013), the study found that more than 50 per cent credit comes from the informal sector in India. Small and marginal farmers face a high modal interest rate of 36 per cent, and most loans are taken for income-generating activities, thus indicating that there is a shortage of formal loans even for productive purposes. Landholding size was found to be directly related to the accessibility of credit from commercial banks such that while 83 per cent of large farmers’ loans came from institutional agencies, this figure was around 60 per cent for small and marginal farmers. Judging by the 70th Round data, 12 per cent of Scheduled Caste (SC) farmers had access to commercial bank credit in Karnataka, and 77 per cent of this was cornered by the top two quintiles of farmers classified by their assets. These observations point to an urgent need to improve access to formal financial services for marginalised and poorer farm communities. 5. Looking at the performance of the Interest Subvention Scheme for Short-term Crop Loans, we find that only 27 per cent of loanee farmers in Karnataka availed institutional loans at 7 per cent rate of interest or less, as opposed to 38 per cent at the all-India level, both of which appear to be low figures (NSSO, 2013). 6. For loans under interest subvention, as the rate of interest is subsidised, the possibility of an arbitrage opportunity arises by way of re-lending. While we cannot directly obtain information on arbitrage from NSSO data, the possibility of interest rate arbitrage can be indirectly estimated by the percentage of farmers who borrowed from both institutional sources as well as act as informal moneylenders. From our analysis of NSSO 70th Round Debt and Investment Survey data, it was found that such cases were negligible, at less than 1 per cent of cultivator households in the sample (NSSO, 2013). Insights from our field survey indirectly indicate that less than 2–3 per cent of households were possibly engaged in re-lending. 7. Using econometric analysis with a sample selection model to study repayment habits of farmer households, it was found that banks tend to lend to relatively better-off farmers with more assets and land, and those from majority social groups, however, these groups are relatively less likely to make prompt repayments. 8. To obtain a more contemporary understanding of agricultural credit in Karnataka, a field survey was conducted in four districts. The findings largely re-inforce what was indicated by the NSSO data. Only around 30 per cent of marginal and small farmers were found to have received subsidised credit, while this figure was around 70 per cent for large farmers. However, almost all farmer households were found to be financially included and 66 per cent were reported as regularly visiting banks. In 43 per cent of households, women members were reported as belonging to a self-help group (SHG) through which they obtained access to a commercial bank. 9. Financial literacy is a key element in improving the situation of agricultural credit. However, only 40 per cent of marginal and small farmers in Karnataka reported being even moderately aware of the Interest Subvention Scheme, and most farmers were unaware of the incentive for prompt repayment. 10. An emerging issue in agricultural credit, the rising prominence of jewel-based loans under the Interest Subvention Scheme, was revealed through a survey of banks in select districts in Karnataka. Due to mutations not occurring automatically, many farmers lacked the requisite land records. Even among farmers possessing adequate land records, hurdles were faced in obtaining a ‘no due certificate’ from all bank branches in the locality, certifying that the farmer does not have an outstanding short-term crop loan. The process also involves significant time (from lost working hours) and money (from transport and charges for certificates) costs. These bottlenecks have worked towards driving farmers to opt for jewel loans. 11. However, jewel loans were of smaller amounts (for a given land size) than the alternative loans (i.e. loans taken by providing a record of Rights, Tenancy, and Cropping or RTC). The size of a jewel loan is often insufficient to cover the full cost of cultivation. This has possibly led to an increased reliance on informal credit to cover the shortfall, especially for small and marginal farmers. Furthermore, in richer districts, where jewel loans are seen to be more prevalent, such loans appear to crowd out RTC-based loans. 12. Policy intervention is required to reduce reliance on gold/jewels for short-term crop loans. Observing the scenario on the ground, we propose that a fixed portion of loans (say 40–45 per cent) should be necessarily provided through the RTC route by any branch to ensure that small and marginal farmers (who lack gold) have access to formal finance for cultivation. 13. A different portal may be created so that information about outstanding loan of a loanee farmer in one bank branch can become readily available/ to other bank branches of the region through certain identification number (may be through his/her Kisan Credit Card (KCC) account). Additionally, alongside ‘no due certificates’, farmers are often asked to bring other documents such as an encumbrance certificate (EC) from the taluka office, and/or a legal opinion, all of which add to the cost and time to obtain a short-term crop loan. As farm activities are seasonal and timebound, it is necessary to set a definite timeline for processing crop loan applications. 14. Land records should be digitised and mutations should take place automatically so as to better enable formal financial access, and allowances should be made for landless/tenant farmers for accessing bank credit. 15. It is observed that tenant farmers’ access to credit is constrained by lack of land records or tenancy contracts (RTC). The study suggests that tenant farmers should be given short-term crop loans up to ₹1 lakh on a declaration basis. Banks can verify the credentials of randomly selected subset of applicants for authenticity. In Andhra Pradesh, revenue authorities issue credit eligibility certificates to tenant farmers who do not hold land records. Such a system can be adopted in other states as well. Further, tenant farmers often lack records of tenancy owing to stringencies in tenancy laws. Relaxation and amendments of these laws can help relieve some of the credit access woes among this group. 16. During our interactions, bank officials expressed their viewpoint that subsidised credit should also be extended to horticulture and dairy farmers especially to the poorest section. 17. Bank officials also indicated that several small farmers were unable to avail short-term crop loans owing to prior unpaid dues. Loan waiver drives often lead to bad repayment habits as farmers default on repayments in anticipation of such announcements. When asked about their outlook on loan waivers, farmers were favourable, but almost always expressed a preference for enhanced irrigation or similar productivity augmenting facilities over loan waivers. Thus, there is a strong policy suggestion to minimise loan waivers and instead concentrate on improving agricultural infrastructure and extension services (training programmes, marketing services, etc.). Direct cash benefits to compensate for crop losses during times of drought or proper implementation in terms of timely compensation and coverage of the existing crop insurance scheme will also help to alleviate agricultural distress. 18. There is a need to accelerate the formation of farmers’ Joint Liability Groups (JLGs) to improve credit access. Studies have found that SHGs among rural women in Karnataka have been successful in improving their access to formal financial services for establishing businesses and running business operations. By forming JLGs, farmers, too, can potentially have greater credit access. Such groups can be powerful catalysts for improving access to formal finance among marginalised groups such as SCs/STs and tenant farmers constrained by the absence of land or tenancy records. 19. In certain cases, farmers’ incomes are more dependent on the buyers of their crops, as is the case of sugarcane farmers. Here, the ability to repay loans depends on timely payments by sugar mills/factories, and hence, outside the control of farmers. Such loans should be rescheduled and also be made eligible, on a case-to-case basis, to receive the benefits of prompt repayment. 20. Low financial literacy is an important factor in determining the utilisation of the benefits of the Interest Subvention Scheme. Financial literacy may be improved through the printing of information brochures in local languages. Financial literacy may also lead to an improvement in payment habits when the advantages of prompt repayment become clear to a farmer. Announcing the names of farmers who repay loans in a timely manner in the gram sabha (with a token reward, if possible) can also help foster better repayment habits. 21. Farmers were also found to be withdrawing the entire eligible amount under the KCC scheme at once, which is not an optimal practice as credit is required at different stages of cultivation. The amount that can be withdrawn under KCC can be split into four instalments, as follows: 35 per cent at the time of sowing, 25 per cent during the weeding and irrigation phase, 20 per cent at the pest-fertiliser phase, and 20 per cent during harvest. 22. Overall, the Interest Subvention Scheme has functioned well in the state but requires attention in the aforementioned areas in order to ensure realisation of its true welfare generating potential among farmers in Karnataka. 23. Contextually, the Union Budget (Interim) presented on February 1, 2019 has announced to provide the benefits of interest subvention as well as prompt repayment to all farmers pursuing activities of animal husbandry. The Budget has also announced to extend the benefits of interest subvention and prompt payment for the rescheduled period of loans to farmers affected by natural calamities, where assistance is provided from National Disaster Relief Fund (NDRF). While these announcements will help the needy farmers, such benefits may also be extended to horticulture and to farmers whose payments get delayed due to non-receipt of proceeds from buyers of their produce. CHAPTER 1: Introduction The structural composition of India’s gross domestic product (GDP) has changed significantly, tilting away from the primary sector, even though more than half of its population still depends on agriculture. Among cultivator households, around 80 per cent belong to the small and marginal farmer group whose income levels are substantially low and do not allow for sufficient savings required for investments. In addition, the agricultural sector in the country is at the crossroads, often with conflicting forces working simultaneously. The vagaries of the weather create uncertainty, and the resultant high instability in production and productivity drags the development in the agricultural sector. In this context, it is to be noted that Karnataka is among the driest states in India. It has a low share of area under irrigation and, therefore, protective irrigation does not play a significant role here. Dominated by low-value and low-density crops, farmers’ income here is perennially low, and with the increase in prices of inputs (specifically of cash inputs), farmers’ net income is further reduced. As a result, farmers are unable to manage the probable risk or even working capital needs of the sector. One of the unpleasant outcomes of this scenario is the high indebtedness arising from institutional as well as non-institutional sources in the farm sector. Most of the recent studies on the farm sector have highlighted this as the dominant cause of farmer distress. Keeping the need for funds in mind, the Indian banking sector has been mandated to provide 18 per cent of their total credit to the agricultural sector at a reasonable rate of interest. The interest rate charged to the farmers is kept at a comparatively low rate of 7 per cent through government interest subvention, and to encourage prompt repayment, an additional 3 per cent subvention is provided for borrowers who repay on time. However, like numerous other welfare schemes of the government, the success of this scheme too depends on its proper implementation. As the Interest Subvention Scheme involves fiscal resources and is intended to benefit poor farmers, it is essential to examine how far the scheme has been successful in benefitting the neediest. It is also necessary to identify shortcomings, if any, in such initiatives by examining field-level operations, and look for remedies so that such initiatives can serve the objective. The state of Karnataka is an appropriate case study covering these aspects, given that this is a drought prone region with low irrigation facilities and, hence, in need of adequate support in terms of credit and other inputs than the states which are endowed with better land quality and weather conditions. 1.1 Subvention Schemes1 Given our focus on the subvention scheme and to place the discussion in perspective, it is worthwhile to discuss certain aspects of the scheme. • As directed by the Government of India (GoI) and in pursuance of the budget announcement made by the finance minister on February 28, 2006 relating to the Interest Subvention Scheme, an interest subvention of 2 per cent per annum is made available to the Public Sector Banks (PSBs) and the Private Sector Scheduled Commercial Banks with respect to loans given by their rural and semi-urban branches. The scheme is applicable to loans from banks’ own funds for short-term crop loans up to ₹3,00,000 per farmer, provided the banks make available short-term credit at the ground level at the rate of 7 per cent per annum to farmers. • An additional interest subvention of 3 per cent is made available to the farmers who repay the loan within one year from the date of disbursement of the crop loan or by the due date fixed by the bank for repayment, whichever is earlier, subject to a maximum period of one year from the date of disbursement. This also implies that the farmers who pay promptly would get short-term crop loans at 4 per cent per annum. This benefit would not accrue to those farmers who repay after one year of availing such loans. • Further, with regard to the Kisan Credit Card (KCC) scheme, the GoI has clarified that loans granted only for categories (i) and (ii) (given below), out of the following six categories, are covered under the Interest Subvention Scheme, which should be computed and segregated accordingly for claiming reimbursement of the interest subvention: -
To meet the short-term credit requirements for cultivation of crops; -
For post-harvest expenses; -
Produce marketing loan; -
To meet the consumption requirements of farmer households; -
For working capital for maintenance of farm assets and activities allied to agriculture, like dairy animals, inland fishery, etc.; -
To meet investment credit requirements for agriculture and allied activities like pump sets, sprayers, dairy animals, etc. • The benefits of interest subvention are available to small and marginal farmers holding KCCs for an additional period of up to six months, post-harvest, against negotiable warehouse receipt for having kept their produce in warehouses. Before moving on to the findings with regard to the Interest Subvention Scheme, it is useful to look at the existing literature on the subject. 1.2 A Brief Review of the Literature and Research Gaps The literature on interest rate subvention schemes for crop loans, especially pertaining to India, is rather limited. Several studies, however, concentrate on the agrarian credit market in developing countries in general and the Indian agricultural credit market in particular (see Bardhan, 1989; Bell and Srinivasan, 1989). Although there has been a decline in the share of rural population in the total over time, 60 per cent of the population still lives in rural areas and depends mainly on agriculture, majority of which are small or marginal farmers. For this group of farmers, facing land and liquidity constraints in the risky and fluctuating production environment of Indian agriculture, credit remains a crucial input (Srinivasan, 1989). Amongst a few studies in the Indian context, Mitra et al. (1986) look at the causes of rural indebtedness in the state of Assam. As the nature of rural indebtedness largely depends on the state of the formal banking sector in rural areas, Ramachandran and Swaminathan (2001) examine the role of the rural banking sector in India. Historically, after the nationalisation of 14 major Indian banks on July 19, 1969, commercial banks were entrusted with the task of meeting the credit needs of the hitherto neglected rural masses (Rajeev and Mahesh, 2014). These banks were to provide credit to the neediest and reduce the role of informal lenders in the market. Formal banking institutions, thus, became an important source of credit to the agricultural sector, though it coexisted with the informal sector where interest rates were much higher (Stiglitz and Hoff, 1990). There are however a number of problems with the formal sector as noted by scholars. It is frequently observed that formal credit is not available at the beginning of a crop cycle when it is needed more (Gupta and Chauduri, 1997). Another serious problem in the formal credit market mentioned by some authors is that the officials of the formal credit institutions, who are in charge of disbursement of credit, often deliberately undertake dilatory tactics to seek bribes from farmers (ibid.; Benjamin, 1981; Lele, 1981). Because of these problems, in spite of the considerable expansion of the rural formal credit network, informal lenders still thrive in the agricultural credit market (NSSO, 2003). This is true not only in India but also in other developing nations including Pakistan (Aleem, 1990), Thailand (Siamwalla et al., 1990) and the African nations (Udry, 1990). The informal credit market has also undergone certain changes in the recent past. In the changing credit scenario, traditional landlords and moneylenders (Bhaduri, 1977 and Gangopadhyay and Sengupta, 1987) are fading away and a new class of lenders, who are the dealers of working capital have emerged (Rajeev and Deb, 2006). Due to their market power, they can charge a higher interest rate and their loan contracts are adverse towards comparatively smaller borrowers (ibid.). Exploitation by village moneylenders has been discussed by Basu (1989), who theoretically establishes that the rate of interest charged by an informal lender is lower if the loan size is greater, which in turn puts small borrowers are at a disadvantageous position. Unequal access to capital and hierarchies in an agrarian system are illustrated in the study by Eswaran and Katowal (1990) as well. Thus, one can see that while there are studies on Indian agricultural credit market, not many studies have dealt directly with the issue of effectiveness of the subvention scheme, and most of these studies are also dated. Additionally, while the incentives for prompt repayment are included to inculcate a habit of timely repayment, it would be of interest to study whether the formation of such a habit is negatively impacted by loan waiver schemes initiated by various state governments from time to time. Loan waivers create the problem of moral hazard among farmers for repayment, as it rewards those who have not repaid loans, providing incentives to farmers to avoid repayment until another loan waiver is initiated. A field-based survey is required to look at the ground level scenario concerning some of these pertinent issues. 1.3 Researchable Issues and Objectives Researchable issues on the subject at hand can be classified under three major headings. 1.3.1 Financial Accessibility First, it is important to note that in order to benefit from this facility, farmers need to access the formal banking sector, especially for obtaining credit. Secondly, she/he needs to repay the loan on time, failing which higher interest rates will be charged for the entire period (i.e. they will not be able to take benefit of the prompt repayment scheme). Given that such facilities are intended to benefit the poor, it is necessary to examine whether small and marginal farmers are able to access credit facilities from the formal sector and benefit from the subvention scheme. One of our earlier studies in Karnataka has revealed that financial accessibility in terms of credit is limited for small and marginal farmers primarily due to lack of land records (Rajeev et al., 2011). Thus, whether the intended beneficiaries have benefited from the programme or not needs to be ascertained. 1.3.2 Financial Literacy In any scheme for rural areas, ensuring proper flow of information to the ultimate beneficiary is a major challenge. This is seen in the case of the KCC scheme as well, where the intended beneficiaries of the scheme were unaware of its benefits (Rajeev and Vani, 2012). The success of the subvention scheme, thus, to a great extent, depends on information dissemination among the small and marginal farmers. As mentioned earlier, the subvention facility is further extended to prompt re-payers whereby those farmers can subsequently get the loan at 4 per cent interest rate. Given the fact that Indian farmers are used to loan waivers from time to time, the important question that arises is whether the scheme has been successful in conveying this information to the farmers and inculcating the habit of timely repayment in them. 1.3.3 Financial Integrity Given that the farmers are often cash starved, it is necessary to examine whether the credit under this scheme has been utilised for the stated purpose or diverted to other uses. Diversions can be for different purposes, including: -
For production/income generating purposes, other than for the purchase of intermediate goods for agriculture (as prescribed for a short-term crop loan). -
For essential consumption purposes such as education or health. -
There could be other diversion as well, given the linkages between formal and informal credit markets in the rural economy. There is a possibility that, one borrows from the formal sector to take advantage of arbitrage opportunity by lending it in the informal credit market at a higher interest rate. Thus, the major issues, in a nutshell, are: Is the credit with subsidised interest rate really being used for the stated purposes, i.e., for agricultural (short-term loan) activities? If not, what other activities are the credit being channelled to? 1.3.4 Objectives Access to Credit -
To examine how far small and marginal farmers are able to avail the benefits of the subvention scheme. -
To identify the major impediments to accessing credit by the needy. -
To evaluate the usage and utility of the prompt repayment scheme. Credit Sources and their Problems and Prospects Financial Literacy -
To critically analyse the aspect of financial literacy of small and marginal farmers with respect to the subvention scheme and prompt repayment scheme. -
To find whether there is a problem of information, and if so, how this problem can be addressed. Financial Integrity - To examine the aspects of proper utilisation of the funds and diversion of funds, if any. The reasons for diversion of funds are assessed wherever relevant.
Policy Suggestion - To suggest possible remedies for existing problems to make the policy more effective.
1.3.5 Methods The study utilises the 59th and 70th Rounds of NSSO debt and investment survey data to understand the macro-level scenario pertaining to access to credit and its utilisation. The sample size of NSSO being large, state-level parameters can be estimated by analysing the unit record data. However, NSSO data do not highlight the problems faced by the farmers and the possible remedial measures, for which a primary survey of limited size has been undertaken. For the primary survey, respondents include individuals from the following groups: The state of Karnataka has been selected for the study due to the reasons discussed above (and also as per the terms of reference of the study). A total of four districts consisting – one agriculturally backward; one forward; and two middle performing – have been chosen from the state for the survey (after discussion with the RBI during the project initiation seminar). From each district, one rural branch of a prominent bank of the district was visited and data on the borrowers were collected in the format available with the bank. A multi-stage sampling technique was used to select the farmers, first by selecting a district, then the villages within a district and, finally, households within a village. A total of 320 respondents were finally selected through a stratified random sampling technique with a view to incorporate different groups of farmers: small and marginal vis-à-vis medium and large (a more detailed discussion is presented in Chapter 6). The next chapter of the study presents a brief review of the existing literature. Chapter 3 provides a detailed analysis of NSSO data over time, for India as well as for the state of Karnataka, to understand credit accessibility at the macro level by different groups of farmers classified in terms of economic and social conditions. Terms and conditions of loans and re-lending possibilities are examined in Chapter 4. In Chapter 5, we present certain data collected from banks in our study areas to understand the scenario on the ground with regard to credit disbursement and gold loans. Chapters 6 and 7 are based on our field survey of farmer households. The last chapter offers conclusions and policy suggestions, again based on our survey of the various stakeholders. CHAPTER 2: Review of the Literature 2.1 Introduction Presently, there are only a few studies on the effectiveness of interest subsidies in the agricultural sector in India. However, some authors have studied the credit market in the agricultural sector in the country, including subsidies given for agriculture, especially through fertilizer and irrigation (electricity). Theoretically, while talking about the need for state intervention in the agricultural sector, Stiglitz (1987) argues that agricultural markets are characterised by high risks with regard to both output and prices. Hence, the interest rate for obtaining credit will be high (if left to the market), which per se is not a market failure, given that the probability of default is high (ibid.). At the same time, the existence of imperfect information on the kind of risks involved in credit – given that there are different individuals involved from different states and producing different kinds of crops (the adverse selection problem, where the farmer is likely to be better informed about the hazard) – and on the behaviour of the borrowing individuals cannot be ignored. This means that the market equilibrium is not, in general, pareto efficient (ibid.). Therefore, farmers’ access to credit remains limited in the absence of governmental intervention and state intervention is needed to make credit available to the farmers. 2.2 Development of the Indian Agricultural Sector: Investments versus Subsidies Subsidies and public investments have been an integral feature of the agricultural sector’s development in India. Fan et al. (2007), review the trends in subsidies and public investment in the agricultural sector in India and empirically estimate the relative impact that the various subsidy schemes and public investments have had on agricultural growth and poverty reduction in rural areas. By definition, government investments in agriculture are often equated with the public sector gross fixed capital formation (GFCF) in the agricultural sector. There is, however, a distinction between investments made in and for agriculture (Fan et al., 2007). Accordingly, investments made in agriculture primarily comprise irrigation projects alongside small-scale projects in horticulture and livestock and the development of state farms. On the other hand, government expenditure on agricultural related research and development (R&D), development of rural infrastructure like roads, education, etc. are considered as public investments made for agricultural growth, whether directly or indirectly (Dantwala, 1986). In this context, a declining trend is observed in the quantum of public investments which is rather disheartening because there is evidence to prove that it has had a positive effect on agricultural productivity. For instance, in the early 1980s the shares of public and private sectors in the creation of the Gross Capital Formation in agriculture were roughly equal. However, by the early 2000s the share of the public sector in the creation of GFCF had shrunk to nearly one-third the share of the private sector, at 1993–94 real prices (Gulati and Bathla, 2002). Owing to reductions in public expenditure for irrigation in the 1980s and 1990s, the growth in farmland irrigated through publicly funded schemes tapered down, resulting in a severe shortage of irrigation water and leaving in a large number of unfinished irrigation projects. Furthermore, even the investments in education, rural road infrastructure and electricity have continued to decline over the years (Fan et al., 2007). On the other hand, input and output subsidies in agriculture have seen an increasing trend over the years. The numerous input subsidies can be grouped into subsidies for fertilizer, credit, irrigation and power. For instance, in the total central government subsidy outlay, the share of fertilizer subsidy increased from 6.3 per cent to more than 50 per cent between 1976 and 2000, and the increased volume of fertilizer subsidy amounts to more than five times the government spending on agricultural R&D. Similarly, with the nationalisation of commercial banks and their entry into the agricultural credit, the share of credit disbursed by commercial banks increased from 3 per cent in 1967 to 15 per cent by the early 1990s (ibid.). Given this scenario, Fan et al. (2007), estimated the marginal impact of investments and subsidies on agricultural growth and poverty reduction, as shown in Table 2.1. | Table 2.1: Returns to Various Public Investments and Subsidies | | | 1960s | 1970s | 1980s | 1990s | | | Returns | Rank | Returns | Rank | Returns | Rank | Returns | Rank | | Rupee increase in agricultural GDP per rupee invested in each type of infrastructure/facility | | Road Investment | 8.79 | 1 | 3.8 | 3 | 3.03 | 5 | 3.17 | 2 | | Educational Investment | 5.97 | 2 | 7.88 | 1 | 3.88 | 3 | 1.53 | 3 | | Irrigation Investment | 2.65 | 5 | 2.1 | 5 | 3.61 | 4 | 1.41 | 4 | | Irrigation Subsidies | 2.24 | 7 | 1.22 | 7 | 2.28 | 6 | n.s | 8 | | Fertilizer Subsidies | 2.41 | 6 | 3.03 | 4 | 0.88 | 8 | 0.53 | 7 | | Power Subsidies | 1.18 | 8 | 0.95 | 8 | 1.66 | 7 | 0.58 | 6 | | Credit Subsidies | 3.86 | 3 | 1.68 | 6 | 5.2 | 2 | 0.89 | 5 | | Agricultural R&D | 3.12 | 4 | 5.9 | 2 | 6.95 | 1 | 6.93 | 1 | | Returns in Rural Poverty Reduction (Decrease in number of poor per million ₹ spent) | | Road Investment | 1272 | 1 | 1346 | 1 | 295 | 3 | 335 | 1 | | Educational Investment | 411 | 2 | 469 | 2 | 447 | 1 | 109 | 3 | | Irrigation Investment | 182 | 5 | 125 | 5 | 197 | 5 | 67 | 4 | | Irrigation Subsidies | 149 | 7 | 68 | 7 | 113 | 6 | n.a | 8 | | Fertilizer Subsidies | 166 | 6 | 181 | 4 | 48 | 8 | 24 | 7 | | Power Subsidies | 79 | 8 | 52 | 8 | 83 | 7 | 27 | 6 | | Credit Subsidies | 257 | 3 | 93 | 6 | 259 | 4 | 42 | 5 | | Agricultural R&D | 207 | 4 | 326 | 3 | 345 | 2 | 323 | 2 | | Source: Fan et al., 2007 | Their findings suggest that during the three decades prior to 1990s, all subsidies and investments yielded high returns and furthered the cause of poverty reduction. However, by the 1990s only agricultural R&D and rural road infrastructural investments continued to yield estimated returns of more than 300 per cent, while credit, power and fertilizer subsidies recorded negative net returns (concluded by Fan et al., 2007) and subsidies on irrigation had no significant impact on either agricultural production or rural poverty reduction. Hence, in the long run, public investments in agriculture can be most effective in promoting agricultural growth and poverty reduction. Therefore, they recommend that government subsidies, which constitute nearly 2 per cent of the national GDP, must be cut since subsidies have been unproductive, financially unsustainable and have crowded out more productive government investments in agricultural R&D, rural infrastructure and education. 2.3 Credit Subsidy in the Indian Agricultural Sector In India, credit subsidy in the agricultural sector consists of two components, i.e., interest subsidy and default subsidy. According to a study by Gulati (1989), the interest subsidy can be estimated easily by calculating the difference between interest rates being paid by farmers and retail traders. On the other hand, the default subsidy estimation is a difficult task due to the lack of data on eventual bad debts. Instead, the study makes an informed assumption that nearly 40 per cent of overdues with more than three years of default history usually gets written off (ibid.). Additionally, it was found that earlier the interest rates being charged from the agricultural sector on production credit were much higher than those on investment credit. The interest rates on production credit further varied with the size of the loan. The estimated weighted interest rate charged by commercial banks from farmers was about 12.7 per cent in 1981 (Morris, 1985). Subsequently, through government intervention, agricultural lending rates were decreased, which further would have led to the cross-subsidisation of other agricultural operations (Binswanger and Khandker, 1995). However, formal credit flows are often subject to delays, and this often leads to high interest rates in the informal credit markets on which the farmers rely (Chaudhuri and Gupta, 1996). Empirical evidence also shows that lack of access to government-subsidised formal credit is the underlying reason for the observed differences in farm productivity in rural India (Kochar, 1997). 2.4 Relation Between Credit and Agricultural Productivity: The Chinese Experience For the agriculture sector in China, too, credit is an important factor (Feder et al., 1990). It allows the farmers to fulfil the requirements of the agricultural production cycle, where income is received only after the harvest, while expenditure on inputs like fertilizer, seeds, etc., must be met in advance. Thus, the availability of credit allows for greater use of purchased inputs and consumption by farmers and helps in increasing their welfare (ibid.). However, Feder et al. (1990) emphasise that when the government intervenes in the agricultural credit market by fixing interest rate ceilings or by subsidising interest rates, it necessitates the rationing of credit available to the farmers. Credit rationing further results in some borrowers not being able to obtain the amount of credit they need at the prevailing interest rate, even when they are willing to pay a higher rate of interest to secure adequate credit. Therefore, cash shortages due to non-availability of credit become a binding constraint on the production capacity of farmers since the inputs used deviate from optimal levels and thereby decrease yield, because of the fixed nature of land in the production cycle (ibid.). This assumption is tested in this paper, taking note of the fact that the volume of liquidity obtained from informal sources was substantial in the case of China. The sample based on which credit constraint is ascertained in this study is illustrated in Table 2.2 which shows that amongst farmers who borrowed from a formal agency, 41 per cent felt that they are credit constrained. | Table 2.2: Credit Constraints faced by Households in a survey in China | | Category | Sample size
(No. of Households) | Credit constraint Household
(per cent of total Households) | | Borrowers | 145 | 41.3 | | Non-borrowers | 42 | 28.3 | | All | 187 | 37.4 | | Source: Feder et al., 1990. | Formal credit agencies dealing with agriculture sector face the problem of asymmetric information and moral hazard due to a large number of small and marginal farmers being present in the sector in most developing economies. This problem has been highlighted both theoretically and empirically in the literature. 2.5 Difficulties in Developing the Agricultural Credit Market Agricultural credit markets are imperfect because of asymmetric information, and due to the existence of moral hazard problems. Loan contracts are also difficult to enforce (Besley, 1994). Agriculture has important spatial and risk characteristics, and hence, the need for credit rationing arises for this sector (Stiglitz and Weiss, 1981). In order to develop effective policies for financing credit, one needs to understand how sensitive borrowers are to interest rates when compared to other factors affecting the demand for credit. However, it is difficult to determine the impact of interest rates on demand for agricultural credit subsidy because credit can be sought for a multitude of other reasons such as consumption smoothing, education and health expenditures. Another question that must be answered is whether the rate of return in agriculture justifies the high interest rates that banks demand in the absence of government intervention (Meyer, 2011). There have been multiple studies that have attempted to directly measure the sensitivity of credit demand to interest rates. Yet it is difficult to generalise the behaviour of the borrowing farmers since each study represents a unique situation, where there is every possibility of co-existence of farmers with very high and very low rates of agricultural return. Transaction costs of borrowing, the complex bureaucratic administrative procedures involved, access to other informal sources, credit rationing size, and repayment schedules may all have an impact on the sensitivity to interest rates as well (Meyer, 2011). A study by Turvey (2010) provides evidence to show that higher risk farms in rural China have lower credit demand elasticity, while farmers with better revenues have more elastic demand for credit. Furthermore, there are cases where households with higher savings rates had more inelastic demand than households with lower saving rates, this implies that high savings groups substitute investments through savings by taking loans, while low savings groups consider savings and credit as complementary financial instruments. Also, the elasticity of demand for credit, in some studies, was found to be higher for consumption goods than for agricultural investments, suggesting that interest rate policies have a greater impact on consumption than productive agricultural yield (ibid.). Hence, in this environment of diverse responses of the farmers to the interest rate, it is an impossible task to fix an interest rate that would discourage farmers not having genuine credit need for borrowing and support those who desperately need it for sustaining their productivity. The challenges of interest subvention policy are explored in the following section. 2.6 What is Interest Subvention? The literary meaning of subvention is a grant of financial support, and therefore, interest subvention becomes a form of a waiver of some percentage of interest, such that it promotes growth in a targeted sector on account of public interest. Interest subvention schemes are implemented with the help of funds allocated by the government. In the agricultural sector, such schemes are often floated in order to enhance the loan repayment ability of the farmers. The repayment amounts of the borrower are scaled down by the percentage of interest subvention granted by the government, and hence, the scheme supposedly benefits both the end consumer and the sector as a whole. In India, the Interest Subvention Scheme for short term crop loan offers short-term crop loans to farmers at 7 per cent rate of interest, with the government compensating the banks for the remaining 2 per cent of the applicable 9 per cent interest. On timely repayment of the loan, the farmer will be able to avail a further subvention of 3 per cent, thus bringing down the effective rate of interest for the borrower to 4 per cent (GoI, 2015). As a point of comparison, small- and medium-scale enterprises (manufacturing or services) paid interest at almost double the effective rate for farmers (nearly 13 to 14 per cent). However, there is a dearth of literature that tries to understand the extent to which the intended beneficiaries avail the scheme. What are the existing lacunas, if any, that need to be addressed? This study intends to fill this gap by analysing unit record household level data from NSSO as well as information collected from the field survey. CHAPTER 3: Farmers’ Indebtedness and Access to Credit in India and
Karnataka: Evidence from NSSO Data 3.1 Introduction To have an understanding of access to credit at the macroeconomic level, this chapter presents the results of NSSO data analysis where the details of data sources are noted in Section 3.2. In order to examine accessibility of financial services, especially credit, by farmers of different economic classes, the indebtedness scenario is examined by classifying farmer households according to their landholding sizes. The analysis is further extended to incorporate various social classes to which the households belong, such as Scheduled Caste (SC) or Scheduled Tribe (ST) or households headed by a woman. The chapter presents an all-India scenario together with selected state-level analyses. Further the situation prevailing in the state of Karnataka has been highlighted. Finally, the chapter provides an econometric analysis based on recent data (NSSO 70th Round) to identify the factors that determine access to credit by the farmer households, thereby also establishing the statistical significance of some of the observations made previously through descriptive analyses. 3.2 Data Source The Ministry of Agriculture and Farmers’ Welfare conducted a comprehensive assessment of the economic situation of farmers in the country at the beginning of the millennium2. The motive was to understand various socioeconomic aspects relating to the farmers’ lives, including their standard of living, income and productive assets, farming practices and preferences, availability of resources, awareness of technical developments and access to modern technology in the field of agriculture, to mention a few. To provide the relevant information to the Ministry, the NSSO, as a part of the 59th Round, conducted the Situation Assessment Survey (SAS) of farmers from January to December 2003. The survey was conducted only in the rural areas of the country. Farmer households numbering 51,770 were surveyed in the central sample, while only seven states participated in the state sample which did not include Karnataka. Hence, strictly speaking, reliable estimates cannot be expected at the district level and, consequently, most of the analysis in this study is at the state level. Subsequently, NSSO’s 70th Round (2012–13) was completed and data from this survey has now become publicly available. It is, therefore, considered worthwhile to examine unit record data from this new source in order to understand the recent scenario. There are, however, certain differences in the way in which questions were asked in these two consecutive rounds. In particular, the 59th round analysis is primarily based on the SAS of farmer households. But in the new round, SAS of farmer households does not provide much information relevant to the current research work. Hence, data on farmer households has been culled out from the ‘Debt and Investment Survey’ of the 70th Round. The sample sizes of farmer households obtained from the Debt and Investment Survey were 43,254 and 1,483 for all-India and the state of Karnataka, respectively. The 70th Round titled ‘All-India Debt and Investment Survey (AIDIS)’ was carried out from January to December 2013. The information was collected from selected sample households by visiting each household twice. The survey period for the first visit was seven months, i.e., January to July 2013, and for the second visit was five months, i.e., from August to December 2013. In each visit, the assets and liabilities of the household were ascertained with a fixed reference date for all the households: 30th June 2012 for the first visit and 30th June 2013 for the second visit. Rural households were classified into farmer households and non-farmer households based on whether a household operated any land for agricultural activities during the last 365 days. 3.3 All India and Inter-State Analysis (59th Round) The NSSO provides information on the percentage of farmers who have outstanding credit on the date of survey, and this indicator is termed as the incidence of indebtedness (IOI). In addition, there is information on borrowings by farmers. A careful analysis of the data reveals that the richer states have higher levels of indebtedness, and similarly, richer farmers are more indebted. It is observed that socially backward classes or relatively weaker sections in terms of caste and gender also have lower indebtedness. From such evidence, it can be safely judged that IOI points more towards access to credit rather than a distress situation of inability to repay, even though the latter possibility cannot be fully ruled out. At the all-India level, according to the data from the 59th Round, the incidence of indebtedness was 48.6 per cent with an average outstanding debt per farmer household of ₹12,585. This figure rises to ₹25,891 if we consider only indebted households. As discussed earlier, if indebtedness can be taken as a proxy for access to credit, then it would imply that only around 49 per cent of the farmer households have accessed credit either from a formal or an informal source. IOI across different landholdings (for the 59th Round, see Figure 3.1) shows that access to credit increases with the size of landholdings. Further, one can broadly say that more than 50 per cent of marginal and small farmers do not have access to credit. This may not be only due to lack of creditworthiness, but also because of multiple factors such as financial literacy. 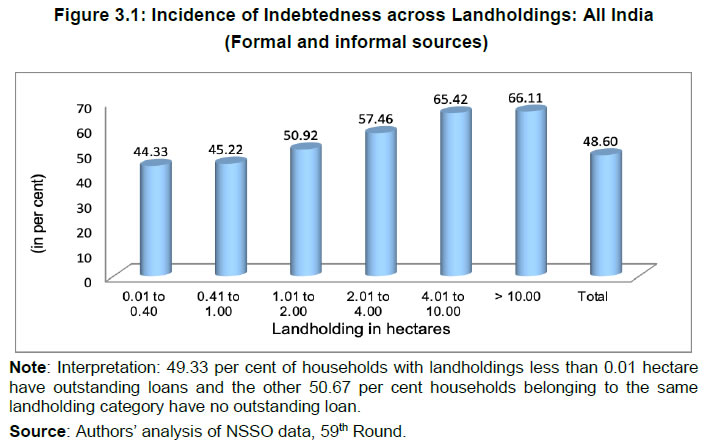 Though very small (less than 0.01 hectare group) farmers showed a little higher indebtedness, subsequent analysis revealed that this was primarily due to loans from the informal sector. They received 24 per cent of their credit from formal sources, while 76 per cent was from informal lenders (Table A3.1 in the Appendix). These two observations are somewhat disturbing as the objective of priority sector lending is somewhat diluted if it cannot provide financial services to the small and marginal farmers adequately. From such an aggregative picture moving to the regional level is necessary for a better understanding of the problems and policy implications. Inter-state analysis indicates a wide variation across states, making it clear that state-wise measures towards addressing the problems need to differ. All the four southern states and Punjab possess IOI greater than 60 per cent, while the north-eastern states show much lower figures. It should be noted that the southern states and Punjab have a good banking network, which possibly results in such high percentages (see Table A3.2 in the Appendix). Uttaranchal has the lowest IOI at 7.2 per cent. This observation also indicates that economic achievements of a state have considerable effects on the access to financial services and both may be impacting each other. The above analysis is based on the access to credit, both from formal and informal sources taken together. Though any source of finance may be useful for a farmer, access from formal sources is of considerably more importance given the adverse terms and conditions of the informal sources. It is, thus, necessary to have a disaggregated household level analysis based on sources of credit. Such an analysis reveals that, at an all-India level, around 58 per cent of credit supplied to the indebted households is sourced from formal sources and the rest, i.e., 42 per cent, is from informal sources, pointing to a large presence of informal lenders in the agrarian sector. As can be seen from Figure 3.2, commercial banks play a major role in the formal sector (35 per cent) and moneylenders are the largest suppliers of credit among the informal sources (26 per cent). 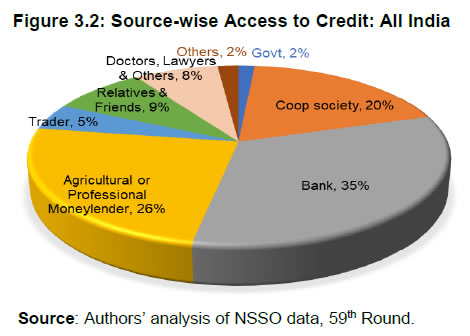 There are significant inter-state variations in the share of households accessing formal credit to IOI. Amongst the indebted farmers, Andhra Pradesh has the lowest (i.e. 31 per cent) and Kerala and Maharashtra the highest (i.e. around 83 per cent proportion of farmers accessing formal sources of credit (Figure 3.3). It is interesting to note that even though access to credit is quite high in Andhra Pradesh, most of it is from informal sources, revealing that an aggregative picture may conceal certain noteworthy variations. A further disaggregated analysis of sources within the formal sector shows that in the states of Maharashtra, Gujarat, Kerala, Haryana and Tamil Nadu, cooperative societies have played a major role in providing credit to the farmers. 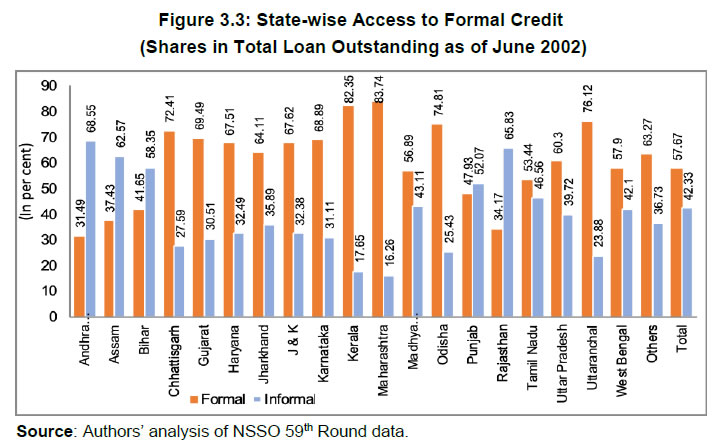 The figures for usage of the credit availed by farmers for different purposes at the all-India level reveal that 65 per cent of the credit is used for income generating purposes and only 35 per cent is used for non-income generating purposes (Figure 3.4). Among the non-income generating category, expenditure on marriage and ceremonies tops the list. 3.3.1 Access to and Usage of Credit across Landholdings A further analysis of NSSO data revealed that there are wide variations across states in access to credit from formal sources. In most of the states, marginal and small farmers relied heavily on the informal sources for their credit needs, i.e. to the tune of 70 per cent. The share of usage of credit by marginal and small farmers in most states for income generating purposes is low, especially among economically backward states. Greater dependence on informal credit at a high- interest rate coupled with less use of it for income generating activities has a high probability of pushing farmers into a debt trap. Thus, formal credit institutions face a challenging task in reaching out to the economically backward regions and sections. 3.3.2 Access and Usage of Credit across Social Groups In addition to economic status, an analysis in terms of social category and gender assumes considerable importance as inequality in access with respect to these classes, if any, needs to be identified so as to be curtailed. In this regard, an analysis based on formal versus informal sources in access to credit is quite revealing. In particular, access to formal credit is seen to be quite high for the general category (66 per cent) and the lowest for the SC category at 46 per cent. Among women-headed farmer households, access to formal credit was similarly low and only 46 per cent had access to formal sources (see Tables A3.3a and A3.3b in the Appendix). Both SC and women-headed farmer households categories have used a relatively lesser share of credit for income generating activities. Even though, at the all-India level, the share of credit from formal sources is quite low for SC category farmer households, a wide variation is seen in credit off-take across states. An analysis of state-level data reveals that in the states such as Maharashtra, Kerala, Odisha, Chhattisgarh and others indebted SC households have obtained more than 70 per cent of their credit from formal sources. 3.4 The Indebtedness Scenario in Karnataka The state-level analysis discussed above reveals that households in Karnataka have a satisfactory level of access to credit, and the state can, therefore, be considered as a ‘middle performing’ state. However, there exist variations in access to credit, and its terms and conditions, across various social groups and weaker sections. 3.4.1 Sources of Borrowing The sources of borrowing are classified into two broad groups, viz. formal and informal. The government, cooperative societies and banks come under the category of formal sources, while moneylenders, traders, relatives and friends, doctors, lawyers and others come under the informal category. The outstanding debt in many states including Karnataka is financed more by formal sources than by informal sources (see Figures 3.5 and 3.3). Commercial banks have played a major role by financing 50 per cent of the outstanding loans (in forms of amount), while 17 per cent have been provided by cooperative banks, and a small portion, i.e. 2 per cent, by government sources. The remaining 31 per cent of outstanding loans were provided by informal sources within which moneylenders are the major players – they financed 20 per cent of the total debt. The modal interest rate is 36 per cent for moneylenders and roughly 1/4th of the loans taken from them are at an interest rate of 60 per cent. 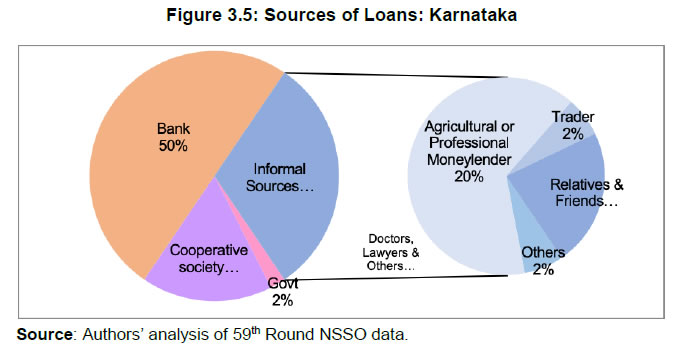 Even in terms of the number of loans (see Table A3.4 in the Appendix), it was found that 52 per cent of loans are from formal sources (21 per cent from cooperatives and 29 per cent from commercial banks) and the rest are from various informal sources. The median amount of outstanding loan per borrower from the formal sector is around ₹15,000, while it is only ₹8,000 per borrower from informal sources (Table A3.4). Our analysis of access to formal credit amongst the indebted households shows that farmers with low land holdings (up to 0.4 hectare) and low per capita consumption expenditure (up to ₹420) have relatively lower share (Table A3.5 and Table A3.6 in the Appendix to Chapter 3). 3.4.2 Purpose of Borrowing Coming to activity-wise usage of loans, it is observed that the share of loans taken for income generating activities is as high as 78 per cent (Fig. 3.6). Within income generating activities, current expenditure in farm business forms the major category and nearly 3/4th of the loans for this category are financed by formal agencies, and the modal interest rate faced by the borrowers is 12 per cent. The next important category is capital expenditure in the farm business, and here too more than 3/4th of the loan is from formal agencies. Among income generating activities, non-farm business accounts form the lowest category, accounting for only 10 per cent of the outstanding loan. This category, however, has the highest average or the median sum of the outstanding loan. The formal sector plays a major role in financing too, and borrowers face a (modal) 16 per cent rate of interest. 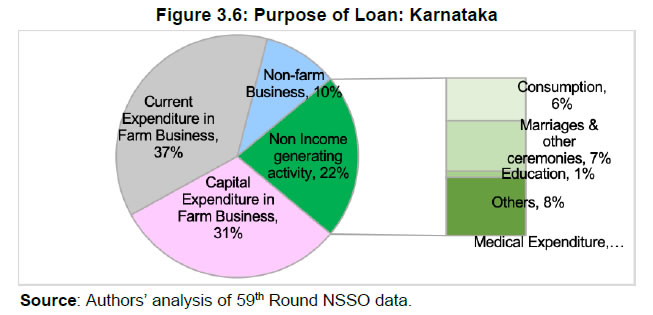 Within the category of non-income generating activities, loans for marriages and ceremonies and consumption account for a major part as in the case of All India. The sources for these loans are mostly informal agencies and the borrowers face high-interest rates with a modal value of 36 per cent. The average amount borrowed for marriages and ceremonies is also quite high. The borrowers under these categories not only face a high rate of interest, but the fact that these categories do not generate any income can also be a cause for farmers’ distress. 3.4.3 Region-wise Debt In order to understand regional variations, a district-level analysis was deemed useful even though the data available was limited. Across districts, a wide variation was noticed in the incidence of indebtedness. IOI ranged from 93.7 per cent, in Chamarajanagar, to 24.9 per cent in Bangalore. It was also seen that most districts where IOI is above 70 per cent are agriculturally well developed, either with plantation crops (e.g. districts of Kodagu, Shimoga and Chikmagalur, etc.), or with highly irrigated areas growing input-intensive food grain crops (e.g. districts of Mysore, Mandya, Hassan, etc.). On the other hand, districts like Chamarajanagar, Haveri and Uttara Kannada are not very developed agriculturally, but still have high IOI. Here, it is worth noting that poverty ratios are also quite high in Haveri and Uttara Kannada districts (Figure 3.7). Most of the districts with high IOI are also better banked districts and the average loan per household in some of these districts is quite high. Thus, it can be said that either IOI or average amount of borrowing could be taken as an indication of backwardness or distress if it is coupled with high poverty and low development. The districts with very low IOI and a high poverty ratio are the ones where the absorption capacity is low. An analysis at the disaggregated level, done either in terms of the economic status of the households, i.e. landholding or per capita consumption expenditure, or at the social level, i.e. in terms of backward castes (SCs/STs/OBCS), may throw more light on the distress picture. However, data limitations preclude an exercise of this nature. 3.4.4 Debt Pattern across Economic Classes: According to Land Holdings In Karnataka, 53.0 per cent of farmer households belong to the category of marginal landholders, another 21.2 per cent are small farmers and the remaining 25.8 per cent are medium and large farmers. It is observed that the incidence of indebtedness increases with the size of the landholding. Out of the total number of outstanding loans, marginal farmers hold only 34 per cent and small farmers hold 18 per cent. As can be seen from Table A3.5 in the Appendix, the share of formal financial institutions in the loans availed by marginal farmers of low land holdings (up to landholding of 0.4 hectares) is quite low and they also face a high rate of interest. The modal interest rate faced by marginal farmers is 36 per cent, whereas for the larger landholding categories it is around 12 to 14 per cent. According to Expenditure Class A reclassification of households on the basis of monthly per capita consumption expenditure (MPCE) into three groups, i.e., per capita expenditure class of less than ₹300 (people with abject poverty), ₹300 to ₹420 (in and around the poverty line), and above ₹420 (the relatively better off class), shows that farmers who are the poorest MPCE class, i.e., below ₹300, have low access to formal credit. In particular, 71 per cent of their borrowings are from informal sources (Table A3.6 in the Appendix) and thus they end up paying a high interest rate of around 36 per cent. The average outstanding loan for this class is also quite low amounting to about one-third of the average loan outstanding for the better off farmers. Further, 35 per cent of the farmers are in and around the poverty line (falling in the MPCE class of ₹300 to ₹420) (Table A3.6) and their share in the total outstanding debt is 22 per cent. 3.5 Analysis of NSSO 70th Round Data Moving on to the more recent scenario, we analyse the incidence of indebtedness of farmer households having outstanding credit as on the date of the survey and the share of institutional and non-institutional sources in providing this credit (Table A3.7 and A3.12 in the Appendix). Also presented in Table A3.7 are the percentages of households that have borrowed since the year 2000. Though figures of borrowings are available for several years, the study considers borrowings since the year 2000 (figures for years prior to 2000 are a negligible number, and hence not considered). It is, however, to be noted that most of the outstanding credit (more than 80 percent) refers to borrowings that took place during 2011–13. Thus, the analysis presented in table A3.7 displays to a large extent the situation during 2011–13. The data reveals that as of June 30, 2012 (that is the reference period), 34 million out of 97 million farmer households were observed to be indebted, i.e. have outstanding credit, and, consequently, the IOI is 35 per cent at the all-India level. As far as borrowing is concerned, 54 per cent of farmer households have borrowed either from an institutional agency or a non-institutional agency. Average loan outstanding per household is ₹77,089, and per indebted household is ₹2,20,280. One noteworthy feature between the NSSO 59th and 70th Rounds is that the amount of loan outstanding per borrower has increased substantially, i.e. from ₹25,891 to ₹2,20,280. A state-level comparison indicates that the incidence of indebtedness is the highest in Telangana, followed by Andhra Pradesh (Table A3.7). These results also corroborate what we had noticed from the 59th Round (2003) NSSO survey. All the southern states have IOI greater than 50 per cent and have also witnessed a high prevalence of borrowing. The incidence of borrowing figures is higher than IOI, as loans fully repaid will not be included in IOI (but will be captured under borrowing); however, as expected, there is a strong correlation between the two. The correlation coefficient between the incidence of indebtedness and incidence of borrowing was 0.96. The southern states not only have high IOI but also witness high average debt. Kerala tops the list with an average outstanding loan per farmer household of ₹3.4 lakh and an average debt per indebted household of ₹6.4 lakh (Table A3.7). Punjab has the second highest average debt per household. The majority of economically backward states showed a low incidence of borrowing and IOI, as well as low average debt per household. 3.5.1 Borrowing during Kharif Season Table A3.8 in the Appendix provides figures for the incidence of borrowing (IOB and IOI), as collected by NSSO for the period July to December 2012. IOB for the six months defined above was about half of the IOI, with some interstate variations. It can also be observed that Telangana, Andhra Pradesh, Kerala, Tamil Nadu and Puducherry had a high incidence of borrowing during the kharif season. Punjab’s IOB during this season was low, which may be attributed to wheat being grown mainly during the rabi season and possibly all loans taken by the farmers are not captured here. However, some rice-growing states like Tripura, West Bengal or Assam with a rather low IOB is a matter of concern. The state of West Bengal, for example, has a large share of small and marginal farmers who possibly hardly have any savings. 3.5.2 IOI and Borrowings across Different Landholdings Appendix Table A3.9 provides a comparison of data pertaining to IOI across different landholdings in Karnataka along with all-India figures. The percentage difference across different landholdings is clearly visible from the table. While 31 per cent of marginal farmers in case of India could access credit (both formal plus informal), this percentage was 53 for medium farmers. For large farmers, the corresponding figure is low possibly due to lower demand for credit, especially from informal sources. Thus, an inverted ‘U’ shape of indebtedness versus landholding size is clear for India, which was also seen during the 59th Round. In the case of Karnataka, however, the scenario is not so clear. While marginal farmers’ access (IOI) is lower than small, medium and large farmers, small farmers’ access is found to be at par with those in larger landholding groups. A comparison of borrowing trends across different social groups shows that at the all-India level, ST households have lower access than others with an IOI of 20 per cent, while OBC households have the highest IOI of 39 per cent (Table A3.10). Even in terms of the amount of credit that could be accessed, ST households have the lowest average loans of ₹117,063 while general caste households have an average loan amount of ₹294,477. In Karnataka, OBC households have the highest IOI figure of 59 per cent, followed by ST households with 54 per cent, general and other caste households with 45 per cent, and SC households with the lowest figure of 41 per cent. 3.5.3 Sources of Credit: Formal versus Informal Formal sources of credit include cooperative/ commercial banks, the government and SHGs, while non-institutional sources primarily comprises of friends and relatives, and moneylenders among other non-institutional lenders. It can be observed that at the all-India level, institutional and non-institutional sources have almost identical shares (viz. 49 per cent and 51 per cent) and the state of Karnataka closely mirrors this, while Kerala has a high share of institutional credit amounting to 72 per cent. On the other extreme is the state of Jammu and Kashmir (J&K) with nearly 70 per cent of loans received from non-institutional agencies (Table A3.11). Regarding the role of different entities/banks within the institutional sources category, cooperatives are found to have played a relatively more important role in states like Maharashtra, Gujarat, Kerala, and Punjab in providing loans to farmers. More than one-third of loans in these states come from cooperative societies. In most southern states, commercial banks and Regional Rural Banks have played a major role in providing credit to farmer households. Close to one-fourth of the loans in these states come from banks directly and indirectly through SHGs which are bank linked. On the other hand, moneylenders play a major role in most backward regions. On an average, at the all-India level, more than a quarter of borrowings comes from moneylenders (Table A3.12 in the Appendix), which is a rather large number. In terms of the amount of money lent (Figure 3.8), out of the ₹5100 billion, ₹1300 billion (26 per cent) is loaned by cooperative societies, ₹1500 billion (30 per cent) by commercial banks and another ₹1300 billion (26 per cent) by moneylenders at the all-India level. Other institutional agencies (7 per cent, 400 billion), relatives & friends (9 per cent, 500 billion) and other non-institutional agencies (2 per cent, 100 billion) constitute the rest of the sources of credit. 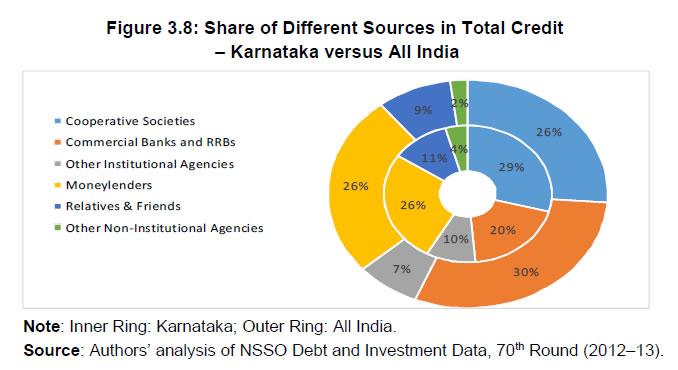 According to land-size disaggregation of borrowers (Figure 3.9 and Table A3.12 in the Appendix), one can see that commercial banks are more inclined to large farmers in providing loans while cooperative banks are relatively more unbiased in this regard. As already noted in the Indian case, amongst farmers who have accessed credit, 83 per cent of the total loans taken by large farmers are from institutional agencies, while around 60 per cent of marginal farmers’ loans are from institutional agencies. Farmers in general, and small and marginal farmers in particular, depend quite substantially on moneylenders. In Karnataka, too, access to institutional agencies for marginal farmers is relatively lower. Access is also low for large farmers, perhaps due to lack of demand. 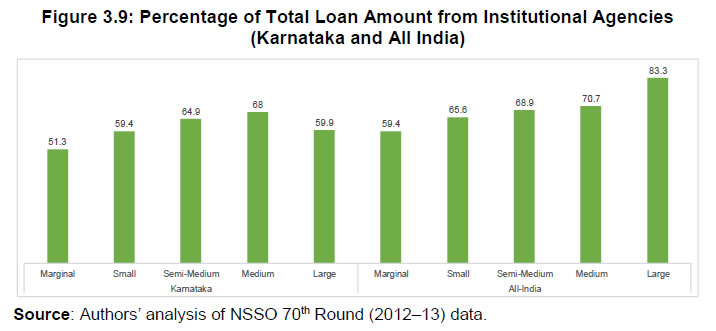 The purpose-wise utilisation pattern of credit from institutional sources reveals that, at the all-India level, 31 per cent of credit is used for short-term crops, about 20 per cent is used for capital expenditure, and another 11 per cent for non-farm business (Table A3.15). However, it is also important to note that about 20 per cent of the non-institutional loans are used for farm activities. Thus, non-institutional sources play a prominent role in agricultural credit. The scenario is similar for the state of Karnataka (Table A3.16 in the Appendix). 3.6 Understanding the Determinants of Access to Credit: An Econometric Analysis for India While the preceding analysis shed light on the various aspects of access to credit by farmer households, it is descriptive in nature and the statistical significance of such results has not been established. To understand the factors that may be responsible for enhancing accessibility to credit, an econometric analysis has been carried out. Households which have cultivated land at least once in the year before the date of the survey are classified as farmer households and are culled out from the larger data set of the Debt and Investment Survey, NSSO, 2013. For this analysis, we have considered all farmer households that borrowed from formal sources after June 30, 2012 till the date of the survey. Loans which were taken before June 30, 2012 have been omitted from the analysis because there is only information on loans which were outstanding or not repaid as on June 30, 2012. Farmers who may have availed a loan and already repaid it before June 30, 2012 are not captured by this data. By considering farmer households that borrowed after June 30, 2012, we obtain complete information regarding all borrower farmers (irrespective of whether repayment has been made or not) from this date to the date of the survey (that begins from January 2013). Explanatory variables included the economic status of households in terms of their landholdings and assets. Social classes and educational qualifications are incorporated into the analysis as well. In addition, access to credit from alternative sources is taken into account. 3.6.1 Methodology In order to explore the factors that determine access to credit, we have used a probit model which is applied in cases where the observed dependent variable y is dichotomous, i.e. it assumes either the value 0 or 1. The model presumes the existence of a continuous latent variable Y* which is a linear function of the explanatory variables. In terms of notation, Y* assumes the following form: And the observed dependent variable y assumes the value 0 and 1 according to the rules given below: The probit model parameters are estimated by the maximum likelihood method where the likelihood function is given below. The log likelihood function is obtained by taking a log of the above function. In the above formulation, it is assumed that there are m outcomes with Y = 1 and the remaining n-m outcomes Y = 0 One can even obtain the predicted probabilities using the maximum likelihood form. 3.6.2 Explanatory Variables and Results We first describe the variables considered for the exercise in Table 3.1. The rationale for using these variables becomes clear from explanations provided while discussing our results. Table 3.2 provides descriptive statistics of variables used, and Table 3.3 presents the results. | Table 3.1: Descriptions of the Variables under Study | | Variable | Description | | Availing a short-term crop loan or KCC loan (dependent variable) | Dummy Variable: = 1 if the farmer household has availed a short-term crop loan or KCC loan between June 30, 2012 and the date of the survey, = 0 if otherwise | | Prompt repayment of a short-term crop loan or KCC loan (excluding those from cooperative banks) | = 1 if the household has received a short-term crop loan or KCC loan at 4 per cent rate of interest or below (excluding those from cooperative banks), = 0 otherwise | | Secondary education or higher in household | = 1 if at least one member of the household has been educated up to the secondary level or higher, = 0 otherwise | | Age of household head | Age of the head of the household in years | | Household size | Number of members | | Area of land under cultivation | Measured in acres | | Average regional asset value | Average asset value of cultivator households, region-wise | | Household asset value (excluding rural land value) | The value of household assets, excluding the value of owned rural land | | Debt asset ratio | Debt asset ratio of the household | | Indebted to moneylenders | If the household had outstanding debt from informal lenders as on June 30, 2012 | | Indebted to relatives | If the household had outstanding debt from relatives and friends as on June 30, 2012 | | Hindu | Hindu = 1, Others = 0 | | SC/ST | SC/ST = 1, Others = 0 | | Household member has bank account | Having bank account = 1, Others = 0 | | Labour is principal income source | Principal income of the household is labour activities = 1, Others = 0 | | Non-agricultural activities are the principal income source | Principal activity regular salaried or non-farm self-employment | | Source: Authors’ computation based on NSSO 70th Round Debt & Investment Survey data. |
| Table 3.2: Descriptive Statistics Relating to the Variables under Consideration | | Variable | Observations | Mean | Standard Deviation | Minimum | Maximum | | Short-term crop loan access | 50,618 | 0.0666759 | 0.2494623 | 0 | 1 | | Prompt repayment | 50,618 | 0.0147971 | 0.1207412 | 0 | 1 | | Secondary education or better in household | 50,618 | 0.527125 | 0.499269 | 0 | 1 | | Age of household head | 50,618 | 48.95417 | 13.05511 | 13 | 102 | | Household size | 50,618 | 5.138152 | 2.402801 | 1 | 36 | | Area of land under cultivation | 50,618 | 0.967544 | 1.597746 | 0.001 | 42.67 | | Average regional asset value | 50,618 | 2028348 | 1908319 | 320647.8 | 2.27 x 10⁷ | | Household asset value (excluding rural land value) | 50,618 | 845162.9 | 7151997 | 0 | 1.43 x 10⁹ | | Debt asset ratio | 50,618 | 0.057800 | 0.363773 | 0 | 53.66296 | | Indebted to moneylenders | 50,618 | 0.237998 | 0.425862 | 0 | 1 | | Indebted to relatives | 50,618 | 0.184263 | 0.387702 | 0 | 1 | | Hindu | 50,618 | 0.786380 | 0.409865 | 0 | 1 | | SC/ST | 50,618 | 0.343870 | 0.475003 | 0 | 1 | | Household member has bank account | 50,618 | 0.794579 | 0.404013 | 0 | 1 | | Labour is principal income source | 50,618 | 0.133865 | 0.340511 | 0 | 1 | | Non-agricultural activities are the principal income source | 50,618 | 0.213422 | 0.409727 | 0 | 1 | | Source: Authors’ computation based on NSSO 70th (2013) Round Debt & Investment Survey data. |
| Table 3.3: Regression Results | | Short Term Crop loan or Kisan Credit Card Loans | Coefficient | Standard Error (Robust) | z | P>z | Marginal Effects | | Secondary education or better in household | -0.014 | 0.020 | -0.690 | 0.490 | -0.001 | | Age of household head* | 0.001* | 0.001 | 1.800 | 0.072 | 0.000 | | Household size** | 0.009** | 0.004 | 2.280 | 0.023 | 0.001 | | Area of land under cultivation*** | 0.088*** | 0.005 | 16.470 | 0.000 | 0.009 | | Average regional asset value*** | 0.000** | 0.000 | 3.160 | 0.002 | 0.000 | | Debt asset ratio*** | -0.614** | 0.215 | -2.860 | 0.004 | -0.060 | | Indebted to moneylenders | -0.003 | 0.025 | -0.120 | 0.903 | 0.000 | | Indebted to relatives*** | -0.337*** | 0.029 | -11.730 | 0.000 | -0.028 | | Hindu*** | 0.277*** | 0.026 | 10.450 | 0.000 | 0.024 | | SC/ST*** | -0.174*** | 0.021 | -8.100 | 0.000 | -0.016 | | Household member has bank account*** | 0.777*** | 0.038 | 20.720 | 0.000 | 0.054 | | Labour is principal income source*** | -0.320*** | 0.035 | -9.250 | 0.000 | -0.026 | | Non-agricultural activities are the principal income source*** | -0.460*** | 0.028 | -16.160 | 0.000 | -0.036 | | Constant*** | -2.429*** | 0.058 | -41.960 | 0.000 | | No. of observations: 50,618; Wald Chi2: 1791.21; Prob > Chi2: 0.000.
Note: 1. Figures in parentheses are robust standard errors. *, **, and *** indicate that a coefficient in a particular regression is significant at the 10 per cent, 5 per cent, and 1 per cent levels of a two-tailed test for significance, respectively.
2. Based on Probit model, Dependent Variable: Access to Short-term Crop Loan or KCC Loan between July 1, 2012 and the Survey Date (up to June 30, 2013).
Source: Authors’ computation based on NSSO 70th Round (2013) Debt and Investment Survey data. | The regression in Table 3.3 is on the binary dependent variable representing whether a farmer household had received a short-term crop loan in the sample period. The results indicate much of what was envisaged in the descriptive analysis carried out above, albeit with increased scientific vigour. The area of land cultivated is a significant determinant of access to bank credit and households cultivating more land (large farmers) are correspondingly more likely to have received a loan from a commercial bank, which is in line with our earlier findings. A higher debt-asset ratio, revealing the riskiness of a borrower, leaves households with a significantly lower possibility of receiving a short-term crop loan in the current period. Regression results also show religion and social group wise differences in access to credit. Unlike education, financial literacy through inclusion – captured by at least one member possesses a bank account – plays an important part in the likelihood of receiving formal credit. While outstanding debt to moneylenders did not negatively affect access to short-term crop loans, households that have access to credit from relatives and friends possibly do not access bank loan as much as others who are without such facility due to having an alternative and cheaper source. Thus, the regression exercise shows that certain economically and socially deprived group has relatively lower access (coefficients of land holding and social groups show significance at 1 per cent level, see Table 3.3). These observations need special attention of the policymakers and practitioners from the banking sector. 3.7 Conclusion In this chapter, we have made use of secondary data to arrive at important features of formal credit to farmers at the macro level through an analysis of unit record NSSO data. Two rounds of NSSO unit record data are analysed. A few observations from the 70th Round are noteworthy. First, given the fact that 80 per cent of farmers are small and marginal with almost no savings, access to credit for working capital needs is essential. This is especially true for dry states like Karnataka where expenditure on inputs is substantial. However, it was observed that less than 40 per cent of the farmers have no access to any form of credit. Informal sources still supply about half the credit needs and about a quarter of the credit is still provided by moneylenders. Institutional sources are still inclined, albeit marginally, towards large farmers and moderately towards non-marginalised social categories. This bias is more evident in the case of the commercial banks than cooperative banks. A comparison between the two NSSO Rounds reveals low access of credit to the poorest farmers (landholding up to 0.4 hectare) in both Rounds (Table A3.17). At the all-India level among the poorest farmer group (owning less than 0.01 hectares of land), we find that the IOI reduced from around half to a little less than a third (49.33 per cent to 32.55 per cent). The increased credit constraints were even more discernible among this group in Karnataka, falling from 37 per cent to only 13 per cent. This magnitude of change is not visible among farmers in any other land size category in the state. Among ST households, credit off-take in Karnataka had remained at approximately the same level in both the NSSO Rounds but had dropped considerably at the all-India level (see Table A3.18). When looking at the share of institutional and non-institutional sources in agricultural credit across different landholdings, it was found that institutional sources appeared to have achieved significantly better credit penetration among the poorest farmers (with the share of credit to these farmers more than doubling from 19 per cent to 42 per cent). The share of credit extended to relatively larger size farmers (with landholdings greater than 2 hectares) by institutional sources had, however, decreased in the period (Table A3.19). The utilisation of credit for income generating activities declined significantly across all groups of farmers, especially among the poorest farmers for whom the usage of credit for income generating activities dropped from 24 per cent to only 14 per cent. This may create an inability to repay the credit, and possibly increases dependence on existing crop incomes and leaves them more vulnerable to fluctuations in crop yields. Thus, while institutional sources have been successful in increasing credit penetration to marginal and small farmers, the marked drop in the use of credit for income generating activities is worrying and brings into question the ability of these farmers to repay loans. This may pave the way towards a growing level of asset non-performance in this sector. Some of these concerns need to be addressed by the banking sector in the days to come. Chapter 4: Interest Rate, Arbitrage and Prompt Repayment:
Evidence from NSSO Data, 70th Round 4.1 Introduction In the previous chapter, we analysed accessibility to credit based on various economic and social characteristics of households. This chapter focuses on the rate of interest to determine what percentage of farmers have been able to borrow at the subsidised rate of 7 per cent and to also understand the situation with regard to prompt repayment. We also attempt to examine, using NSSO data, the issue of re-lending by taking advantage of the arbitrage opportunity of subsidised loans by analysing what percentage of farmers are both lenders as well as borrowers. Our analysis of interest rate and repayment of agricultural loans disbursed by formal institutions shows that on an average at all India level only 40 per cent of the (borrowing) farmers are possibly able to reap the benefit of the subvention scheme3 (i.e., avail 7 per cent rate of interest). For Karnataka, this figure is even lower at 26 per cent. Out of the total farmers that borrowed from institutional agencies only about a quarter enjoyed a rate of interest below 7 per cent in Karnataka. While about 50 per cent of farmers in Karnataka borrowed from institutional agencies (mostly for short-term crop loans), only 26 per cent of them borrowed under the 7 per cent rate of interest. Therefore, out of the total number of farmers, only about 13 per cent received the benefit of subsidised interest rates in Karnataka (Table 4.1 and Table A4.1 in the Appendix). It is to be noted that, in Karnataka, cooperative banks charge no interest due to the state government subvention scheme. | Table 4.1: Percentage of Loans to Farmer Households Classified in Terms of Interest Rate Charged (Karnataka and All India) | | Interest Rate (%) | Formal Sources | Informal Sources | | Nil | Upto 7 | 7.01-12 | >12.01 | Nil | Upto 7 | 7.01-12 | 12.01-24 | 24.01-36 | >36 | | Karnataka | 0.6 | 26.6 | 43.38 | 29.35 | 29.7 | 1.42 | 2.33 | 22.65 | 33.41 | 10.5 | | All India | 2.4 | 38.3 | 37.2 | 22.09 | 31.3 | 2.93 | 2.28 | 28.7 | 17.98 | 16.86 | | Source: Authors’ analysis of NSSO 70th Round (2013) data. | At the all-India level, credit from friends, family members, etc., constitutes about 31 per cent of total credit and comes at zero per cent interest. However, a much higher percentage of credit (35 per cent) attracts 24 per cent interest per annum or more. In the state of Bihar, 65 per cent of the loans are borrowed from non-institutional agencies with an interest rate above 36 per cent, i.e., more than 3 per cent per month. In most of the other poorer states such as Uttar Pradesh, West Bengal, Jharkhand and Odisha, close to one-third of loans from non-institutional agencies attract more than 36 per cent interest rate. Even though 24 per cent of the loans in Karnataka are obtained from cooperative societies (with no interest charge), many borrowers do not repay the loans in time, i.e. before 12 months, and end up paying a higher interest. Classification according to landholding size shows that only around 18 per cent of marginal farmers avail loans at 7 per cent or less interest rate, while this percentage doubles for other classes (Table A4.2 in the Appendix). This is a matter of serious concern, and policy towards financial literacy should be directed to correct this skewed distribution of interest rates. Regarding the subvention scheme, we know that if the loan is repaid as per stipulated period (not exceeding 12 months), the farmer is eligible for an additional subvention of 3 per cent. Considering the short-term crop loans to farmers, Table 4.2 provides some indicative figures of the repayment habits of farmer households. At the all-India level, taking into account all interest rate categories it is observed that 2.8 per cent of farmers had completely repaid short-term crop loans taken exactly 12 months prior to the survey date, while the corresponding figure for Karnataka was 0.62 per cent. But for loans under a 7 per cent rate of interest, the all-India repayment figure is around 5 per cent and corresponding figure for Karnataka is about 2 per cent. Further, those with lower interest rate loans had a higher probability of making complete repayments than those with higher interest rate loans. In the context of farmers who made partial repayments towards a short-term crop loan (for which we need to have some estimate of interest burden), we have computed figures assuming both simple interest rate as well as amortized loans with monthly pay-outs (to get an indicative picture). Both provide similar figures, but the percentage of farmers who appear to have made repayments are lower in the case of amortized loans since the total liability (principal + interest) is lower. This is done to get a certain indicative picture. Here it can be seen that formal loans with lower interest rates have a lower probability of having been repaid as compared to those with higher interest rates. | Table 4.2: Statistics related to Repayment of Short-term Crop Loans taken 12 months prior to Survey Date | | Interest Rate (%) | All India | Karnataka | | Partially Repaid | Fully Repaid*** | Partially Repaid | Fully Repaid*** | | Assuming Simple Interest* | Assuming Monthly Amortization** | Assuming Simple Interest* | Assuming Monthly Amortization** | | Nil | 9.31 | 9.31 | 5.85 | - | - | 0.00 | | Up to 7 | 40.21 | 26.81 | 4.76 | 31.57 | 12.04 | 1.97 | | 7.01 to 12 | 68.47 | 37.02 | 0.05 | 89.16 | 80.09 | 1.32 | | 12 & above | 67.69 | 48.28 | 0.00 | 100.0 | 79.37 | 0.06 | | Total | 50.85 | 31.67 | 2.80 | 81.44 | 68.82 | 0.62 |
Given these observations, it is interesting to discern through statistical significance, the factors responsible for prompt repayment. We therefore carry out a regression analysis for this purpose. 4.2 Understanding the Determinants of Prompt Repayment: An Econometric Analysis To understand prompt repayment behaviour, we have utilised a regression with sample selection correction (Ven and Pragg, 1981). In the regression, the dependent variable has a binary outcome and is assigned a value of 1, if a cultivator household which has accessed a short-term crop loan from a commercial bank faced an interest rate of 4 per cent or less, and 0 otherwise4. Since the Interest Subvention Scheme is only applicable to loans taken from commercial banks, we have confined this analysis to short-term crop loans under the KCC or crop loan scheme from commercial banks only. We intend to understand whether there exists any difference between different farmer groups in terms of repayment habits for short-term crop loans. When studying repayment habits, we are only able to observe repayment among farmers who have actually received a short-term crop loan (outcome variable). However, at a theoretical level, all farmers will have some attitude/ tendency towards repayment, which cannot be captured through the above observation alone, and we need to correct this. In order to correct this bias, we can make use of the sample selection probit model, proposed by Ven and Pragg (1981). In this model, we have the standard probit assumption of the existence of an underlying equation of the form: but we are only able to observe the binary outcome Furthermore, we are also constrained by a second equation which determines whether or not we will be able to observe the binary probit variable in the first place (i.e. selection equation; a crop loan is accessed or not). We are only able to make an observation about repayment (outcome) only if the selection equation (loan accessed or not) holds true (evaluates to 1), where: When ρ ≠ 0, estimates made by the ordinary probit equation are biased, but the probit model with sample selection correction yields consistent, and asymptotically efficient estimates for all regressors. Table 4.3 provides the regression results utilising this technique. Here our focus is on the outcome equation. As in the case of the previous Chapter here too we have considered similar explanatory variables (see previous chapter for variable details) and our results are presented below. | Table 4.3: Regression Results | | | Coefficient | Robust Std. Err. | z | P>z | | Prompt Repayment of a Short-term Crop Loan (Outcome Equation) | | Household Size*** | -0.02065*** | 0.00738 | -2.8 | 0.005 | | Land Cultivated (Ha.) *** | -0.05002*** | 0.01022 | -4.89 | 0 | | Age of Head of Household | 0.00156 | 0.00158 | 0.99 | 0.323 | | Value of Bullion (Gold & Jewellery) | 0.00000 | 0.00000 | 0.61 | 0.541 | | Debt-Asset Ratio*** | -1.26961*** | 0.34396 | -3.69 | 0 | | Indebted to Moneylenders | -0.05789 | 0.05100 | -1.14 | 0.256 | | Indebted to Relatives and Friends*** | 0.35160*** | 0.06024 | 5.84 | 0 | | Household Member Has a Bank Account*** | -0.59304*** | 0.11270 | -5.26 | 0 | | Hindu | -0.08733 | 0.05960 | -1.47 | 0.143 | | Scheduled Caste/Tribe*** | 0.24152*** | 0.05202 | 4.64 | 0 | | Labour is the Principal Income Source*** | 0.39292*** | 0.08777 | 4.48 | 0 | | Non-agricultural Activity is the Principal Income Source*** | 0.52016*** | 0.06925 | 7.51 | 0 | | Constant*** | 1.36200*** | 0.23766 | 5.73 | 0 | | Received a Short-term Crop loan (Selection Equation) | | No. of Rural Bank Offices in the State*** | 0.00011*** | 0.00001 | 20.45 | 0 | | District Cultivator Households*** | 0.00000*** | 0.00000 | 2.64 | 0.008 | | Household Size*** | 0.02028*** | 0.00387 | 5.24 | 0 | | Land Cultivated (Ha.) *** | 0.07478*** | 0.00514 | 14.55 | 0 | | Age of Head of Household | -0.00009 | 0.00074 | -0.13 | 0.899 | | Value of Bullion (Gold and Jewellery) ** | 0.00000** | 0.00000 | 2.55 | 0.011 | | Debt-Asset Ratio*** | 0.02523*** | 0.01367 | 1.85 | 0.065 | | Indebted to Moneylenders | -0.00778 | 0.02252 | -0.35 | 0.73 | | Indebted to Relatives and Friends*** | -0.29516*** | 0.02844 | -10.38 | 0 | | Household Member Has a Bank Account*** | 0.77637*** | 0.04005 | 19.39 | 0 | | Hindu*** | 0.07183*** | 0.02779 | 2.58 | 0.01 | | Scheduled Caste/Scheduled Tribe*** | -0.21728*** | 0.02277 | -9.54 | 0 | | Labour is the Principal Income Source*** | -0.33097*** | 0.03664 | -9.03 | 0 | | Non-agricultural Activity is the Principal Income Source*** | -0.44358*** | 0.02982 | -14.87 | 0 | | Constant*** | -2.62011*** | 0.06114 | -42.85 | 0 | | athrho*** | -0.90278*** | 0.12149 | -7.43 | 0 | No. of Observations: 50,681. Censored Observations: 3,122. Sample: Cultivator Households that had received at least one short-term crop loan or KCC loan from a commercial bank and were included in the NSSO Debt and Investment Survey 70th Round.
Wald Chi2: 211.51, Prob > Chi2: 0.000.
Wald test of independent equations (Chi2): 55.22, Prob > Chi2: 0.000
Note: *, **, and *** indicate significance at the 10 per cent, 5 per cent, and 1 per cent levels of a two-tailed test for significance, respectively.
Dependent Variable: Has the Household Received any Short-term Crop or KCC Loan from Commercial Banks (Selection Equation) at a Rate of Interest of 4 Per Cent or Below (Prompt Repayment, Outcome Equation).
Source: Authors’ analysis of NSSO 70th Round (2013) Debt and Investment Survey; and Reserve Bank of India data. | 4.2.1 Variables and Results In order to make proper use of this regression technique, we have included a variable in the selection equation that is not present in the outcome equation. This allows the model to be well-identified. We have used the number of rural bank offices in each state as the exclusion criteria as it can be expected to influence the probability of receiving a loan, but not repaying the loan on time (making a prompt repayment). It is clear that this variable is positive and significant (refer to the selection equation results in Table 4.3), indicating that a greater number of rural bank branches allows for increased credit access among cultivator households, pointing towards the benefit of increased formal sector penetration into rural areas. To control for the variation in the number of bank branches arising from population size differences, we have utilised the district-wise number of cultivator households as a control variable. This variable has been constructed by cumulating the frequency weights for cultivator households per district as given in the NSSO data, which allows us to arrive at an estimation of the district-wise cultivator population. This variable, too, has a positive effect on the probability of receiving a short-term crop loan, indicating that farmers living in less populous districts are less likely to have access to credit, which is another issue that needs to be taken note of. The outcome equation in Table 4.3 indicates that even though credit is more likely to flow towards households with more members, the probability of repayment decreases with number of members, ceteris paribus. This indicates that larger households are less likely to repay loans on time, possibly owing to greater expenses on household maintenance compared to more nuclear families. While possession of more bullion (gold and jewellery) made households more likely to receive short-term crop loans (an observation which is also prominent in our field survey and discussed in the next chapter), they do not differ in their repayment habits. Similarly, farmers cultivating larger tracts of land are also more likely to have access to credit but are less likely to make prompt repayments. This indicates that short-term crop loans are more often being enjoyed by relatively richer/larger farmers who nevertheless have tardier repayment habits than poorer farmers. This is possibly a failure of signals and creates persistent inequalities in the agricultural sector, and in the case of the latter, steps should be taken to make lending to small farmers simpler, such as digitization of land records, reduced paperwork, and sharing of information between banks so that ‘no due certificates’ are not required (see Chapter 5 for more details). Again, although banks appear to prefer lending to farmers with higher debt asset ratio, these households are also less likely to make prompt repayments, possibly owing to other repayment responsibilities. While farmer households, who were indebted to relatives, are less likely to take short-term crop loans, they are more likely to make prompt repayments, indicating that there may be family support systems to settle dues to commercial banks (i.e. relatives and friends are likely to lend so that repayments can be made to banks). With regard to various groups, we see that religion-wise there is no differences in their repayment habits. Moreover, we find that households from SCs and STs are more likely to make prompt repayments when compared to other households. Cultivator households, which derive their principal incomes from labour and/ or non-farm work appear to be better debtors as they are more likely to make prompt repayments towards short-term crop loans, but are also less likely to receive such loans. Therefore, it appears that off-farm and non-farm workers are able to subsidise agricultural activity, but banks do not lend to such households possibly because they often operate only small parcels of land and lack financial literacy or land records (see also Chapter 8). 4.3 Availing Advantage of Arbitrage Opportunity One important question that arises in this context is whether borrowers have taken advantage of the lower interest rate of the formal sector to relend at a higher interest rate in the informal market. This question cannot be directly answered from the available data. However, we can approximate its possibility by finding the percentage of farmers that have borrowed from formal agencies and have also acted as lenders in the informal market. It was found that this percentage was rather insignificant both at the all-India level as well as in Karnataka (see Table 4.4 below and Table A4.4 in the Appendix for corresponding figures in some major Indian states). Subsequently, through our survey also, we arrive at a similar conclusion. Since all those taking advantage of the arbitrage opportunity would have been recorded as having accessed formal loans and forwarding informal credit, we can conclude that re-lending by taking advantage of an arbitrage opportunity is not a major problem. | Table 4.4: Possibility of Arbitrage | | State | Percentage* | | Karnataka | 0.74 | | India | 0.54 | *Percentage of Households Availing a Loan from Formal Agencies and who have also given out loans (Acting as Lender as well as Borrower)
Source: Authors’ analysis of NSSO 70th Round data. | 4.4 Conclusion In this chapter, we have tried to examine the repayment behaviour of farmers using a probit regression model. The exercise reveals that education plays an important role in a household’s decision to make prompt repayment, as does having non-farm income. Thus, financial literacy brought about by imparting general education and financial knowledge and access to relatively less risky income (such as animal husbandry and nonfarm income) helps to pay back loans in time. Though the richer farmers have greater accessibility they do not perform well in the repayment front. An analysis of NSSO data reveals that the number of farmers who take undue advantage of cheap loans to relend at a higher interest rate is nearly negligible. Chapter 5: Interest Subvention and Bank Lending:
Analysis of Bank-Level Data Data analysed in the preceding two chapters pertain to households, and thus only provide a household-side picture of access to credit. For a better understanding of the credit scenario, certain supply-side data (from bank branches) were also collected which reveal some interesting developments. Data have been collected from branches of respective lead banks located in sample districts. 5.1 Prevalence of Gold Loan: Observations from Different Districts The first set of data collected pertains to crop loans to farmers from a bank branch, for a 14-month period from March 1, 2014 to May 29, 2015 in Mandya. One of the important observations from the data we have collected is the prevalence of gold loans among farmers. Discussions with bank managers revealed that during this period, 3,716 farmers took loans for agriculture and allied activities under the jewel/gold loan scheme. However, there was no information in the computerised files of the bank pertaining to landholdings of the borrowers or whether the jewel loan (JL) has been disbursed by the bank alongside an inspection of the Record of Rights, Tenancy and Crop (RTC) (all are coded under one code, viz. JL 705). In the absence of this information, we have classified the farmers (as per the suggestions of bank managers) as follows: loans below ₹50,000 to have been taken by small farmers (marginal farmers usually do not borrow under jewel-based loans), ₹50,000 to ₹1 lakh as disbursed to medium farmers, and ₹1 lakh and above as borrowed by large farmers. Around 30 per cent of total farmers have taken loans at 7 per cent interest rate, and we presume that these farmers have provided RTC with the jewel/gold security5. | Table 5.1: Details of Jewel Loan Taken by the Farmer Households in Mandya | | Farmer Group | Percentage of Farmers | Average Amount Borrowed (₹) | Median Amount borrowed (₹) | | Small | 42.55 | 29,542 | 30,000 | | Medium | 36.09 | 72,358 | 70,000 | | Large | 21.37 | 171,730 | 150,000 | | Total | 100.00 | 75,374 | 55,500 | Note: Between March 1, 2014 to May 29, 2015. Based on 3,716 observations, selected bank branch.
Source: Data collected from banks by authors. |
| Table 5.2: Interest Rate for Jewel Loans to Farmers in Mandya | | Farmer Group | Interest Rate Band (per cent) | | 7 | Around 10 | Around 12 | Total | | Small | 31.3 | 49.2 | 35.4 | 42.5 | | Medium | 40.0 | 34.6 | 37.1 | 36.1 | | Large | 28.6 | 16.2 | 27.5 | 21.4 | | Total | 100.0 | 100.0 | 100.0 | 100.0 | Note: Between March 1, 2014 to July 29, 2015. Based on 3,716 observations.
Source: Data collected from banks by authors. | It is worth noting that in addition to these 3,716 farmers, only 17 farmers have taken a loan by providing RTC alone. Landholdings of these farmers show that they are primarily small and marginal landholders (around 90 per cent, Table 5.3) while the amount borrowed is quite high in comparison to jewel loans, presumably because RTC-based loans are forwarded according to the scale of finance, which sets an amount of loan in terms of per acre of land for each type of crop. It is reported that out of these farmers, 24 per cent have taken loan at 7 per cent, 6 per cent have taken loan at 4 per cent, and 70 per cent have taken loan at 11.65 per cent. Out of the farmers who have taken loans at 7 per cent, three have done so within the 365 days preceding the survey date, but one farmer has repaid the loan within a year, and is hence, eligible for 4 per cent interest rate. In summary, we observe that a large proportion of farmers in Mandya have taken loans under the jewel-based loan (with subvention facility) scheme and more than half of those who have got credit solely with land records (RTC) have not been able to enjoy the benefits of lower interest rate under the subvention scheme, possibly due to delayed repayment. | Table 5.3: Loan Details of RTC-based Loans taken by Farmer Households in Mandya | | Farmer Group | Percentage | Average Land in Acres | Amount of Loan Borrowed (₹) | | Marginal | 58.82 | 1.76 | 142,000 | | Small | 29.41 | 3.61 | 260,000 | | Semi-medium | 5.88 | 5.16 | 300,000 | | Medium | 5.88 | 16.00 | 1,000,00 | | Total | 100.00 | 3.34 | 236,471 | Note: Only average/percentage figures shared, no details shared. Between March 1, 2014 to May 29, 2015. Based on 17 observations, selected bank branch.
Source: Data collected from banks by authors. | The question that arises at this juncture is whether this is an isolated case or a general trend? Our survey of banks shows that, as is the case with Mandya district, the prevalence of jewel loans is also present in Chitradurga district. Data similarly collected from Chitradurga show that 1,119 farmers have taken loans pledging jewels while 114 farmers have accessed credit based on RTC alone. Thus, as mentioned the prevalence of jewel loans is observed in this district as well but to a comparatively lesser degree, perhaps due to the relatively poorer economic condition of the farmers in Chitradurga. Here, jewel loans up to ₹100,000 are given at a 7 per cent interest rate if the farmer just declares that he possesses an RTC. Thus, the pledging of RTC is not required; similarly, a ‘no due certificate’ from other bank branches in the vicinity is not required either; because of which possibly most farmers have taken advantage of this facility. Beyond ₹1 lakh, the RTC is required and relatively richer farmers have taken advantage of this facility (Table A5.4 in the Appendix show a few other details). Similar observations have been made from Ramnagara district as well. Out of the total number of borrowers, about 45 per cent of farmers have accessed jewel plus RTC-based loans at 7 per cent rate of interest. Another 28 per cent of farmers have obtained only jewel loans. Using only RTC, 30 per cent of the farmers have got loans, out of which 35 per cent have got a loan at 7 per cent interest rate and the rest have accessed loans at 11 per cent or higher rate of interest possibly due to non-repayment of loan on time. Thus, the prevalence of jewel loans is prominent in this district (branch) as well, and it is also important to note that none of the borrowers have been able to enjoy the subsidised 4 per cent rate of interest (additional details are presented in Table A5.3 in the Appendix). Thus, it can be observed that there is widespread usage of the jewel loan facility by farmers for funding agriculture and allied activities. Reasons for favouring jewel loans include the following (based on field insights): -
Reduction in procedural complications: The primary reason for opting for a jewel loan is the minimal need for documentation. -
Reduction in time cost: Faster disbursement of the loan (within a day or two) if the jewel is pledged. -
Reduction in transaction cost: If the jewel is pledged together with RTC, then the pledged asset becomes the jewel. Loans are given at 7 per cent with no further documentation and without loss of time. -
On the other hand, if the loan is taken with RTC alone, all the related documentation for mortgaging land becomes necessary, primary among them being a ‘no due certificate’ from all bank branches in the locality. This is a rather time-consuming task, and the fee to be paid is also substantial. Many farmers do not receive the benefit of 7 per cent as many loans are not repaid in time, as can be seen from the data (Table A5.1 in the Appendix provides certain details. See also Table A5.3). It can be seen that several farmers who have borrowed with RTC alone have eventually failed to avail the subvention benefit. One of the advantages of taking an RTC-based loan is that the loan amount can be higher as it is not based on the mortgage value of the jewel. A farmer can get up to ₹3 lakh under subvention as per scale of finance. By juxtaposing Tables 5.1 and 5.3, it can be seen that loan amounts not based on jewels are relatively much higher. 5.2 Observations from Yadgir District Yadgir is one of the poorest districts in Karnataka and it is worth noting that the district displays a different scenario. Out of the total borrowers from the selected bank branch, 616 availed loans by providing RTC alone and 171 farmers have taken jewel loans by providing RTC (Table A5.2 in the Appendix to Chapter 5). There is no loan disbursed only with a jewel. This shows a wide prevalence of RTC-based loans in relatively poorer districts, while in the relatively better off districts it is the farmers with jewels who appear to capture the subvention facility. In addition, it is reported that about 9 per cent of the farmers who borrowed under subvention with RTC alone (no jewel pledged) have also been able to avail loans at 4 per cent rate. The rest are at 7 per cent possibly because they have not crossed their due date (as no farmer has been charged more than 7 per cent). 5.3 Conclusion This analysis of data from banks undoubtedly reveals one fact: jewel loans are becoming exceedingly popular among farmers. This is primarily because many farmers do not have RTCs as mutations do not take place automatically. Secondly, and more importantly, in procedural terms, getting a jewel loan is much easier and faster. One of the major problems of purely RTC-based loans, as is evident from Mandya district, is that one needs to produce a ‘no due certificate’ from all the nearby bank branches in the region which is an expensive procedure in terms of money and time. Consequently, only those farmers who have jewels are able to take advantage of the facility. This is a concern that needs to be addressed by policymakers. In the relatively poorer Yadgir district, farmers still depend on RTC-based loans and have to repay the loan on time to avail the benefits of the prompt repayment scheme. This indicates that there is a demand for formal credit from poorer farmers, and it is likely that gold loans are crowding out RTC-based loans in richer districts. Given these interesting observations, one would like to know the reasons behind the inaccessibility to credit by farmers and the possible remedies. Data from secondary sources do not provide such insights in this regard. Therefore, a primary survey was undertaken to cover four districts of Karnataka. The next two chapters highlight some of the feedbacks received from the farmers with regard to financial accessibility, literacy and integrity. Chapter 6: Sample Selection and Basic Characteristics As part of the study, a primary survey was conducted to understand the problem of access to credit, terms and conditions of a loan, and other credit-related issues. As mentioned in the previous chapter, this survey was carried out in four districts in Karnataka, which were selected on the basis of their agricultural performance. The four districts are: Mandya (a relatively better-performing district), Ramanagara (a middle-performing district), Chitradurga (a lower-middle-performing district, below Ramanagara) and Yadgir (a poor-performing district)6. Structured questionnaires were personally administered to obtain information from the farmers regarding several aspects of the credit delivery mechanism. 6.1 Selection of Respondents From each district, one middle-performing taluka was selected purposively to obtain a representative/average picture of the district. The talukas so selected include Maddur from Mandya district, Kanakapura from Ramanagara district, Hiriyur from Chitradurga district and Yadgir taluka from Yadgir district. Each of the talukas consists of several hoblis (representing a collection of gram panchayats) and each hobli has a Raita Samparka Kendra (RSK, a farmers’ assistance centre). The selection of sample hoblis was done after holding discussions with the officers in charge of these RSKs. Specifically, there are four RSKs/hoblis in Maddur taluka and approximately a sample of 20 farmers from each hobli was selected after field visits. Out of these, approximately 10 farmers were randomly selected from among commercial bank borrowers in consultation with bank staff. Next, wherever possible a cooperative bank in the hobli was randomly selected with the help of the concerned agriculture officer and five borrowers from a cooperative bank were randomly selected for an interview. Finally, five non-borrowers from the hobli were selected randomly in consultation with the agriculture officer. This procedure was roughly followed for each hobli under study. Thus, from Mandya district, 80 respondents were identified/ selected. The above procedure was repeated for Ramanagara district, and a hundred sample observations were collected from Kanakapura hobli after visiting five RSKs there. For the relatively poor-performing districts of Chitradurga and Yadgir, information was collected from a total of seven hoblis. Owing to ongoing elections at that time, the field team could survey only three RSKs in Yadgir taluka of Yadgir district. The total sample size from Chitradurga district is 80 and from Yadgir district it is 60. Thus, a total of 320 respondents is considered for the study. In this context, it is necessary to emphasise that the purpose here is not to estimate population parameters in the area but to understand the kind of problems faced by farmers in accessing the credit market; their financial literacy in respect of interest subvention and prompt repayment schemes; and their perception regarding required changes in the system that would be beneficial to the farmer community. In addition, we have interviewed bank officials and farmer groups. 6.2 Basic Sample Characteristics Certain basic characteristics of sample farmers are discussed in this section. Classified in terms of landholding, around 70 per cent of the farmers are small and marginal (0 to 2 hectare), about 28 per cent are medium (2 to 10 hectares), and 2 per cent are large (more than 10 hectares). The study sample primarily consists of farmers belonging to SC, ST as well as OBC categories, and, as expected, there were fewer general category farmers in the sample (Table A6.1). The SC/ST population is found to be low in the sample possibly due to their lower share in population and also due to the fact that the study covers borrowers from commercial and cooperative banks, amongst whom SC/ST presence may be relatively low. An analysis of NSSO 70th Round data in Chapter 3 also reveals a similar picture. It can be seen from Table A6.2 that while about 58 per cent of OBC households have access to credit (either from formal or from informal sources), this percentage declines to 41 for the SC population. When we consider borrowings from the formal sector, a lower share of both SC and ST populations in credit offtake becomes evident (see Table A6.4 and A6.7 for more details). On the other hand, in our sample, we observe a large percentage of SC farmers in the non-borrowers’ category (Table A6.4 in the Appendix). In Karnataka, most rural households (over 85 per cent) have a Below Poverty Line or BPL card, which has been reflected in our sample as well. Table A6.3 provides the distribution of BPL/ration cardholders in Karnataka. Interestingly, however, more than 80 per cent of households (84.7) have televisions and more than 65 per cent (68.4) own pukka houses as well as two-wheelers (Table A6.5). Thus, the economic conditions of farmer households appear to be relatively better in Karnataka than several other parts of India7. This observation necessitates an analysis of the income profile of households in the state. 6.3 Income About 90 per cent of the income of sample households comes from farm activities, and 3 per cent comes from wage labour. However, at 12 per cent, wage income accounts for a larger share of income for marginal farmers. Large farmers, on the other hand, derive more income from livestock business than other categories of farmers (Table 6.1). | Table 6.1: Share of Income from Different Activities | | Farmer Group | Agricultural | Livestock | Other Activity | Wage | | Marginal | 76.53 | 7.55 | 3.73 | 12.18 | | Small | 87.49 | 4.63 | 3.38 | 4.50 | | Semi-medium | 94.41 | 1.67 | 2.22 | 1.70 | | Medium | 94.76 | 4.39 | 0.85 | 0.00 | | Large | 80.00 | 20.00 | 0.00 | 0.00 | | Total | 88.45 | 6.15 | 2.13 | 3.26 | | Source: Field Survey. | As high as 36 per cent of the marginal farmers were found to be engaged in wage labour, which implies that small and marginal farmers substantially augment their income through such work (Table A6.6). Table 6.2 provides information regarding average income earned by different categories of farmers from various income generating activities. The income of the large farmers is more than 10 to 15 times higher than that of small or marginal farmers, which is supplemented by substantial livestock-based income. | Table 6.2: Average Annual Income (Levels) per Household from Different Activities: Landholding-wise Classification | | Farmer Group | Agricultural | Livestock | Other Activity | Wage | Total Income | | Marginal | 31640 | 3444 | 1515 | 5347 | 41947 | | Small | 63835 | 3168 | 2260 | 2109 | 71371 | | Semi-medium | 119102 | 1969 | 2078 | 1664 | 124813 | | Medium | 251422 | 13481 | 1815 | 0 | 266719 | | Large | 620000 | 180000 | 0 | 0 | 800000 | | Total | 89446 | 6647 | 1920 | 2811 | 100824 | | Source: Field Survey. | By utilising this sample, the study takes up the critical issue of accessibility to credit in the next chapter. Chapter 7: Credit Scenario: Experiences from the Field This chapter looks into the three major dimensions of financial services to farmers, focusing primarily on credit services. These are accessibility to credit, financial literacy concerning short-term crop loans, and financial integrity. The information presented here is primarily based on a field survey conducted as part of the study, along with references to the analysis of NSSO data 7.1 Accessibility to Credit As our main focus in this study is to examine the functioning of the subvention scheme, our sample comprises, to a large extent, farmer households that accessed credit from commercial banks. Therefore, a good estimate of overall inaccessibility to credit is difficult to obtain from our sample. We also believe that a good macro-level picture can be obtained better from the NSSO sample, which is considerably larger and randomly selected from the entire population. In this regard, we provide further analysis of NSSO data pertaining to the state of Karnataka to shed light on the issue of accessibility. Such an analysis of NSSO data pertaining to the state of Karnataka (from Table A7.1 in the Appendix) reveals that the share of formal sources in the total borrowings (for about the past 10 years) is lower in the state (57 per cent, during the 70th round) compared to the all-India level for the corresponding period, which is at 64 per cent (not shown in the table). Further, cooperative banks seem to have had a better share in providing credit in the state compared to what is observed at the all-India level (Table A7.2). It is also observed from NSSO data that about 50 per cent of marginal farmers have not accessed any formal sector credit (Table A7.1) Importantly, if the amount of loan disbursed for the last three years by formal institutions is considered for the state of Karnataka (Tables A7.1 and A7.2), it can be seen that the share of formal institutions has declined to 54 per cent from 57 per cent. The share of commercial banks has also reduced to 14 per cent compared to 20 per cent when we take data for the last 10 years. This is a feature that needs to be taken note of by policymakers. (Additional details on credit across states are presented in Tables A7.5-A7.7 in the Appendix) Similar computations in terms of the number of loans paint a worse picture of the formal sector. About 50 per cent of loans are provided by the formal sector, and the share of commercial banks in this is as low as 9 per cent, in terms of number of loans given in the last three years (see NSSO survey data presented in Table A7.3 in the Appendix). Thus, with regard to accessibility, there is a need for substantial improvement. Activity-wise, around 32 per cent of loans provided by the formal sources in the state of Karnataka are short-term current expenditure loans. On the contrary, only around 5 per cent of loans from non-institutional sources are crop loans. Thus, institutional sources are the major providers of crop loans. But a good percentage of loans for capital expenditure in farm business come from non-institutional sources as well (Table A7.4 in the Appendix). After highlighting certain interesting features of the credit market based on macro data, we move on to the findings of the field survey. It is to be noted (as mentioned above) that in our sample we have considered a relatively larger number of farmers from commercial banks as our primary objective was to study the working of the subvention scheme. 7.2 Interest Subvention A considerable difference is observed in the degree of accessibility to the subvention scheme under crop loans from commercial banks among the marginal, small, medium and large farmers (Table 7.1). If the scheme needs to benefit poor farmers, this trend must be reversed and a conscious effort has to be exerted by commercial banks to reach out to the needy. It is seen that many marginal and small farmers fail to avail the benefit of prompt repayment due to lower yields arising out of bad weather conditions such as droughts which are common in Karnataka (Figure 7.1). A few farmers have also reported that late payment of dues by the industry units that use their produce (such as sugar mills) have often rendered them unable to meet loan deadlines. These are two other major problems that need due consideration. | Table 7.1: Percentage of Farmers who Benefited from Interest Subvention* | | Farmer Group | Percentage | | Marginal | 28.0 | | Small | 32.6 | | Semi-medium | 34.8 | | Medium | 72.7 | | Large | 66.7 | | Total | 37.1 | * Based only on those who borrowed from commercial banks.
Source: Field Survey. |
7.2.1 Financial Inclusion Though crop loans are the main concern of this study, financial inclusion in general, and savings in particular, are also considered since they are germane to the main theme. Farmers often do not approach banks for credit due to unfamiliarity and a perceived notion of difficulty. Having bank accounts and making regular visits to banks can alleviate such psychological barriers to accessing institutional credit. Given this perception, the finding that 98 per cent of farmer households today have a bank account was quite heartening. About 66 per cent of farmers do visit a bank regularly, i.e. around twice a month. However, around 28 per cent of farmers rarely visit banks (see Figure 7.2). It is also noteworthy that in about 43 per cent of households, women are members of SHGs, and hence, they possibly have access to a bank as a group. Farmers’ clubs exist but are not prevalent as 93 per cent of respondents claimed to not have membership in any group/club. 7.3 Financial Literacy Though farmers are generally aware that bank interest rates are lower than that of informal sources, many are still unfamiliar with the subvention scheme. Only 40 per cent of farmers have detailed knowledge about the scheme (Table 7.2), i.e. the exact rate of interest and how it is reimbursed, etc. Most farmers are unaware of the prompt repayment scheme, among those who are aware of subvention scheme, 83 per cent have also heard of the prompt repayment scheme. The inadequacy of their knowledge is revealed by the fact that these farmers consider prompt repayment as a means to get loan facilities swiftly in the next year without the interest compounding (Table 7.2). However, they are not aware about further reduction in interest rate. On the contrary, a large number of farmers are aware that loans from cooperatives are interest rate free in the state. | Table 7.2: Knowledge of Subvention Scheme and Perceptions Regarding Advantages of Prompt Repayment | | Knowledge of Subvention Scheme (%) | Perceptions regarding Advantages of Prompt Repayment (%) | | Knowledge of subvention scheme | 40.55 | To get loan next time | 90.57 | | | | For interest subsidy | 14.15 | | Benefited from the scheme | 37.14 | To avoid compound interest | 75.47 | | | | Avoid legal notice | 48.11 | | Source: Based on Field Survey conducted by authors. | 7.3.1 Knowledge of KCC Another aspect that the study attempted to capture is farmers’ knowledge of the Kisan Credit Card or KCC. Official statistics show that KCC cards are distributed to almost all farmers in the state of Karnataka. However, the field survey revealed that only 5 per cent of farmers had knowledge of KCC and its benefits. It is pertinent to state here that an earlier survey by this research team had also detected this lacuna of the KCC facility (Rajeev and Vani, 2012). Results of a few other studies are also in line with this team’s earlier findings. 7.4 Financial Integrity An analysis of NSSO data reveals that only 0.74 per cent of farmer households’ act both as lenders and borrowers. At the all-India level, this percentage is 0.54. Thus, it is clear that the percentage of households engaged in re-lending by taking advantage of the arbitrage opportunity is insignificant. In spite of our best efforts, no reliable estimate of re-lending activities could be made based on field data. But, as per the insights gained from interactions with a large number of farmers and bank officials, it can be safely assumed that if at all only a few households may be engaged in such activities, i.e., between 2 and 3 per cent. We consider this figure to be small enough (in Karnataka) and hence opine that the scheme should not be discontinued on this ground. 7.5 Problems and Suggestions During field visits made by the authors, several farmers narrated the problems faced by them while accessing crop loans from commercial banks. Small and marginal farmers often find bank officials non-cooperative and information dissemination incomplete (Table 7.3). As farmers are rarely familiar with the English language, they expect bank forms and credit-related details to be given in Kannada language (see Table 7.3). Several farmers also indirectly reported cases of corruption by bank officials (without implicating any specific person). Several farmers reported that cumbersome documentation procedures, especially the need to produce a ‘no due certificate’ from different banks in the vicinity to obtain RTC-based loans from banks are time-consuming, and this has made gold loans a popular option. It goes without saying that only farmers who own gold will be able to obtain crop loans through this avenue. | Table 7.3: Problems Perceived by Farmers in Obtaining Bank Loans* | | Problems | Percentage of farmers reporting problems | | Bank officials do not cooperate with farmers properly | 79.25 | | Proper information is not given | 47.17 | | Delay in loan processing | 32.08 | | Sanction loan easily for gold loan and not for land (RTC based) | 14.15 | | Difficulty faced in banking operations (% of farmers reporting difficulty) | | | Problem of communication | 48.11 | | Lack of forms in Kannada | 38.68 | | Lack of credit details | 37.74 | | Illiterate (problem with reading & writing) | 16.98 | | Long procedure for documentation/RTC/no due certificate | 43.16 | | Delay in loan sanction/RTC/no due certificate | 18.95 | | Bank does not entertain marginal farmers | 4.21 | | Higher interest rate for delayed repayment | 60.00 | | Insufficient scale of finance | 11.05 | | Bank is inconsiderate about delay in repayment due to crop loss while informal lenders are considerate | 42.11 | Note: Percentages add up to more than 100 per cent because of multiple options selected by respondents.
Source: Based on Field Survey conducted by authors. | Farmers also feel that in case they are unable to repay their loan in time due to bad weather conditions, banks are seldom considerate enough. This is not the case when they take a loan from private moneylenders, who may charge a higher rate of interest but condone the delay in such cases. Now, in the recent budget, it has been recognized that when natural calamities strike, farmers are generally unable to repay their crop loans on time. In such cases, if the loans of affected farmers are rescheduled, then it has been announced that benefits of interest subvention will be applicable to such farmers for the entire period of re-schedulement of their loans. Other major findings of the survey are presented in terms of suggestions in the next chapter. 7.6 Conclusion This study clearly finds that accessibility to credit by small and marginal farmers through commercial banks needs improvement in the state. The fact that around 50 per cent of loans still come from informal sources, and that informal financing is prevalent even for loans taken for income generating purposes, as evident from NSSO data, is a matter of concern. While there has been a substantial improvement in financial inclusion, financial literacy still needs to be enhanced as knowledge of subvention and prompt repayment schemes among borrowers was found to be limited, even though some farmers were aware of the lower interest rate charged by banks. Relending, by taking advantage of the lower interest rate, is not seen to be prevalent in the study area. The major hurdle in accessing formal credit is the non-availability of land ownership records (RoR) or RTC. While land is transferred in the family across generations, mutations (or change in the record of rights) are not automatic and often not effected for years, leaving the land in the name of farmers’ antecedents. Even after computerisation of land records this problem has persisted severely constraining farmers, especially those from SC households. A strong and time bound drive to correct ownership records within a stipulated period will help a large section of small and marginal farmers to access formal credit institutions. Formation of farmers’ groups also helps to overcome this problem. The second major problem that farmers find in accessing crop loans under subvention scheme is the need to obtain ‘no due certificates’ from all bank branches in the area. Each bank charges a certain fee for the same, and the process is time- consuming. This makes the procedure to get crop loans rather complicated, delaying the process and increasing transaction costs. Therefore, farmers tend to prefer subvention under the gold loan (for which often only a simple declaration serves the purpose). A procedure should be put in place so that outstanding loans are automatically entered/updated in the RTC and that the farmer need not visit several banks for ‘no due certificates’. Processing of crop loans should also be made faster with a definite timeline. Chapter 8: Summary of Findings and Suggestions 8.1 Summary of Findings This study has endeavoured to examine in detail, the nature and extent of farmers’ indebtedness in India using secondary data from NSSO and provides a comparative picture of major Indian states. An in-depth analysis has been carried out for the state of Karnataka in terms of access to credit. Seen through the extent of indebtedness, Karnataka is better placed than many Indian states, but is behind Andhra Pradesh, Tamil Nadu, Punjab and Kerala according to the NSSO 59th Round as well as the 70th Round. Thus, over time, the relative positions have remained the same for the state of Karnataka. However, almost 50 per cent of credit is still provided by the informal sector in the state of Karnataka, and this has worsened over the years. Certain states of Southern India are more dependent on informal sources of credit (especially Andhra Pradesh) and poor farmers with small landholdings are much more deprived of formal sources of credit than comparatively richer ones. Thus, small and marginal farmers pay a much higher rate of interest, with a modal value of 36 per cent. While it is heartening to note that most loans are taken for income generating purposes in the southern region, it also indirectly implies that even for these purposes, the poor are not getting full access to credit from formal sources. As the landholding size increases, the access to loans from commercial banks also increases. Data from the 70th Round of NSSO show that in India, amongst farmers who borrowed, 83 per cent of the total loans taken by large farmers are from institutional agencies. At the same time, only 60 per cent of the poorest farmers’ loans are from institutional agencies. Farmers in general, and small and marginal farmers in particular, depend also on moneylenders. In Karnataka, access to institutional agencies for small and marginal farmers has been found to be lower. Further, the 70th Round data indicate that, large farmers have better access from commercial banks (vis-a-vis marginal farmers) while cooperative banks are relatively more accommodative for marginal farmers. Low level of literacy amongst the poor farmers leading to lack of information may result in inaccessibility to credit for them. A social group-wise analysis reveals that in case of commercials banks, large farmers and farmers from the ‘general category’ social group have relatively better access to credit. According to the 70th Round data, only around 12 per cent of borrowing farmers from the SC category in Karnataka have had access to commercial banks for their credit needs. Most of these farmers borrowed from moneylenders and nearly 30 per cent of their credit needs were met by them. Loan disbursement by commercial banks to farmers in higher asset groups among SCs, shows that more than 75 per cent of the total credit provided to SCs is accessed by the top 40 per cent of (SC) farmers classified by assets. At the all-India level, the share of loans from formal sources is relatively lower for SC category farmer households as compared to the general category and a wide variation is also seen across states in credit off take (NSSO, 2003). In states like Maharashtra, Kerala, Odisha and West Bengal, SC households are found to have received more than 70 per cent of their credit from formal sources. Households have also used quite a chunk of their credit for productive purposes. In states like Kerala, Maharashtra and Gujarat, which are more gender sensitive, more than 70 per cent of credit for women-headed farmer households came from the formal sector, and this would be beneficial if followed by other states as well. In conclusion, dependence on informal credit by deprived classes such as SCs/ STs is seen to be relatively higher than the ‘others/general’ category in many Indian states possibly due to lower level of education and networking amongst these groups which makes flow of information relatively difficult. Weaker sections, such as women-headed households, also depend to a large extent on informal sources of credit. Therefore, there is a need to improve access to formal credit for certain segments of the population such as backward classes, the poor and weaker sections of the farmer community. The terms and conditions of credit, especially the rate of interest, is another issue of concern. In this context, as discussed earlier, interest subvention is provided to farmers on short term loans taken for cultivation. As mentioned above, if a farmer takes a short-term loan from a commercial bank or RRB for an agricultural purpose, itis provided at 7 per cent rate of interest, and if he repays back the loan amount within the due date set by banks, subject to the repayment being made within 12 months since the date of disbursement, a further subsidy of 3 per cent is provided. Thus, farmers would be able to get such loans at an interest rate of 4 per cent per annum up to a maximum of ₹3 lakh. On average, at the all-India level, only 38 per cent of the farmers are able to reap the benefit of 7 percent interest rate8. For Karnataka, this figure is even lower, i.e., 26 per cent (among the farmers who borrowed). Out of the total number of farmers who borrow from institutional agencies, only about a quarter borrow at rates of interest below 7 per cent in Karnataka. Thus, while about 50 per cent of farmers in Karnataka borrow from institutional agencies, only 26 per cent of them borrow under the subvention scheme. Therefore, out of the total number of farmers, only about 13 per cent are getting the benefit of lower interest rate. One important question that arises in this context is whether borrowers take advantage of the lower interest rate in the formal sector to relend at a higher interest rate in the informal market. It is revealed through investigation that incidents of re-lending at higher interest in the informal market could be negligible, relending. Therefore, re-lending by taking advantage of the arbitrage opportunity does not seem to be a major problem in this case. An analysis of the data collected from banks for this study revealed that jewel-based loans are becoming popular among banks as well as farmers, especially in the relatively richer districts. This is primarily because many farmers do not have RTCs as mutations do not take place automatically. Secondly, procedurally, getting a jewel loan is much easier and faster. One of the major problems of only RTC-based loans is that one needs to produce a ‘no due certificate’ from all banks in the vicinity, which is expensive in terms of money and time. Moreover, only those farmers who have jewels are able to take advantage of this facility. This is another important concern that needs to be addressed by policymakers. Our discussion with banks also revealed that due to non possession of appropriate documents, landless tenant farmers do not have access to formal credit. Stringent tenancy laws also deter landowners from providing such documentation for fear of losing their land. Field data further confirms the empirical finding that marginal farmers have relatively lower accessibility to credit. Even today, moneylenders seem to play a major role in the credit market. Only around 30 per cent of small farmers who borrowed from commercial banks seem to have received the benefit of interest subvention, while it is around 70 for medium and large farmers. Karnataka is a drought prone state and that seems to be the reason for delays in repayment most of the time. As far as financial inclusion is concerned, farmer households are seen to be almost fully financially included. Around 66 per cent of the households regularly visit banks, and in 43 per cent of the households, women members are enrolled in some SHG groups, and therefore have access to banks. Financial literacy of small and marginal farmers continues to be low in the state. Only about 40 per cent of small and marginal farmers are moderately aware of the Interest Subvention Scheme, while most farmers do not know the details of the prompt repayment scheme. With regard to Financial Integrity, our indirect method of enquiry reveals that around 2 to 3 per cent farmers (if at all) may be engaged in such profiteering activities through arbitrage opportunities in the state. NSSO data also confirm that these activities are rather limited. Given the lower rate of return from agriculture and lack of proper risk mitigating instruments, the Interest Subvention Scheme has definitely benefited farmers, and it is necessary to continue the scheme especially for small and marginal farmers. However, implementation of the scheme needs certain modifications so that the poor and the needy can better benefit from it, and this brings us to the policy suggestions. 8.2 Suggestions In India, about 80 per cent of farmers are small and marginal, and income from agriculture is insufficient for subsistence. During our survey, more than 80 per cent of respondent farmers expressed that they found agriculture unviable and were contemplating leaving the profession. Also, it is known that the excess labour engaged in agriculture can be moved to more productive work without impacting production or productivity of agriculture. 8.2.1 Provision of Interest Subsidy and its Accessibility • In a low-income country like India, with a considerable proportion of people living below the poverty line, self-sufficiency in basic food grains should be of primary importance. Therefore, charging market-driven interest rates to the farmer community, whose rate of return is much lower, may not be appropriate. The subvention scheme, which ensures lower interest rate to the farmers, therefore, is a policy-driven facility that needs to be continued. • Many bank officials also feel that in addition to crop loans, depressed sections like marginal and landless tenant farmers should also have credit facilities with interest subsidies for horticulture products (like fruits) and dairy activities. While in this study we have made this recommendation, subsequently it is heartening to hear the mention of this recommendation in the recent budget speech. In the budget presented on the 1st of February, 2019, Honourable Finance Minister has announced to provide the benefit of interest subvention as well as prompt repayment to all farmers pursuing activities of animal husbandry. • Whether subsidised crop loans should be extended to the medium and large farmers or not can be a matter of debate. Two aspects are worth noting here. Subvention is available only up to a loan amount of ₹3 lakh. Our discussions with farmers and banks’ officials reveal that the total income of medium farmers is also insubstantial according to general standards. Thus, the benefits of interest subvention should also aid medium farmers. The government can, however, decide on some acceptable norms concerning the percentage of small and marginal farmers that should benefit from the scheme. • Discussions with banks’ officials revealed that, often, small and marginal farmers are not able to avail crop loans due to non-repayment of a previous loan. In this regard, the loan waiver drive of both central and state governments spoils repayment habits considerably. When farmers were asked about the utility of a loan waiver policy, they often tend to highlight its benefits. However, when asked whether they prefer irrigation or any such productivity enhancing facility to loan waiver, they unequivocally reveal their preference for the former. Thus, based on field data, and interactions with banks’ officials and farmers, the study suggests that loan waiver drives should be minimised as far as possible (if not abolished). Instead, farmers should be provided essential infrastructure like irrigation and extension services (both found to be lacking in the state). Direct cash benefits to the marginal farmers in times of loss of crop due to drought or flood may be considered, alongside strengthening the implementation of the crop insurance scheme. While in this study we made this recommendation, subsequently it was heartening to observe that in the recent budget Honourable Finance Minister announced direct cash benefit to the farmers due to wide spread farmers’ distress. • The major hurdle in accessing the formal credit market is the non-availability of land ownership records (record of rights or RoR). Land is transferred in the family across generations, but mutations or changes in the RoR are not effected automatically, leaving the land in the name of the person/s who do not own that land for several years. Even after computerisation of land records, this problem persists and severely constrains farmers, especially those in the SC category. A strong and time bound drive to correct ownership records within a stipulated period will help a large section of small and marginal farmers access formal credit institutions. • The second major problem that farmers face in accessing crop loans under the Interest Subvention Scheme is the need to produce a ‘no due certificate’ from all bank branches in the area. Each bank charges a certain fee for the same. This makes the procedure of getting a crop loan rather complicated, which in turn delays the process and makes transaction costs high. Therefore, farmers tend to prefer subvention under a gold loan, since only a simple declaration serves the purpose. A procedure should be put in place so that any outstanding loan is automatically entered/updated in the RTC, thereby obviating the need for the farmers to visit several banks for a ‘no due certificate’. Processing of the crop loan also should be made faster. In this regard, it is worth mentioning that the Report released by the Reserve Bank of India’s Committee on Medium-term Path on Financial Inclusion under the Chairmanship of Deepak Mohanty (RBI, 2015) also emphasised the digitisation of land records. • In addition to a ‘no due certificate’, farmers are, at times, asked to produce an EC from the taluka office, certain legal opinion, etc., all of which add to the farmer’s expenses. Therefore, reducing procedural requirements and fixing a definite timeline for processing of farm loans is a must, as farm activities are seasonal and strongly time bound. • In order to avoid procedural delays, farmers often take interest subvention under the gold loan scheme. However, the poorest of the poor often do not possess sufficient gold for a mortgage. Therefore, some norm should be put in place regarding the percentage of crop loan that can be given against gold under interest subvention. • Till the time the problem of land records is resolved, some norms should be formalised concerning subsidised loans to tenant farmers. Tenant farmers, on declaration, should be given a subsidised crop loan for up to ₹1 lakh under the subvention scheme. Subsequently, the credentials of a randomly sampled subset of such borrowers may be verified by the bank officials for authenticity. Tenant farmers should also be provided with a credit eligibility certificate from relevant authorities. For example, in Andhra Pradesh, revenue authorities issue credit eligibility certificates to tenant farmers who do not have land records (RTC). • Due to stringent tenancy laws only certain sections of people can legally lease land (Appendix Table A8.1). Thus, even though owners of land may be leasing out land to tenant farmers they do not declare it formally, and consequently, some tenant farmers are deprived of formal credit facilities. The Uttar Pradesh government has amended this law to benefit widows and single women, allowing them to lease out their land, and other states should also follow such practice for the benefit of landless farmers. Such stringent laws are also responsible for some amount of land remaining fallow in the country. Appropriate amendments of the tenancy act would undoubtedly be beneficial for landless farmers. • Even though the scheme and prescriptions exist for the Bhumi Heen Kisan, our interviews with banks reveal that implementation of the scheme of providing crop loan to the Bhumi Heen Kisan is far from satisfactory. • The findings of this study regarding the usefulness of the Joint Liability Group (JLG) are illuminating. The need for the formation of farmers’ groups has been talked about in Karnataka for a long time but without the desired level of progress. On the other hand, SHGs with women members are quite common in the state. In the same way, a drive should be initiated to form farmers’ groups which will reduce the problem of lack of RTC. As revealed through our analysis of NSSO data, SC/ST/poor borrowers have a relatively lower access to loans from the formal sector due to lack of RTCs. A drive for the formation of groups incorporating such social classes will be helpful in accessing credit. • According to para 80 of the Union Budget 2014-15, it has been declared that 5 lakh JLGs of Bhoomi Heen Kisan will be financed through the National Bank for Agriculture and Rural Development (NABARD) in that financial year. Guidelines issued by RBI to all scheduled commercial banks in this regard (on November 13, 2014). One of the main objectives of financing JLGs is to augment the flow of credit to tenant farmers, oral lessees, sharecroppers and small/marginal farmers as well as other poor individuals taking up farm activities, off-farm activities and non-farm activities. • Farmers engaged in the cultivation of certain crops, such as sugarcane, are heavily dependent on the demand for their produce from processing factories. Their harvest timing as well as payments, in turn, are determined by the dictate of processing units. Owing to this, several farmers find themselves unable to repay loans within a year, and thus cannot avail prompt repayment facility due to late payment by factories. Loans for such crops may be given consideration and their date of repayment may be considered according to the date of payment made by purchasers of their produce and benefits of interest subvention should also be extended to these farmers whose loans are rescheduled. This recommendation also has got mention in the recent union budget. It has been announced that if a loan is rescheduled due to natural disaster then the benefit of interest subvention and prompt repayment will be applicable for the entire period of re-schedulement of the loan. Though the inability to repay in case of sugarcane farmers is not due to natural disaster, it is a case where repayment is dependent on the sugar mills and hence beyond the control of the farmers. Thus, the above mentioned provision may be extended to these farmers as well. 8.2.2 Financial Literacy • While farmers are generally aware of low interest rate crop loans from the formal sector, many do not know the procedural details of the subventions Scheme, such as how additional amounts are reimbursed if they repay loans within the stipulated time. Therefore, it is imperative to improve financial literacy for the meaningful inclusion of marginalised sections. Information brochures (even in Kannada) are not useful to them as they are not used to grasping information/ facts by reading. Therefore, in the case of timely repayment by a farmer, if some incentive can be given such as declaration of their names in the gram sabha (perhaps with a token reward) which is clearly visible to them, it will carry the message better. • Given the seasonal nature of credit requirements, the Kisan Credit Card or KCC is a boon to farmers as the card has been devised as an instrument to make credit available to farmers for needs arising within a cropping season. Though a large number of KCCs have been disbursed in Karnataka, only a few farmers (5 per cent) are found to be aware of its advantages and are using it in the stipulated manner. Many farmers tend to withdraw the entire eligible amount in one go using the KCC. Lack of awareness is the main reason for not making proper use of KCCs, and, therefore, a special awareness drive is needed. Even a small correction in the KCC policy to make withdrawals only in instalments will go a long way. In view of the inputs given by farmers regarding stages of cultivation, their funding requirements and cost of cultivation, it is suggested that disbursement of credit should be in not less than four instalments as follows: sowing – 35 per cent, weeding and irrigation – 25 per cent, pest-fertilizer – 20 per cent, and harvesting – 20 per cent. Under the financial inclusion drive, financial literacy missions have been taken up by banks. Various existing schemes, including KCC, should be included in this drive. Gram sabhas could be effectively used to disseminate such information. 8.2.3 Financial Integrity • Both field data and insights from discussions with bank officials indicate that, if at all, only a small percentage of people may have used crop loans for re-lending in the state of Karnataka. It was revealed during our survey that a small percentage of people who are engaged in non-farm occupations in urban areas, but have farm land in villages, possibly obtain and use agricultural credit for other income generating activities sometimes. On the other hand, farmers in rural areas primarily utilise borrowed funds for cultivation. 8.3 Some Suggestions for Possible Modifications of the Subvention Scheme/ Alternate Scheme • Overall, we find this to be a well-formulated scheme, and it should continue to provide subsidised credit up to ₹3 lakh to all farmers. • Gold loans, which have become widely prevalent, tend to exclude the poorest of the poor who do not have gold for pledging. Thus, a certain percentage (say 40 to 45 per cent) of crop loans under subvention needs to be given aside from gold loans (only RTC-based or to Bhumi Heen Kisan, preferably below ₹1 lakh). - Usefulness: This will ensure that the marginal/landless farmers get access to credit.
• As explained above, the requirement of a 'no due certificate' is a major hurdle for farmers. This is time-consuming and an expensive procedure and use of technology to address this problem is a necessity. A different portal has to be created and loanee farmers need to be linked so that information about their outstanding loan in another branch can become readily available. Such computerization has been done for the Mudra Scheme through the National Payment Corporation. Land data, if fed to the portal, will also be helpful. - Usefulness: Transaction costs for the farmers can be reduced and the credit delivery process will be smoother.
• Though tenant farmers/oral lessees are supposed to get credit under subvention, in practice they are unable to access loans due to absence of land records (RTC). Our interviews with banks reveal that these farmers often do not have access to formal credit (opening a KCC account is often not possible without an RTC). Landowners often do not like to have written agreements due to potential legal hassles afterwards. JLG groups and farmers' own declaration regarding leasing of land/tenancy should be considered for obtaining the benefits of subvention (currently the state does have some JLGs, but our case study shows these JLGs are engaged in other activities such as dairying, and get a loan at around 12 per cent rate of interest). - Usefulness: Landless farmers can be brought under the bank net for agricultural credit.
• Farmers who cultivate crops like sugarcane and who have tie-ups with companies do not get payments on time and, therefore, lose the benefits of prompt repayment. We suggest that such farmers should not be penalised since the delay in repayment is through no fault of theirs. • Many bankers report that agricultural term loans often become Non-Performing Assets possibly because farmers are unable to repay such high interest rates. A term loan too should be made eligible for subvention if borrowed by small and marginal farmers. For long-term crops like mango, a term loan is usually given (they do not get crop loans). A lower interest rate (subvention) for such loans will help the farmers. • Loan waivers affect repayment habits of farmers negatively, and such practices should be avoided as far as possible. Our survey shows that despite wanting a loan waiver, when faced with a choice between a loan waiver and a good irrigation system, farmers in Karnataka revealed their preference for a good irrigation system. Thus, agricultural infrastructure be made priority. If some of these measures are taken up, the Interest Subvention Scheme can be even more beneficial to the poor and needy farmers.
References Aleem, I. (1990), ‘Imperfect Information, Screening and the Costs of Informal Lending: A Study of a Rural Credit Market in Pakistan’, The World Bank Economic Review, 4(3), 329–49 Bardhan, P. (ed.) (1989), The Economic Theory of Agrarian Institutions, Claredon Press, Oxford. Basu, K. (1989), ‘Rural Credit Markets: The Structure of Interest Rates, Exploitation and Efficiency’, in P. Bardhan (ed.) The Economic Theory of Agrarian Institutions, Claredon Press, Oxford. Bell, C. and T. N. Srinivasan (1989), ‘Interlinked Transactions in Rural Markets: An Empirical Study of Andhra Pradesh, Bihar, and Punjab’, Oxford Bulletin of Economics and Statistics, 51, 73–83. Benjamin, M. P. (1981), Investment Projects in Agriculture: Principles and Case Studies, New York: Longman Publishing Group. Besley, T. (1994), ‘How Do Market Failures Justify Interventions in Rural Credit Markets?’ World Bank Research Observer, 9(1), 27–47. Bhaduri, A. (1977), ‘On the Formation of Usurious Interest Rates in Backward Agriculture’, Cambridge Journal of Economics, 1(4), 341–52. Binswanger, H. and S. Khandker (1995), ‘The Impact of Formal Finance on the Rural Economy of India’, Journal of Development Studies, 32(2), 234-262 Chaudhuri, S. and M. R. Gupta (1996), ‘Delayed Formal Credit, Bribing and the Informal Credit Market in Agriculture: A Theoretical Analysis’, Journal of Development Economics, 51(2), 433-449. Dantwala, M. L. (1986), Strategy of Agricultural Development Since Independence: A Collection of Essays, Oxford University Press and IBH Publishing Company, New Delhi. Eswaran, M. and A. Katowal (1990), ‘Implications of Credit Constraints for Risk Behaviour in Less Developed Economies’, Oxford Economic Papers, 42, 473–82. Fan, S., A. Gulati and S. Thorat (2007), Investment, Subsidies, and Pro-Poor Growth in Rural India, International Food Policy Research Institute (IFPRI), New Delhi. Feder, G., L. J. Lau, J. Y. Lin, and X. Luo (1990), ‘The Relationship between Credit and Productivity in Chinese Agriculture: A Microeconomic Model of Disequilibrium’, American Journal of Agricultural Economics, 72(5), 1151–57. Gangopadhyay, S. and K. Sengupta (1987), ‘Small Farmers, Moneylenders, and Trading Activity’, Oxford Economic Papers, 39(2), 333-342. Government of India (GoI) (2015), Union Budget 2014–15, Interest Subvention Scheme, Reserve Bank of India, Mumbai. Gulati, A. (1989), ‘Input Subsidies in Indian Agriculture: A Statewise Analysis’, Economic and Political Weekly, 24(25), A-57 – A-65. Gulati, A., & Bathla, S. (2002). Capital formation in Indian agriculture: Trends, composition and implications for Growth. Mumbai: National Bank for Agriculture and Rural Development. Gupta, M. R., and Chauduri, S. (1997), ';Formal Credit, Corruption, and the Informal Credit Market in Agriculture: A Theoretical Analysis';, Economica, 64 (254), 331-343 Kochar, A. (1997), ‘Does Lack of Access to Formal Credit Constrain Agricultural Production? Evidence from the Land Tenancy Market in Rural India’, American Journal of Agricultural Economics, 79(3), 754-763. Lele, U. (1981), ‘Cooperatives and the Poor: A Comparative Perspective’, World Development, 9(1), 55-72. Meyer, R. L. (2011), Subsidies as an Instrument in Agriculture Finance: A Review, Washington D.C., The World Bank. Morris, F. (1985), ‘India's Financial System: an overview of its principal structural features’, World Bank Staff Working Paper SWP739. Available online at: http://documents.worldbank.org/curated/en/335301468772770170/Indias-financial-system-an-overview-of-its-principal-structural-features, Last Visited: 20.11.2018 Mitra, M. K., D. C. Roy, and S. K. Mishra (1986), ‘Rural Indebtedness: Concept, Correlates and Consequences – A Study of Four Tribal Villages in the North Lakhimpur Subdivision, Assam’, NEHU Journal of Social Sciences and Humanities, 4(4), 37–43. National Sample Survey Office (NSSO) (2003). ‘India - Situation Assessment Survey of Farmers: NSS 59th Round, Schedule 33’, Ministry of Statistics and Programme Implementation, Government of India. National Sample Survey Office (NSSO) (2013). ‘All India Debt & Investment Survey: NSS 70th Round, Schedule 18.2’, Ministry of Statistics and Programme Implementation, Government of India. Rajeev, M., and S. Deb (2006), ‘Capitalizing on Credit: The Extracting Baniya as Symbiotic Entrepreneur’, appeared in Trends in Social Banking: An emerging Paradigm, ICFAI Business School, Hyderabad. Rajeev, M. and B. P. Vani (2012), ‘Nature and Dimensions of Farmers' Indebtedness in India’, Munich RePec Library Working Paper No. 42358, University of Munich, Munich. Rajeev, M. and B.P. Vani, (2011), ‘Nature and Dimensions of Farmers' Indebtedness in India and Karnataka’, Project Report, Institute for Social and Economic Change, Bangalore. Rajeev, M. And Mahesh, H.P. (2014), “The Indian Banking System: Reforms and Beyond”, in Zajaczkowski, J. Schottli, and Thapa, M. (eds), India in the Contemporary World: Polity, Economy, and International Relations, India: Routledge. Ramachandran, V.K. and M. Swaminathan (2001), Does Informal Credit Provide Security? Rural Banking Policy in India, International Labour Office (ILO), Geneva, Switzerland. Reserve Bank of India (RBI) (2015), Report of the Committee on Medium-term Path on Financial Inclusion, Reserve Bank of India Reports, December 28th 2015, Available online at: https://rbi.org.in/Scripts/PublicationReportDetails.aspx?UrlPage=&ID=836, Last Accessed: 19/01/2019 Siamwalla, A., C. Pinthong, N. Poapongsakorn, P. Satsanguan, P. Nettayarak, W. Mingmaneenakin, and Y. Tubpun (1990), ‘The Thai Rural Credit System: Public Subsidies, Private Information, and Segmented Markets’, The World Bank Economic Review, 4(3), 271–95. Srinivasan, T. N. (1989), ‘On Choice among Creditors and Bonded Labour Contracts’, in P. Bardhan (ed.), The Economic Theory of Agrarian Institutions, Claredon Press, Oxford. Stiglitz, J. E. (1987), ‘Some Theoretical Aspects of Agricultural Policies’, The World Bank Research Observer, 2(1), 43–60. Stiglitz, J. E., and A. Weiss (1981), ‘Credit Rationing in Markets with Imperfect Information’, The American Economic Review, 71(3), 393–410. Stiglitz, J. E., and K. Hoff (1990), ‘Introduction: Imperfect Information and Rural Credit Markets – Puzzles and Policy Perspectives’, The World Bank Economic Review, 4(3), 235–50. Turvey, C. G. (2010), Risk, Savings, and Farm Household Credit Demand Elasticities in Rural China, Cornell University, New York. Udry, C. (1990), ‘Credit Markets in Northern Nigeria: Credit as Insurance in Rural Economy’, The World Bank Economic Review, 4 (3), 251-270 Van de Ven, W. P. M. M., and B. M. S. Van Pragg (1981), ‘The Demand for Deductibles in Private Health Insurance: A Probit Model with Sample Selection’, Journal of Econometrics, 17(2), 229–52.
Appendix Appendix to Chapter 3 | Table A3.1: Source of Credit and Usage of Credit (Landholding-wise Classification): All India | | Landholding in hectares | Share of Household | Source of Credit | Purpose of Usage | | Formal | Informal | Income Generating | Non-income Generating | | < 0.01 | 3.62 | 24.19 | 75.81 | 24.93 | 75.07 | | 0.01 to 0.40 | 29.39 | 44.79 | 55.21 | 35.76 | 64.24 | | 0.41 to 1.00 | 32.49 | 52.64 | 47.36 | 56.90 | 43.10 | | 1.01 to 2.00 | 18.10 | 57.66 | 42.34 | 68.92 | 31.08 | | 2.01 to 4.00 | 10.64 | 65.02 | 34.98 | 78.28 | 21.72 | | 4.01 to 10.00 | 4.82 | 68.99 | 31.01 | 83.25 | 16.75 | | > 10.00 | 0.90 | 67.01 | 32.99 | 81.59 | 18.41 | | Total | 100.00 | 57.68 | 42.32 | 65.15 | 34.85 | | Source: Authors’ analysis of NSSO data, 59th Round |
| Table A3.2: Incidence of Indebtedness and Average Outstanding Loan | | State | Incidence of Indebtedness | Average Outstanding Loan | Median Outstanding Loan within Indebted Household | | All households | Within Indebted Households | | Andhra Pradesh | 82.13 | 23,965 | 29,178 | 13,910 | | Assam | 18.12 | 813 | 4,484 | 1,400 | | Bihar | 33.02 | 4,476 | 13,552 | 5,166 | | Chhattisgarh | 40.19 | 4,122 | 10,256 | 4,125 | | Gujarat | 51.91 | 15,526 | 29,912 | 15,000 | | Haryana | 53.13 | 26,007 | 48,952 | 24,357 | | Jharkhand | 20.87 | 2,205 | 10,564 | 4,000 | | Jammu & Kashmir | 31.84 | 1,903 | 5,977 | 576 | | Karnataka | 61.61 | 18,135 | 29,437 | 10,300 | | Kerala | 64.37 | 33,907 | 52,676 | 22,150 | | Maharashtra | 54.85 | 16,973 | 30,948 | 12,000 | | Madhya Pradesh | 50.80 | 14,218 | 27,987 | 11,200 | | Odisha | 47.83 | 5,871 | 12,275 | 5,700 | | Punjab | 65.44 | 41,576 | 63,529 | 20,000 | | Rajasthan | 52.43 | 18,372 | 35,044 | 15,500 | | Tamil Nadu | 74.47 | 23,963 | 32,178 | 12,360 | | Uttar Pradesh | 40.33 | 7,425 | 18,409 | 8,250 | | Uttaranchal | 7.18 | 1,108 | 15,429 | 6,840 | | West Bengal | 50.12 | 5,237 | 10,449 | 4,650 | | All India | 48.61 | 12,585 | 25,891 | 10,000 | | Source: Authors’ analysis of NSSO data. |
| Table A3.3a: Share of Credit from Formal/Informal Sources across Social Groups and Weaker Sections | | State | ST | SC | OBC | | Formal | Informal | Formal | Informal | Formal | Informal | | Andhra Pradesh | 35.43 | 64.57 | 19.80 | 80.20 | 26.58 | 73.42 | | Assam | 17.65 | 82.35 | 35.45 | 64.55 | 39.27 | 60.73 | | Bihar | 17.04 | 82.96 | 30.61 | 69.39 | 41.24 | 58.76 | | Chhattisgarh | 75.25 | 24.75 | 77.09 | 22.91 | 69.68 | 30.32 | | Gujarat | 71.03 | 28.97 | 36.11 | 63.89 | 68.36 | 31.64 | | Haryana | 93.61 | 6.39 | 57.01 | 42.99 | 61.88 | 38.12 | | Jharkhand | 86.04 | 13.96 | 74.74 | 25.26 | 57.12 | 42.88 | | Jammu & Kashmir | | | 17.50 | 82.50 | 37.25 | 62.75 | | Karnataka | 61.42 | 38.58 | 51.94 | 48.06 | 53.67 | 46.33 | | Kerala | 96.09 | 3.91 | 83.73 | 16.27 | 76.10 | 23.90 | | Maharashtra | 75.65 | 24.35 | 91.19 | 8.81 | 81.16 | 18.84 | | Madhya Pradesh | 63.82 | 36.18 | 35.69 | 64.31 | 52.64 | 47.36 | | Odisha | 78.91 | 21.09 | 77.75 | 22.25 | 73.36 | 26.64 | | Punjab | 68.71 | 31.29 | 28.82 | 71.18 | 35.14 | 64.86 | | Rajasthan | 35.94 | 64.06 | 32.04 | 67.96 | 33.83 | 66.17 | | Tamil Nadu | 44.77 | 55.23 | 39.73 | 60.27 | 55.49 | 44.51 | | Uttar Pradesh | 57.09 | 42.91 | 47.61 | 52.39 | 54.60 | 45.40 | | Uttaranchal | | | 82.59 | 17.41 | 87.55 | 12.45 | | West Bengal | 59.39 | 40.61 | 68.97 | 31.03 | 72.22 | 27.78 | | Others | 68.66 | 31.34 | 69.11 | 30.89 | 59.68 | 40.32 | | Total | 55.71 | 44.29 | 45.98 | 54.02 | 52.98 | 47.02 | Note: ST – Schedule Tribes, SC – Schedule Caste, OBC – Other Backward Class.
Source: Authors’ analysis of NSSO 59th Round data. |
| Table A3.3b: Share of Credit from Formal/Informal Sources across Social Groups and Weaker Sections | | State | Others | Women-headed Household | Total | | Formal | Informal | Formal | Informal | Formal | Informal | | Andhra Pradesh | 39.63 | 60.37 | 25.20 | 74.80 | 31.48 | 68.52 | | Assam | 39.55 | 60.45 | 7.77 | 92.23 | 37.43 | 62.57 | | Bihar | 47.40 | 52.60 | 42.71 | 57.29 | 41.69 | 58.31 | | Chhattisgarh | 77.61 | 22.39 | 46.78 | 53.22 | 72.41 | 27.59 | | Gujarat | 72.67 | 27.33 | 79.14 | 20.86 | 69.49 | 30.51 | | Haryana | 72.21 | 27.79 | 27.00 | 73.00 | 67.51 | 32.49 | | Jharkhand | 61.97 | 38.03 | 2.05 | 97.95 | 64.11 | 35.89 | | Jammu & Kashmir | 74.54 | 25.46 | 2.94 | 97.06 | 67.62 | 32.38 | | Karnataka | 81.86 | 18.14 | 53.23 | 46.77 | 68.89 | 31.11 | | Kerala | 88.35 | 11.65 | 70.04 | 29.96 | 82.35 | 17.65 | | Maharashtra | 85.46 | 14.54 | 73.05 | 26.95 | 83.74 | 16.26 | | Madhya Pradesh | 67.28 | 32.72 | 51.21 | 48.79 | 56.89 | 43.11 | | Odisha | 73.34 | 26.66 | 54.67 | 45.33 | 74.63 | 25.37 | | Punjab | 50.80 | 49.20 | 29.48 | 70.52 | 47.93 | 52.07 | | Rajasthan | 35.45 | 64.55 | 9.77 | 90.23 | 34.17 | 65.83 | | Tamil Nadu | 64.99 | 35.01 | 38.81 | 61.19 | 53.44 | 46.56 | | Uttar Pradesh | 77.99 | 22.01 | 43.39 | 56.61 | 60.29 | 39.71 | | Uttaranchal | 68.35 | 31.65 | 98.06 | 1.94 | 76.12 | 23.88 | | West Bengal | 52.02 | 47.98 | 56.28 | 43.72 | 57.92 | 42.08 | | Others | 61.19 | 38.81 | 37.06 | 62.94 | 63.27 | 36.73 | | Total | 66.12 | 33.88 | 45.86 | 54.14 | 57.67 | 42.33 | | Source: Authors’ analysis of NSSO 59th Round data. |
| Table A3.4: Loans Outstanding from Different Sources: Karnataka | | Sources of Credit | Share of Loans
(No. of Loans) | Average Amount of Loan Outstanding
(in ₹) | Median Loan Outstanding by Sources
(in ₹) | Modal Rate of Interest (in %) | | Government | 1.51 | 31043.92 | 20520 | 14 | | Cooperative society | 21.23 | 19698.37 | 10325 | 18 | | Commercial Bank | 29.48 | 41989.13 | 15000 | 12 | | Formal Source | 52.22 | 32619.97 | 14985 | 12 | | Agricultural or Professional Moneylender | 29.74 | 16599.07 | 10000 | 36 | | Trader | 4.33 | 10631.38 | 6350 | 36 | | Relatives & Friends | 10.37 | 16118.53 | 5000 | 0 | | Doctors, Lawyers & Others | 0.80 | 11882.61 | 4000 | 0 | | Others | 2.53 | 20348.6 | 11000 | 36 | | Informal Source | 47.78 | 16073.54 | 8240 | 36 | | Total | 100.00 | 24706.94 | 10000 | 36 | | Source: Authors’ analysis of NSSO 59th Round data. |
| Table A3.5: Incidence of Indebtedness across Landholdings in Karnataka | | Land in Hectares | Share of Households | Incidence of Indebtedness | Amount Outstanding per Loan
(in ₹) | Source of Loan | Loan Used for | Modal Interest Rate | | Formal | Informal | IGA | NIGA | | <0.01 | 0.96 | 36.88 | 12073.42 | 18.90 | 81.10 | 24.44 | 75.56 | 36.00 | | 0.01–0.40 | 13.26 | 58.37 | 13569.48 | 32.25 | 67.75 | 39.80 | 60.20 | 36.00 | | 0.41–1.00 | 38.80 | 59.48 | 18646.10 | 61.68 | 38.32 | 68.44 | 31.56 | 36.00 | | 1.01–2.00 | 21.22 | 65.42 | 19269.32 | 58.14 | 41.86 | 79.82 | 20.18 | 12.00 | | 2.01–4.00 | 16.06 | 62.00 | 30450.15 | 74.12 | 25.88 | 87.88 | 12.12 | 12.00 | | 4.01–10.00 | 8.42 | 69.40 | 54147.48 | 86.49 | 13.51 | 85.98 | 14.02 | 14.00 | | >10.00 | 1.27 | 58.68 | 91485.10 | 97.00 | 3.00 | 97.93 | 2.07 | 15.00 | | Total | 100.00 | 61.61 | 24706.94 | 68.89 | 31.11 | 78.04 | 21.96 | 36.00 | | Source: Authors’ analysis of 59th Round NSSO data. |
| Table A3.6: Debt Structure across Expenditure Class: Karnataka | Per capita Expenditure
(in ₹) | Share of Households | Incidence of Indebtedness | Amount Outstanding per Loan
(in ₹) | Source of Loan | Loan Used for | | Formal | Informal | IGA* | NIGA** | | Less than 300 | 5.90 | 40.1 | 11683.06 | 29.38 | 70.62 | 57.10 | 42.90 | | 300 to 420 | 35.00 | 62.4 | 16081.28 | 54.24 | 45.76 | 65.20 | 34.80 | | 420 and above | 59.10 | 63.3 | 30056.37 | 73.95 | 26.05 | 72.30 | 27.70 | | Total | 100.00 | 61.6 | 24706.94 | 68.89 | 31.11 | 69.40 | 30.60 | * Income Generating Activities
** Non Income Generating Activities
Source: Authors’ analysis of NSSO 59th Round data. |
| Table A3.7: Incidence of Indebtedness, Borrowing, and Average Loan Outstanding per Farmer Household | | State | Incidence of Indebtedness | Percentage of HH that borrowed since 2000 | Average Loan Outstanding per HH | Average Loan Outstanding per Indebted HH | Total Number of Indebted Farmer HHs | | Assam | 9.3 | 27.1 | 9,132 | 97,789 | 3,30,283 | | Jammu & Kashmir | 13.6 | 26 | 25,063 | 1,84,384 | 1,58,081 | | Chhattisgarh | 16.2 | 40.1 | 22,193 | 1,36,891 | 4,41,340 | | Jharkhand | 20 | 32.9 | 13,779 | 68,956 | 6,10,158 | | Madhya Pradesh | 28.5 | 48.4 | 52,353 | 1,83,690 | 16,85,324 | | Himachal Pradesh | 28.9 | 36.7 | 78,564 | 2,71,826 | 3,04,728 | | Odisha | 29.6 | 49 | 24,795 | 83,835 | 15,05,294 | | Haryana | 29.8 | 44.5 | 1,29,662 | 4,34,404 | 4,46,007 | | Gujarat | 30.1 | 43.4 | 57,297 | 1,90,164 | 11,87,573 | | West Bengal | 30.3 | 51.4 | 29,573 | 97,708 | 22,45,577 | | Uttaranchal | 31.4 | 47.9 | 52,665 | 1,67,596 | 3,46,409 | | Bihar | 31.4 | 47.5 | 39,306 | 1,25,153 | 25,17,152 | | Uttar Pradesh | 32 | 45.1 | 50,608 | 1,58,291 | 58,21,168 | | Punjab | 38.9 | 65.1 | 2,40,241 | 6,17,156 | 4,46,884 | | Rajasthan | 40.8 | 64.1 | 1,04,171 | 2,55,439 | 27,10,941 | | Maharashtra | 41.3 | 58.3 | 85,467 | 2,07,185 | 29,65,293 | | Tamil Nadu | 50.3 | 82.2 | 1,32,511 | 2,63,300 | 18,70,347 | | Karnataka | 51.8 | 74.7 | 1,32,238 | 2,55,335 | 22,51,167 | | Kerala | 53.6 | 75.2 | 3,42,212 | 6,38,951 | 18,41,589 | | Andhra Pradesh | 62.8 | 92.2 | 1,75,514 | 2,79,305 | 24,19,441 | | Telangana | 69 | 88 | 1,35,490 | 1,96,444 | 18,19,893 | | Total | 35 | 53.5 | 77,089 | 2,20,280 | 3,40,33,281 | | Source: Authors’ analysis of NSSO 70th Round data. |
| Table A3.8: Incidence of Indebtedness (IoI) as on June 30, 2012 and Incidence of Borrowing between July 1, 2012 and December 31, 2012 of Farmer Households in Rural Areas of Each State | | State | IOI | IOB | State | IOI | IOB | | Andaman & Nicobar Island | 20.3 | 5.6 | Lakshadweep | 8.0 | 4.6 | | Andhra Pradesh | 62.8 | 50.9 | Madhya Pradesh | 28.5 | 16.4 | | Arunachal Pradesh | 6.0 | 8.2 | Maharashtra | 41.3 | 13.3 | | Assam | 9.4 | 12.1 | Manipur | 11.3 | 14.7 | | Bihar | 31.6 | 13.2 | Meghalaya | 2.9 | 3.5 | | Chandigarh | 3.1 | 0.0 | Mizoram | 3.9 | 3.5 | | Chhattisgarh | 16.2 | 13.4 | Nagaland | 1.8 | 5.1 | | Dadra and Nagar Havelli | 6.2 | 1.9 | Odisha | 29.6 | 18.5 | | Daman and Diu | 20.3 | 8.3 | Puducherry | 40.5 | 49.7 | | Delhi | 3.0 | 1.0 | Punjab | 38.9 | 28.0 | | Goa | 15.5 | 4.0 | Rajasthan | 40.8 | 19.8 | | Gujarat | 30.1 | 6.9 | Sikkim | 6.2 | 2.0 | | Haryana | 29.8 | 14.7 | Tamil Nadu | 50.3 | 40.6 | | Himachal Pradesh | 28.9 | 7.6 | Telangana | 69.0 | 37.1 | | Jammu and Kashmir | 13.6 | 8.9 | Tripura | 12.0 | 10.6 | | Jharkhand | 20.0 | 10.1 | Uttar Pradesh | 32.0 | 10.8 | | Karnataka | 51.8 | 24.4 | Uttarakhand | 31.4 | 12.4 | | Kerala | 53.7 | 32.3 | West Bengal | 30.3 | 18.8 | | India | 35.0 | 18.1 | | Source: Computed using unit level NSSO 70th Round Debt and Investment Survey data. |
| Table A3.9: IOI, Borrowings, and Other Indicators across Landholdings – Karnataka vs All-India | | | % age of HHs in Different Categories | % age of Indebted HHs in Total HHs | Incidence of Indebtedness (within the category) | % age of HHs that Borrowed since 2000 | Average Amount Outstanding per Farmer HH | Average Amount Outstanding per Indebted HH | | KARNATAKA | | Marginal | 59.0 | 55.9 | 49.0 | 73.8 | 1,07,455 | 2,19,077 | | Small | 20.9 | 24.6 | 60.9 | 77.5 | 1,53,198 | 2,51,735 | | Semi-Medium | 13.6 | 12.6 | 48.0 | 72.9 | 1,50,465 | 3,13,448 | | Medium | 5.7 | 6.0 | 54.5 | 75.9 | 2,35,893 | 4,33,063 | | Large | 0.7 | 0.9 | 63.2 | 84.4 | 3,85,809 | 6,10,372 | | Karnataka | 100.0 | 100.0 | 51.8 | 74.7 | 1,32,238 | 2,55,335 | | ALL INDIA | | Marginal | 76.2 | 68.6 | 31.5 | 48.9 | 56,826 | 1,80,387 | | Small | 14.0 | 17.4 | 43.5 | 65.1 | 1,12,160 | 2,57,847 | | Semi-Medium | 6.7 | 9.3 | 48.9 | 72.4 | 1,49,063 | 3,04,710 | | Medium | 2.7 | 4.2 | 53.6 | 73.9 | 2,46,265 | 4,59,131 | | Large | 0.4 | 0.5 | 44.3 | 78.4 | 3,65,911 | 8,25,125 | | All India | 100.0 | 100.0 | 35.0 | 53.5 | 77,089 | 2,20,280 | HH: Households
Source: Computed using unit level NSSO 70th Round Debt and Investment Survey data. |
| Table A3.10: IOI, Borrowings and Other Indicators across Social Groups | | (% of Households) | | | % of HHs | % of Total Indebted HHs | IoI | Borrowing since 2000 | Average amount outstanding per farmer HH in ₹ | Average amount outstanding per Indebted HH in ₹ | | Karnataka | | ST | 5.9 | 6.1 | 54.1 | 78.5 | 87117 | 161112 | | SC | 20.4 | 16.3 | 41.4 | 64.2 | 92275 | 222731 | | OBC | 51.2 | 58.0 | 58.7 | 80.9 | 141248 | 240756 | | Others | 22.5 | 19.6 | 44.9 | 68.9 | 159656 | 355307 | | All | 100.0 | 100.0 | 51.8 | 74.7 | 132238 | 255335 | | All India | | ST | 13.9 | 7.7 | 19.5 | 35.3 | 22810 | 117063 | | SC | 16.2 | 16.5 | 35.6 | 53.9 | 64196 | 180518 | | OBC | 45.1 | 50.0 | 38.8 | 57.9 | 81937 | 211173 | | Others | 24.8 | 25.7 | 36.4 | 55.6 | 107185 | 294477 | | All | 100.0 | 100.0 | 35.0 | 53.5 | 77089 | 220280 | | Source: Computed using unit level NSSO 70th Round Debt and Investment Survey data. |
| Table A3.11: Borrowing from Different Credit Agencies | | State | Govt | Coop Society | CB & RRB | SHG | SHG NBFC | Other Institutional Agency | Institutional Agency | Money-lenders | Relatives & Friends | Other Non-institutional Agency | Total Non-institutional Agency | | J&K | 1.1 | 2.1 | 26.4 | 0.0 | 0.0 | 1.4 | 31.0 | 0.6 | 68.0 | 0.5 | 69.0 | | HP | 0.4 | 21.6 | 30.7 | 1.8 | 0.5 | 1.5 | 56.5 | 2.7 | 39.4 | 1.4 | 43.5 | | Punjab | 0.9 | 32.7 | 18.0 | 0.0 | 0.0 | 1.3 | 52.9 | 22.8 | 21.2 | 3.1 | 47.1 | | Uttarakhand | 2.5 | 13.9 | 23.8 | 0.1 | 0.6 | 2.0 | 42.8 | 15.7 | 40.2 | 1.3 | 57.2 | | Haryana | 1.7 | 27.2 | 24.3 | 0.1 | 0.0 | 1.7 | 54.9 | 34.3 | 8.2 | 2.6 | 45.1 | | Rajasthan | 0.6 | 18.8 | 16.8 | 0.3 | 0.3 | 1.7 | 38.5 | 52.7 | 6.6 | 2.2 | 61.5 | | UP | 0.8 | 8.3 | 28.5 | 0.9 | 0.5 | 1.7 | 40.7 | 23.0 | 30.5 | 5.8 | 59.3 | | Bihar | 1.1 | 2.2 | 11.3 | 2.2 | 1.0 | 1.3 | 19.1 | 55.7 | 16.5 | 8.7 | 80.9 | | Assam | 1.8 | 8.1 | 9.3 | 4.1 | 3.0 | 3.7 | 29.9 | 31.1 | 32.4 | 6.6 | 70.1 | | WB | 0.4 | 18.8 | 9.5 | 8.8 | 4.9 | 8.1 | 50.5 | 23.3 | 21.9 | 4.4 | 49.5 | | Jharkhand | 1.5 | 3.7 | 20.2 | 1.7 | 2.8 | 1.3 | 31.2 | 22.3 | 42.5 | 4.0 | 68.8 | | Odisha | 0.1 | 25.6 | 10.7 | 8.5 | 1.6 | 2.2 | 48.8 | 29.4 | 18.1 | 3.8 | 51.2 | | Chhattisgarh | 0.8 | 32.9 | 7.3 | 1.1 | 2.2 | 0.4 | 44.8 | 23.0 | 28.5 | 3.7 | 55.2 | | MP | 1.8 | 20.7 | 23.5 | 0.5 | 0.5 | 0.8 | 47.7 | 43.7 | 6.7 | 1.9 | 52.3 | | Gujarat | 0.9 | 32.2 | 17.8 | 0.5 | 0.7 | 3.7 | 55.8 | 16.3 | 26.4 | 1.5 | 44.2 | | Maharashtra | 1.0 | 45.7 | 14.3 | 1.6 | 1.0 | 1.1 | 64.8 | 12.4 | 21.6 | 1.2 | 35.2 | | AP | 1.1 | 15.8 | 14.8 | 17.9 | 0.2 | 0.7 | 50.6 | 43.8 | 4.3 | 1.4 | 49.4 | | Karnataka | 0.9 | 23.8 | 10.7 | 12.6 | 0.9 | 1.9 | 50.9 | 28.9 | 14.6 | 5.5 | 49.1 | | Kerala | 0.2 | 33.4 | 22.0 | 7.3 | 1.1 | 8.2 | 72.1 | 10.6 | 15.2 | 2.1 | 27.9 | | TN | 0.1 | 21.9 | 19.4 | 5.8 | 1.6 | 7.1 | 56.0 | 37.3 | 4.5 | 2.1 | 44.0 | | Telangana | 0.6 | 13.5 | 14.9 | 17.7 | 0.1 | 0.7 | 47.6 | 49.2 | 1.9 | 1.3 | 52.4 | | Total | 0.8 | 20.2 | 17.4 | 6.2 | 1.1 | 3.0 | 48.6 | 31.8 | 16.2 | 3.4 | 51.4 | Govt: Government; Coop Society: Cooperative Societies; CB & RRB: Commercial Banks and Regional Rural Banks; SHG: Self-help Groups; SHG NBFC: Self-help Group linked through Non-banking Financial Company.
Source: Computed using unit level NSSO 70th Round Debt and Investment Survey data. |
| Table A3.12: Amount of Loan (in %) Borrowed from Different Sources across Different Categories of Farmers (According to Land Size) | | | Cooperative Society | CB & RRB | Other Institutional Agency | Institutional Agency | Money-lenders | Relatives & Friends | Other Non-institutional Agency | Non-institutional Agency | | Karnataka | | Marginal | 25.4 | 13.2 | 12.7 | 51.3 | 31.8 | 13.5 | 3.4 | 48.7 | | Small | 36.2 | 16.9 | 6.3 | 59.4 | 21.1 | 10.0 | 9.4 | 40.6 | | Semi-medium | 23.6 | 31.0 | 10.2 | 64.9 | 23.9 | 9.6 | 1.6 | 35.1 | | Medium | 36.9 | 29.1 | 2.0 | 68.0 | 20.2 | 9.5 | 2.3 | 32.0 | | Large | 36.8 | 23.2 | 0.0 | 59.9 | 33.7 | 2.4 | 3.9 | 40.1 | | All | 29.2 | 19.5 | 9.2 | 57.9 | 26.5 | 11.2 | 4.4 | 42.1 | | All India | | Marginal | 23.2 | 26.5 | 9.6 | 59.4 | 26.3 | 11.9 | 2.4 | 40.6 | | Small | 29.0 | 31.2 | 5.4 | 65.6 | 26.2 | 5.9 | 2.3 | 34.4 | | Semi-medium | 30.2 | 33.6 | 5.2 | 68.9 | 24.9 | 4.8 | 1.4 | 31.1 | | Medium | 29.9 | 37.3 | 3.5 | 70.7 | 25.0 | 3.7 | 0.6 | 29.3 | | Large | 35.4 | 45.9 | 2.0 | 83.3 | 14.0 | 1.9 | 0.8 | 16.7 | | All | 26.2 | 29.9 | 7.4 | 63.5 | 25.7 | 8.7 | 2.0 | 36.5 | | Source: Computed using unit level NSSO 70th Round Debt and Investment Survey data. |
| Table A3.13: Social Category-wise Distribution of Loans by Different Sources | | | Coop Society | CB & RRB | Other Institutional Agency | Institutional Agency | Money-lenders | Relatives & Friends | Other Non-institutional Agency | Non-institutional Agency | | KARNATAKA | | ST | 18.44 | 16.07 | 5.74 | 40.25 | 53.38 | 2.76 | 3.61 | 59.75 | | SC | 20.30 | 11.39 | 12.30 | 44.00 | 30.52 | 18.23 | 7.25 | 56.00 | | OBC | 34.63 | 17.02 | 7.97 | 59.62 | 25.71 | 9.68 | 4.99 | 40.38 | | Others | 24.14 | 29.01 | 10.65 | 63.80 | 22.40 | 12.04 | 1.75 | 36.20 | | Total | 29.16 | 19.53 | 9.22 | 57.91 | 26.49 | 11.25 | 4.35 | 42.09 | | ALL INDIA | | ST | 21.50 | 32.20 | 9.60 | 63.30 | 25.40 | 8.90 | 2.40 | 36.70 | | SC | 25.90 | 17.90 | 9.10 | 52.90 | 35.60 | 9.30 | 2.20 | 47.10 | | OBC | 25.30 | 28.70 | 7.40 | 61.40 | 27.80 | 8.50 | 2.30 | 38.60 | | Others | 28.20 | 35.30 | 6.70 | 70.20 | 19.40 | 8.80 | 1.60 | 29.80 | | Total | 26.20 | 29.90 | 7.40 | 63.50 | 25.70 | 8.70 | 2.00 | 36.50 | | Source: Computed using unit level NSSO 7th Round Debt and Investment Survey data. |
| Table A3.14: Percentage of Credit (Amount of Loan-wise Percentage) by Commercial Banks given to SCs across Asset Groups | | Asset Categories | Karnataka | All India | | Lowest Quintile | 0.00 | 1.97 | | Second Quintile | 4.32 | 5.22 | | Third Quintile | 18.51 | 13.47 | | Fourth Quintile | 42.73 | 19.01 | | Highest Quintile | 34.44 | 60.34 | | Total | 100.00 | 100.00 | | Source: Computed using unit level NSSO 70th Round Debt and Investment Survey data. |
| Table A3.15: Utilisation of Loan from Institutional and Non-institutional Agencies | | Sources | All India | Karnataka | | Purpose | Institutional Agency | Non-Institutional Agency | Total | Institutional Agency | Non-institutional Agency | Total | | Capital exp in Farm Business | 19.8 | 8.2 | 15.6 | 17.8 | 10.2 | 14.6 | | Current exp in Farm Business | 30.9 | 10.8 | 23.6 | 32.2 | 5.9 | 21.1 | | Capital & Current Expenditure in Non-farm Business | 11.3 | 5.0 | 9.0 | 10.0 | 5.1 | 8.0 | | Consumption | 11.8 | 35.9 | 20.6 | 11.0 | 40.3 | 23.4 | | Education | 2.7 | 2.0 | 2.4 | 1.7 | 3.6 | 2.5 | | Medical Expenditure | 2.7 | 9.0 | 5.0 | 0.8 | 10.6 | 4.9 | | Housing | 15.1 | 18.5 | 16.3 | 21.2 | 20.5 | 20.9 | | Others | 5.6 | 10.7 | 7.4 | 5.2 | 3.8 | 4.6 | | Total | 100.0 | 100.0 | 100.0 | 100.0 | 100.0 | 100.0 | | Source: Computed using unit level NSSO 70th Round Debt and Investment Survey data. |
| Table A3.16: Average Amount of Loan Borrowed for Different Purposes across Sources | | Sources | Karnataka | All India | | Purpose | Institutional Agency | Non-institutional Agency | Total | Institutional Agency | Non-institutional Agency | Total | | Capital Exp in Farm Business | 95,396 | 75,821 | 88,663 | 94,422 | 52,602 | 81,939 | | Current Exp in Farm Business | 70,905 | 30,450 | 61,377 | 58,467 | 39,140 | 54,021 | | Capital & Current Expenditure in non-farm Business | 2,13,133 | 1,06,880 | 1,68,110 | 1,68,055 | 76,794 | 1,35,460 | | Consumption | 34,655 | 50,367 | 44,808 | 47,525 | 32,840 | 37,009 | | Education | 65,865 | 67,492 | 66,835 | 1,01,136 | 39,594 | 69,507 | | Medical Expenditure | 32,133 | 59,100 | 54,688 | 64,215 | 29,069 | 35,821 | | Housing | 1,16,784 | 78,393 | 97,136 | 1,32,621 | 59,149 | 87,726 | | Others | 80,537 | 62,768 | 73,365 | 66,020 | 60,552 | 63,024 | | Total | 76,683 | 57,797 | 67,411 | 75,622 | 41,033 | 57,840 | | Source: Computed using unit level NSSO 70th Round Debt and Investment Survey data. |
| Table A3.17: IOI across Landholdings in Karnataka and All India: Comparison between 59th and 70th NSSO Rounds | | Land in Hectares | Karnataka 59th Round | All India
59th Round | Karnataka 70th Round | All India
70th Round | | <0.01 | 36.88 | 49.33 | 12.92 | 32.55 | | 0.01 – 0.40 | 58.37 | 44.33 | 43.60 | 30.20 | | 0.41 – 1.00 | 59.48 | 45.22 | 53.00 | 32.89 | | 1.01 – 2.00 | 65.42 | 50.92 | 60.86 | 43.50 | | 2.01 – 4.00 | 62.00 | 57.46 | 48.00 | 48.92 | | 4.01 – 10.00 | 69.40 | 65.42 | 54.47 | 53.64 | | >10.00 | 58.68 | 66.11 | 63.21 | 44.35 | | Source: Authors’ analysis of NSSO 59th and 70th Round data. |
| Table A3.18: IOI across Social Groups in Karnataka and All India: Comparison between 59th and 70th NSSO Rounds | | Social Groups | Karnataka 59th Round | All India 59th Round | Karnataka 70th Round | All India 70th Round | | ST | 57.16 | 36 | 54.1 | 19.5 | | SC | 51.88 | 50 | 41.4 | 35.6 | | OBC | 68.96 | 52 | 58.7 | 38.8 | | Others | 58.70 | 50 | 44.9 | 36.4 | | Source: Authors’ analysis of NSSO 59th and 70th Round data. |
| Table A3.19: Source and Usage of Loans across Landholdings in Karnataka: Comparison between 59th and 70th NSSO Rounds | | Land in Hectares | Source of Loan 59th Round | Loan Utilisation 59th Round | Source of Loan 70th Round | Loan Utilisation 70th Round | | Institutional | Non-institutional | IGA | NIGA | Institutional | Non-institutional | IGA | NIGA | | <0.01 | 18.90 | 81.10 | 24.44 | 75.56 | 41.8 | 58.1 | 13.6 | 86.36 | | 0.01 - 0.40 | 32.25 | 67.75 | 39.80 | 60.20 | 60.9 | 39.0 | 5.82 | 94.18 | | 0.41 - 1.00 | 61.68 | 38.32 | 68.44 | 31.56 | 59.4 | 40.5 | 36.6 | 63.39 | | 1.01 - 2.00 | 58.14 | 41.86 | 79.82 | 20.18 | 65.5 | 34.4 | 52.6 | 47.32 | | 2.01 - 4.00 | 74.12 | 25.88 | 87.88 | 12.12 | 68.9 | 31.0 | 51.3 | 48.63 | | 4.01 - 10.00 | 86.49 | 13.51 | 85.98 | 14.02 | 70.7 | 29.3 | 62.8 | 37.19 | | >10.00 | 97.00 | 3.00 | 97.93 | 2.07 | 83.3 | 16.6 | 59.2 | 40.74 | | Source: Authors’ analysis of NSSO 59th and 70th Round data. |
Appendix to Chapter 4 Examining the percentage of farmers who repaid loans on time (that is within a year) we observe that for all India it is around 37 per cent and for Karnataka the figure is little lower at 27 per cent. These are those farmers who did not necessarily get loans at 7 per cent rate of interest due to various reasons. But it is clear that about one-third of the farmers make prompt repayment of loans. | Table A4.1: Percentage of Farmers Classified in Terms of Interest Rate Charged Based on Borrowing | | State | Formal | Informal | | Nil | Up to 7% | 7.01-12 | 12.01 & above | Nil | Up to 7% | 7.01–12% | 12.01–24% | 24.0-36% | >36% | | J&K | 0 | 21.91 | 27.98 | 50.11 | 98.16 | 0.73 | 0.27 | 0.73 | 0.06 | 0.05 | | Himachal Pradesh | 0.37 | 31.63 | 42.89 | 25.11 | 90.93 | 3.93 | 1.67 | 2.46 | 0.93 | 0.08 | | Punjab | 0 | 62.84 | 27.31 | 10 | 46.04 | 2.87 | 2.97 | 38.39 | 8.34 | 1.39 | | Chandigarh | 0 | 0 | 100 | 0 | 100 | 0 | 0 | 0 | 0 | 0 | | Uttaranchal | 0 | 44.61 | 33.03 | 22 | 70.44 | 0.7 | 1.56 | 21.29 | 1.31 | 4.7 | | Haryana | 0 | 63.26 | 26.73 | 10 | 17.18 | 8.8 | 0.73 | 55.97 | 13.49 | 3.82 | | Delhi | 0 | 4.19 | 52.63 | 43 | 54.87 | 3.09 | 0 | 37.63 | 3.25 | 1.16 | | Rajasthan | 7.47 | 57.46 | 22.97 | 12 | 10.96 | 0.17 | 1.05 | 78.18 | 8.22 | 1.42 | | Uttar Pradesh | 0.28 | 58.02 | 26.46 | 15 | 51.08 | 4.15 | 1.81 | 5.03 | 15.22 | 22.71 | | Bihar | 0.2 | 50.95 | 24.05 | 25 | 18.95 | 3.72 | 1.8 | 1.27 | 9.08 | 65.19 | | Sikkim | 1.54 | 16.21 | 68.36 | 13.88 | 41.97 | 15.73 | 0.82 | 32.02 | 3.71 | 5.76 | | Arunachal | 0.14 | 44.07 | 33.01 | 23 | 50.54 | 28.33 | 15.96 | 3.45 | 1.73 | 0 | | Nagaland | 0 | 7.56 | 61.4 | 31.04 | 17.12 | 25.74 | 34.13 | 1.45 | 3.45 | 18.11 | | Manipur | 0.51 | 7.14 | 23.11 | 69.24 | 10.05 | 10.64 | 0.47 | 7.06 | 9.7 | 62.07 | | Mizoram | 2.76 | 13.76 | 58.9 | 24.59 | 95.97 | 2.38 | 1.65 | 0 | 0 | 0 | | Tripura | 0 | 17.47 | 31.66 | 50.87 | 32.89 | 3.7 | 10.49 | 44.86 | 3.47 | 4.59 | | Meghalaya | 0.57 | 39 | 44.35 | 16.08 | 71.5 | 12.99 | 12.85 | 1.71 | 0 | 0.94 | | Assam | 3.22 | 19.86 | 41.7 | 35.22 | 44.56 | 9.93 | 13.07 | 6 | 6.5 | 19.94 | | West Bengal | 0.07 | 38.11 | 32.08 | 29.73 | 44.91 | 4.79 | 2.62 | 12.6 | 13.41 | 21.68 | | Jharkhand | 0.5 | 61.34 | 20.93 | 17.24 | 62.92 | 1.65 | 1.35 | 3.34 | 6.18 | 24.56 | | Odisha | 1.8 | 45.12 | 28.37 | 24.71 | 34.79 | 3.95 | 0.76 | 7.82 | 28.82 | 23.86 | | Chhattisgarh | 0.33 | 74.56 | 15.67 | 9.43 | 52.41 | 24.46 | 1.09 | 7.79 | 8.76 | 5.49 | | Madhya Pradesh | 15.65 | 54.31 | 20.25 | 9.78 | 13.68 | 2.88 | 3.73 | 28.55 | 41.74 | 9.43 | | Gujarat | 2.44 | 66.08 | 22.93 | 8.55 | 61.47 | 0.77 | 1.39 | 12.98 | 14.73 | 8.66 | | Daman & Diu | 0 | 1.28 | 24.79 | 73.92 | 47.63 | 0 | 0 | 52.37 | 0 | 0 | | Dadra & Nagar Haveli | 0 | 7.54 | 55.27 | 37.19 | 98.89 | 0 | 0 | 0 | 0 | 1.11 | | Maharashtra | 3.48 | 54.38 | 27.21 | 14.93 | 62.03 | 3.24 | 0.67 | 6.46 | 16.3 | 11.31 | | Andhra Pradesh | 2.38 | 13.81 | 77.94 | 5.87 | 8.3 | 0.11 | 2.16 | 78.19 | 10.53 | 0.72 | | Karnataka | 0.64 | 26.63 | 43.38 | 29.35 | 29.69 | 1.42 | 2.33 | 22.65 | 33.41 | 10.5 | | Goa | 0 | 0 | 85.13 | 14.87 | 73.46 | 26.54 | 0 | 0 | 0 | 0 | | Lakshadweep | 5.94 | 10.51 | 50.32 | 33.23 | 100 | 0 | 0 | 0 | 0 | 0 | | Kerala | 0.12 | 20.6 | 44.11 | 35.16 | 55.27 | 4.31 | 6.02 | 14.51 | 6.73 | 13.16 | | Tamil Nadu | 2.47 | 13.13 | 41.12 | 43.28 | 11.27 | 0.28 | 3.14 | 34.97 | 32.98 | 17.36 | | Puducherry | 0 | 2.2 | 48.2 | 49.59 | 19.16 | 0 | 1.92 | 25.5 | 48.34 | 5.08 | | Andaman & Nicobar Is. | 0.57 | 7.02 | 57.35 | 35.05 | 39.16 | 0.71 | 4.98 | 1.89 | 22.47 | 30.79 | | Telangana | 3.57 | 56.84 | 31.09 | 8.5 | 3.59 | 1.53 | 0.58 | 51.95 | 41.19 | 1.16 | | All India | 2.38 | 38.34 | 37.2 | 22.09 | 31.26 | 2.93 | 2.28 | 28.7 | 17.98 | 16.86 | | Source: Authors’ analysis of NSSO 70th Round data. |
| Table A4.2: Share of Households Classified according to Landholdings and Interest Rates Charged | | Karnataka | | | Nil | Up to 7% | 7 to 12% | 12 to 24% | 24 to 36% | > 36% | | Institutional Agency | | Marginal | 0.91 | 18.00 | 42.47 | 38.62 | | | | Small | 0.61 | 35.33 | 42.75 | 21.31 | | | | Semi-medium | | 36.20 | 43.23 | 20.56 | | | | Medium | | 40.58 | 46.06 | 13.36 | | | | Large | | 32.62 | 65.43 | 1.95 | | | | All | 0.63 | 26.65 | 43.26 | 29.46 | | | | Non-institutional Agency | | Marginal | 27.96 | 0.46 | 1.82 | 27.31 | 31.55 | 10.89 | | Small | 31.31 | 5.26 | 2.57 | 15.12 | 32.01 | 13.72 | | Semi-medium | 33.70 | | | 12.72 | 46.59 | 6.99 | | Medium | 38.25 | | | 27.84 | 32.79 | 1.12 | | Large | 18.26 | | | 24.07 | 57.67 | | | All | 29.78 | 1.50 | 1.69 | 22.79 | 33.66 | 10.58 | | All India | | | Nil | Up to 7% | 7 to 12% | 12 to 24% | 24 to 36% | > 36% | | Institutional Agency | | Marginal | 1.58 | 34.44 | 37.68 | 26.30 | | | | Small | 4.00 | 46.64 | 37.37 | 11.99 | | | | Semi-medium | 3.11 | 56.09 | 30.93 | 9.88 | | | | Medium | 5.27 | 56.15 | 30.93 | 7.65 | | | | Large | 6.49 | 53.07 | 33.91 | 6.54 | | | | All | 2.49 | 40.74 | 36.41 | 20.36 | | | | Non-institutional Agency | | Marginal | 33.72 | 3.04 | 2.01 | 23.02 | 17.14 | 21.07 | | Small | 24.91 | 3.84 | 2.57 | 39.75 | 20.61 | 8.32 | | Semi-medium | 21.64 | 1.87 | 1.11 | 44.88 | 24.36 | 6.14 | | Medium | 17.19 | 1.62 | 1.33 | 62.03 | 15.21 | 2.62 | | Large | 8.63 | 1.27 | 2.11 | 74.29 | 10.96 | 2.75 | | All | 30.96 | 3.03 | 2.01 | 28.40 | 18.10 | 17.50 | | Source: Authors’ analysis of NSSO 70th Round data. |
| Table A4.3: Percentage of Loanee Farmer Households Repaying the Loan within a Year | | | Farmer Households | Rural Households | | Jammu & Kashmir | 36.8 | 34.9 | | Himachal Pradesh | 25.0 | 22.7 | | Punjab | 29.7 | 34.7 | | Uttaranchal | 35.6 | 30.8 | | Haryana | 29.6 | 26.9 | | Rajasthan | 44.2 | 44.0 | | Uttar Pradesh | 29.2 | 28.8 | | Bihar | 25.4 | 23.6 | | Assam | 43.1 | 43.7 | | West Bengal | 41.3 | 38.3 | | Jharkhand | 42.9 | 42.1 | | Odisha | 27.0 | 24.4 | | Chhattisgarh | 51.8 | 47.6 | | Madhya Pradesh | 43.7 | 42.8 | | Gujarat | 46.8 | 45.3 | | Maharashtra | 23.2 | 22.7 | | Andhra Pradesh | 54.2 | 51.5 | | Karnataka | 26.8 | 25.2 | | Kerala | 46.7 | 48.8 | | Tamil Nadu | 40.1 | 44.6 | | Telangana | 32.6 | 31.4 | | Total | 37.2 | 37.6 | | Source: Authors’ analysis of NSSO 70th Round data. |
| Table A4.4: Percentage of Households who have Taken Loans from Formal Agencies and Also Given Out Loans (Acting both as Lender and Borrower) | | State | Jammu & Kashmir | Himachal Pradesh | Punjab | Chandigarh | Uttaranchal | Haryana | Rajasthan | Uttar Pradesh | | Percentage | 2.15 | 0.44 | 0.54 | 0.00 | 0.00 | 0.13 | 0.33 | 0.27 | | State | Bihar | Assam | West Bengal | Jharkhand | Odisha | Chhattisgarh | Madhya Pradesh | Gujarat | | Percentage | 0.43 | 0.26 | 0.48 | 0.15 | 0.62 | 0.35 | 0.18 | 0.13 | | State | Maharashtra | Andhra Pradesh | Karnataka | Kerala | Tamil Nadu | Telangana | India | | | Percentage | | 2.25 | 0.74 | 2.67 | 0.49 | 0.50 | 0.54 | | | Source: Authors’ analysis of NSSO 70th Round data. |
Appendix to Chapter 5 | Table A5.1: Few Points that Emerged from the Discussion with Bank Officials: Jewel vs RTC Loans | | Jewels along with RTC as Collateral Security | Land Records (RTC) alone as Collateral Security | | | | | -
With mere pledging of jewels as collateral security, farmers are not entitled for 7 per cent rate of interest. They have to produce RTC along with jewels to get a loan at 7 per cent rate of interest, otherwise, the bank charges 12 per cent rate of interest. | | | | -
Majority of the customers (farmers) at the selected branch would prefer this type of loan because of lesser procedural hassles. In a sense, there is no need for the No Objection (due) Certificate (NOC) from other banks. The procedure is cumbersome in case they prefer to take more than ₹1 lakh. -
Secondly, although the RTC attestation is required, this would sometimes not become mandatory while sanctioning of loan and the bank would consider jewels as primary collateral security. -
Final sanctioned amount would be based on the daily unit rate per gram of goldLand size is unlikely to be considered to calculate the final sanctioned amount. | |
| Table A5.2: Percentage of Farmers under Different Interest Rate Categories (2014–15), Yadgir District (Selected Bank Branch) | Class Interval of Loan amount
(in ₹) | RTC (only) Base Loan (%) | Jewel Loan (%) | Jewels + RTC (%) | | 4* | 7 | 10.3 | 11 | Sub Total | 4* | 7 | 10.3 | 11 | Sub Total | 4* | 7 | 10.3 | 11 | Sub Total | | Less than 50,000 | 4.1 | 95.9 | 0 | 0 | 100 | 0 | 0 | 0 | 0 | 0 | 0 | 100 | 0 | 0 | 100 | | 50,000 to 75,000 | 3 | 97 | 0 | 0 | 100 | 0 | 0 | 0 | 0 | 0 | 0 | 100 | 0 | 0 | 100 | | 75,000 to 1,00,000 | 5.7 | 94.3 | 0 | 0 | 100 | 0 | 0 | 0 | 0 | 0 | 0 | 100 | 0 | 0 | 100 | | 1 to 1.5 lakh | 8.6 | 91.4 | 0 | 0 | 100 | 0 | 0 | 0 | 0 | 0 | 0 | 100 | 0 | 0 | 100 | | 1.5 to 2 lakh | 13.6 | 86.4 | 0 | 0 | 100 | 0 | 0 | 0 | 0 | 0 | 0 | 100 | 0 | 0 | 100 | | More than 2 lakh | 19.8 | 80.2 | 0 | 0 | 100 | 0 | 0 | 0 | 0 | 0 | 0 | 100 | 0 | 0 | 100 | | Total | 8.8 | 91.2 | 0 | 0 | 100 | 0 | 0 | 0 | 0 | 0 | 0 | 100 | 0 | 0 | 100 | | Total in no. of loans | | | | | 616 | | | | | 0 | | | | | 171 | * Since these farmers are getting a 3% rebate for prompt repayment within the stipulated time period, the rate of interest is 4%*
Source: Information gathered from banks (in terms of average/percentages). |
| Table A5.3: Percentage of Farmers under Different Interest Rates (2014–15), Ramnagara District (Selected Bank Branch) | Class Interval of Loan amount
(in ₹) | RTC (only) Base Loan (%) | Jewel Loan (%) | Jewels + RTC (%) | | 7 | 10.35 | 11 | 12.25 | Sub Total | 7 | 10.35 | 11 | 12.25 | Sub Total | 7 | 10.35 | 11 | 12.25 | Sub Total | | Less than 50,000 | 0 | 0 | 0 | 0 | 0 | 0 | 100 | 0 | 0 | 100 | 100 | 0 | 0 | 0 | 100 | | 50,000 to 75,000 | 0 | 0 | 0 | 0 | 0 | 0 | 100 | 0 | 0 | 100 | 100 | 0 | 0 | 0 | 100 | | 75,000 to 1,00,000 | 0 | 0 | 0 | 0 | 0 | 0 | 100 | 0 | 0 | 100 | 100 | 0 | 0 | 0 | 100 | | 1 to 1.5 lakh | 0 | 0 | 100 | 0 | 100 | 0 | 40 | 40 | 20 | 100 | 100 | 0 | 0 | 0 | 100 | | 1.5 to 2 lakh | 14 | 0 | 72 | 14 | 100 | 0 | 0 | 100 | 0 | 100 | 100 | 0 | 0 | 0 | 100 | | More than 2 lakh | 44.4 | 0 | 44.4 | 11 | 100 | 0 | 100 | 0 | 0 | 100 | 100 | 0 | 0 | 0 | 100 | | | | | | | | | | | | | | | | | | | Total in no. of loans | | | | | 26 | | | | | 22 | | | | | 40 | | Source: Information gathered from bank (in terms of average/percentages). |
| Table A5.4: Percentage of Farmers under Different Interest Rates (2014–15), Chitradurga District (Selected Bank Branch) | Class Interval of Loan Amount
(in ₹) | RTC | Jewels | Jewels + RTC | Total | | 7 | 11.25 | Sub total | 7 | 11.25 | Sub total | 7 | 11.25 | Sub total | 7 | 11.25 | Sub Total | | Less than 50,000 | 71.8 | 28.2 | 100 | 74.3 | 25.7 | 100 | NA | NA | NA | 470
(74.1) | 164
(25.9) | 634
(100) | | 50,000 to 75,000 | 88.0 | 12.0 | 100 | 68.6 | 31.4 | 100 | NA | NA | NA | 70.9 | 29.1 | 100 | | 75,000 to 1,00,000 | 76.0 | 24.0 | 100 | 82.8 | 17.2 | 100 | NA | NA | NA | 81.6 | 18.4 | 100 | | 1 to 1.5 lakh | 90.0 | 10.0 | 100 | NA | NA | NA | 73.3 | 26.7 | 100 | 74.6 | 25.4 | 100 | | 1.5 to 2.0 lakh | 25.0 | 75.0 | 100 | NA | NA | NA | 75.0 | 25.0 | 100 | 65.9 | 34.1 | 100 | | More than 2 lakh | 42.9 | 57.1 | 100 | NA | NA | NA | 87.5 | 12.5 | 100 | 83.1 | 16.9 | 100 | | Total | 72.8 | 27.2 | 100 | 74.2 | 25.8 | 100 | 77.7 | 22.3 | 100 | 74.7 | 25.3 | 100 | | Total in No. of Loans | | | 114 | | | 899 | | | 220 | | | 1233 | | Source: Information gathered from bank (in terms of average/percentages). |
Appendix to Chapter 6 | Table A6.1: Classification of Respondent Farmers in Terms of Caste | | Religion | All are Hindus | | | Per cent | | Caste | Schedule Caste | 12.11 | | Schedule Tribe | 6.32 | | OBC | 75.04 | | General | 6.53 | | Total | 100.00 | | Source: Field Survey |
| Table A6.2: NSSO 70th Round: Caste-wise Incidence of Indebtedness in Karnataka (Total = Formal + Informal) | | | Percentage Number of HHs | Percentage of Total Indebted HHs | Incidence of indebtedness | | ST | 5.9 | 6.1 | 54.1 | | SC | 20.4 | 16.3 | 41.4 | | OBC | 51.2 | 58.0 | 58.7 | | Others | 22.5 | 19.6 | 44.9 | | All | 100.0 | 100.0 | 51.8 | HH: Household
Source: Authors’ analysis of NSSO 70th Round data. |
| Table A6.3: Classification of Farmers in Terms of Ration Card Owned | | Type of Ration Card | Per cent | | BPL (below poverty) | 85.79 | | APL (above poverty) | 10.00 | | No Card | 4.21 | | Total | 100.00 | | Source: Field Survey |
| Table A6.4: Percentage of Households Classified According to Caste and Borrowing Sources | | Caste | Borrowers from Banks | Borrowers from Cooperatives | Other sources | Non-Borrowers | Total | | SC | 41 | 7.7 | 20.5 | 30.8 | 100.00 | | ST | 55 | 15 | 25.0 | 5 | 100.00 | | OBC | 59.3 | 27 | 9.5 | 4.1 | 100.00 | | General | 80 | 20 | 0 | 0 | 100.00 | | Total | 58.1 | 23.4 | 11.3 | 7.2 | 100.00 | | Source: Field Survey |
| Table A6.5: Percentage of Households with Different Assets | | | TV | Pucca House | Radio | Two-wheeler | Fan | Fridge | Other | | Marginal | 77.6 | 56.9 | 32.8 | 65.5 | 70.7 | 6.9 | 3.4 | | Small | 82.7 | 70.7 | 22.7 | 58.7 | 77.3 | 13.3 | 13.3 | | Semi-medium | 92.1 | 65.8 | 23.7 | 76.3 | 86.8 | 21.1 | 18.4 | | Medium | 100.0 | 100.0 | 6.3 | 87.5 | 93.8 | 37.5 | 43.8 | | Large | 100.0 | 100.0 | 0.0 | 100.0 | 100.0 | 100.0 | 66.7 | | Total | 84.7 | 68.4 | 24.2 | 67.4 | 78.9 | 16.3 | 14.7 | | Source: Field Survey |
| Table A6.6: Share of Farmers Engaged in Wage Labour (Landholding-wise Classification) | | Farmer Landholding Category | Per cent of Farmers | | Marginal | 36.21 | | Small | 18.67 | | Semi-medium | 13.16 | | Medium | 0.00 | | Large | 0.00 | | Total | 21.05 | | Source: Field Survey |
| Table A6.7: Percentage Share of Amount of Loan Borrowed by Farmer Households in Karnataka from Formal Sources, Caste-wise | | | Cooperative Society | Commercial Bank and RRB | Other Institutional Agency | Institutional Agency | | ST | 18.44 | 16.07 | 5.74 | 40.25 | | SC | 20.30 | 11.39 | 12.30 | 44.00 | | OBC | 34.63 | 17.02 | 7.97 | 59.62 | | Others | 24.14 | 29.01 | 10.65 | 63.80 | | Total | 29.16 | 19.53 | 9.22 | 57.91 | | Source: Authors’ analysis of NSSO 70th Round data. |
Appendix to Chapter 7 | Table A7.1: Percentage-wise Amount of Loans Borrowed (during past 10 years) from Different Sources across Different Categories of Farmers (by Land Size) | | | Cooperative Society | CB & RRB | Other Institutional Agency | Institutional Agency | Money-lenders | Relatives & Friends | Other Non-institutional Agency | Non-institutional Agency | | Karnataka | | Marginal | 25.4 | 13.2 | 12.7 | 51.3 | 31.8 | 13.5 | 3.4 | 48.7 | | Small | 36.2 | 16.9 | 6.3 | 59.4 | 21.1 | 10.0 | 9.4 | 40.6 | | Semi-medium | 23.6 | 31.0 | 10.2 | 64.9 | 23.9 | 9.6 | 1.6 | 35.1 | | Medium | 36.9 | 29.1 | 2.0 | 68.0 | 20.2 | 9.5 | 2.3 | 32.0 | | Large | 36.8 | 23.2 | 0.0 | 59.9 | 33.7 | 2.4 | 3.9 | 40.1 | | All | 29.2 | 19.5 | 9.2 | 57.9 | 26.5 | 11.2 | 4.4 | 42.1 | | Source: Authors’ analysis of NSSO 70th Round data. |
| Table A7.2: Credit from Different Agencies (%) – Computation Based on Amount of Total Loan Taken in 2011, 2012, 2013 | | | Govt | Cooperative Society | CB & RRB | SHG _BL | SHG_ NBFC | Other Institutional Agency | Institutional Agency | Money-lenders | Relatives & Friends | Other Non-institutional Agency | Non-instutional Agency | | Karnataka | 0.68 | 29.2 | 14.80 | 5.97 | 1.21 | 2.93 | 54.79 | 27.85 | 12.3 | 5.04 | 45.21 | | All India | 0.80 | 26.5 | 28.18 | 2.41 | 0.47 | 3.82 | 62.26 | 27.11 | 8.4 | 2.21 | 37.74 | | Source: Authors’ analysis of NSSO 70th Round data. |
| Table A7.3: Credit from Different Agencies in Percentages: Computation Based on Number of Loans Disbursed during 2011, 2012, 2013 | | | Govt | Cooperative Society | CB & RRB | SHG _BL | SHG_ NBFC | Other Institutional Agency | Institutional agency | Money-lenders | Relatives & Friends | Other Non-institutional Agency | Non-institutional Agency | | Karnataka | 0.69 | 23.3 | 8.68 | 14.1 | 1.05 | 2.12 | 50.01 | 29.0 | 15.2 | 5.73 | 49.99 | | All India total | 0.70 | 20.0 | 16.17 | 6.65 | 1.24 | 3.12 | 47.97 | 32.5 | 15.9 | 3.47 | 52.03 | | Source: Authors’ analysis of NSSO 70th Round data. |
| Table A7.4: Utilisation of Loans from Institutional and Non-institutional Agencies | | Sources → | All India | Karnataka | | Purpose ↓ | Institutional Agency | Non-institutional Agency | Total | Institutional Agency | Non-institutional Agency | Total | | Capital Expenditure in Farm Business | 19.8 | 8.2 | 15.6 | 17.8 | 10.2 | 14.6 | | Current Expenditure in Farm Business | 30.9 | 10.8 | 23.6 | 32.2 | 5.9 | 21.1 | | Capital & Current Exp. in Non-farm Business | 11.3 | 5.0 | 9.0 | 10.0 | 5.1 | 8.0 | | Consumption | 11.8 | 35.9 | 20.6 | 11.0 | 40.3 | 23.4 | | Education | 2.7 | 2.0 | 2.4 | 1.7 | 3.6 | 2.5 | | Medical Expenditure | 2.7 | 9.0 | 5.0 | 0.8 | 10.6 | 4.9 | | Housing | 15.1 | 18.5 | 16.3 | 21.2 | 20.5 | 20.9 | | Others | 5.6 | 10.7 | 7.4 | 5.2 | 3.8 | 4.6 | | Total | 100.0 | 100.0 | 100.0 | 100.0 | 100.0 | 100.0 | | Source: Computed using unit level NSSO 70th Round Debt and Investment Survey data. |
| Table A7.5: Borrowing from Different Institutional Agencies (Based on Amount) in Percentage Terms | | | Govt | Cooperative Society | CB & RRB | SHG_BL | SHG_NBFC | Other Institutional Agency | Institutional Agency | Money-lenders | Relatives & Friends | Other Non-institutional Agency | Non-institutional Agency | | J&K | 2.48 | 4.18 | 64.30 | 0.03 | 0.00 | 1.94 | 72.94 | 0.23 | 26.44 | 0.40 | 27.06 | | Himachal Pradesh | 0.60 | 24.05 | 54.84 | 0.51 | 0.15 | 2.43 | 82.58 | 1.29 | 14.99 | 1.14 | 17.42 | | Punjab | 1.56 | 29.92 | 35.22 | 0.00 | 0.00 | 1.02 | 67.72 | 22.29 | 7.85 | 2.14 | 32.28 | | Uttaranchal | 2.20 | 14.94 | 53.81 | 0.03 | 0.06 | 1.55 | 72.58 | 11.57 | 15.41 | 0.44 | 27.42 | | Haryana | 2.03 | 25.34 | 33.72 | 0.02 | 0.00 | 0.95 | 62.05 | 33.77 | 3.02 | 1.16 | 37.95 | | Rajasthan | 0.94 | 17.79 | 24.79 | 0.15 | 0.92 | 4.50 | 49.09 | 46.55 | 2.60 | 1.75 | 50.91 | | Uttar Pradesh | 0.90 | 12.67 | 49.14 | 0.46 | 0.20 | 1.75 | 65.12 | 15.30 | 15.85 | 3.73 | 34.88 | | Bihar | 1.99 | 3.38 | 23.11 | 1.10 | 0.37 | 2.63 | 32.58 | 45.63 | 13.90 | 7.90 | 67.42 | | Assam | 2.64 | 24.38 | 33.82 | 2.23 | 1.44 | 2.40 | 66.92 | 12.94 | 16.34 | 3.80 | 33.08 | | West Bengal | 0.97 | 14.41 | 19.02 | 3.79 | 2.42 | 15.15 | 55.76 | 22.70 | 15.41 | 6.14 | 44.24 | | Jharkhand | 1.12 | 4.50 | 41.35 | 0.86 | 1.01 | 4.58 | 53.42 | 13.99 | 30.23 | 2.37 | 46.58 | | Odisha | 0.41 | 27.32 | 26.84 | 3.84 | 0.75 | 5.26 | 64.42 | 21.51 | 11.42 | 2.65 | 35.58 | | Chhattisgarh | 1.42 | 26.92 | 35.02 | 0.80 | 1.01 | 4.96 | 70.12 | 12.34 | 14.16 | 3.37 | 29.88 | | Madhya Pradesh | 1.25 | 19.02 | 42.50 | 0.13 | 0.10 | 2.81 | 65.81 | 30.31 | 2.83 | 1.05 | 34.19 | | Gujarat | 2.49 | 38.63 | 28.16 | 0.15 | 0.10 | 6.09 | 75.62 | 10.21 | 13.53 | 0.64 | 24.38 | | Maharashtra | 1.03 | 46.89 | 19.18 | 0.40 | 0.47 | 2.46 | 70.44 | 13.53 | 15.02 | 1.01 | 29.56 | | Andhra Pradesh | 0.50 | 21.29 | 24.77 | 8.25 | 0.08 | 0.99 | 55.88 | 41.54 | 1.28 | 1.29 | 44.12 | | Karnataka | 1.16 | 29.16 | 19.53 | 4.81 | 0.94 | 2.30 | 57.91 | 26.49 | 11.25 | 4.35 | 42.09 | | Kerala | 0.25 | 43.15 | 28.86 | 1.06 | 0.13 | 6.12 | 79.58 | 10.83 | 9.28 | 0.31 | 20.42 | | Tamil Nadu | 0.53 | 26.64 | 30.35 | 2.11 | 0.43 | 8.73 | 68.79 | 27.33 | 2.90 | 0.98 | 31.21 | | Telangana | 0.20 | 13.05 | 21.15 | 6.60 | 0.07 | 1.48 | 42.54 | 55.82 | 0.90 | 0.74 | 57.46 | | All India | 0.93 | 26.22 | 29.88 | 2.08 | 0.42 | 3.99 | 63.53 | 25.70 | 8.74 | 2.03 | 36.47 | | Source: Authors’ analysis of NSSO 70th Round data. |
| Table A7.6: Credit from Different Agencies: Based on Amount of Loan for 2011, 2012, 2013 | | | Govt | Cooperative Society | CB & RRB | SHG_BL | SHG_NBFC | Other Institutional Agency | Institutional Agency | Money-lenders | Relatives & Friends | Other Non-institutional Agency | Non-institutional Agency | | J&K | 2.93 | 3.13 | 63.69 | 0.04 | 0.00 | 0.97 | 70.76 | 0.24 | 28.61 | 0.39 | 29.24 | | Himachal Pradesh | 0.77 | 26.22 | 53.01 | 0.51 | 0.23 | 1.17 | 81.90 | 1.35 | 15.08 | 1.67 | 18.10 | | Punjab | 1.26 | 30.10 | 33.99 | 0.00 | 0.00 | 1.18 | 66.53 | 26.14 | 4.95 | 2.37 | 33.47 | | Uttaranchal | 3.61 | 21.47 | 42.03 | 0.04 | 0.10 | 1.80 | 69.05 | 8.83 | 21.40 | 0.72 | 30.95 | | Haryana | 1.77 | 24.70 | 37.27 | 0.02 | 0.00 | 1.09 | 64.86 | 29.57 | 3.97 | 1.60 | 35.14 | | Rajasthan | 1.17 | 19.37 | 26.35 | 0.19 | 0.93 | 5.40 | 53.41 | 42.41 | 2.63 | 1.55 | 46.59 | | Uttar Pradesh | 0.68 | 13.54 | 48.67 | 0.33 | 0.21 | 1.56 | 65.00 | 15.00 | 15.53 | 4.47 | 35.00 | | Bihar | 2.46 | 1.80 | 17.73 | 1.50 | 0.53 | 2.90 | 26.92 | 51.70 | 15.06 | 6.31 | 73.08 | | Assam | 2.95 | 17.71 | 35.32 | 2.80 | 1.81 | 2.93 | 63.52 | 15.55 | 16.98 | 3.95 | 36.48 | | West Bengal | 1.00 | 15.85 | 18.26 | 5.22 | 3.28 | 5.50 | 49.11 | 24.13 | 18.27 | 8.50 | 50.89 | | Jharkhand | 1.03 | 2.45 | 46.79 | 0.97 | 1.25 | 5.94 | 58.43 | 14.24 | 24.58 | 2.75 | 41.57 | | Odisha | 0.31 | 26.67 | 20.85 | 4.38 | 0.99 | 6.24 | 59.43 | 24.26 | 13.24 | 3.06 | 40.57 | | Chhattisgarh | 1.09 | 36.23 | 18.95 | 1.23 | 1.56 | 5.60 | 64.66 | 11.87 | 20.84 | 2.63 | 35.34 | | Madhya Pradesh | 1.07 | 19.67 | 40.75 | 0.09 | 0.12 | 2.95 | 64.65 | 31.52 | 2.73 | 1.10 | 35.35 | | Gujarat | 1.17 | 38.79 | 29.99 | 0.18 | 0.11 | 6.82 | 77.06 | 10.18 | 12.02 | 0.74 | 22.94 | | Maharashtra | 0.83 | 44.54 | 18.68 | 0.44 | 0.19 | 2.48 | 67.16 | 15.20 | 16.44 | 1.20 | 32.84 | | Andhra Pradesh | 0.41 | 25.83 | 18.18 | 9.22 | 0.11 | 0.94 | 54.69 | 42.41 | 1.34 | 1.56 | 45.31 | | Karnataka | 0.68 | 29.21 | 14.80 | 5.97 | 1.21 | 2.93 | 54.79 | 27.85 | 12.32 | 5.04 | 45.21 | | Kerala | 0.18 | 43.54 | 27.16 | 1.23 | 0.16 | 6.72 | 78.99 | 12.66 | 7.92 | 0.43 | 21.01 | | Tamil Nadu | 0.51 | 24.85 | 30.56 | 2.34 | 0.51 | 7.38 | 66.14 | 30.50 | 2.26 | 1.10 | 33.86 | | Telangana | 0.19 | 10.66 | 22.22 | 6.43 | 0.08 | 1.43 | 41.00 | 57.38 | 0.92 | 0.69 | 59.00 | | Total | 0.80 | 26.58 | 28.18 | 2.41 | 0.47 | 3.82 | 62.26 | 27.11 | 8.43 | 2.21 | 37.74 | | Source: Authors’ analysis of NSSO 70th Round data. |
| Table A7.7: Borrowing from Different Agencies (%): Based on Number of Loans for 2011, 2012, 2013 | | | Govt | Cooperative Society | CB & RRB | SHG _BL | SHG_ NBFC | Other Institutional Agency | Institutional Agency | Money-lenders | Relatives & Friends | Other Non-institutional Agency | Non-institutional Agency | | J&K | 1.10 | 1.86 | 24.58 | 0.03 | 0.00 | 1.16 | 28.74 | 0.28 | 70.51 | 0.48 | 71.26 | | Himachal Pradesh | 0.54 | 20.98 | 31.90 | 1.86 | 0.75 | 1.27 | 57.30 | 3.00 | 38.42 | 1.28 | 42.70 | | Punjab | 0.68 | 33.46 | 15.19 | 0.00 | 0.00 | 1.47 | 50.79 | 25.21 | 20.91 | 3.09 | 49.21 | | Uttaranchal | 3.08 | 14.35 | 22.36 | 0.13 | 0.74 | 1.63 | 42.29 | 11.57 | 44.60 | 1.54 | 57.71 | | Haryana | 1.27 | 26.16 | 23.59 | 0.02 | 0.00 | 2.07 | 53.11 | 33.22 | 10.09 | 3.58 | 46.89 | | Rajasthan | 0.72 | 20.64 | 16.98 | 0.40 | 0.28 | 1.78 | 40.79 | 50.90 | 6.42 | 1.89 | 59.21 | | Uttar Pradesh | 0.41 | 7.58 | 27.19 | 0.88 | 0.60 | 1.80 | 38.47 | 24.38 | 30.49 | 6.66 | 61.53 | | Bihar | 1.10 | 0.92 | 7.91 | 2.70 | 1.23 | 1.42 | 15.27 | 59.64 | 17.86 | 7.22 | 84.73 | | Assam | 1.67 | 7.03 | 8.49 | 4.28 | 3.13 | 3.86 | 28.45 | 32.10 | 32.63 | 6.82 | 71.55 | | West Bengal | 0.36 | 18.47 | 8.12 | 8.93 | 5.50 | 8.28 | 49.66 | 23.34 | 22.50 | 4.49 | 50.34 | | Jharkhand | 1.40 | 3.04 | 20.10 | 1.98 | 3.36 | 1.61 | 31.48 | 24.70 | 39.17 | 4.65 | 68.52 | | Odisha | 0.09 | 23.83 | 7.94 | 8.79 | 1.96 | 2.59 | 45.19 | 31.44 | 19.23 | 4.13 | 54.81 | | Chhattisgarh | 0.57 | 33.20 | 6.56 | 1.05 | 2.48 | 0.43 | 44.29 | 20.92 | 30.88 | 3.91 | 55.71 | | Madhya Pradesh | 1.76 | 21.13 | 20.82 | 0.46 | 0.58 | 0.81 | 45.56 | 45.93 | 6.51 | 2.01 | 54.44 | | Gujarat | 0.76 | 33.68 | 18.85 | 0.59 | 0.73 | 4.03 | 58.64 | 15.87 | 23.81 | 1.68 | 41.36 | | Maharashtra | 0.88 | 44.28 | 14.10 | 1.59 | 0.76 | 0.99 | 62.60 | 13.81 | 22.16 | 1.43 | 37.40 | | Andhra Pradesh | 1.09 | 17.59 | 14.90 | 18.42 | 0.24 | 0.68 | 52.92 | 41.04 | 4.56 | 1.49 | 47.08 | | Karnataka | 0.69 | 23.31 | 8.68 | 14.16 | 1.05 | 2.12 | 50.01 | 29.00 | 15.26 | 5.73 | 49.99 | | Kerala | 0.17 | 31.07 | 20.62 | 8.44 | 1.28 | 9.47 | 71.06 | 11.47 | 14.96 | 2.51 | 28.94 | | Tamil Nadu | 0.14 | 21.04 | 18.88 | 5.75 | 1.74 | 6.80 | 54.34 | 39.14 | 4.20 | 2.32 | 45.66 | | Telangana | 0.62 | 12.03 | 14.90 | 18.14 | 0.10 | 0.49 | 46.27 | 50.47 | 1.99 | 1.27 | 53.73 | | Total | 0.70 | 20.08 | 16.17 | 6.65 | 1.24 | 3.12 | 47.97 | 32.59 | 15.97 | 3.47 | 52.03 | | Source: Authors’ analysis of NSSO 70th Round data. |
| Table A7.8: Details of Farmer Indebtedness in Karnataka | | | Distribution of No. of Loans Borrowed from Formal Sources | Average No. of Loans Outstanding per Farmer Household Selected for the Study | Average Loan Amount in ₹ | | Bank | Cooperative | Both | None | | Total Loans | Loans from Bank or Cooperative Society | Share of Formal Loan | Cooperative | Bank | ML | Friends & relatives | | Marginal | 43.1 | 20.7 | 5.2 | 31.0 | 100 | 1.62 | 1.12 | 0.59 | 45188 | 119975 | 100833 | 72143 | | Small | 54.7 | 26.7 | 6.7 | 12.0 | 100 | 1.68 | 1.21 | 0.73 | 62929 | 139259 | 125966 | 75000 | | Semi-medium | 55.3 | 21.1 | 7.9 | 15.8 | 100 | 1.61 | 1.42 | 0.70 | 76273 | 156871 | 73929 | 100000 | | Medium | 62.5 | 6.3 | 18.8 | 12.5 | 100 | 1.63 | 1.50 | 0.85 | 65000 | 244412 | 108333 | 20000 | | Large | 100.0 | | | | 100 | 1.67 | 1.67 | 1.00 | - | 612000 | - | - | | Total | 52.6 | 21.6 | 7.4 | 18.4 | 100 | 1.64 | 1.26 | 0.70 | 60746 | 163139 | | Source: Field Survey conducted by authors. |
Appendix to Chapter 8 Tenancy Rules Pertaining to Leasing of Agricultural Land at the time of independence, India inherited a feudal agrarian structure in which land rights were concentrated in the hands of a few landlords/zamindars, while actual cultivators/ tenants did not have any right or security of tenure. After independence, almost all state governments passed land reform laws, for: (i) abolition of intermediaries, (ii) abolition or regulation of tenancy, and (iii) imposition of ceilings on landholdings and redistribution of ceiling surplus land. The main objective was to create conditions for an agrarian economy with high levels of efficiency and equity. | Table A8.1: Restrictive Nature of Tenancy Laws in States of Karnataka and Uttar Pradesh | | State | Law Governing Land Leasing | Nature of Restrictions in Tenancy Laws | | Karnataka | The Mysore Land Reforms Act, 1961 as amended w.e.f. 1 March 1974 | Leasing out is banned except by a soldier or a seaman. | | Uttar Pradesh & Uttarakhand | The Uttar Pradesh Zamindari Abolition Land Reforms Act, 1950 | Leasing in future is banned except by a disabled person and to agriculture-related educational institution. A disabled person is defined as an unmarried/ divorced/ separated woman, a widow or a woman whose husband is incapable of cultivating due to physical or mental infirmity or a minor whose father suffers from infirmity or person who is a lunatic or an idiot or blind or a student of a recognized educational institution whose age does not exceed 25 years and whose father suffers from infirmity or a serving member of the armed forces or a person under detention or imprisonment | | Source: Report of the Expert Committee on Land Leasing, NITI Aayog, 2016. |
|