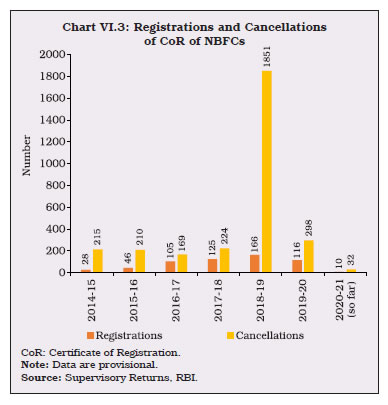
The consolidated balance sheet of NBFCs decelerated in 2019-20 due to stagnant growth in loans and advances beset with a challenging macroeconomic environment and weak demand compounded by risk aversion. In H1:2020-21, however, balance sheet growth of NBFCs gained traction. Although asset quality deteriorated marginally, the NBFC sector remains resilient with strong capital buffers. HFCs experienced headwinds in 2019-20, with slowdown in credit growth, decline in profitability and deterioration in asset quality. The consolidated balance sheet of AIFIs expanded during 2019-20, buoyed by robust growth in loans and advances. 1. Introduction VI.1 During 2019-20, non-banking finance companies (NBFCs) faced headwinds in the aftermath of the IL&FS episode1 in the form of an erosion of confidence, rating downgrades and liquidity stress all of which became exacerbated by the COVID-19 pandemic. However, in H1:2020-21 NBFC sector rebounded. Non-banking financial institutions (NBFIs) play an important role in facilitating credit intermediation in India as an alternative to bank financing, in addition to niche financing and last mile outreach. NBFIs regulated by the Reserve Bank2 comprise non-banking financial companies (NBFCs), housing finance companies (HFCs), all-India financial institutions (AIFIs), and primary dealers (PDs). AIFIs, i.e., the National Bank for Agriculture and Rural Development (NABARD), the EXIM Bank of India, the Small Industries Development Bank of India (SIDBI) and the National Housing Bank (NHB) are apex financial institutions that play an important role in meeting the long-term funding requirements of agriculture and the rural sector, foreign trade, small industries, HFCs, NBFCs, Micro Finance Institutions (MFIs) and other specialised segments and institutions. NBFCs are government/public/private limited companies that play an important role in credit delivery and financial intermediation. They specialise in delivering credit to a wide variety of specific segments, ranging from infrastructure to consumer durables and vehicle financing. HFCs extend housing finance to individuals, co-operative societies, corporate bodies and lease commercial and residential premises to support housing activity in the country (Chart VI.1). PDs came into existence in 1995 and act as market makers in the government securities (G-secs) market, besides ensuring subscription to primary issuances. 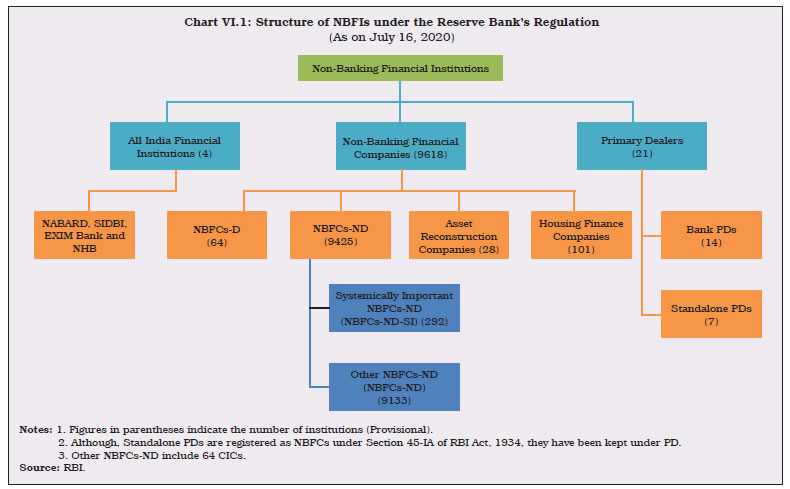 VI.2 This chapter reviews the operations and performance of NBFIs in 2019-20 and April-September 2020. The rest of the chapter is organised into four sections. Section 2 provides an overview of the NBFC sector – both non-deposit taking systemically important NBFCs (NBFCs-ND-SI) and deposit-taking NBFCs (NBFCs-D). The activities and financial performance of HFCs are also covered in this section. An assessment of the performance of AIFIs is made in Section 3. Section 4 evaluates the role and performance of PDs. Section 5 concludes and offers some policy perspectives. 2. Non-Banking Financial Companies (NBFCs) VI.3 NBFCs have been steadily gaining prominence and visibility in the Indian financial ecosystem. Credit intensity, as measured by NBFCs’ credit to Gross Domestic Product (GDP) ratio has been rising consistently, reaching an all-time high in 2018-19 before moderating in 2019-20 in the wake of the pandemic (Chart VI.2 a). NBFCs’ credit as proportion of SCBs’ non-food credit has risen more sharply, especially during 2014 to 2019 (Chart VI.2 b). VI.4 NBFCs can be classified on the basis of a) asset/liability structures; b) systemic importance; and c) the activities they undertake. In terms of liability structures, NBFCs are subdivided into deposit-taking NBFCs (NBFCs-D) - which accept and hold public deposits - and non-deposit taking NBFCs (NBFCs-ND) - which source their funding from markets and banks. Among non-deposit taking NBFCs, those with asset size of ₹500 crore or more are classified as non-deposit taking systemically important NBFCs (NBFCs-ND-SI). As on July 16, 2020, there were 64 NBFCs-D and 292 NBFCs-ND-SI as compared to 88 and 263, respectively, at end-March 2019. VI.5 Based on activities, there are 11 categories of NBFCs. In 2018-19, three categories of NBFCs namely, asset finance companies (AFCs), loan companies (LCs) and investment companies (ICs) were merged into a new category called investment and credit companies (ICCs) for harmonisation and operational flexibility (Table VI.1). VI.6 Regulatory guidelines mandate that only those NBFCs with minimum net owned funds (NOF) of ₹2 crore can be allowed to operate. Compared to 2018-19, when there was a record number of cancellations/surrender of licenses of non-compliant NBFCs, both registrations and cancellations were lower during 2019-20 (Chart VI.3). | Table V1.1: Classification of NBFCs by Activity | | Type of NBFC | Activity | | 1. Investment and Credit Company (ICC) | Lending and investment. | | 2. NBFC-Infrastructure Finance Company (NBFC-IFC) | Provision of infrastructure loans. | | 3. NBFC-Systemically Important Core Investment Company (CIC-ND-SI) | Investment in equity shares, preference shares, debt or loans in group companies. | | 4. NBFC-Infrastructure Debt Fund (NBFC-IDF) | Facilitation of flow of long-term debt into infrastructure projects. | | 5. NBFC-Micro Finance Institution (NBFC-MFI) | Credit to economically dis-advantaged groups. | | 6. NBFC-Factor | Acquisition of receivables of an assignor or extending loans against the security interest of the receivables at a discount. | | 7. NBFC-Non-Operative Financial Holding Company (NBFC-NOFHC) | Facilitation of promoters/ promoter groups in setting up new banks. | | 8. Mortgage Guarantee Company (MGC) | Undertaking of mortgage guarantee business. | | 9. NBFC-Account Aggregator (NBFC-AA) | Collecting and providing information about a customer’s financial assets in a consolidated, organised and retrievable manner to the customer or others as specified by the customer. | | 10. NBFC–Peer to Peer Lending Platform (NBFC-P2P) | Providing an online platform to bring lenders and borrowers together to help mobilise funds. | | 11. Housing Finance Companies (HFC) | Financing for housing. | | Source: RBI. |
 2.1 Ownership Pattern VI.7 The NBFC sector is dominated by NBFCs-ND-SI that constitute 85.7 per cent of the total assets of the sector. Few large government-owned NBFCs, mainly catering to the infrastructure space, comprise 43.3 per cent of the total assets of NBFCs-ND-SI (Table VI.2). VI.8 The Reserve Bank has been monitoring the operations and growth of NBFCs-D in order to secure depositors’ interest, given that deposits of NBFCs-D are not covered by the Deposit Insurance and Credit Guarantee Corporation (DICGC). The Reserve Bank has mandated that only investment grade NBFCs-D shall accept fixed deposits from the public, up to a limit of 1.5 times of their NOF and for a tenure of 12 to 60 months only, with interest rates capped at 12.5 per cent. VI.9 NBFCs-D accounted for 14.3 per cent of the total assets of the NBFC sector at end-March 2020. Compared to government-owned NBFCs-ND-SI, government-owned NBFCs-D have a smaller share in terms of number of companies as well as asset size. 89.5 per cent of NBFCs-D’ assets were held by non-government companies in 2019-20 (Table VI.2). | Table VI.2: Ownership Pattern of NBFCs | | (End-March 2020) | | (₹ crore) | | Type | NBFC-ND-SI | NBFC-D | | Number of companies | Asset Size | Asset share in per cent | Number of companies | Asset Size | Asset share in per cent | | 1 | 2 | 3 | 4 | 5 | 6 | 7 | | A. Government Companies | 21 | 12,56,164 | 43.3 | 8 | 51,061 | 10.5 | | B. Non-government Companies (1+2) | 264 | 16,47,722 | 56.7 | 56 | 4,34,320 | 89.5 | | 1. Public Limited Companies | 152 | 12,91,898 | 44.5 | 54 | 3,25,739 | 67.1 | | 2. Private Limited Companies | 112 | 3,55,824 | 12.3 | 2 | 1,08,580 | 22.4 | | Total (A+B) | 285 | 29,03,886 | 100.0 | 64 | 4,85,381 | 100.0 | Note: Data are provisional.
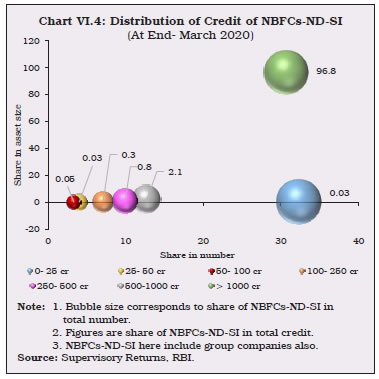
Source: Supervisory Returns, RBI. | 2.2 Balance Sheet VI.10 The year 2019-20 marked a significant moderation in NBFCs’ financial performance, after double digit balance sheet growth in the previous three years. A challenging macroeconomic environment, weak demand compounded by risk aversion, liquidity stress and rising borrowing costs in the wake of the IL&FS default resulted in a substantial deceleration in asset growth in 2019-20. The impact was particularly pronounced for NBFCs-ND-SI. On the other hand, NBFCs-D weathered this difficult period and continued to grow at a healthy pace. In view of the pandemic as well as to maintain adequate liquidity, NBFCs increased their cash and bank balances significantly during the year, which was marked in the case of NBFCs-D. Nevertheless, in 2020-21 (up to September), balance sheet growth of NBFCs, especially that of NBFCs-ND-SI, gained traction due to pick-up in loans and advances and base effect (Table VI.3, Appendix Tables VI.1 and VI.2). VI.11 With the harmonisation of major NBFC categories, NBFCs-D now comprise only ICCs. Public deposits remained a stable source of funding. On the assets side, investments continue to grow at an accelerated pace, while loans and advances slowed (Table VI.3). VI.12 As regards distribution of credit extended by NBFCs-ND-SI, nearly one-third, each having a loan book of more than ₹1000 crore, lent nearly 97 per cent of total credit in 2019-20. Those with loan books up to ₹ 500 crore extended merely 1.15 per cent of total NBFCs-ND-SI credit outstanding (Chart VI.4). VI.13 In order to mitigate the impact of COVID-19, the Reserve Bank allowed lending institutions to grant a moratorium on payment of instalments of term loans due between March 1, 2020, and May 31, 2020, which was later extended till August 31, 2020. NBFCs also extended the benefit to their customers3. Amongst the sectors NBFCs lent to, MSMEs availed of the scheme the most. Other categories like individuals witnessed a reduction in the share of customers, while corporates registered a fall in amount of loans under moratorium between April4 and August 2020. Overall, the percentage of customers availing the moratorium has been relatively lower for NBFCs, while loans outstanding under moratorium were higher than those extended by scheduled commercial banks (SCBs) indicative of incipient stress (Table VI.4). | Table VI.3: Abridged Balance Sheet of NBFCs | | (₹ crore) | | Items | At end-March 2019 | At end-March 2020 | At end-Sept 2020 | | NBFCs | NBFCs-ND-SI | NBFCs-D | NBFCs | NBFCs-ND-SI | NBFCs-D | NBFCs | NBFCs-ND-SI | NBFCs-D | | 1 | 2 | 3 | 4 | 5 | 6 | 7 | 8 | 9 | 10 | | 1. Share Capital and Reserves | 7,13,228 | 6,46,070 | 67,158 | 7,88,633 | 7,02,828 | 85,805 | 8,84,138 | 7,88,623 | 95,515 | | | (15.5) | (14.7) | (23.7) | (10.6) | (8.8) | (27.8) | (14.8) | (13.3) | (29.4) | | 2. Public Deposits | 40,057 | - | 40,057 | 50,033 | - | 50,033 | 55,665 | - | 55,665 | | | (33.0) | - | (33.0) | (24.9) | - | (24.9) | (16.7) | - | (16.7) | | 3. Debentures | 9,19,314 | 8,20,157 | 99,157 | 9,40,499 | 8,37,373 | 1,03,126 | 9,15,293 | 8,16,786 | 98,507 | | | (3.4) | (1.8) | (18.8) | (2.3) | (2.1) | (4.0) | (-1.2) | (-1.7) | (3.1) | | 4. Bank Borrowings | 6,26,495 | 5,20,265 | 1,06,229 | 7,08,035 | 5,83,786 | 1,24,249 | 7,34,322 | 6,09,958 | 1,24,364 | | | (50.3) | (50.6) | (48.9) | (13.0) | (12.2) | (17.0) | (16.4) | (18.9) | (5.7) | | 5. Commercial Paper | 1,59,158 | 1,41,046 | 18,112 | 70,066 | 62,588 | 7,478 | 89,065 | 80,459 | 8,605 | | | (9.5) | (10.9) | (-0.3) | (-56.0) | (-55.6) | (-58.7) | (-24.4) | (-18.7) | (-54.6) | | 6. Others | 6,54,646 | 5,63,537 | 91,109 | 8,32,000 | 7,17,310 | 1,14,690 | 9,07,371 | 7,91,991 | 1,15,380 | | | (35.7) | (41.4) | (8.8) | (27.1) | (27.3) | (25.9) | (28.5) | (30.7) | (14.9) | | Total Liabilities/Assets | 31,12,899 | 26,91,076 | 4,21,823 | 33,89,267 | 29,03,886 | 4,85,381 | 35,85,854 | 30,87,817 | 4,98,037 | | | (20.6) | (20.1) | (23.7) | (8.9) | (7.9) | (15.1) | (12.1) | (12.5) | (9.7) | | 1. Loans and Advances | 23,15,608 | 19,36,593 | 3,79,015 | 23,60,504 | 19,44,889 | 4,15,615 | 24,63,279 | 20,51,581 | 4,11,698 | | | (17.8) | (16.9) | (22.6) | (1.9) | (0.4) | (9.7) | (5.2) | (5.9) | (1.7) | | 2. Investments | 4,83,759 | 4,59,868 | 23,891 | 5,41,863 | 5,02,650 | 39,213 | 6,14,408 | 5,63,570 | 50,838 | | | (21.2) | (18.8) | (99.8) | (12.0) | (9.3) | (64.1) | (14.8) | (10.4) | (105.4) | | 3. Cash and Bank Balances | 99,763 | 89,978 | 9,785 | 1,38,746 | 1,21,689 | 17,057 | 1,50,775 | 1,27,593 | 23,181 | | | (31.7) | (34.4) | (11.3) | (39.1) | (35.2) | (74.3) | (32.9) | (25.7) | (93.1) | | 4. Other Current Assets | 1,33,450 | 1,25,919 | 7,531 | 2,49,345 | 2,38,344 | 11,000 | 2,33,979 | 2,24,038 | 9,941 | | | (23.5) | (27.7) | (-20.2) | (86.8) | (89.3) | (46.1) | (78.7) | (86.2) | (-6.4) | | 5. Other Assets | 80,317 | 78,716 | 1,601 | 98,809 | 96,314 | 2,495 | 1,23,414 | 1,21,035 | 2,379 | | | (150.4) | (159.4) | (-7.3) | (23.0) | (22.4) | (55.9) | (59.2) | (59.7) | (35.0) | Notes: 1. Data are provisional.
2. Figures in parentheses indicate Y-o-Y growth in per cent.
Source: Supervisory Returns, RBI. |
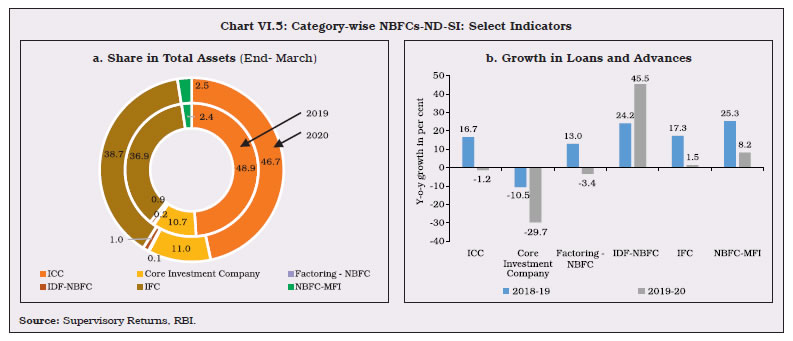
 VI.14 Amongst NBFCs-ND-SI, ICCs, IFCs and NBFCs-MFI together accounted for 87.8 per cent of the total asset size of the sub-sector. All categories of NBFCs-ND-SI faced deceleration in balance sheet growth in 2019-20, barring IDF-NBFCs (Table VI.5). VI.15 ICCs’ share contracted due to the subdued overall business environment and slackening demand in the hitherto fast-growing services sector and sectors affected by COVID-19 viz., construction, manufacturing and real estate as well as individuals whose income streams dipped (moratorium availed by individuals on loans from NBFCs stood at 57 per cent at end-August 2020). Many ICCs reported that disbursements, especially vehicle loans, came to a standstill. Balance sheets of micro finance institutions (NBFCs-MFI) expanded, albeit at a slower pace than in the past, partly due to merger of a large NBFC-MFI with a bank (Chart VI.5a and b). | Table VI.4: Analysis of Loan Moratorium | | (Availed as on August 31, 2020) | | Sector | Corporate | MSME | Individual | Others | Total | | % of total Customers | % of total outstanding | % of total Customers | % of total outstanding | % of total Customers | % of total outstanding | % of total Customers | % of total outstanding | % of total Customers | % of total outstanding | | 1 | 2 | 3 | 4 | 5 | 6 | 7 | 8 | 9 | 10 | 11 | | NBFCs | 42.7 | 37.2 | 68.8 | 67.0 | 23.1 | 56.5 | 50.2 | 33.2 | 26.6 | 44.9 | | SCBs | 18.0 | 30.4 | 77.2 | 68.1 | 43.7 | 33.9 | 35.6 | 39.1 | 43.8 | 37.9 | | System | 31.3 | 34.3 | 77.5 | 69.3 | 42.6 | 41.0 | 45.4 | 42.1 | 45.6 | 40.4 | | Source: RBI Supervisory Returns. | VI.16 IFCs’ share in total assets of NBFCs-ND-SI increased in 2019-20, driven by expansion in other assets, mainly investments. Their credit disbursements did not contract like those of the ICCs as many of them are government owned, lending to the power sector and railways, and lending by a prominent government owned IFC remained robust. Two large government owned NBFCs operating in the power sector gained from liquidity infusion of ₹90,000 crore for state power distribution utilities (DISCOMs) announced by the Government. In H1:2020-21, NBFCs-MFI, IFCs and ICCs witnessed higher balance sheet growth. | Table VI.5: Major Components of Liabilities and Assets of NBFCs-ND-SI by Activity | | (₹ crore) | | Category / Liability | At end-March 2019 | At end-March 2020 | At end- Sep 2020 | Percentage Variation of Total Liabilities | | Borrowings | Other Liabilities | Total Liabilities | Borrowings | Other Liabilities | Total Liabilities | Borrowings | Other Liabilities | Total Liabilities | | Mar 2018 over Mar 2019 | Mar 2019 over Mar 2020 | | 1 | 2 | 3 | 4 | 5 | 6 | 7 | 8 | 9 | 10 | 11 | 12 | | Investment and Credit Company | 864,891 | 4,51,814 | 13,16,705 | 8,89,277 | 4,66,188 | 13,55,466 | 8,89,119 | 5,16,762 | 14,05,882 | 16.9 | 2.9 | | Core Investment Company | 1,07,977 | 1,79,783 | 2,87,760 | 99,343 | 2,20,254 | 3,19,597 | 1,15,069 | 2,52,264 | 3,69,669 | 27.4 | 11.1 | | Factoring – NBFC | 2,087 | 2,087 | 4,174 | 1,943 | 2,132 | 4,075 | 1,584 | 2,008 | 3,592 | 9.9 | -2.4 | | IDF-NBFC | 20,487 | 4,169 | 24,656 | 24,868 | 4,935 | 29,804 | 27,756 | 5,637 | 33,393 | 19.6 | 20.9 | | Infrastructure Finance Company | 8,01,996 | 1,90,288 | 9,92,284 | 9,20,051 | 2,02,763 | 11,22,814 | 9,73,609 | 2,19,043 | 11,92,652 | 22.1 | 13.2 | | NBFC-MFI | 43,219 | 22,278 | 65,497 | 50,854 | 21,277 | 72,131 | 58,007 | 24,624 | 82,631 | 29.3 | 10.1 | | Total | 18,40,657 | 8,50,419 | 26,91,076 | 19,86,337 | 9,17,549 | 29,03,886 | 20,65,144 | 10,20,337 | 30,87,817 | 20.1 | 7.9 | | Category / Asset | Loans and Advances | Other Assets | Total Assets | Loans and Advances | Other Assets | Total Assets | Loans and Advances | Other Assets | Total Assets | Percentage Variation of Total Assets | | Mar 2018 over Mar 2019 | Mar 2019 over Mar 2020 | | Investment and Credit Company | 9,50,538 | 3,66,167 | 13,16,705 | 9,39,032 | 4,16,433 | 13,55,466 | 9,67,540 | 4,38,341 | 14,05,882 | 16.9 | 2.9 | | Core Investment Company | 20,238 | 2,67,522 | 2,87,760 | 14,225 | 3,05,372 | 3,19,597 | 31,347 | 3,38,322 | 3,69,669 | 27.4 | 11.1 | | Factoring – NBFC | 3,393 | 781 | 4,174 | 3,278 | 797 | 4,075 | 2,688 | 904 | 3,592 | 9.9 | -2.4 | | IDF-NBFC | 18,843 | 5,813 | 24,656 | 27,410 | 2,394 | 29,804 | 29,110 | 4,283 | 33,393 | 19.6 | 20.9 | | Infrastructure Finance Company | 891,659 | 1,00,625 | 9,92,284 | 9,04,743 | 2,18,072 | 11,22,814 | 9,58,519 | 2,34,132 | 11,92,652 | 22.1 | 13.2 | | NBFC-MFI | 51,922 | 13,574 | 65,497 | 56,201 | 15,930 | 72,131 | 62,377 | 20,254 | 82,631 | 29.3 | 10.1 | | Total | 19,36,593 | 7,54,483 | 26,91,076 | 19,44,889 | 9,58,997 | 29,03,886 | 20,51,581 | 10,36,237 | 30,87,817 | 20.1 | 7.9 | Note: Data are provisional.
Source: Supervisory Returns, RBI. |
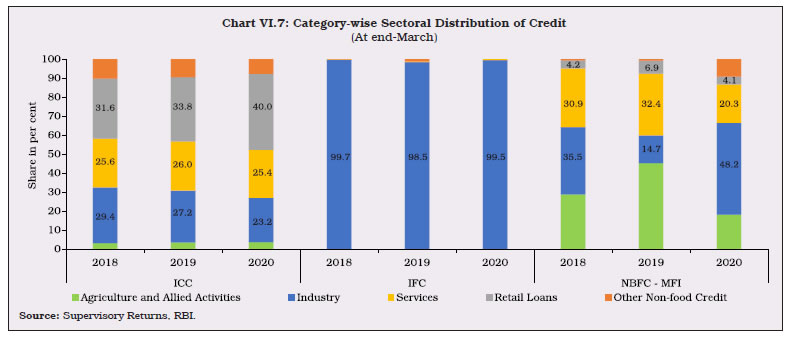
 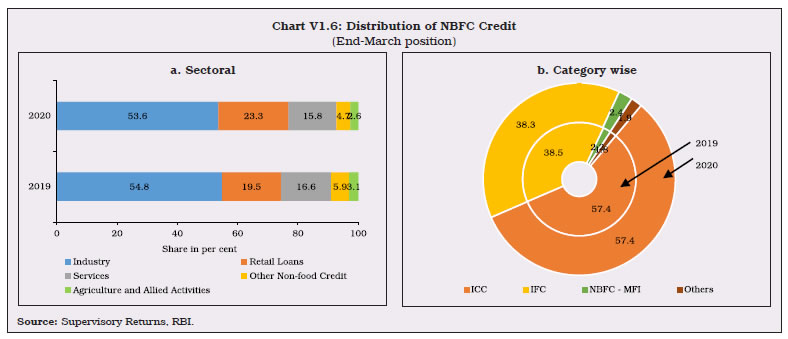 2.3 Sectoral Credit of NBFCs VI.17 Industry remained the largest recipient of credit extended by the NBFC sector, followed by retail loans and services. The share of the retail loan portfolio increased in 2019-20 with a corresponding fall in the shares of all other sectors (Chart VI.6 a). ICCs, IFCs and NBFCs-MFI are the main purveyors of credit, in that order. Together, they comprise 98.1 per cent credit extended by NBFCs at end-March 2020 (Chart VI.6 b). VI.18 In line with the overall credit deceleration, there was sharp reduction in credit growth to all sectors, barring retail. Credit to agriculture, industry and services recorded absolute declines, while the retail sector expanded at a slower pace during 2019-20 (Table VI.6). VI.19 During 2019-20, retail loans were driven up by housing loans and vehicle loans. There was a contraction in credit to agriculture, mainly due to the shift in lending by NBFCs-MFI to industry. ICCs, the biggest lenders among NBFCs, however, reduced lending to industry and the services sector akin to scheduled commercial banks (Chart VI.7). | Table VI.6: Sectoral Credit Deployment by NBFCs | | Type | At end March 2019 | At end March 2020 | Percentage Variation | | 2018-19 | 2019-20 | | 1 | 2 | 3 | 4 | 5 | | I. Gross Advances | 23,15,608 | 23,60,504 | 17.8 | 1.9 | | II. Food Credit | 232 | 310 | -3.6 | 33.5 | | III. Non-food Credit (1 to 5) | 23,15,376 | 23,60,194 | 17.8 | 1.9 | | 1. Agriculture and Allied Activities | 70965 | 61,759 | 51.7 | -13.0 | | 2. Industry (2.1 to 2.4) | 12,69,075 | 12,65,248 | 13.1 | -0.3 | | 2.1 Micro and Small | 41,985 | 75,849 | -24.2 | 80.7 | | 2.2 Medium | 18,464 | 17,388 | -24.2 | -5.8 | | 2.3 Large | 7,08,181 | 5,86,983 | 13.7 | -17.1 | | 2.4 Others | 5,00,445 | 5,85,028 | 19.4 | 16.9 | | 3. Services | 3,85,177 | 3,72,596 | 19.8 | -3.3 | | Of which, | | | | | | 3.1 Commercial Real Estate | 1,51,617 | 1,29,232 | 21.2 | -14.8 | | 3.2 Retail Trade | 29,296 | 37,179 | 8.3 | 26.9 | | 4. Retail Loans | 4,52,442 | 5,50,302 | 25.9 | 21.6 | | Of which, | | | | | | 4.1 Housing Loans | 15,663 | 21,468 | 18.2 | 37.1 | | 4.2 Consumer Durables | 5,151 | 5,128 | -40.3 | -0.4 | | 4.3 Vehicle/Auto Loans | 2,02,136 | 2,38,970 | 23.0 | 18.2 | | 5. Other Non-food Credit | 1,37,716 | 1,10,289 | 18.4 | -19.9 | Note: Data are provisional.
Source: Supervisory Returns, RBI. |
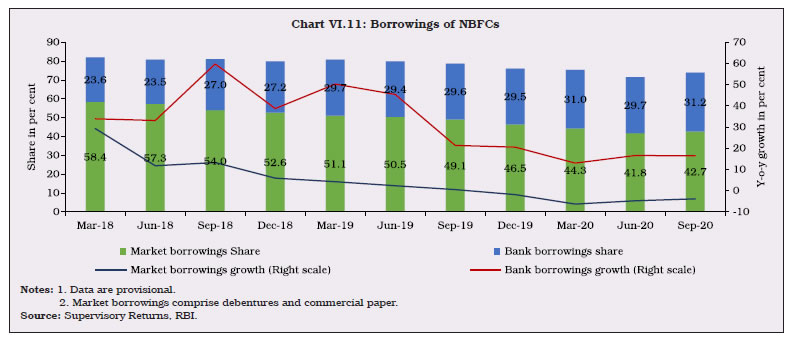
 VI.20 Among key sub sectors, credit flow to micro and small industries exhibited revival in 2019-20, albeit from a low base. Credit to commercial real estate, which constitutes around one-third of the credit extended by NBFCs to the services sector, declined sharply under the impact of the pandemic. Many companies shifted to working from home. The exodus of migrant labourers also posed impediments. Policy measures such as extension of the date of commencement of commercial operations (DCCO) to the commercial real estate projects provided relief. Consumer durables credit continued to decline due to tepid demand. Housing, which constitutes a small share in NBFCs’ loan books, continued to grow on the back of the government’s scheme for affordable housing and the improvement brought about by the Real Estate Regulations and Development Act, 2016 (Chart VI.8). 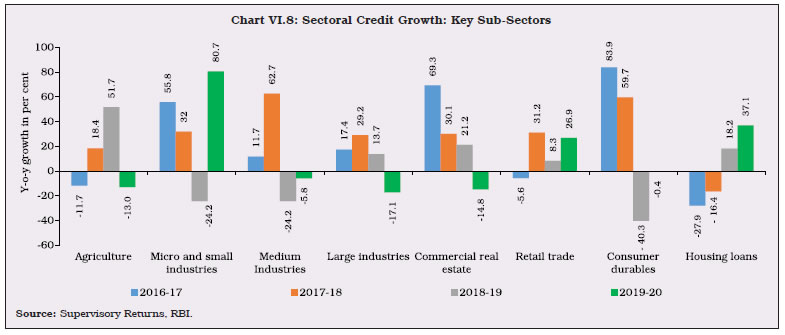 VI.21 During the year, NBFCs’ industrial credit growth was impacted by the stress in thermal power projects, lower demand for finance owing to slowdown in construction activities, fall in manufacturing sector output as well as disruptions due to COVID-19 (Chart VI.9a). However, several NBFCs remained ahead of the curve in retail sector by diversifying into other areas of vehicles financing like used vehicles, two-wheelers and three- wheelers in place of commercial vehicles. This helped in arresting the fall in credit to this sector (Chart VI.9 b). 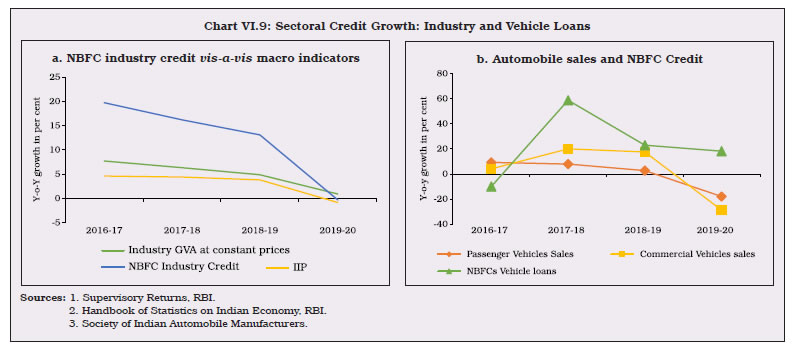 VI.22 Lending to micro, small and medium enterprises (MSME) by NBFCs picked up in 2019-20, attributable to the increased lending by NBFCs-MFI, especially in the micro and small credit segment. The Government’s announcements in the Union Budget as well as other policy measures such as interest subvention scheme for all Goods and Services Tax registered MSMEs on fresh or incremental loans augured well for the sector during the year. The updated credit- linked Capital Subsidy Scheme for MSMEs launched in 2019-20 in which guarantees are provided for extending collateral free lending to MSMEs, incentivised NBFCs’ on-lending, albeit dented by COVID-19 (Chart VI.10). 2.4 Resource Mobilisation VI.23 NBFCs mobilise resources largely via debentures and bank borrowings. With the IL&FS default and the related downgrade cascade, market access shrank and NBFCs’ reliance on banks for funds continued to rise. In 2020-21 (up to September), market confidence revived and NBFCs’ borrowings from banks and FIs accelerated, buoyed by various policy measures taken by the Reserve Bank and the government to combat COVID-19 impact (Table VI.7). VI.24 Amidst pervasive risk aversion, bank borrowings by NBFCs continued to grow at a robust pace as compared to market borrowings. As the Reserve Bank required NBFCs to adopt a Liquidity Risk Management Framework from December 2020, NBFCs gradually swapped their short-term borrowings for long-term borrowings with the aim of maintaining adequate liquidity. In 2020-21 (up to September), share of both market and bank borrowings inched up (Chart VI.11). VI.25 Amongst scheduled commercial banks (SCBs), public sector banks (PSBs) remained the dominant lender to NBFCs, followed by private sector banks (PVBs). The latter expanded lending to NBFCs in H1:2020-21 (Table VI.8; Chart VI.12a). | Table VI.7: Sources of Borrowings of NBFCs | | (₹ crore) | | Items | At end- March 2019 | At end- March 2020 | At end- September 2020 | Percentage variation | | 2018-19 | 2019-20 | | 1 | 2 | 3 | 4 | 5 | 6 | | 1. Debentures | 9,19,314 | 9,40,499 | 9,15,293 | 3.4 | 2.3 | | | (43.6) | (41.2) | (38.9) | | | | 2. Bank borrowings | 6,26,495 | 7,08,035 | 7,34,322 | 50.3 | 13.0 | | | (29.7) | (31.0) | (31.2) | | | | 3. Borrowings from FIs | 40,759 | 73,811 | 1,16,443 | 27.2 | 81.1 | | | (1.9) | (3.2) | (4.9) | | | | 4. Inter-corporate borrowings | 75,805 | 78,288 | 81,044 | 33.1 | 3.3 | | | (3.6) | (3.4) | (3.4) | | | | 5. Commercial paper | 1,59,158 | 70,066 | 89,065 | 9.5 | -56.0 | | | (7.5) | (3.1) | (3.8) | | | | 6. Other borrowings | 2,89,254 | 4,09,642 | 4,16,276 | 25.9 | 41.6 | | | (13.7) | (18.0) | (17.7) | | | | 7. Total borrowings | 21,10,785 | 22,80,341 | 23,52,444 | 19.3 | 8.0 | | | (100.0) | (100.0) | (100.0) | | | Notes: 1. Data are provisional.
2. Figures in parentheses indicate share in total borrowings.
Source: Supervisory Returns, RBI. |
 VI.26 PVB advances to NBFCs between March and September 2020 was spurred by various measures taken by the Reserve Bank and the Government to address the disruptions caused by COVID-19 (Chart VI.12b). | Table VI.8: Bank Lending to NBFCs (Outstanding) | | (₹ crore) | | Bank Group | Mar-18 | Jun-18 | Sep-18 | Dec-18 | Mar-19 | Jun-19 | Sep-19 | Dec-19 | Mar-20 | Jun-20 | Sep-20 | | 1 | 2 | 3 | 4 | 5 | 6 | 7 | 8 | 9 | 10 | 11 | 12 | | Public Sector Banks | 3,17,198 | 2,99,927 | 3,70,422 | 3,70,835 | 4,26,195 | 4,15,621 | 4,76,967 | 4,85,452 | 5,11,702 | 4,72,577 | 4,55,154 | | Private Sector Banks | 1,11,149 | 1,19,155 | 1,39,053 | 1,55,381 | 1,66,404 | 1,52,630 | 1,89,263 | 1,91,201 | 1,78,662 | 1,86,151 | 2,09,910 | | Foreign Bank Group | 22,921 | 29,605 | 31,280 | 34,427 | 30,844 | 36,944 | 39,094 | 38,462 | 41,964 | 40,638 | 37,289 | | Small Finance Bank Group-Scheduled | 1,854 | 2,247 | 3,028 | 2,918 | 3,646 | 4,327 | 4,665 | 4,344 | 4,120 | 3,620 | 3,862 | | SCBs | 4,53,123 | 4,50,934 | 5,43,783 | 5,63,561 | 6,27,089 | 6,09,523 | 7,09,988 | 7,19,459 | 7,36,447 | 7,02,986 | 7,06,216 | Notes: 1. Data are provisional.
2. Due to difference in returns, the data are not strictly comparable.
Source: Supervisory Returns, RBI. | VI.27 Banks lend to NBFCs directly and also subscribe to debentures and commercial paper (CPs) issued by NBFCs. In 2019-20, however, banks’ subscription to NBFCs’ debentures and CPs declined on risk aversion. In H1:2020-21, overall bank exposure to NBFCs continued to grow due to higher direct lending by banks as well as their investment in debentures, the latter shored up by ample liquidity and return of market confidence with the Partial Credit Guarantee Scheme (PCGS), Targeted Long-Term Repo Operations (TLTRO) and Special Liquidity Scheme (SLS). Growth in lending via CPs to NBFCs was in negative territory in September 2020 following a pick-up in Q1:2020-2021 (Chart VI.13 a and b). VI.28 Against the backdrop of low investor confidence, resource mobilisation via issuance of non-convertible debenture private placements (NCD) declined marginally during Q4:2019-20. This was reversed in Q1:2020-21 with surplus liquidity in the system. This space is largely occupied by highly rated, well-functioning NBFCs (Chart VI.14). VI.29 Coupon rates of AAA rated NBFCs softened considerably during Q4: 2019-20. With regaining of market confidence in Q1: 2020-21, the coupons and spreads softened as compared to their levels in Q4:2019-20 (Chart VI.15). VI.30 While the share of CPs declined in 2019-20 in the borrowing mix of NBFCs, they still formed nearly one-third of the total CP issuances (Chart VI.16a). In the immediate aftermath of the lockdown imposed due to COVID-19, CP issuances by NBFCs fell drastically in April 2020, attributable partially to a few big companies raising lower amounts than in the corresponding period in 2019 but more so to a spike in borrowing rates due to risk aversion. The period April-May 2020 witnessed a widening of spreads between non-government NBFCs’ CP rates and Treasury Bills (T- Bills) rates (Chart VI.16b). Subsequently, an easing in rates was observed with concomitant increase in issuances from July 2020 on account of policy interventions by the Reserve Bank as well as the Government to restore normalcy and revive investor confidence in the sector. 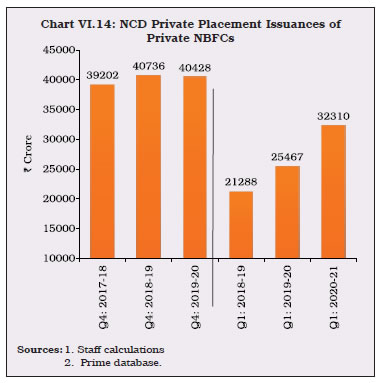 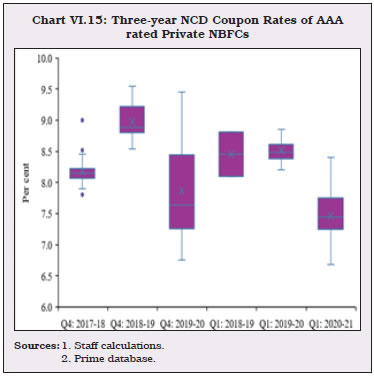 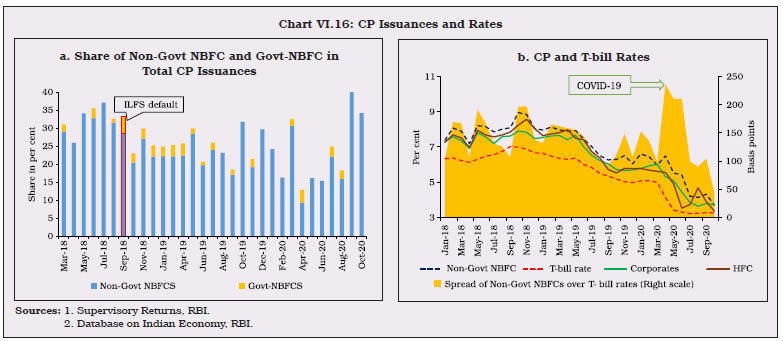 VI.31 The waning confidence of mutual funds in NBFCs’ papers continued in 2019-20 and 2020-21 (up to June 2020). However, their investment were largely limited to few large and well-rated NBFCs. Growth in mutual funds’ subscription to NCDs of medium NBFCs declined from the second half of 2019-20. In the case of CPs, mutual funds’ confidence was dampened by prevailing market pessimism and liquidity stress. While mutual funds held only a minuscule share of NCDs and CPs of small NBFCs, they exited in March 2020 and June 2020 due to heightened risk aversion in the aftermath of COVID-19 (Chart VI.17). 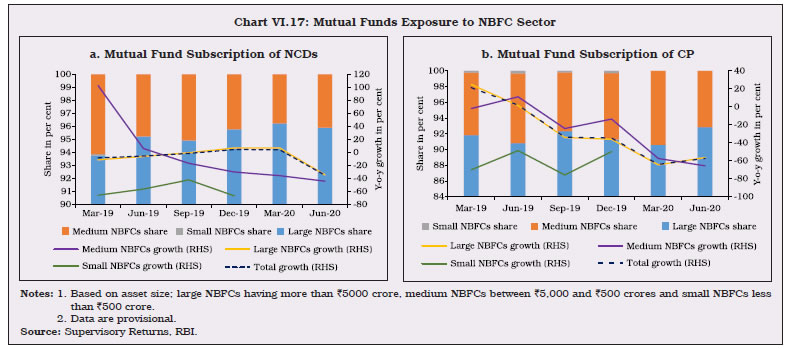 VI.32 Foreign liabilities of the sector continued to rise, especially via bonds and debentures. The Reserve Bank’s policy of easing external commercial borrowings (ECB) norms also helped NBFCs access funds via the ECB route. Foreign investors’ interest was spurred by the higher yields offered by NBFCs, while lower overall costs, including for hedging, might have induced NBFCs to utilise this window. In the first half of 2020-21, however, foreign liabilities witnessed a fall partly due to muted appetite for ECBs (Chart VI.18). 2.5 NBFCs-D: Deposits VI.33 Deposit mobilisation by NBFCs progressed at a robust pace, even though the number of companies authorised to accept deposits came down from 168 in 2017-18 to 81 in 2018-19 and 64 in 2019-20 (Chart VI.19). NBFCs-D largely raised fixed deposits in the 1-3 year maturity buckets, which bodes well for their ALM profiles (Chart VI.19). VI.34 NBFCs-D space is populated by a few large entities- 87.5 per cent of NBFCs-D raised only 1.2 per cent of total deposits and all these entities were below the ₹ 250 crore deposit threshold (Chart VI.20). 2.6 Asset Sales and Securitisation VI.35 Banks are main players in both asset sales and securitisation undertaken by NBFCs. Asset purchases from NBFCs help banks in diversifying their balance sheets while NBFCs are benefitted by higher cash flows without further leveraging of their balance sheets. Loan sales volume of NBFCs-ND-SI was higher than securitisation volumes during Q4:2019-20. Asset sales and securitisation dipped in Q1:2020-21 due to subdued demand for pooled assets as repayments were hit on account of loan moratorium; there was a revival in Q2: 2020-21 (Chart VI.21). 2.7 Asset Liability Profile of NBFCs VI.36 NBFCs have gradually changed their borrowing profile and swapped short-term borrowings for long-term borrowings, as alluded to earlier. In order to mitigate the temporary liquidity mismatches of NBFCs/ HFCs, the Partial Credit Guarantee Scheme (PCGS) was announced in the Union Budget 2019-20. PCGS aimed at providing government guarantee to public sector banks for purchase of pooled assets from financially sound NBFCs/ HFCs limited to first loss of up to 10 per cent of the fair value of assets or ₹10,000 crore, whichever is lower. NBFCs had higher share in purchase of pooled assets by PSBs under PCGS vis-à-vis HFCs and mostly assets that had AA rating were purchased while the scheme allows for purchase of pooled assets having a rating up to BBB+. Compared to previous periods, March 2020 witnessed asset-liability mismatches in the short-term maturity windows- between one month and 6 months- attributable to persistent risk aversion and compounded by COVID-19. The Reserve Bank and the Government provided policy support to help NBFCs manage asset liability mismatches. While TLTRO specifically support banks’ investment in investment grade paper of NBFCs of one to three year maturity, the ₹30,000 crore liquidity scheme launched by the Government facilitated acquisition of short-term debts through a Special Purpose Vehicle. Large, well rated NBFCs have garnered the bulk of funds via the TLTRO route (Box VI.1). Under the Special Liquidity Scheme (SLS), ₹7,126 crore was disbursed, mainly via CPs, of which 53 per cent went to NBFCs and rest to HFCs. As in the case of TLTRO, investments via the SLS route were also in well-rated CPs and NCDs. Partial Credit Guarantee Scheme (PCGS) 2.0 was launched in May 2020 as part of Aatmanirbhar Bharat Abhiyan by the Government to address temporary liquidity mismatches of otherwise solvent NBFCs/HFCs/MFIs to obviate distress sale of their assets while making available additional liquidity to them. These schemes greatly aided in ameliorating the liquidity position of NBFCs in September 2020 (Chart VI.22). 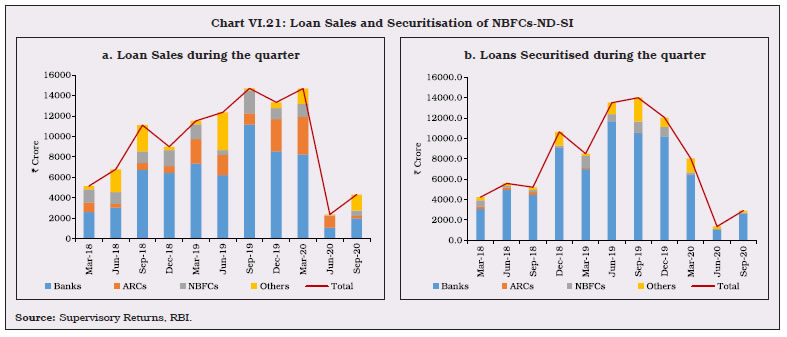
Box VI.1: Distribution of TLTRO Funds In order to address disruptions caused by COVID-19, the Reserve Bank undertook Targeted long-term repo operations (TLTRO) aimed at providing system level-liquidity as well as targeted liquidity to sectors and entities experiencing liquidity constraints and restricted market access. A study of the distribution of TLTRO funds reveals that ₹76,843 crores* have been requested by NBFCs and HFCs, four-fifth of which has been disbursed. NBFCs garnered 60 per cent of the total disbursement. Non-deposit taking NBFCs, particularly NBFCs-ND-SI, have been major beneficiaries (Chart 1a). Within NBFCs-ND-SI, Investment and Credit companies (NBFCs-ICC) and Infrastructure Finance Companies (IFCs) cornered 88 per cent of the funds. Furthermore, a rating-wise analysis shows that these firms were also well-rated, with AAA and AA rated firms accessing 88 per cent of disbursements (Chart 1b). NBFCs-ND-SI, which accessed TLTRO funding, constitute 57.4 per cent of the NBFC universe. These firms also had lower GNPA ratios and were better capitalised than other NBFCs-ND-SI (Chart 2). TLTRO has proved to be a valuable tool in the Reserve Bank’s arsenal in tackling the disruptions caused by COVID-19 and improving the resilience of the NBFC sector.
| 2.8 Financial Performance of NBFCs VI.37 NBFCs’ income growth decelerated in 2019-20, but they continued to grow on the back of fund income of NBFCs-ND-SI. On the other hand, their expenditures plummeted as businesses cut costs to trudge through the slump. Net profits of NBFCs-ND-SI witnessed a sharp revival, attributable to low base effects in the aftermath of the IL&FS crisis and moderation in their cost to income ratio. Conversely, NBFCs-D experienced a moderation in their income, coupled with ballooning interest payments and operating expenditures, which led to a decline in their profits (Table VI.9, Appendix VI.4 and VI.5). 2.9 Profitability VI.38 The profitability of the NBFC sector can be summarised by three indicators; return on assets (RoA); return on equity (RoE); and net interest margin (NIM). The improvement in RoA and RoE in 2019-20 must be seen in context of the low base of 2018-19 caused by the IL&FS event. In the case of NBFCs-D, RoA and RoE moderated. NIM remained stable for both categories (Chart VI.23). In 2020-21 so far, RoA and RoE of NBFCs-ND-SI registered an improvement while that of NBFCs-D deteriorated. NIM for both categories moderated during this period. 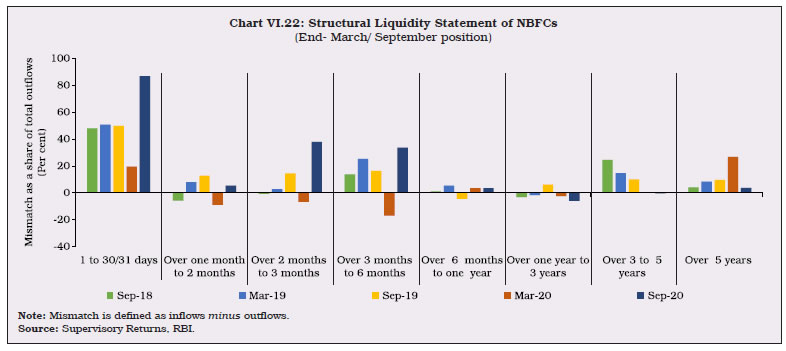
| Table VI.9: Financial Parameters of the NBFC Sector | | (₹ crore) | | Items | 2018-19 | 2019-20 | H1: 2020-21 | | NBFCs | NBFCs-ND-SI | NBFCs-D | NBFCs | NBFCs-ND-SI | NBFCs-D | NBFCs | NBFCs-ND-SI | NBFCs-D | | 1 | 2 | 3 | 4 | 5 | 6 | 7 | 8 | 9 | 10 | | A. Income | 3,39,057 | 2,77,589 | 61,468 | 3,82,800 | 3,12,326 | 70,475 | 1,88,357 | 1,56,515 | 31,842 | | | (13.9) | (11.0) | (28.9) | (12.9) | (12.5) | (14.7) | (1.7) | (3.9) | (-7.9) | | B. Expenditure | 2,99,104 | 2,54,428 | 44,676 | 3,19,285 | 2,64,387 | 54,898 | 1,36,943 | 1,10,857 | 26,086 | | | (25.9) | (26.9) | (20.5) | (6.7) | (3.9) | (22.9) | (-3.9) | (-5.0) | (1.0) | | C. Net Profit | 17,106 | 5,881 | 11,226 | 45,720 | 34,608 | 11,113 | 42,391 | 38,125 | 4,266 | | | (-59.4) | (-83.3) | (61.2) | (167.3) | (488.5) | (-1.0) | (33.9) | (49.3) | (-30.3) | | D. Total Assets | 31,12,899 | 26,91,076 | 4,21,823 | 33,89,267 | 29,03,886 | 4,85,381 | 35,85,854 | 30,87,817 | 4,98,037 | | | (20.6) | (20.1) | (23.7) | (8.9) | (7.9) | (15.1) | (12.1) | (12.5) | (9.7) | | E. Financial Ratios (as per cent of Total Assets) | | | | | | | | | | | (i) Income | 10.9 | 10.3 | 14.6 | 11.3 | 10.8 | 14.5 | 5.3 | 5.1 | 6.4 | | (ii) Expenditure | 9.6 | 9.5 | 10.6 | 9.4 | 9.1 | 11.3 | 3.8 | 3.6 | 5.2 | | (iii) Net Profit | 0.5 | 0.2 | 2.7 | 1.3 | 1.2 | 2.3 | 1.2 | 1.2 | 0.9 | | F. Cost to Income Ratio (Per cent) | 88.2 | 91.7 | 72.7 | 83.4 | 84.7 | 77.9 | 72.7 | 70.8 | 81.9 | Notes: 1. Data are provisional.
2. Figures in parenthesis indicate Y-o-Y growth in per cent.
Source: Supervisory Returns, RBI. | VI.39 Amongst the various categories of NBFCs-ND-SI, profitability indicators of NBFCs-ICC registered an improvement on account of lower expenses. The troubled CIC segment also exhibited signs of recovery, 18 months after the IL&FS episode. On the contrary, profitability of IFCs and MFIs moderated in the period under review, as their expenditures outpaced incomes (Chart VI.24). VI.40 Income ratio, funding cost, credit risk and efficiency significantly impact profitability of NBFCs-ND-SI (Box VI.2). Box VI.2: Drivers of Profitability of NBFCs-ND-SI Given their unique business model, NBFCs have been reporting healthy profitability ratios in recent times, despite deteriorating asset quality and heightened risk aversion. NBFCs witnessed robust loan portfolio growth until recently, which contributed to profitability vis-à-vis SCBs (Charts 1 and 2) alongside healthy asset quality (vis-à-vis that of SCBs).
Fixed effects panel estimation on unbalanced quarterly data of 149 NBFCs-ND-SI and macroeconomic data for the period 2011Q4- 2019Q4 was undertaken with the following equation: Among NBFC specific factors, income ratio (total income over total assets) and funding cost (interest expenses over total borrowings) were found to play a significant role in determining profitability of NBFCs. Credit risk (loan loss provisions to total credit) and efficiency (ratio of operating cost to total income) were found to have negative effects, as expected- additional provisioning reduces funds availability for on-lending and investment and increased salaries and administrative costs reduce profits. NBFC business (credit plus investment) positively impacted profitability (Table 1). Capital assets ratio and liquidity (cash and bank balances to total assets) were not found to be significant. Among industry specific factors, the effective tax rate-defined as taxes paid divided by before-tax profits-adversely impacted profits as expected. In the case of macroeconomic control variables, nominal GDP growth taken with a lag to control for reverse causality positively impacted RoE, signifying pro-cyclicality of NBFCs’ profitability. The Herfindahl-Hirschman Index (HHI), taken as proxy for market concentration and defined as the sum of squares of market share of each NBFC in a quarter was not found to be significant in affecting NBFCs’ profitability. To sum up, firm-specific factors like income ratio, funding cost, credit risk and efficiency play an important role in determining NBFCs’ profitability. Among industry and macro variables, effective tax rate and GDP growth were also key determinants of profitability. | Table 1: Estimation | | Explanatory Variables ↓ | (1) | (2) | (3) | (4) | | Dependent Variable → | ROA | ROA | ROE | ROE | | NBFCs business growth | 0.000717*** | 0.000711*** | 0.00455*** | 0.00460*** | | | (0.000) | (0.000) | (0.001) | (0.001) | | Assets (log) | -0.0493 | -0.0312 | 0.108 | 0.120 | | | (0.031) | (0.028) | (0.128) | (0.114) | | Income ratio | 0.261*** | 0.262*** | 1.082*** | 1.097*** | | | (0.021) | (0.022) | (0.081) | (0.084) | | Capital to total assets ratio | 0.285 | 0.240 | -1.377 | -1.402 | | | (0.270) | (0.274) | (1.108) | (1.145) | | Liquidity | 0.00187 | 0.00173 | 0.000684 | -0.00145 | | | (0.003) | (0.003) | (0.010) | (0.011) | | Credit risk | -0.0413*** | -0.0444*** | -0.172*** | -0.189*** | | | (0.010) | (0.010) | (0.042) | (0.044) | | Efficiency | -0.0119*** | -0.0119*** | -0.0382*** | -0.0385*** | | | (0.001) | (0.001) | (0.005) | (0.005) | | Funding cost | -0.185*** | -0.183*** | -0.722*** | -0.738*** | | | (0.027) | (0.027) | (0.105) | (0.107) | | Effective tax rate | | -0.00247*** | | -0.00866*** | | | | (0.001) | | (0.003) | | HHI | | -1.845 | | -4.564 | | | | (1.148) | | (4.518) | | Nominal GDP growth (with one lag) | | -0.000606 | | 0.0296* | | | | (0.004) | | (0.016) | | Inflation rate | | 0.00140 | | -0.00243 | | | | (0.004) | | (0.015) | | Constant | 0.883** | 0.835** | 0.137 | 0.256 | | | (0.343) | (0.369) | (1.441) | (1.451) | | N | 3180 | 3125 | 3180 | 3125 | | R2 | 0.376 | 0.376 | 0.361 | 0.356 | | Number of groups | 149 | 149 | 149 | 149 | | NBFC fixed effects | Yes | Yes | Yes | Yes | | Time fixed effects | Yes | No | Yes | No | Robust standard errors in parentheses
* p < 0.10, ** p < 0.05, *** p < 0.01 | References: Athanasoglou, P. P., Brissimis, S. N., & Delis, M. D. (2008). Bank-specific, industry-specific and macroeconomic determinants of bank profitability. Journal of International Financial Markets, Institutions and Money, 18(2), 121- 136. Dietrich, A. & Wanzenried, G. (2014). The determinants of commercial banking profitability in low-,middle-, and high-income countries. The Quarterly Review of Economics and Finance, 54 (3), 337–354. Kohlscheen, E., Murcia Pabón, A., & Contreras, J. (2018). Determinants of bank profitability in emerging markets. BIS Working Papers, No 686. | 2.10 Asset Quality VI.41 Asset quality of the NBFC sector deteriorated as slippages rose in 2019-20. However, efforts were made by NBFCs to clean up their balance sheets, as reflected in their written-off and recovery ratios. The NNPA ratio remained stable and the provision coverage ratio (PCR) improved in the period under consideration (Chart VI.25). In 2020-21 (up to September), impairment in asset quality intensified. VI.42 On the basis of the duration for which an asset remains non-performing, NPAs can be categorised into sub-standard, doubtful and loss assets. Since 2018-19, the proportion of standard assets has declined, as slippages to sub-standard category increased. In 2019-20, doubtful assets also registered a marginal uptick while the share of loss assets remained constant (Chart VI.26). In H1: 2020-21, standard assets shrunk further even as the proportion of doubtful and loss assets increased. 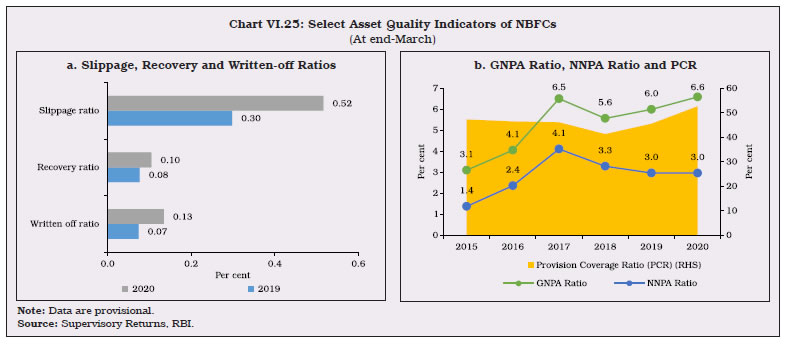 VI.43 The GNPA ratio of NBFCs-ND-SI deteriorated in 2019-20 on account of worsening asset quality of NBFCs- ICC. IFCs reported an improvement in their GNPA ratio, mirroring resolution in stressed assets of a prominent government NBFC. NBFCs-MFI registered further improvement in asset quality, reflecting the inherently healthy quality of the MFI loan portfolio (Chart VI.27a). The NNPA ratio for NBFCs-ND-SI remained stable, reflecting improved provisions, though there was an increase in the NNPA ratio of ICCs. On the other hand, the NNPA ratio of IFCs and NBFC-MFIs declined, with the latter reporting no NNPAs at end-March 2020 (Chart VI.27b). In H1:2020-21, the GNPA and NNPA ratios of NBFCs-ND-SI inched up. 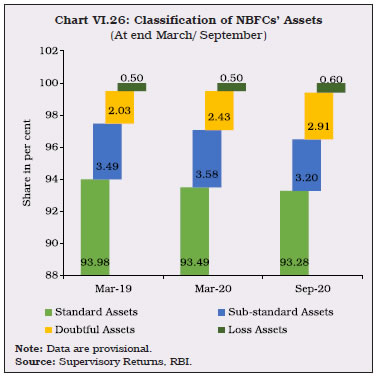 VI.44 A sectoral snapshot of stressed assets of NBFCs-ND-SI5 shows that industry, which is the largest recipient of NBFC lending traditionally had the highest share of stressed assets. The distress in the services sector, particularly in commercial real estate with 34.7 per cent share in services sector loans and advances, became apparent as it’s stressed assets shot up in 2019-20, surpassing those in industry (Chart VI.28). However, in the light of the economic damage inflicted by COVID-19 across segments, the asset quality of NBFCs may worsen even in the retail loans category, which is generally considered a safe haven with the lowest share of stressed assets. In this regard, the Reserve Bank announced a six- month moratorium on loan repayments till August 31, 2020 and subsequently a one-time debt restructuring plan, which are geared to stem a rise in NPAs and cushion the impact of the pandemic on the financial ecosystem. 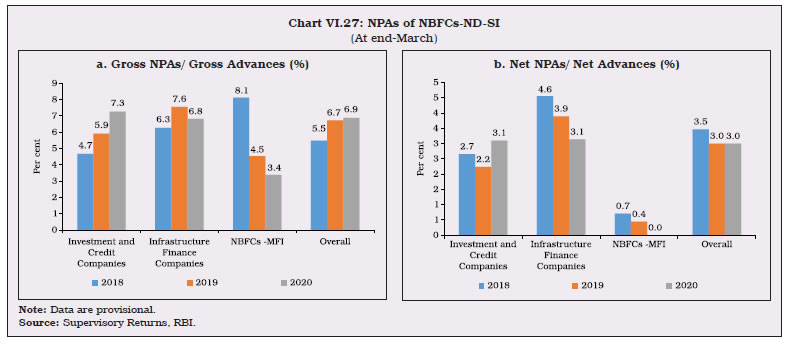 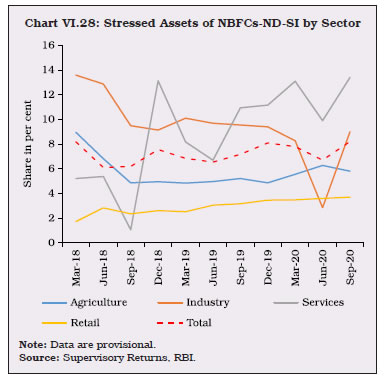 VI.45 NBFCs-D fared better than NBFCs-ND-SI in terms of asset quality. They exhibited a marginal decline in their GNPA ratio in 2019-20, aided by steady growth in disbursements. Their NNPA ratio also remained stable (Chart VI.29). In 2020-21 (up to September), their asset quality registered further improvement. 2.11 Capital Adequacy VI.46 The system-level capital to risk-weighted assets ratio (CRAR) of NBFCs dipped marginally due to an uptick in NPAs in 2019-20. However, they remained well-capitalised (Chart VI.30), maintaining Tier-1 capital of 16 per cent at end-March 2020, much higher than the regulatory stipulation of 10 per cent. VI.47 Amongst NBFCs-ND-SI, IFCs registered an improvement, buoyed by an increase in Tier-1 capital. CRARs of NBFCs-MFI deteriorated due to capital erosion and increase in their risk-weighted assets (Chart VI.31a). On the other hand, NBFCs-D registered an increase in their CRARs on the back of equity infusion, which led to a strengthening of their balance sheets (Chart VI.31b). Both NBFCs-ND-SI and NBFCs-D adhered to capital adequacy norms prescribed by the Reserve Bank. 2.12 Exposure to Sensitive Sectors VI.48 The Reserve Bank has identified capital markets, real estate and commodities as sensitive sectors in view of the risks that emanate from fluctuations in their prices. NBFCs have been progressively curtailing their exposure to real estate due to funding constraints and dissuaded by stress in the sector. There was a steep fall in credit extended to real estate in 2019-20 even as capital market exposure edged up. Consequently, a marginal increase in sensitive sector exposure was registered (Chart VI.32). 2.13 Residuary Non-Banking Companies (RNBCs) VI.49 The principal business of RNBCs is collecting deposits and deploying them in approved securities, as directed by the Reserve Bank. The number of RNBCs has consistently declined since 1998-99, at end- March 2020, only one RNBC remained in operation which is not accepting any new deposits. VI.50 In sum, the balance sheet growth of the NBFC sector decelerated considerably in 2019-20, mainly due to the challenges posed by a weak macroeconomic environment and compounded by the after-effects of the IL&FS default and resultant liquidity stress. On the liabilities side, market borrowings decelerated, with bank borrowings filling the funding gap. Deposit mobilisation by NBFCs-D continued to grow. RoA and RoE of NBFCs registered an improvement and they remained well-capitalised. As regards asset quality, the GNPA ratio deteriorated, but NNPA remained stable with PCR registering an improvement, signalling overall resilience of the sector. 2.14 Housing Finance Companies (HFCs) VI.51 Housing finance companies (HFCs) are specialized lending institutions which, along with SCBs, are the main purveyor of housing credit. The Finance (No.2) Act, 2019 (23 of 2019) amended the NHB Act, 1987 transferring regulation of HFCs to the Reserve Bank, effective August 9, 2019. HFCs are henceforth treated as a category of NBFCs for regulation purposes. VI.52 On June 17, 2020, the Reserve Bank placed the draft regulatory framework for HFCs in the public domain seeking comments from stakeholders. Guidelines for HFCs were issued on October 22, 2020 (refer Chapter 3 paragraph III.47), inter alia, defining ‘housing finance’, ‘principal business’ and ‘qualifying assets for HFCs’, provision of a glidepath for transition to registered HFCs who do not currently qualify as HFC, minimum net owned funds for HFC and LCR. Harmonising the regulations between HFCs and NBFCs would be carried out in a phased manner over a period of two years; until such time, HFCs will follow the extant norms. VI.53 HFCs experienced headwinds in 2019-20 due to liquidity stress and constraints on market access post DHFL event. Bank credit to the housing sector decelerated in 2019-20 (Chart VI.33). VI.54 At the end of March 2020, there were 101 HFCs, of which only 17 were deposit taking entities out of which, six HFCs have to take prior permission for accepting deposits. Non-government public limited companies dominate the segment with 94 per cent of total assets. These entities experienced a slowdown in balance sheet growth to 4.5 per cent in 2019-20, from 14.5 per cent in 2018-19. The sole government HFC, with a share of 5.6 per cent in total assets, grew by 9.2 per cent in 2019-20, a deceleration from the expansion of 49 per cent in 2018-19 (Table VI.10). 2.14.1. Balance Sheet VI.55 The growth of the consolidated balance sheet of HFCs decelerated to 4.3 per cent in 2019-20 vis-à-vis 16.4 per cent in 2018-19 on account of a sharp decrease in loans and advances and investments due to weakening of economic activity and risks accentuated by the pandemic. On the liabilities side, bank borrowings maintained a healthy pace albeit borrowings via market instruments like debentures and commercial paper contracted significantly, reflecting fading market confidence (Table VI.11). | Table VI.10: Ownership Pattern of HFCs | | (At end-March) | | (₹ crore) | | Type | 2019 | 2020 | | Number | Asset Size | Number | Asset Size | | 1 | 2 | 3 | 4 | 5 | | A. Government Companies | 1 | 72,839 | 1 | 79,535 | | B. Non-Government Companies (1+2) | 98 | 12,72,300 | 100 | 13,29,608 | | 1. Public Ltd. Companies | 78 | 12,69,634 | 76 | 13,25,040 | | 2. Private Ltd. Companies | 20 | 2,667 | 24 | 4,568 | | Total (A+B) | 99 | 13,45,139 | 101 | 14,09,143 | | Source: NHB. | 2.14.2. Resource Profile of HFCs VI.56 HFCs predominantly rely on debentures and bank borrowings for funds, constituting around 66 per cent of total resources (Chart VI.34). The dependence of HFCs on bank borrowings grew significantly in 2019-20, reflecting rising reliance on long term-resources amidst risk averse market conditions. VI.57 In order to infuse liquidity into the housing finance system, the NHB opened an additional window called the Liquidity Infusion Facility (LIFt) Scheme for HFCs in August 2019. The objective of this scheme is to support HFCs in creating individual housing loan portfolios that fall under the priority sector. An amount of ₹ 10,000 crore was initially allotted under the scheme. The total refinance disbursed by NHB during the 2019-20 (July-June) was ₹31,258 crore, out of which, ₹27,551 crore was disbursed to HFCs to mitigate the liquidity stress faced by them. | Table VI.11: Consolidated Balance Sheet of HFCs | | (At end-March) | | (₹ crore) | | Items | 2018 | 2019 | 2020 | Percentage variation | | 2018-19 | 2019-20 | | 1 | 2 | 3 | 4 | 5 | 6 | | 1 | Share capital | 30,548 | 34,360 | 37,023 | 12.5 | 7.8 | | 2 | Reserves and surplus | 1,25,922 | 1,54,807 | 1,46,420 | 22.9 | -5.4 | | 3 | Public deposits* | 1,21,886 | 1,07,389 | 1,19,795 | -11.9 | 11.6 | | 4 | Debentures | 4,11,317 | 4,76,297 | 4,02,926 | 15.8 | -15.4 | | 5 | Bank borrowings | 2,19,003 | 3,07,426 | 3,61,416 | 40.4 | 17.6 | | 6 | Borrowings from NHB$ | 45,825 | 48,361 | 49,673 | 5.5 | 2.7 | | 7 | Inter-corporate borrowings | 4,013 | 35,627 | 6,206 | 787.8 | -82.6 | | 8 | Commercial papers | 98,324 | 80,646 | 46,631 | -18.0 | -42.2 | | 9 | Borrowings from Government | 0 | 0 | 1,282 | | | | 10 | Subordinated debts | 20,200 | 18,595 | 17,584 | -7.9 | -5.4 | | 11 | Other borrowings | 21,146 | 25,103 | 1,49,615 | 18.7 | 496.0 | | 12 | Current liabilities | 32,052 | 14,003 | 20,501 | -56.3 | 46.4 | | 13 | Provisions | 12,812 | 8,578 | 7,524 | -33.0 | -12.3 | | 14 | Other** | 18,410 | 40,397 | 42,548 | 119.4 | 5.3 | | 15 | Total Liabilities/ Assets | 11,61,459 | 13,51,590 | 14,09,143 | 16.4 | 4.3 | | 16 | Loans and advances | 9,45,149 | 11,91,727 | 11,97,097 | 26.1 | 0.5 | | 17 | Hire purchase and lease assets | 4 | 0.2 | 33 | -94.6 | 14855.9 | | 18 | Investments | 73,877 | 90,406 | 98,062 | 22.4 | 8.5 | | 19 | Cash and bank balances | 19,578 | 34,376 | 58,411 | 75.6 | 69.9 | | 20 | Other assets*** | 1,22,851 | 35,082 | 55,540 | -71.4 | 58.3 | *Public deposits given in the table include corporate deposits of a major HFC.
**includes deferred tax liabilities and other liabilities.
***includes fixed assets, tangible and intangible assets, other assets and deferred tax asset.
$: Borrowings from NHB has been reconciled, as some of the HFCs, merged the NHB borrowings figures in the “Borrowings from Bank/ FIs.
Notes: Data are provisional, based on Ind AS as per Annual Reports of reporting companies.
Source: NHB | VI.58 Public deposits are another important source of funding for HFCs. Public deposit growth accelerated in 2019-20 (Chart VI.35); however, the share of deposits in total liabilities of HFCs has been steadily declining since 2015-16 till 2018-19, although it increased during 2019-20. The distribution of HFCs’ deposits shows that almost 98 per cent of the deposits is concentrated in the 6-9 per cent interest rate bracket, reflecting reducing interest burden as well as the easing monetary policy stances (Chart VI.36). Furthermore, a maturity-wise analysis shows that depositors’ preference is largely for the maturity period between 24 to 48 months. The acceleration in deposit growth was also seen in this bucket. 2.14.3. Financial Performance VI.59 The consolidated income of HFCs declined in 2019-20 on account of moderation of fund income. Expenditure also increase in 2019-20 due to rising operating expenditure and substantial losses reported by two HFCs6 (Chart VI.37). Income as a proportion to total assets stagnated on account of the moderation in total assets, while expenditure increased on account of a spike in operating expenses. As a result, there was a significant rise in the cost to income ratio in 2019-20. Meanwhile, the RoA deteriorated to zero due to a deep plunge in profits (Table VI.12). 2.14.4. Soundness Indicators VI.60 GNPA and NNPA ratios had increased slightly in 2018-19 but they registered a leap in 2019-20 on account of marked decline in net profit and provisioning (Chart VI.38). Two major HFCs registered a spurt in its GNPA and NNPA ratios in 2019-20. Without considering two major HFCs, GNPA and NNPA ratios stood at 1.4 per cent and 0.8 per cent, respectively in 2019-20 (Chart VI.39). In comparison to other NBFCs, however, the asset quality of HFCs worsened. 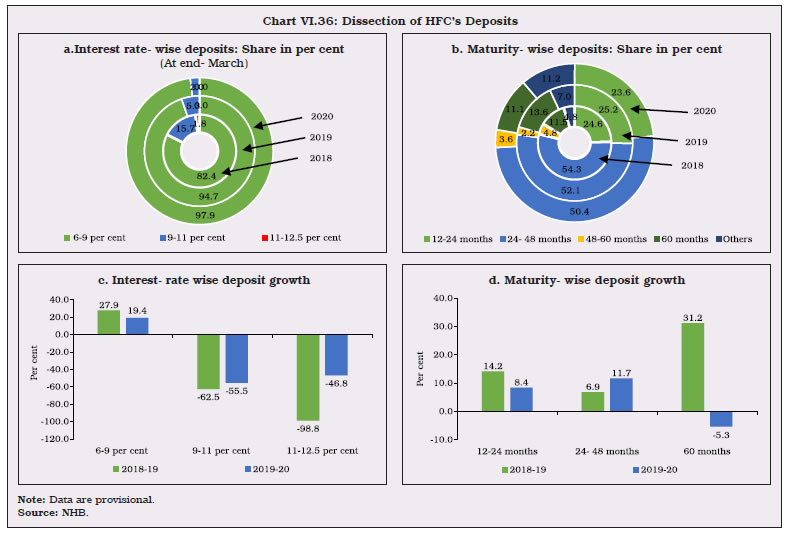
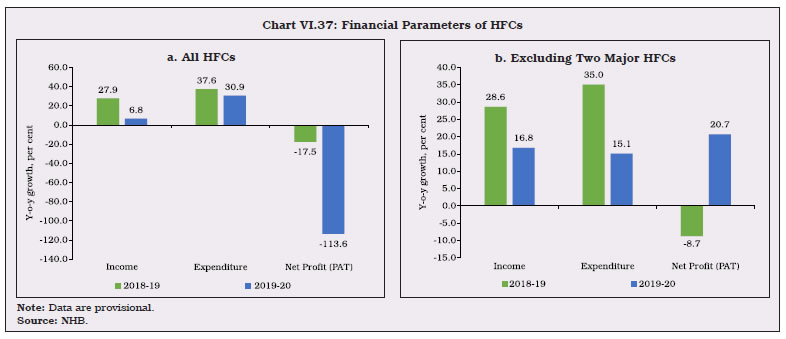 VI.61 To sum up, in 2019-20, generally muted credit demand, DHFL episode and the slowdown in the housing sector led to a sharp deceleration in loans and advances by HFCs. This, in turn, affected their profitability. After the outbreak of COVID-19, several regulatory and liquidity measures were announced by the Reserve Bank, along with the announcement of Aatmanirbhar Bharat Abhiyan by the Government, resulted in an improvement in the liquidity position of HFCs. The sounder HFCs were able to raise resources at lower rates from the market. The Liquidity Infusion Facility (LIFt) Scheme and participation in the equity share capital of HFCs by NHB will also help in quick revival of the sector. | Table VI.12: Financial Ratios of HFCs | | (As per cent of Total Assets) | | (At end-March) | | Particulars | 2016 | 2017 | 2018 | 2019 | 2020 | | 1 | 2 | 3 | 4 | 5 | 6 | | Total Income | 10.5 | 10.0 | 9.0 | 10.0 | 10.2 | | 1. Fund Income | 10.3 | 9.8 | 8.8 | 9.8 | 10.0 | | 2. Fee Income | 0.2 | 0.2 | 0.2 | 0.2 | 0.1 | | Total Expenditure | 7.5 | 7.4 | 6.6 | 7.9 | 9.9 | | 1. Financial Expenditure | 6.8 | 6.4 | 5.7 | 6.4 | 6.4 | | 2. Operating Expenditure | 0.7 | 0.9 | 1.0 | 1.5 | 3.5 | | Tax Provision | 0.9 | 0.8 | 0.7 | 0.7 | 0.6 | | Cost to Income Ratio (Total Exp./Total Income) | 71.6 | 73.6 | 73.6 | 79.1 | 97.0 | | Return on Assets (RoA) (PAT/Total Assets) | 2.0 | 2.1 | 2.0 | 1.4 | 0.0 | | Source: NHB. |
3. All India Financial Institutions VI.62 All India financial institutions (AIFIs) such as the National Bank for Agriculture and Rural Development (NABARD), the Small Industries Development Bank of India (SIDBI) and the National Housing Bank (NHB) play an important role in meeting the long-term funding requirements of agriculture and the rural sector, small industries, housing finance companies, NBFCs and MFIs. In addition, Export Import Bank of India (EXIM Bank), functions as the principal financial institution promoting the country’s international trade and providing financial assistance to exporters and importers. VI.63 The Reserve Bank regulates and supervises these four all India financial institutions (AIFIs), viz., NABARD, SIDBI, NHB and EXIM Bank. Consequent to the Reserve Bank’s divestment of its entire shareholding in NHB on March 19, 2019, NHB has also become a wholly government-owned institution, along with NABARD and EXIM Bank (Chart VI.40). 3.1 AIFIs’ Operations7 VI.64 Financial assistance sanctioned by AIFIs decelerated by 3.1 per cent during 2019-20, primarily due to decreased sanctions by NABARD. On the other hand, disbursement grew by 7.6 per cent in 2019-20. SIDBI recorded the highest disbursement growth, followed by NHB, reflecting its thrust on “Make in India” and “Vocal for Local” initiatives for MSMEs and “Housing for All by 2022” under the Pradhan Mantri Awas Yojana (Urban) and the Pradhan Mantri Awas Yojana (Gramin) by NHB. Disbursements by NABARD remained stagnant during the year. Financial assistance sanctioned by EXIM Bank increased moderately but disbursement declined on account of slowdown in exports and subdued macroeconomic conditions (Table VI.13 and Appendix Table VI.6). 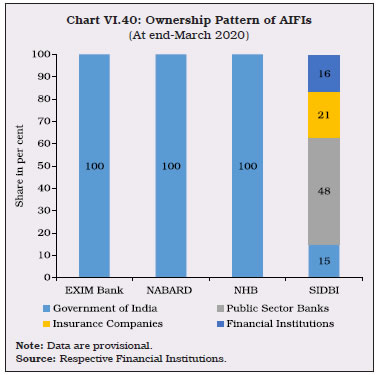
| Table VI.13: Financial Assistance Sanctioned & Disbursed by AIFIs | | (₹ crore) | | | 2018-19 | 2019-20 | | S | D | S | D | | 1 | 2 | 3 | 4 | 5 | | EXIM BANK | 38,001 | 36,660 | 40,255 | 33,735 | | NABARD | 3,03,870 | 2,81,947 | 2,78,883 | 2,81,811 | | NHB | 32,753 | 25,177 | 36,594 | 31,258 | | SIDBI | 75,386 | 76,011 | 1,08,289 | 1,04,852 | | Total | 4,50,010 | 4,19,795 | 4,64,021 | 4,51,657 | S: Sanctions; D: Disbursements.
Note: Data are provisional.
Source: Respective Financial Institutions | 3.2 Balance Sheet VI.65 The consolidated balance sheet of AIFIs’ expanded at slower pace in 2019-20 relative to a year ago on account of moderate growth in loans and advances, particularly by NABARD, and contraction in investments (Table VI.14). Loans and advances constituted the largest share-87.8 per cent in total assets of AIFIs, followed by investments at six per cent. On the liabilities side, AIFIs’ reliance on borrowings contracted driven by a large decline reported by NABARD and SIDBI. NHB resorted to higher borrowings to finance its enhanced credit disbursements and investment activities. On the other hand, borrowings through bonds and debentures were robust across all AIFIs. VI.66 Total resources raised by AIFIs declined in 2019-20 due to the slow pace of loans and advances and investments by AIFIs, barring EXIM Bank, which resorted to higher foreign currency borrowings. Out of total resources raised in 2019-20, NHB mobilised the highest share, followed by NABARD, SIDBI and EXIM Bank. Putting both together, NHB and NABARD accounted for 84 per cent of the total borrowings. Except SIDBI, AIFIs largely rely on short-term funds for financing their activities, particularly NHB which raises over 94 per cent of its resources via short term instruments. A gradual shift towards long term borrowings was observed in 2019-20 (Table VI.15). | Table VI.14: AIFIs’ Balance Sheet | | (₹ crore) | | Liabilities | 2019 | 2020 | Percentage variation | | 2019-20 | | 1 | 2 | 3 | 4 | | 1. Capital | 26921 | 29921 | 11.1 | | | (3.2) | (3.2) | | | 2. Reserves | 57042 | 63522 | 11.4 | | | (6.8) | (6.8) | | | 3. Bonds & Debentures | 209059 | 263425 | 26.0 | | | (25.1) | (28.0) | | | 4. Deposits | 336914 | 386674 | 14.8 | | | (40.4) | (41.1) | | | 5. Borrowings | 149318 | 138621 | -7.2 | | | (17.9) | (14.7) | | | 6. Other Liabilities | 54293 | 58452 | 7.7 | | | (6.5) | (6.2) | | | Total Liabilities / Assets | 833548 | 940615 | 12.8 | | Assets | | | | | 1. Cash & Bank Balances | 23437 | 35079 | 49.7 | | | (2.8) | (3.7) | | | 2. Investments | 61257 | 59867 | -2.3 | | | (7.3) | (6.4) | | | 3. Loans & Advances | 729226 | 825620 | 13.2 | | | (87.5) | (87.8) | | | 4. Bills Discounted /Rediscounted | 700 | 1395 | 99.3 | | | (0.1) | (0.1) | | | 5. Fixed Assets | 1052 | 1220 | 16.0 | | | (0.1) | (0.1) | | | 6. Other Assets | 17876 | 17433 | -2.5 | | | (2.1) | (1.9) | | Note: Figures in parentheses are percentages of total liabilities/assets.
Data are provisional.
Source: Respective Financial Institutions. | VI.67 The NABARD and the SIDBI together constituted around 77 per cent of resources raised by the AIFIs from the money market. However, resources raised through certificate of deposits increased across all AIFIs. The utilisation of borrowing limits remained narrowly higher (Table VI.16). | Table VI.15: Resources Mobilised by AIFIs in 2019-20 | | (₹ crore) | | Institution | Total Resources Raised | Total Outstanding | | Long-Term | Short-Term | Foreign Currency | Total | | 1 | 2 | 3 | 4 | 5 | 6 | | EXIM BANK | 990 | 12,478 | 14,460 | 27,928 | 1,05,166 | | NABARD | 98,115 | 1,82,090 | 0 | 2,80,205 | 4,42,886 | | NHB | 18,123 | 2,76,755 | 0 | 2,94,877 | 79,005 | | SIDBI | 52,118 | 29,115 | 10 | 81,244 | 1,61,200 | | Total | 1,69,346 | 5,00,438 | 14,470 | 6,84,254 | 7,88,257 | Note: Long-term rupee resources comprise borrowings by way of bonds/ debentures; while short-term resources comprise CPs, term deposits, ICDs, CDs and borrowings from the term money market. Foreign currency resources largely comprise of borrowings by way of bonds, etc. in the international market. Data are provisional.
Source: Respective Financial Institutions. | 3.3 Sources and Uses of Funds VI.68 Funds raised and deployed by the AIFIs grew by 12 per cent in 2019-20 slightly lower in the previous year. Though NHB and SIDBI reported increase in fresh deployment, NABARD reported a marginal decline in fresh deployment. The share of repayment of past borrowings declined to 53.4 per cent from 64.3 per cent of the resources mobilised (Table VI.17). | Table VI.16: Resources Raised by AIFIs from the Money Market | | (At end-March)# | | (₹ crore) | | Instrument | 2018-19 | 2019-20 | | 1 | 2 | 3 | | A. Total | 1,18,717 | 1,20,294 | | i) Term Deposits | 5,420 | 1,298 | | ii) Term Money | 4,067 | 7,211 | | iii) Inter-corporate Deposits | 7,431 | 8,177 | | iv) Certificate of Deposits | 32,436 | 46,240 | | v) Commercial Paper | 69,363 | 57,368 | | Memo Items: | | | | B. Umbrella Limit | 1,03,887 | 1,17,538 | | C. Utilization of Umbrella limit* (A as percentage of B) | 131 | 104 | #: End-June for NHB. *: Resources raised under A.
Note: AIFIs are allowed to mobilise resources within the overall ‘umbrella limit’, which is linked to the net owned funds (NOF) of the FI concerned as per its latest audited balance sheet. The umbrella limit is applicable for five instruments– term deposits; term money borrowings; certificates of deposits (CDs); commercial paper (CPs); and inter-corporate deposits.
Source: Respective Financial Institutions. |
| Table VI.17: Pattern of AIFIs’ Sources and Deployment of Funds | | (₹ crore) | | Items | 2018-19 | 2019-20 | Percentage variation | | 1 | 2 | 3 | 4 | | A. Sources of Funds | | | | | i. Internal | 31,32,555 | 36,18,908 | 15.5 | | | (82.0) | (84.3) | | | ii. External | 5,99,920 | 5,50,496 | -8.2 | | | (15.7) | (12.8) | | | iii. Others@ | 87,930 | 1,24,634 | 41.7 | | | (2.3) | (2.9) | | | Total (i+ii+iii) | 38,20,405 | 42,94,037 | 12.4 | | | (100) | (100) | | | B. Deployment of Funds | | | | | i. Fresh Deployment | 7,77,016 | 8,05,091 | 3.6 | | | (20.3) | (18.7) | | | ii. Repayment of Past Borrowings | 24,58,210 | 22,93,775 | -6.7 | | | (64.3) | (53.4) | | | iii. Other Deployment | 5,85,179 | 11,95,171 | 104.2 | | | (15.3) | (27.8) | | | of which: Interest Payments | 42,007 | 39,408 | -6.2 | | | (1.1) | (0.9) | | | Total (i+ii+iii) | 38,20,405 | 42,94,037 | 12.4 | @: Includes cash and balances with banks and the Reserve Bank of India
Note: Figures in parentheses are percentages of total. Data are provisional.
Source: Respective Financial Institutions. | 3.4 Maturity and Cost of Borrowings and Lending VI.69 AIFIs were able to borrow at lower rates as the weighted average cost (WAC) of rupee resources raised by AIFIs decreased in 2019-20 vis-à-vis the previous year, except for NABARD (Chart VI.41a). The weighted average maturity (WAM) of rupee resources increased for NABARD and EXIM Bank but shortened for NHB and SIDBI (Chart VI.41b). The WAC of NABARD increased in 2019-20 as NABARD elongated its WAM, accompanied by rising long term costs. VI.70 The long-term prime lending rate (PLR) marginally decreased across all AIFIs in 2019-20; NHB recorded the highest decline-60 bps- followed by SIDBI, reflecting the monetary easing cycle (Chart VI.42). 3.5 Financial Performance VI.71 AIFIs posted moderate growth in income during 2019-20 on account of deceleration in interest income, which constitutes the largest share in income. Expenditure slowed down at a faster pace, primarily on account of a substantial decrease in interest expenses, the largest element in expenditure. Operating expenses increased noticeably due to a hike in the wage bill and as a result, net profits of AIFIs posted a marginal increase during 2019-20 (Table VI.18). 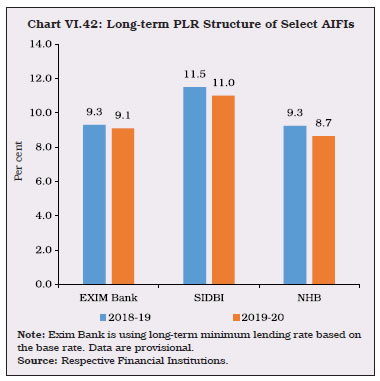
| Table VI.18: Financial Performance of AIFIs | | (₹ crore) | | Type | 2018-19 | 2019-20 | Percentage Variation | | 2018-19 | 2019-20 | | 1 | 2 | 3 | 4 | 5 | | A) Income | 53,957 | 58,461 | 22.1 | 8.3 | | a) Interest Income | 52,699 | 56,863 | 22.6 | 7.9 | | | (97.7) | (97.3) | | | | b) Non Interest Income | 1,258 | 1,597 | 4.2 | 27.0 | | | (2.3) | (2.7) | | | | B) Expenditure | 42,109 | 44,500 | 22.2 | 5.7 | | a) Interest Expenditure | 39,321 | 41,237 | 24.3 | 4.9 | | | (93.4) | (92.7) | | | | b) Operating Expenses | 2,789 | 3,263 | -1.2 | 17.0 | | | (6.6) | (7.3) | | | | of which Wage Bill | 1,987 | 2,323 | -3.9 | 16.9 | | C) Provisions for taxation | 2,834 | 2,244 | 354.2 | -20.8 | | D) Profit | | | | | | Operating Profit (PBT) | 10,845 | 10,525 | 15.9 | -3.0 | | Net Profit (PAT) | 6,132 | 6,493 | 142.9 | 5.9 | Note: Figures in parentheses are percentages of total income/expenditure.
Data are provisional.
Source: Respective Financial Institutions. |
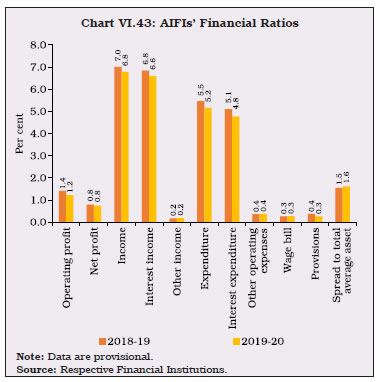 VI.72 Under financial ratios, operating profit as a ratio of total average assets decreased in line with the reduction in interest income. However, other financial ratios, except the ratio of spread to total average assets, decreased or remained unchanged in 2019-20 on a year-on-year basis (Chart VI.43). VI.73 Interest income remained the major source of income for AIFIs, during 2019-20. Barring NABARD, interest income as a ratio of the average working funds for all AIFIs declined. Operating profits of NABARD and SIDBI improved, indicating efficient utilisation of working funds; however, operating profits of EXIM Bank and NHB moderated during the year in line with ebbing of interest income. (Table VI.19). VI.74 Except for NABARD, the return on assets (RoA) for all AIFI’s remained stagnant or moderated in 2019-20. The RoA of SIDBI remained higher than the average for AIFIs, followed by NABARD and NHB. However, the CRAR for all AIFIs remained higher than the stipulated norm of 9 per cent (Chart VI.44). | Table VI.19: AIFIs’ Select Financial Parameters | | Items | Interest Income/ Average Working Funds (per cent) | Non-interest Income/ Average Working Funds (per cent) | Operating Profit/ Average Working Funds (per cent) | Net Profit per Employee
(₹ lakh) | | 2019 | 2020 | 2019 | 2020 | 2019 | 2020 | 2019 | 2020 | | EXIM Bank | 7.8 | 7.2 | 0.3 | 0.4 | 1.9 | 1.8 | 23 | 35 | | NABARD | 6.6 | 6.7 | 0.0 | 0.0 | 1.2 | 1.4 | 89 | 108 | | NHB | 7.1 | 6.3 | 0.4 | 0.1 | 2.6 | 1.9 | 672 | 153 | | SIDBI | 6.9 | 6.5 | 0.3 | 0.6 | 1.8 | 2.2 | 176 | 221 | Note: Data are provisional.
Source: Respective Financial Institutions. |
3.6 Soundness Indicators VI.75 AIFIs’ net NPAs ratios increased during 2019-20. There was a noticeable decrease in NPAs of EXIM Bank, while SIDBI reported an increase (Chart VI.45). The sharp decline in net NPAs of EXIM bank was partly reflective of higher provisioning. VI.76 Overall, AIFIs continued to maintain stable asset quality as reflected in the ratio of standard assets in 2019-20 (Chart VI.46). The EXIM Bank still holds a high portion of doubtful assets in its portfolio, which accounted for around 96 per cent of the doubtful assets of all AIFIs taken together. 4. Primary Dealers VI. 77 At end-March 2020, there were 21 primary dealers (PDs), 14 of which operate as bank departments and 7 as standalone PDs (SPDs) registered as NBFCs under Section 45 IA of the RBI Act, 1934. 4.1 Operations and Performance of PDs VI. 78 PDs are mandated to underwrite issuances of government dated securities and participate in primary auctions. They are also mandated to achieve a minimum success ratio (bids accepted as a proportion to bidding commitment) of 40 per cent in primary auctions of T-bills and Cash Management Bills (CMBs), assessed on a half-yearly basis. In 2019-20, achievement of all PDs was in excess of their minimum bidding commitments by subscribing to 71.7 per cent of the total quantum of T-Bills / CMBs issued during the year, marginally higher than 71.4 per cent achieved in the previous year. PDs’ share of allotment in the primary issuance of dated securities reduced to 48.0 per cent in 2019-20, marginally lower than 50.6 per cent in the previous year (Table VI.20). In H1:2020-21, PDs’ achieved a share of 68.05 per cent in total issuance of T-Bills and CMBs. During H1:2020-21, against total issuance of dated Government securities of ₹7,66,000 crore, allotment to PDs stood at 52.4 per cent as against 44.8 per cent during H1: 2019-20. 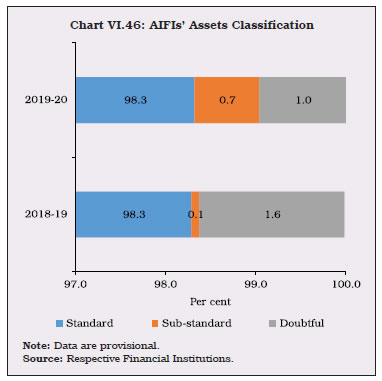 VI. 79 Partial devolvement on PDs took place on two instances, amounting to ₹3,606 crore during 2019-20 as against seven instances for ₹14,600 crore in 2018-19. The underwriting commission paid to PDs during 2019-20 was considerably lower at ₹41.0 crore than ₹139.9 crore in the previous year. The decreased underwriting commission can be attributed to Reserve Banks’s operations to ensure sufficient liquidity in the economy and to smoothen volatility, thus resulting in lower devolvement risk for PDs during the year. As a result, the average rate of underwriting commission fell from ₹2.45 paise/₹100 in 2018-19 to ₹0.58 paise/₹100 in 2019-20 (Chart VI.47). There were four instances of devolvement during H1:2020-21 aggregating to ₹58,455 crore. The underwriting commission paid to the PDs during the half year amounted to ₹116.41 crore, which works out to 1.67p/₹100. | Table VI.20: Performance of PDs in the Primary Market | | (₹ crore) | | Items | 2018-19 | 2019-20 | 2020-21 H1 | | 1 | 2 | 3 | 4 | | Treasury Bills and CMBs | | | | | (a) Bidding commitment | 9,99,551 | 13,83,666 | 12,05,743 | | (b) Actual bids submitted | 37,32,398 | 41,92,322 | 34,05,613 | | (c) Bid to cover ratio | 3.7 | 3.0 | 2.8 | | (d) Bids accepted | 6,70,849 | 8,51,816 | 7,03,521 | | (e) Success ratio (d) / (a) (in Per cent) | 67.1 | 61.6 | 58.3 | | Central Government Dated Securities | | | | | (f) Notified amount | 5,71,000 | 7,10,000 | 7,66,000 | | (g) Actual bids submitted | 12,60,201 | 15,31,570 | 13,97,830 | | (h) Bid to cover ratio | 2.2 | 2.2 | 1.8 | | (i) Bids of PDs accepted | 2,88,748 | 3,40,610 | 4,01,701 | | (j) Share of PDs (i)/(f) (in per cent) | 50.6 | 48.0 | 52.4 | | Source: Returns filed by PDs. | VI. 80 In the secondary market, all PDs individually achieved the required minimum annual total turnover ratio. The minimum turnover targets through outright transactions for dated G-secs is set at 5 times the average month-end stock of securities held by PDs. Similarly, the minimum ratio to be achieved through outright transactions exclusively is 3 times for T-bills. The overall turnover target, which include repo transactions, is set at 10 and 6 times of the average month-end stock for dated G-secs and T-bills respectively. 4.2 Performance of Standalone PDs VI. 81 In the secondary market outright segment, the quantum of turnover of standalone primary dealers (SPDs) increased in comparison with the previous year. Due to comparatively higher growth overall market turnover (42 per cent) vis-à-vis SPDs’ turnover (32 per cent), a decrease was observed in the share of SPDs in the total market turnover during 2019-20. In the repo segment, the quantum and share of SPDs in total market turnover increased in comparison with the previous year. SPDs’ share in cumulative market turnover across both segments for 2019-20 was 37.7 per cent which increased due to the rise in the repo turnover. In H1:2020-21, the share of SPDs in the secondary market in the outright and repo segment was 23.7 per cent and 45.4 per cent respectively. Total market share across both segments was 38.0 per cent (Table VI.21). | Table VI.21: Performance of SPDs in the G-secs Secondary Market | | (₹ crore) | | Items | 2018-19 | 2019-20 | H1:2020-21 | | 1 | 2 | 3 | 4 | | Outright | | | | | Turnover of SPDs | 27,74,591 | 36,56,472 | 13,27,615 | | Market turnover | 93,55,007 | 1,33,08,365 | 56,13,228 | | Share of SPDs (Per cent) | 29.7 | 27 | 23.7 | | Repo | | | | | Turnover of SPDs | 47,57,405 | 69,29,624 | 49,71,439 | | Market turnover | 1,35,66,142 | 1,47,99,714 | 1,09,56,860 | | Share of SPDs (Per cent) | 35.1 | 47 | 45.4 | | Total (Outright + Repo) | | | | | Turnover of SPDs | 75,31,996 | 1,05,86,096 | 62,99,054 | | Market turnover | 2,29,21,149 | 2,81,08,079 | 1,65,70,088 | | Share of SPDs (Per cent) | 32.9 | 37.7 | 38 | Notes: 1. Total turnover for standalone PDs for outright and repo trades includes both sides quantity that is, buy+sell.
2. In case of repo, only 1st leg is considered for SPDs’ turnover.
3. Total market turnover includes standalone PDs turnover for both outright and repo volume.
Source: Clearing Corporation of India Limited. | 4.3 Sources and Application of SPDs’ Funds VI. 82 Funds mobilised by SPDs rose by 26.2 per cent on a year-on-year basis in 2019-20. Borrowings remained the major source of SPDs’ funding, accounting for 90.3 per cent of the total sources of funds. The quantum of secured and unsecured loans increased during this period in comparison with the previous year (Table VI.22). VI. 83 The largest share of investments of SPDs are held in the form of current assets, which also increased by 27.8 per cent on a year-on-year basis (Table VI.22). | Table VI.22: Sources and Applications of SPDs’ Funds | | (₹ crore) | | Items | 2018-19 | 2019-20 | H1: 2020-21 | Percentage variation 2019-20 over 2018-19 | | 1 | 2 | 3 | 4 | 5 | | Sources of Funds | 55,133 | 69,573 | 80,591 | 26.2 | | 1. Capital | 1,609 | 1,609 | 1,849 | 0.0 | | 2. Reserves and surplus | 4,052 | 5,154 | 6,569 | 27.2 | | 3. Loans (a+b) | 49,472 | 62,810 | 72,173 | 27.0 | | (a) Secured | 38,696 | 49,181 | 60,261 | 27.1 | | (b) Unsecured | 10,776 | 13,629 | 11,912 | 26.5 | | Application of Funds | 55,133 | 69,573 | 80,591 | 26.2 | | 1. Fixed assets | 30 | 44 | 46 | 42.7 | | 2. HTM investments (a+b) | 454 | 493 | 144 | 8.6 | | (a) Government securities | 447 | 358 | - | -19.9 | | (b) Others | 7 | 135 | 144 | 1765.2 | | 3. Current assets | 55,608 | 71,074 | 81,120 | 27.8 | | 4. Loans and advances | 640 | 809 | 2,450 | 26.5 | | 5. Current liabilities | 1,601 | 2,847 | 3,254 | 77.8 | | 6. Deferred tax | 7.5 | 1 | 90.1 | -86.7 | | 7. Others | -5.6 | -1 | -5.6 | -85.6 | | Source: Returns submitted by PDs | 4.4 Financial Performance of SPDs VI. 84 A substantial increase was observed in SPDs’ profit after tax in 2019-20 in comparison with 2018-19 (Appendix Table VI.7). Interest and discount income rose due to increased holdings of treasury bills and government securities. Trading profits also witnessed a substantial increase due to lower volatility and the benign interest rate scenario during the period. Overall, income outpaced expenditure, resulting in higher profits for SPDs during 2019-20. During H1: 2020-21, PAT increased significantly compared to corresponding period of previous years due to increase in trading profits (Table VI.23). VI. 85 Commensurate with the enhanced increase in PAT, SPDs’ returns on net worth also increased in 2019-20. The cost to income ratio decreased during 2019-20 in comparison with the previous year on account of increased interest and discount income as well as trading profits, and expenditure remaining at similar levels. During H1: 2020-21 cost to income ratio of SPDs decreased further vis-à-vis corresponding periods of previous year on account of favourable market conditions (Table VI.24). | Table VI.23: Financial Performance of SPDs | | (₹ crore) | | Items | 2018-19 | 2019-20 | H1: 2020-21 | Variation 2019-20 over 2018-19 | | Amount | Per cent | | 1 | 2 | 3 | 4 | 5 | 6 | | A. Income (i to iii) | 3,518 | 5,367 | 3,412 | 1,849 | 52.6 | | (i) Interest and discount | 3,799 | 4,628 | 2,333 | 829 | 21.8 | | (ii) Trading profits | -344 | 682 | 1,082 | 1,026 | 298.3 | | (iii) Other income | 63 | 57 | -3 | -6 | -9.5 | | B. Expenses (i to ii) | 3,402 | 3,663 | 1,347 | 261 | 7.7 | | (i) Interest | 3,038 | 3,209 | 1,186 | 171 | 5.6 | | (ii) Other expenses including establishment and administrative costs | 363 | 454 | 161 | 91 | 25.1 | | C. Profit before tax | 444 | 1,687 | 1,673 | 1,243 | 280 | | D. Profit after tax | 304 | 1,276 | 1,240 | 972 | 319.7 | Note: Figures may not add up due to rounding-off.
Source: Returns submitted by PDs. | VI. 86 The combined CRAR for all SPDs increased marginally in 2019-20 and remained above the mandated 15 per cent. The capital buffers of the SPDs improved substantially during the year (Appendix Table VI.8). In H1: 2020-21, CRAR for all SPDs improved further (Chart VI.48).
| Table VI.24: SPDs’ Financial Indicators | | (₹ crore) | | Indicators | 2018-19 | 2019-20 | H1: 2020-21 | | 1 | 2 | 3 | 4 | | (i) Net profit | 304 | 1276 | 1240 | | (ii) Average assets | 54,487 | 69,631 | 80,855 | | (iii) Return on average assets (Per cent) | 0.56 | 1.87 | 1.52 | | (iv) Return on net worth (Per cent) | 5.8 | 21.31 | 16.67 | | (v) Cost to income ratio (Per cent) | 75.7 | 21.05 | 7.24 | | Source: Returns submitted by PDs | 5. Overall Assessment VI.87 Growth in NBFCs’ balance sheets decelerated considerably in 2019-20; however, NBFCs remained well capitalised with resilient asset quality vis-à-vis that of SCBs. In H1:2020-21, green shoots were visible as loans and advances rebounded. Challenges faced by the sector were exacerbated by the COVID-19 pandemic, causing funding constraints and triggering asset-quality concerns. The Reserve Bank and the Government undertook various liquidity and regulatory measures to augment liquidity and restore market confidence. VI.88 Due to loan moratoria and asset classification standstill, asset quality shored up. However, many NBFCs have made additional provisioning as per expected credit loss (ECL) norm; and bolstered their capital position by ploughing back dividends. Going forward, profitability of NBFCs may be dampened due to loan impairment, lower credit demand and a tendency to preserve cash. Though economic activity is expected to remain muted in FY 2020-21, strong NBFCs maintain a ‘cautiously optimistic’ view and are expected to perform well as many have reported strong revival, almost to pre-COVID levels, in disbursements and collections. The Reserve Bank, on its part, remains steadfast and resolute in maintaining the sector’s long-term resilience and preserving financial stability.
|