Press Release RBI Working Paper Series No. 01 Pricing of Interdealer OTC Derivatives in a Limit Order Market Vidya Kamate and Abhishek Kumar@ Abstract 1Using regulatory interdealer trade-level data on Overnight Indexed Swaps (OIS) in India, the paper examines the trading behaviour and prices in an interdealer market populated by traders of varying liquidity needs. Inactive investors, proxied by traders’ lower level of trading volume in the previous quarter, received a lower return relative to active investors when trading outside a Central Limit Order Book (CLOB) venue market but received relatively better returns on it. This differential return could be attributed to the differing levels of speed preference across investors with active investors being the most impatient or needing the quickest execution. Consistent with extant theoretical literature on speed frictions, active investors preferred trading on CLOB (faster venues). Inactive traders submitted limit orders and faced slower execution whereas active traders submitted market orders and received quicker execution on CLOB. The findings allude to the greater role played by liquidity requirements in a CLOB as opposed to other non-CLOB OTC markets where search and bargaining frictions dominate. JEL Classification: G13, G14, G15 Keywords: Overnight indexed swaps, OTC derivatives, limit order book, active investors, market order Introduction The size of global derivatives market stands at $598 trillion based on notional outstanding as on December 20212. A better understanding of these markets is essential for policymakers and market participants as these markets are large, opaque, complex and fragmented resulting in significant price heterogeneity. Consequently, these markets have been a focus of major post-crisis regulatory reforms including the 2009 Group of Twenty (G20) leaders’ agreement to reform and strengthen the global financial system. Dealers play a central role in price formation and liquidity provision in these markets, supplying liquidity to clients in Dealer-to-Client (D2C) segment and trading among themselves in Dealer-to-Dealer (D2D) or interdealer segment. While significant recent research has focused on understanding frictions that drive the price heterogeneity in D2C segment e.g., search and bargaining (Duffie et al., 2005, Hau et al., 2019), network centrality (Li and Schürhoff, 2019), inventory holding costs (Colliard et al., 2021) and informational rents (Bolton et al., 2016), the trading in D2D segment has been assumed to be low cost and frictionless (Duffie et al., 2005; Cenedese et al., 2020). Using interdealer trade-level data on Interest Rate Swaps (IRS) in India, we analyse the factors that determine pricing in interdealer Over-the-Counter (OTC) derivatives market. By classifying investors into active and inactive categories based on their trading volume in the previous quarter, we examine whether differential liquidity needs or levels of impatience across investors has an impact on their trading behaviour and quality of trade execution. In the setting of a dynamic limit order market populated by traders of varying level of impatience, Foucault et al. (2005) highlight the impact of this non-informational friction on market quality and resilience. In this spirit, we aim to provide evidence of an important and hitherto unexplored friction viz., differential impatience or need for execution speed that can determine pricing in D2D derivatives market. We find that inactive investors received lower returns as compared to active investors when trading outside of a central limit order book (CLOB)3 venue but received systematically better returns while trading through it. In other words, traders’ differential liquidity needs affect trading prices, but magnitude and direction of this pricing impact depends on the trading venue. By highlighting the traders’ impatience channel, our paper contributes to the limited literature analysing frictions in the D2D markets4. To suitably assess the contribution of this paper, it becomes important to place in context the way electronification of OTC trading is progressing. There have emerged a variety of venues featuring a diverse set of execution protocols – CLOBs, Request-for-Quotes (RFQs), Request-for-Stream (RFS) etc. OTC derivatives are also increasingly being traded on electronic venues albeit primarily of the nature of RFQ/ RFS etc. The non-standardised nature of such instruments may limit the feasibility of a CLOB dealing mode. The market for OTC derivatives, like other OTC markets, is characterised by a two-tier market structure – D2D and D2C segments. In some cases, the D2D segment, which is primarily a market for risk management, may trade standardised instruments, thereby, supporting a CLOB venue. In such a D2D setting, a CLOB platform was introduced in the Indian IRS market in 2015 which has rapidly become the dominant venue. We also analyse the effects of investor impatience on the choice of trading venue and find that active investors have a larger probability of trading on the CLOB venue as compared to inactive investors5. Despite receiving poorer returns as compared to inactive investors, active investors prefer to trade on the CLOB venue due to the accrual of speed-sensitive gains from trades through faster venues. In CLOB, the general understanding is that participants carry their trades by submitting either limit orders or market orders. Limit orders are stored in a limit order book, waiting for future execution (“Limit Day Orders”). Their execution is triggered by incoming market orders, which are matched with the best offers in the book (Foucault, 1999). Probably to avoid the risk of being “picked off”, a variant of limit order, the Immediate-or-Cancel (IOC) limit order is executed immediately while cancelling any unfilled portion. We observe that on the OIS CLOB venue, orders are placed only as limit orders, with limit day order and limit IOC orders each accounting for about half of the total trades. Thus, execution generally happens when a limit day order is matched with either a new limit day order or an IOC order. This indicates that participants exhibit the tendency to use market orders with limit-IOC order options. In the rest of this paper, market orders, thus, refer to limit-IOC orders. OIS return, calculated as the order rate paid/received by the counterparty over the prevailing OIS prices, for trades confirms the theoretically-held view that limit orders are executed at better prices than market orders (in this case, the IOC orders). We also study how dealers’ impatience affects order placement strategies and time taken for execution in limit order trading. In agreement with empirical predictions of Foucault et al. (2005), we find that more active investors have a larger probability of trading via market orders as opposed to limit orders. Dealers bear waiting costs that are directly proportional to the time elapsed between order placement and transaction completion. Therefore, they face a trade-off between execution price and the time taken for execution. As a result, impatient investors prefer to place market orders over limit orders6. Relatedly, we also find that the time taken for execution for limit orders placed by active investors is significantly lower than that of the inactive investors highlighting the preference for speed among more active investors. The rest of the paper is organised as follows. Section II provides an overview of literature, followed by important research questions and testable hypotheses in Section III. Sections IV and V provide important institutional details of OIS market in India, and details of the data used in the paper, respectively. Section VI discusses the main empirical findings of the paper followed by additional robustness tests in Section VII. Section VIII provides the concluding observations. II. Literature Review Our paper, as noted earlier, contributes to the literature on interdealer trading venue choice and directly relates to the literature that analyses the role of speed-related advantages in investors’ choice of the trading venue (Pagnotta and Philippon, 2018; and Foucault et al., 2016). Another strand of literature analyses the effect of transparency and anonymity and predicts that anonymous trading platforms will invite more informed trades (Röell, 1990; Fishman and Longstaff, 1992, Forster and George, 1992). The empirical evidence on the role of transparency and anonymity in venue choice has been mixed (Barclay et al., 2003; and Reiss and Werner, 2005). Much of the literature has focused on the investors’ choice of trading on an OTC vis-à-vis an exchange market. Lee and Wang (2018), Glode and Opp (2020) and Holden et al. (2021) developed a model of adverse selection to explain the prevalence of OTC trading in the presence of exchanges. The data on Indian OIS interdealer market shows that almost all of the interdealer trades moved to the CLOB trading system after its introduction indicating potentially lower role of informational frictions perhaps due to the institutional nature of the market where a majority of the participants are sophisticated investors. Our results also relate to the large body of literature on limit order books and investors’ order placement strategies. The theoretical static models of optimal bidding strategies are typically based on asymmetric information (Glosten, 1994; Chakravarty and Holden, 1995; Handa and Schwartz, 1996; Rock, 1996; and Seppi, 1997). Among the dynamic models, the results in our paper are closest to the predictions generated by Foucault et al. (2005) and Roşu (2009) that assume the lack of asymmetric information across traders and waiting costs as the main frictions determining the choice between limit and market orders. Our study contributes to the scant but growing literature related to understanding the microstructure of interest rate derivatives markets. Cenedese et al. (2020) uses European Trade Repository (TR) data to highlight the role of counterparty credit risk in OTC derivative pricing. Benos et al. (2020) analysed the role of centralised trading in determining market quality and liquidity in EUR swap markets. Given the data availability restrictions, there is very limited research on price heterogeneity in IRS markets across the globe. The IRS markets in India provide an ideal setup to analyse the interdealer liquidity frictions due to the following reasons. First, derivatives trading on a limit order book market is a unique feature of the Indian market. Generally, derivatives in most markets are traded through RFQ platforms, if traded electronically at all. Globally, the market infrastructure has evolved in a manner wherein provisioning of trading and clearing services are segregated and identifying the trade counterparty is a necessity for which RFQ venues are more suited. In India, however, a tight integration between trading, clearing and settlement services has provided the necessary conditions for provisioning certain services, such as anonymous CLOB venue. Second, almost all IRS contracts in India (whether executed on OTC non CLOB or CLOB system) are settled via a CCP which eliminates the counterparty risk friction in pricing7. Third, informational frictions are less likely to prevail in OIS markets since investors in OIS D2D markets are a relatively small homogenous group of fairly sophisticated agents and all the public information relevant for trading gains in OIS markets arrives at a pre-determined time and uniformly across all agents. Therefore, there is limited scope for trading based on private information signals. III. Testable Hypotheses and Research Questions In this section, we highlight the main hypotheses about the trading behaviour and prices in interdealer OIS market. The first hypothesis is derived from the theoretical literature on frictions driving pricing differentials in derivatives market. Most of the extant literature assumes frictionless trading in the D2D segment (Duffie et al., 2005) and focuses its attention on search, bargaining and/or informational frictions in the D2C segment. Given this, it becomes pertinent to analyse whether these frictions also play a role in the D2D segment of OIS markets, or the trading remains frictionless. Hypothesis 1: Trading in D2D OIS market is not frictionless. In other words, there are systematic differences in trading execution and prices between certain groups of investors (active vs. inactive dealers). A large majority of derivatives, the world over, are OTCs that are voice-traded bilaterally. Recently, hybrid mechanisms such as RFQ platforms that allow investors to solicit quotes from multiple dealers simultaneously have begun to be used more widely. In addition, very few markets like India, have introduced limit order book trading in D2D OIS market. While OTC markets, due to their non-anonymous nature are characterised by search and bargaining frictions (Li and Schürhoff, 2019; and Hau et al., 2021), exchange markets are predominated by speed and informational frictions. Therefore, a related question that arises is whether the frictions that drive differential pricing in D2D OIS market, outside of CLOB venue, differ from those that drive pricing on the CLOB venue? In other words, do price differentials between active and inactive investors depend on the trading venue? This leads us to the following hypothesis. Hypothesis 2: Pricing differential between active and inactive investors depends on the trading venue. The structure of securities trading has transformed dramatically in the past few decades with newer venues leading to fragmentation of trading in many markets. In addition, rapid technological developments have resulted in increased trading speeds across many instruments, particularly in standardised derivative markets. However, a significant portion of trading still relies on human inputs. As a result, there is significant heterogeneity in trading across venues and markets. Extant literature (Pagnotta and Philippon, 2018) has highlighted fragmentation based on technological improvements and trading speed with faster venues attracting speed-sensitive investors resulting in the following testable hypothesis. Hypothesis 3: Active investors prefer trading on a faster venue. Traders value order execution speed differently. Traders are likely to choose different order placement strategies depending on their level of impatience (Foucault et al., 2005) and hence, their speed preference. Any continuous limit order trading system comprises limit and market orders. While market orders guarantee immediate execution at the best available price, limit orders ensure a desired price (or better) but do not guarantee execution. Therefore, traders face a trade-off between waiting costs and speed premium charges which leads to the following hypothesis. Hypothesis 4: Inactive traders are more likely to post limit orders and active traders are more likely to post market orders. Given the speed preference of active investors, it is probable that out of the total limit orders placed by all investors, the time for execution of limit orders placed by active investors is lower than that of the inactive investors. Since the costs of waiting are larger for active investors, they are more likely to place limit orders with relaxed limits so that order execution gets a priority over execution price. Therefore, the following hypothesis arises as a natural corollary. Corollary to Hypothesis 4: The time taken for execution of limit orders posted by inactive traders is likely to be higher than the one posted by active traders. IV. Institutional Details of the Indian OIS Market Interest Rate Derivatives (IRDs) have been permitted in India since 1999. They are traded both on OTC, in the form of Interest Rate Swaps (IRS), Forward Rate Agreements (FRAs), swaptions etc., and on exchanges, primarily as Interest Rate Futures (IRFs). The IRS are, by far, the dominant IRDs in India. The market is split into three segments: market-maker only, interdealer or D2D segment, and market where clients trade with dealers, i.e., the D2C segment. The D2D segment is about three to four times larger than the D2C segment (in terms of amount outstanding) with major participation from foreign banks and primary dealers (PDs), followed by private sector banks. The share of public sector banks, while increasing, remains relatively small. The most popular IRS in India, the MIBOR8 OIS is an instrument where the floating leg of the swap is linked to an overnight index, compounded daily over the payment period. The instrument is traded on expectations of the counterparties about the future path of interest rate. OIS contracts are also used as a hedging tool for investors in government securities. They allow financial institutions to manage various features of their debt portfolios, including portfolio duration. The open interest in MIBOR OIS has increased over the years (Chart 1). 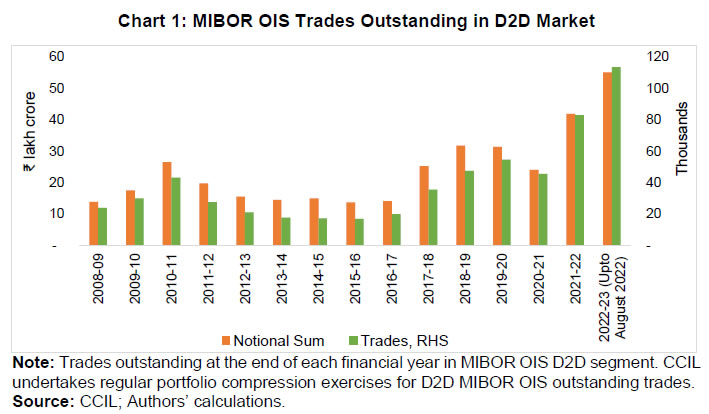 OTC derivatives are also increasingly being traded on electronic venues albeit primarily of the nature of RFQ/RFS etc. The non-standardised nature of such instruments may limit the feasibility of a CLOB dealing mode. Notwithstanding, in some cases the D2D segment, which is also a market for risk management for market makers, may trade standardised instruments, thereby, supporting a CLOB venue. In such a D2D setting, a CLOB platform was introduced in the Indian IRS market in 2015 which has rapidly become the dominant venue with a share of 65 per cent of overall market turnover in 2020. Trading volume, which was completely dominated by OTC non CLOB market in 2014 shifted significantly to the CLOB segment by 2021 (Chart 2). Clearing Corporation of India Limited maintains the Trade Repository (CCIL-TR), where all OTC derivative trades in the Indian market are reported. Most of the D2D trades are centrally cleared (Chart 3). 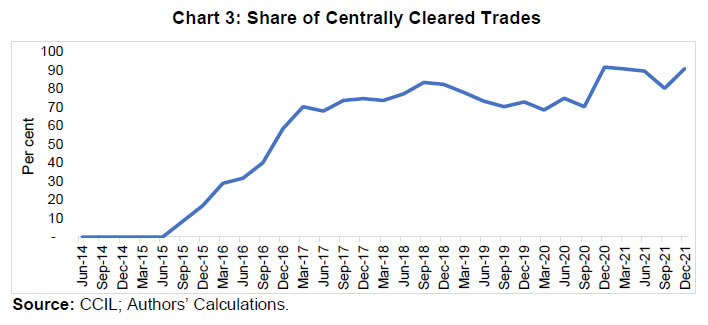 On OIS CLOB venue, the orders are placed only in the form of limit orders, with limit day order and limit IOC orders each accounting for about half of the total trades. Thus, execution generally happens when a limit day order is matched with either a new limit day order or an IOC order. While participants have the option of submitting a market order, the observations allude towards a tendency to replace market orders with IOC order option. OIS return, calculated as the order rate paid/received by the counterparty over the prevailing OIS prices, for trades confirms the theoretically held view that limit orders are executed at better prices than market orders (or in this case IOC orders). Relatively limited participant base (only institutional investors), execution in lot sizes and limited liquidity could be few factors on account of which participants may prefer to use limit IOC mode of dealing over placement of market orders. V. Data and Summary Statistics Transaction-level data for rupee-denominated MIBOR-OIS contracts was retrieved from CCIL-TR. Each transaction level data point provided information related to both counterparties (through name); trade date and time; contracted swap rate, settlement date, notional value of the contract and whether the trade was executed over CLOB or outside it. We supplement transaction information with order information for trades executed over CLOB. We study transactions contracted from April 1, 2014 to December 31, 2021, which captures the market transition to the CLOB. To remove any false or inaccurate reports we only keep trades with a fixed rate that is within 100 basis points (bps) from the benchmark (same maturity) end-of-day swap rate mid-quote from Bloomberg. In our sample, 54 dealers reported over three lakh transactions amongst themselves in the D2D segment. Summary statistics of important variables used in the analysis are presented in Table 1. A total of 315,128 combined trades were conducted in the D2D market over the sample period out of which roughly 41 per cent trades were conducted over the CLOB venue. Return to buyer, defined as the difference between the previous day closing benchmark rate and transaction level swap rate (fixed leg of the contract)9 is larger on the OTC non-CLOB segment as opposed to the CLOB segment. Return to seller is symmetric to the return to buyer variable and defined as the difference in bps between transaction level swap rate and previous day closing benchmark rate. The average trade size is roughly 1.4 times larger on the OTC non-CLOB segment at ₹ 89 crore as opposed to the CLOB segment (₹ 62 crore) with the standard deviation being twice that on the CLOB venue. | Table 1: Trade-Level Summary Statistics | | | p10 | p25 | p50 | p75 | p90 | Mean | Std. Dev | N | | Panel A: All Trades | | Return to Buyer | (4.25) | (2) | 0.25 | 2.25 | 5 | 0.3 | 4.5 | 315,128 | | Return to Seller | (5) | (2.25) | (0.25) | 2 | 4.25 | (0.3) | 4.5 | 315,128 | | Notional | 25 | 25 | 50 | 100 | 150 | 77.9 | 140.7 | 315,128 | | Tenor | 0.5 | 1.0 | 2.0 | 5.0 | 5.0 | 2.7 | 1.8 | 315,128 | | Panel B: Trades on OTC non CLOB | | Return to Buyer | (4.0) | (1.5) | 0.5 | 2.5 | 5.0 | 0.4 | 4.6 | 186,845 | | Return to Seller | (5.0) | (2.5) | (0.5) | 1.5 | 4.0 | (0.4) | 4.6 | 186,845 | | Notional | 25 | 25 | 50 | 100 | 200 | 89 | 172 | 186,845 | | Tenor | 0.5 | 1.0 | 2.0 | 5.0 | 5.0 | 2.7 | 1.8 | 186,845 | | Panel C: Trades on CLOB | | Return to Buyer | (4.5) | (2.0) | 0 | 2.0 | 4.5 | 0.1 | 4.3 | 128,283 | | Return to Seller | (4.5) | (2.0) | 0 | 2.0 | 4.5 | (0.1) | 4.3 | 128,283 | | Notional | 25 | 25 | 45 | 55 | 100 | 62 | 73 | 128,283 | | Tenor | 0.5 | 1.0 | 2.0 | 5.0 | 5.0 | 2.8 | 1.9 | 128,283 | Note: Panel A provides summary statistics for the full sample. Panel B and Panel C provide the summary statistics for trades executed on OTC non CLOB and CLOB, respectively. Return to Buyer (of interest rate protection) is defined as the difference in bps between the previous day closing benchmark rate and transaction level swap rate (fixed leg of the contract). Similarly, Return to Seller is defined as the difference in bps between transaction level swap rate and previous day closing benchmark rate. Notional refers to the notional value of the swap contract in INR. Tenor refers to the tenor of the swap contract in years. The numbers within brackets indicate negative values.
Source: CCIL; Authors’ calculations. | The average trade size over the years across both trading platforms is highlighted in Chart 4. As can be seen from the plot, the average trade size on the CLOB system picked up post-2015 after its widespread adoption by the dealer banks but average trade size for non-CLOB trades remained higher than CLOB for all the years. This is in line with findings in Holden et al. (2021) that indicate that OTC segment attracts larger trades due to the price discount the investors are able to achieve on account of greater bargaining power. We classify dealers into active or inactive groups based on their level of trading volume. A dealer is defined as active if she was in the top quartile of dealers based on gross notional value traded in the preceding calendar quarter of the trade date and inactive, otherwise. | Table 2: Summary Statistics for Active Vs. Inactive Dealers | | Variables | Active | Inactive | | All | Non CLOB | CLOB | All | Non CLOB | CLOB | | Buyer | | Total Number of Trades | 242,574 | 141,573 | 101,001 | 66,790 | 39,508 | 27,282 | | Average Trade Size (₹ crore) | 82 | 92 | 66 | 64 | 76 | 47 | | Average Return | 0.24 | 0.43 | (0.02) | 0.37 | 0.38 | 0.34 | | Difference in Average Return of Active vs. Inactive (t-stat) | (6.05) | 2.01 | (12.12) | | | | | Seller | | Total Number of Trades | 245,572 | 143,601 | 101,971 | 63,792 | 37,480 | 26,312 | | Average Trade Size (₹ crore) | 81 | 91 | 66 | 66 | 79 | 47 | | Average Return | (0.30) | (0.39) | (0.16) | (0.16) | (0.52) | 0.35 | | Difference in Average Return of Active vs. Inactive (t-stat) | (6.36) | 4.68 | (16.39) | | | | Note: Active dealers represent the top quartile of dealers based on gross notional value traded in the preceding calendar quarter of the trade date. The remaining dealers are classified as inactive. Return to Buyer (of interest rate protection) is defined as the difference in bps between the previous day closing benchmark rate and transaction level swap rate (fixed leg of the contract). Similarly, Return to Seller is defined as the difference in bps between transaction level swap rate and previous day closing benchmark rate. The numbers within brackets indicate negative values.
Source: CCIL; Authors’ calculations. | Table 2 highlights trade level summary statistics by active and inactive dealer group. As expected, active dealers engage in much larger number of trades, almost thrice the total number of trades than inactive dealers on CLOB venue as well as outside of it. The average trade size is significantly larger for active investors as compared to inactive ones across trading venues, alluding to them being larger and more sophisticated investors. Active investors receive higher average returns (0.43) than inactive investors (0.38) when trading outside of CLOB venue but receive lower average returns (-0.02) than inactive investors (0.34) when trading on them, highlighting the differential impact across trading venues for active and inactive dealers. We will explore this differential impact in greater detail in the subsequent section. VI. Empirical Results and Discussion As discussed earlier, the trading in D2D market may not be frictionless. The frictions affecting D2D pricing may be similar to or different from the ones governing prices in D2C segment. In line with Hypothesis 1, we test whether similar investor groups receive differential price execution for the same security on the same day. Research on corporate bond trading has highlighted execution quality differences between small and large trades, between frequently and infrequently traded issues, and also between different customer groups (e.g., Goldstein and Hotchkiss, 2007; Edwards et al., 2007 and Hendershott and Madhavan, 2015 among others). Differential prices have also arisen as a result of difference in investor sophistication in OTC FX markets (Hau et al., 2021). We run trade-level regressions of returns on contract, trade and dealer-specific characteristics. The results are reported in Table 3. The first two columns are for trades executed OTC, while columns (3) to (6) show trades executed on the CLOB venue. The results indicate that active investors receive systematically better returns as compared to inactive investors over OTC market with return to seller being systematically higher for active investors as compared to the inactive ones. The regressions control for notional value of the contract, tenor, date-specific and counterparty dealer-specific fixed effects. There is no need to control for credit ratings of counterparties as trades are cleared through a central counterparty (CCP). Active investors receive larger returns to the order of 0.575 basis points which is statistically significant. This result is consistent with the findings in O’Hara et al. (2018) who found that active insurance companies received better returns on OTC platforms as compared to inactive ones. In contrast, the results in columns (3) and (4) suggest that active dealers received lower returns over the CLOB venue as compared to inactive dealers. Dealers received systematically better returns when they placed limit orders as opposed to market orders. This is on expected lines given that limit orders, while not guaranteeing a fast or certain execution, provide a better control on the execution price received by the dealer. These specifications control for counterparty dealer fixed effects highlighting that the price differential between active and inactive investors is not being driven by certain dealer specific factors such as larger inventory costs etc. for a certain group of dealers. The regressions also control for date fixed effects to account for the impact of macroeconomic events, such as policy rate announcements that may influence the returns or volatility in the OIS market on any given day. In specifications (5) and (6), we introduce an interaction term between active investor dummy and market order dummy to check if active investors receive systematically different returns when they place market orders as compared to limit orders. We find that, while placing market orders results in poorer returns as compared to limit orders, active investors receive slightly better returns on market orders than inactive investors. We identify the underlying explanations for active investors receiving better returns relative to inactive investors in an OTC market but poorer returns in the CLOB market. Extant literature has suggested that due to the non-anonymised nature of OTC markets, search and bargaining frictions are likely to result in better returns for well-connected and sophisticated investors. O’Hara et al. (2018) found that active insurance companies received better returns in OTC US corporate bond market due to dealers’ bargaining power who discriminate against inactive or passive traders. This could be a potential explanation for active dealers receiving better terms-of-trade as compared to inactive dealers in the OIS market. This benefit of non-anonymity disappears in a CLOB market where the identities of trading parties are not known before a trade is executed. Next, we attempt to understand the causes of poorer returns to active investors, vis-à-vis inactive investors in the CLOB market. Foucault et al. (2005) modelled a limit order market with liquidity traders of varied impatience levels. They argued that traders value order execution speed differently with more impatient traders facing larger costs of waiting. Active investors demand liquidity from the market and are likely to be more impatient since their costs of waiting for trade execution are likely to be larger than inactive investors. This may cause them to receive poorer returns on the CLOB venue as greater speed of execution is likely to be preferred over improved execution costs. | Table 3: Regression Results of Active versus Inactive Investors’ Returns over Trading Venues | | Variables | OTC non-CLOB | CLOB | | (1) | (2) | (3) | (4) | (5) | (6) | | Return to Seller | Return to Buyer | Return to Seller | Return to Buyer | Return to Seller | Return to Buyer | | Active dealer dummy | 0.575** | -0.153 | -0.096 | -0.161* | -0.221* | -0.435*** | | (0.233) | (0.169) | (0.107) | (0.095) | (0.122) | (0.114) | | Limit order dummy | | | 0.442*** | 0.459*** | | | | | | (0.068) | (0.076) | | | | Market order dummy | | | | | -0.713*** | -0.999*** | | | | | | (0.130) | (0.153) | | Active dealer dummy x Market order dummy | | | | | 0.336** | 0.680*** | | | | | | (0.158) | (0.173) | | Log(tenor) | 0.109 | -0.190 | -0.320*** | 0.286** | -0.320*** | 0.285** | | (0.147) | (0.177) | (0.121) | (0.118) | (0.121) | (0.118) | | Trade size large x Log(notional) | 0.201 | -0.248 | -0.059 | 0.017 | -0.059 | 0.024 | | (0.685) | (0.719) | (0.064) | (0.067) | (0.064) | (0.067) | | Trade size med x Log(notional) | 0.180 | -0.231 | -0.051 | 0.010 | -0.050 | 0.017 | | (1.056) | (1.093) | (0.051) | (0.051) | (0.051) | (0.051) | | Trade size small x Log(notional) | 0.237 | -0.291 | 0.032 | -0.069 | 0.033 | -0.059 | | (1.278) | (1.314) | (0.062) | (0.064) | (0.062) | (0.064) | | Date FEs | Y | Y | Y | Y | Y | Y | | Counterparty Dealer FEs | Y | Y | Y | Y | Y | Y | | Observations | 181,262 | 181,262 | 128,283 | 128,283 | 128,283 | 128,283 | | Adjusted R2 | 0.122 | 0.122 | 0.343 | 0.344 | 0.343 | 0.344 | Note: Columns 1 to 2 report results of trades executed OTC non-CLOB and columns 3 to 6 report results of trades executed over the CLOB venue. Here and in subsequent tables, Return to Buyer (of interest rate protection) is defined as the difference in bps between the previous day closing benchmark rate and transaction level swap rate (fixed leg of the contract). Similarly, Return to Seller is defined as the difference in bps between transaction level swap rate and previous day closing benchmark rate. Active dealer dummy takes a value of one if the dealer of the trade was in the top quartile of dealers based on gross notional value traded in the preceding calendar quarter of the trade date and zero, otherwise. Limit order dummy takes a value of one if the trade order is a limit order and zero, otherwise. Market order dummy takes a value of one if the trade order is an immediate-or-cancel order and zero, otherwise. Log(tenor) refers to the natural logarithm of tenor of the swap contract in years. Log(notional) refers to the natural logarithm of the notional value of the swap contract in ₹ crore. Trade size large is a dummy variable that takes a value of one if the trade size is greater than ₹100 crore and zero otherwise. Trade size med is a dummy variable that takes a value of one if the trade size is greater than ₹25 crore and less than equal to ₹100 crore and zero otherwise. Trade size small is a dummy variable that takes a value of one if the trade size is lesser than or equal to ₹ 25 crore and zero otherwise. *, **, *** denote statistical significance at 10 per cent, 5 per cent, and 1 per cent levels, respectively. Standard errors clustered at the trade date level are reported in parentheses.
Source: CCIL; Authors’ calculations. | We have conjectured that active investors receive poorer returns on the CLOB venue due to their impatience or speed preference. Next, we test whether their trading behaviour and order placement strategies are consistent with this line of supposition. Extant theoretical literature on trading speed and fragmentation (Pagnotta and Philippon, 2018) suggests that faster venues attract speed-sensitive investors. This suggests that if active dealers are indeed impatient investors, then they should prefer to trade over faster venues i.e., CLOB venue over OTC non-CLOB market which brings us to the test of Hypothesis 3. We test whether active dealers are more likely to trade on the CLOB venue vis-à-vis OTC non-CLOB. Table 4 presents results of trade-level regressions where the dependent variable takes a value of one if the trade was conducted over the CLOB venue and zero, otherwise10. The main independent variable of interest is active dealer dummy, the coefficient of which is positive and statistically significant highlighting that active investors are more likely to trade on the CLOB trading system. This preference for trading over the CLOB venue of active dealers is consistent with their preference for speed of trade execution and faster venues. | Table 4: Regression Results of the Choice of Trading Venue for Dealers | | Variables | CLOB Venue Dummy | | (1) | (2) | | Sell Side | Buy Side | | Active dealer dummy | 0.010** | 0.010*** | | (0.004) | (0.004) | | Log(tenor) | -0.045*** | -0.039*** | | (0.003) | (0.003) | | Trade size large x Log(notional) | -0.064*** | -0.062*** | | (0.003) | (0.003) | | Trade size med x Log(notional) | -0.080*** | -0.077*** | | (0.004) | (0.004) | | Trade size small x Log(notional) | -0.080*** | -0.075*** | | (0.004) | (0.004) | | Date FEs | Y | Y | | Counterparty Dealer FEs | Y | Y | | Observations | 300,911 | 300,911 | | Adjusted R2 | 0.458 | 0.460 | Note: The table reports trade-level OLS regression results of CLOB Venue dummy on dealer and trade characteristics. Column (1) reports regression results from the perspective of the seller and column (2) reports regression results from the perspective of the buyer. The dependent variable takes the value one if a trade is executed over the CLOB and zero, otherwise. Other variables have the same meaning as described in Table 3. *, **, *** denote statistical significance at 10 per cent, 5 per cent, and 1 per cent levels, respectively. Standard errors clustered at the trade date level are reported in parentheses.
Source: CCIL; Authors’ calculations. | In addition to a preference for faster venues, extant theoretical literature on order placement strategies indicates that impatient investors prefer to place market orders over limit orders in an LOB setting. Market orders represent the demand for immediacy of execution whereas limit orders represent supply of immediacy to other dealers. A limit order is able to improve upon the cost of execution of an order at the expense of the speed of trading. In line with Hypothesis 4, if active investors represent impatient investors, then they should prefer to place market orders over limit orders. Table 5 presents results of trade-level regressions of the choice of limit versus market orders on dealer and trade characteristics. The dependent variable is a limit order dummy that takes a value of one if the executed trade is a limit order and zero, if it was a market order. The coefficient of active investor dummy is negative and statistically significant implying that consistent with their speed preference, active investors have a lower probability of placing a limit order vis-à-vis inactive investors. In other words, active investors prefer to trade via market orders on the LOB. Interestingly, larger trades have a higher probability of being placed via limit orders since the benefits of improved execution price with a limit order are likely to be higher with larger trade sizes. | Table 5: Regression Results of the Choice of Order Type of Trades on CLOB Venue | | Variables | Limit Order Dummy | | (1) | (2) | | Sell Side | Buy Side | | Active dealer dummy | -0.115*** | -0.089*** | | (0.007) | (0.006) | | Log(tenor) | -0.007* | 0.013*** | | (0.004) | (0.004) | | Trade size large x Log(notional) | 0.0001 | 0.027*** | | (0.005) | (0.005) | | Trade size med x Log(notional) | -0.003 | 0.016*** | | (0.006) | (0.005) | | Trade size small x Log(notional) | -0.006 | 0.011 | | (0.007) | (0.007) | | Date FEs | Y | Y | | Counterparty Dealer FEs | Y | Y | | Observations | 128,283 | 128,283 | | Adjusted R2 | 0.121 | 0.125 | Note: The table reports results of all trades executed over the CLOB venue. Column (1) reports OLS regression results from the perspective of the buyer dealer and column (2) reports OLS regression results from the perspective of seller dealer. The dependent variable takes the value one if a trade is a limit order trade and zero, otherwise. Other variables have the same meaning as described in Table 3. *, **, *** denote statistical significance at 10 per cent, 5 per cent, and 1 per cent levels, respectively. Standard errors clustered at the trade date level are reported in parentheses.
Source: CCIL; Authors’ calculations. | In line with the speed preference of active dealers, as a natural corollary to the order choice hypothesis, the time to trade execution should be lower for active investors. This should hold across all order types on the CLOB venue. Table 6 presents average time taken for execution in seconds for active and inactive dealers by order type. We can clearly see that average time taken for execution for active dealers is lower than inactive dealers and the difference in execution time is larger for limit order trades with time taken for execution for inactive dealers almost 1.5 times that of active dealers. This may happen on account of wider limits set by active dealers as compared to inactive ones, to ensure improved trade execution probability. | Table 6: Time to Execution for by Order Type | | Execution Time (in seconds) | Limit Order | Market Order | | Sell Side | | Active Investors | 1,760 | 0.1 | | Inactive Investors | 2,474 | 0.3 | | Buy Side | | Active Investors | 1,523 | 0.5 | | Inactive Investors | 2,295 | 0.0 | | Source: CCIL; Authors’ calculations. | Table 7 reports results of regressions of time taken for trade execution on CLOB trading system as a function of dealer and trade characteristics. Sample in Columns (1) and (2) covers all trades executed on the CLOB venue whether they are limit orders or market orders. Results show that active investors receive a quicker execution by about 0.11 seconds on the selling side and about 0.08 seconds on the buying side as compared to inactive investors. The difference in trade execution time is primarily driven by limit order trades where active dealers receive significantly quicker execution vis-à-vis inactive dealers. There is no significant difference in execution time across active and inactive dealers for market order trades. This result could be a result of wider price bands set by active investors on limit orders ensuring a preference of speed over price. | Table 7: Regression Results of Time to Execution of Trades over CLOB Venue | | Variables | All CLOB Trades | Market Order Trades | Limit Order Trades | | Sell Side | Buy Side | Sell Side | Buy Side | Sell Side | Buy Side | | (1) | (2) | (3) | (4) | (5) | (6) | | Active dealer dummy | -0.113*** | -0.084*** | -0.0002 | 0.001 | -0.007** | -0.002 | | (0.006) | (0.006) | (0.001) | (0.001) | (0.004) | (0.004) | | Log(tenor) | -0.006 | 0.015*** | 0.0001 | 0.0004 | 0.002 | 0.005** | | (0.004) | (0.004) | (0.001) | (0.001) | (0.002) | (0.003) | | Trade size large x Log(notional) | -0.008 | 0.015*** | 0.0003 | 0.002* | -0.010*** | -0.013*** | | (0.005) | (0.005) | (0.001) | (0.001) | (0.003) | (0.003) | | Trade size med x Log(notional) | -0.007 | 0.009 | 0.001 | 0.002* | -0.005* | -0.009*** | | (0.006) | (0.006) | (0.001) | (0.001) | (0.003) | (0.003) | | Trade size small x Log(notional) | -0.008 | 0.006 | 0.001 | 0.003** | -0.001 | -0.007* | | (0.007) | (0.007) | (0.001) | (0.001) | (0.004) | (0.004) | | Date FEs | Y | Y | Y | Y | Y | Y | | Counterparty Dealer FEs | Y | Y | Y | Y | Y | Y | | Observations | 128,283 | 128,283 | 55,697 | 56,664 | 72,581 | 71,613 | | Adjusted R2 | 0.131 | 0.132 | 0.009 | 0.010 | 0.127 | 0.114 | Note: Columns 1 to 2 report results for all trades executed over the CLOB venue, with columns 3 and 4 covering only market/IOCC order trades and columns 5 and 6 covering only limit order trades. Other variables have the same meaning as described in Table 3. *, **, *** denote statistical significance at 10 per cent, 5 per cent, and 1 per cent levels, respectively. Standard errors clustered at the trade date level are reported in parentheses.
Source: CCIL; Authors’ calculations. | VII. Robustness Checks VII.1. Alternative Definition of Active and Inactive Dealers based on Number of Trades The analysis of differential returns across active and inactive dealers relies on the definition of activity based on the ranking of dealers according to the trading volume in the past quarter. We check whether the results are robust across different definitions of active vs inactive dealers. We, alternatively, define active dealers as those that belong to the top quartile of dealers based on total number of executed trades in the preceding calendar quarter. Using this alternative definition, we replicate the regression results of Table 3 and report them in Table 8 below. The results are quantitatively similar to the results obtained in Table 3 i.e., active dealers received systematically better returns as compared to inactive dealers over OTC non-CLOB market with return to buyer being systematically higher for active investors as compared to the inactive ones and that active dealers received lower returns over the CLOB trading system as compared to inactive dealers. Dealers received systematically better returns when they placed limit orders as opposed to market orders. Specifications (5) and (6) highlight that while placing market orders results in poorer returns as compared to limit orders, active investors received slightly better returns than inactive investors on market orders. | Table 8: Regression Results of Active versus Inactive Investors’ Returns over Trading Venues | | Variables | OTC (non CLOB) | CLOB | | (1) | (2) | (3) | (4) | (5) | (6) | | Return to Seller | Return to Buyer | Return to Seller | Return to Buyer | Return to Seller | Return to Buyer | | Active dealer dummy | 0.501** | -0.210 | -0.055 | -0.140 | -0.187 | -0.418*** | | (0.236) | (0.164) | (0.118) | (0.098) | (0.129) | (0.118) | | Limit order dummy | | | 0.446*** | 0.462*** | | | | | | (0.068) | (0.075) | | | | Market order dummy | | | | | -0.733*** | -1.014*** | | | | | | (0.141) | (0.161) | | Log(tenor) | 0.104 | -0.192 | -0.320*** | 0.285** | -0.320*** | 0.284** | | (0.146) | (0.176) | (0.121) | (0.118) | (0.121) | (0.118) | | Active dealer dummy x Market order dummy | | | | | 0.352** | 0.685*** | | | | | | (0.170) | (0.180) | | Trade size large x Log(notional) | 0.200 | -0.248 | -0.062 | 0.013 | -0.063 | 0.017 | | (0.684) | (0.719) | (0.064) | (0.066) | (0.064) | (0.066) | | Trade size med x Log(notional) | 0.179 | -0.232 | -0.054 | 0.006 | -0.054 | 0.009 | | (1.056) | (1.093) | (0.052) | (0.051) | (0.052) | (0.051) | | Trade size small x Log(notional) | 0.237 | -0.292 | 0.029 | -0.073 | 0.028 | -0.069 | | (1.277) | (1.315) | (0.062) | (0.064) | (0.062) | (0.063) | | Date FEs | Y | Y | Y | Y | Y | Y | | Counterparty Dealer FEs | Y | Y | Y | Y | Y | Y | | Observations | 181,262 | 181,262 | 128,283 | 128,283 | 128,283 | 128,283 | | Adjusted R2 | 0.122 | 0.122 | 0.343 | 0.344 | 0.343 | 0.344 | Note: Columns 1 to 2 report results of trades executed OTC non-CLOB and columns 3 to 6 report results of trades executed over the CLOB venue. Other variables have the same meaning as described in Table 3. *, **, *** denote statistical significance at 10 per cent, 5 per cent, and 1 per cent levels, respectively. Standard errors clustered at the trade date level are reported in parentheses.
Source: CCIL; Authors’ calculations. | VII.2. Alternative Definition of Active and Inactive Dealers based on top decile of gross notional We, alternatively, define active dealers as those that belong to the top decile of dealers based on total gross notional value traded in the preceding calendar quarter of the trade date. We replicate the regression results of Table 3 using this alternative definition and report them in Table 9 below. The results are quantitatively similar to the results obtained in Table 3 i.e., active dealers received systematically better returns as compared to inactive dealers in the OTC market with returns to buyer being systematically higher for active investors as compared to the inactive ones and that active dealers received lower returns over the CLOB trading system as compared to inactive dealers. | Table 9: Regression Results of Active versus Inactive Investors’ Returns over Trading Venues | | Variables | OTC (non CLOB) | CLOB | | (1) | (2) | (3) | (4) | (5) | (6) | | Return to Seller | Return to Buyer | Return to Seller | Return to Buyer | Return to Seller | Return to Buyer | | Active dealer dummy | 0.661* | -0.539 | -0.123 | -0.103 | -0.184* | -0.339*** | | (0.359) | (0.404) | (0.080) | (0.066) | (0.105) | (0.076) | | Limit order dummy | | | 0.445*** | 0.468*** | | | | | | (0.068) | (0.073) | | | | Market order dummy | | | | | -0.521*** | -0.756*** | | | | | | (0.083) | (0.090) | | Active dealer dummy x Market order dummy | | | | | 0.141 | 0.525*** | | | | | | (0.135) | (0.114) | | Log(tenor) | 0.118 | -0.201 | -0.320*** | 0.284** | -0.319*** | 0.288** | | (0.150) | (0.183) | (0.121) | (0.118) | (0.121) | (0.118) | | Trade size large x Log(notional) | 0.195 | -0.230 | -0.053 | 0.017 | -0.054 | 0.025 | | (0.683) | (0.711) | (0.065) | (0.065) | (0.065) | (0.065) | | Trade size med x Log(notional) | 0.174 | -0.212 | -0.046 | 0.010 | -0.046 | 0.018 | | (1.055) | (1.084) | (0.052) | (0.050) | (0.052) | (0.050) | | Trade size small x Log(notional) | 0.224 | -0.270 | 0.038 | -0.068 | 0.036 | -0.062 | | (1.274) | (1.305) | (0.062) | (0.063) | (0.063) | (0.063) | | Date FEs | Y | Y | Y | Y | Y | Y | | Counterparty Dealer FEs | Y | Y | Y | Y | Y | Y | | Observations | 181,262 | 181,262 | 128,283 | 128,283 | 128,283 | 128,283 | | Adjusted R2 | 0.122 | 0.122 | 0.343 | 0.344 | 0.343 | 0.344 | Note: Columns 1 to 2 report results of trades executed OTC and columns 3 to 6 report results of trades executed over the CLOB venue. Other variables have the same meaning as described in Table 3. *, **, *** denote statistical significance at 10 per cent, 5 per cent, and 1 per cent levels, respectively. Standard errors clustered at the trade date level are reported in parentheses.
Source: CCIL; Authors’ calculations. | VIII. Conclusion Interdealer markets play a pivotal role in liquidity provision and price discovery in OTC derivatives. Veering away from the assumptions of early theoretical models on OTC market frictions, trading in interdealer markets is not frictionless, leading to asymmetric trade execution costs and price heterogeneity across agents and over time. As opposed to D2C markets, such trading frictions have been relatively understudied in D2D markets, in general, and OIS markets, in particular. Using novel and hitherto unused trade-level data on Indian interdealer OIS market, the paper provides empirical evidence of an important factor in interdealer markets, namely, the differential liquidity needs or levels of impatience of dealers. We find evidence of active dealers receiving better returns than inactive ones on OTC non CLOB markets and the opposite result holding true on a CLOB platform. Consistent with the speed friction channel, we find that active dealers have a higher probability of placing market orders as opposed to inactive dealers on limit order trading systems. Also, we find evidence of speed friction influencing venue choice of dealers, with active dealers more likely to trade on CLOB platform as opposed to inactive dealers. In addition to providing empirical evidence of the speed friction channel, this paper contributes to the debate around the benefits or costs associated with different trading mechanisms i.e., OTC non CLOB vis-à-vis CLOB. Unlike the recent evidence on interdealer FX market in other economies (Holden et al., 2021), we find that after introduction of CLOB mechanism, a large part of the trading moved away from the OTC non-CLOB market to the CLOB one. This result has the potential to inform policy on parallel introduction of suitable trading platforms in other OTC markets. The differential return to active investors on the CLOB mechanism alludes to the potential benefits for venues to offer vertically differentiated products.
References Barclay, M. J., Hendershott, T., & McCormick, D. T. (2003). Competition among trading venues: Information and trading on electronic communications networks. The Journal of Finance, 58(6), 2637-2665. Benos, E., Payne, R., & Vasios, M. (2020). Centralized trading, transparency, and interest rate swap market liquidity: Evidence from the implementation of the dodd–frank act. Journal of Financial and Quantitative Analysis, 55(1), 159-192. Bolton, P., Santos, T., & Scheinkman, J. A. (2016). Cream‐skimming in financial markets. The Journal of Finance, 71(2), 709-736. Cenedese, G., Ranaldo, A., & Vasios, M. (2020). OTC premia. Journal of Financial Economics, 136(1), 86-105. Chakravarty, S., & Holden, C. W. (1995). An integrated model of market and limit orders. Journal of Financial Intermediation, 4(3), 213-241. Colliard, J. E., Foucault, T., & Hoffmann, P. (2021). Inventory Management, Dealers' Connections, and Prices in Over‐the‐Counter Markets. The Journal of Finance, 76(5), 2199-2247. Duffie, D., Gârleanu, N., & Pedersen, L. H. (2005). Over‐the‐counter markets. Econometrica, 73(6), 1815-1847. Edwards, A. K., Harris, L. E., & Piwowar, M. S. (2007). Corporate bond market transaction costs and transparency. The Journal of Finance, 62(3), 1421-1451. Fishman, M. J., & Longstaff, F. A. (1992). Dual trading in futures markets. The Journal of Finance, 47(2), 643-671. Forster, M. M., & George, T. J. (1992). Anonymity in securities markets. Journal of Financial Intermediation, 2(2), 168-206. Foucault T. (1999). Order flow composition and trading costs in a dynamic limit order market. Journal of Financial Markets, 2(2), 99-134. Foucault, T., Kadan, O., & Kandel, E. (2005). Limit order book as a market for liquidity. The Review of Financial Studies, 18(4), 1171-1217. Foucault, T., Hombert, J., & Roşu, I. (2016). News trading and speed. The Journal of Finance, 71(1), 335-382. Glode, V., & Opp, C. C. (2020). Over-the-counter versus limit-order markets: The role of traders’ expertise. The Review of Financial Studies, 33(2), 866-915. Glosten, L. R. (1994). Is the electronic open limit order book inevitable? The Journal of Finance, 49(4), 1127-1161. Goldstein, M. A., Hotchkiss, E. S., & Sirri, E. R. (2007). Transparency and liquidity: A controlled experiment on corporate bonds. The Review of Financial Studies, 20(2), 235-273. Handa, P., & Schwartz, R. A. (1996). Limit order trading. The Journal of Finance, 51(5), 1835-1861. Hansch, O., Naik, N. Y., & Viswanathan, A. S. (1998). Do inventories matter in dealership markets? Evidence from the London Stock Exchange. The Journal of Finance, 53(5), 1623-1656. Hau, H., Hoffmann, P., Langfield, S., & Timmer, Y. (2021). Discriminatory pricing of over-the-counter derivatives. Management Science, 67(11), 6660-6677. Hendershott, T., & Madhavan, A. (2015). Click or call? Auction versus search in the over‐the‐counter market. The Journal of Finance, 70(1), 419-447. Holden, C. W., Lu, D., Lugovskyy, V., & Puzzello, D. (2021). What is the impact of introducing a parallel OTC market? theory and evidence from the chinese interbank fx market. Journal of Financial Economics, 140(1), 270-291. Lee, T., & Wang, C. (2018). Why trade over-the-counter? when investors want price discrimination. When Investors Want Price Discrimination (February 5, 2018). Jacobs Levy Equity Management Center for Quantitative Financial Research Paper. Li, D., & Schürhoff, N. (2019). Dealer networks. The Journal of Finance, 74(1), 91-144. Loon, Y. C., & Zhong, Z. K. (2016). Does Dodd-Frank affect OTC transaction costs and liquidity? Evidence from real-time CDS trade reports. Journal of Financial Economics, 119(3), 645-672. Keim, D. B., & Madhavan, A. (1995). Anatomy of the trading process empirical evidence on the behavior of institutional traders. Journal of Financial Economics, 37(3), 371-398. Neklyudov, A. (2019). Bid-ask spreads and the over-the-counter interdealer markets: Core and peripheral dealers. Review of Economic Dynamics, 33, 57-84. O’ Hara, M., Wang, Y., Zhou, X, (2018). The execution quality of corporate bonds. Journal of Financial Economics. 130 (2), 308-326. Paddrik, M. E., & Tompaidis, S. (2019). Market-Making Costs and Liquidity: Evidence from CDS Markets. SSRN Working Paper Pagnotta, E. S., & Philippon, T. (2018). Competing on speed. Econometrica, 86(3), 1067-1115. Reiss, P. C., & Werner, I. M. (1998). Does risk sharing motivate interdealer trading? The Journal of Finance, 53(5), 1657-1703. Reiss, P. C., & Werner, I. M. (2005). Anonymity, adverse selection, and the sorting of interdealer trades. The Review of Financial Studies, 18(2), 599-636. Rock, K. (1996). The specialist’s order book and price anomalies. The Review of Financial Studies, 9, 1-20. Röell, A. (1990). Dual-capacity trading and the quality of the market. Journal of Financial Intermediation, 1(2), 105-124. Roşu, I. (2009). A dynamic model of the limit order book. The Review of Financial Studies, 22(11), 4601-4641. Schultz, P. (2017). Inventory management by corporate bond dealers. Available at SSRN 2966919. Seppi, D. J. (1997). Liquidity provision with limit orders and a strategic specialist. The Review of Financial Studies, 10(1), 103-150. |