Pallavi Chavan* This paper analyses the coverage of small borrowers by Indian banks using data on credit portfolios of banks (supply side) and debt portfolios of borrowing households (demand side). The paper makes use of the data on bank credit under small borrowal accounts (SBAs) extracted from the annual Basic Statistical Returns of Scheduled Commercial Banks in India as well as the periodic SBA surveys conducted by the Reserve Bank of India (RBI). It also makes use of data on household debt portfolios from the All-India Debt and Investment Survey, Rural Labour Enquiry and unit-level data from the 66th Employment-Unemployment Survey of the National Sample Survey Organisation. Using these data, it analyses the changes in the flow of bank credit to some of the socially and economically vulnerable sections of the population that broadly represent small borrowers in India. The paper brings out that there have been certain favourable changes with regard to the coverage of small borrowers by the banking system since 2005. The major gainers during this period have been small women borrowers from rural areas, agricultural/rural labourers and small/marginal cultivators. However, there are signs of decline in the shares of small women borrowers from urban areas and of backward social groups in total bank credit during this period. The paper highlights the need to continue with the policy of financial inclusion for strengthening banking presence in rural areas but also to give attention to urban poor in light of the increase in urbanisation. JEL Classification : E51, O17, Q14, J16
Keywords : Bank Credit, Financial Inclusion, Small Borrowers, Vulnerable Groups, Women Introduction Since the nationalisation of banks, India has followed a supply-led approach to its banking policy to ensure adequate flow of credit to regions, sectors of the economy and sections of the population that had remained underserved by the banking system. The institution of the branch licensing policy, the priority sector lending policy and administered rates of interest in lending to priority sectors were a part of this broader approach, which is often described in the literature as the phase of social banking (Chakrabarty 2012; Copestake et al. 1984). With the initiation of economic reforms, there has been a distinct shift in the banking policy with a focus on improving the operating efficiency and profitability of the banking system, which was allegedly neglected during the phase of social banking.1 After 2005, however, there has been a renewed commitment to extending banking services to the underserved sections as part of the policy of ‘financial inclusion’. Officially, financial inclusion is defined as the ‘process of ensuring access to appropriate financial products and services needed by all sections of the society in general, and vulnerable groups, such as weaker sections and low income groups in particular, at an affordable cost in a fair and transparent manner by regulated, mainstream institutional players’ (Chakrabarty 2013). The RBI has encouraged banks to design and follow board-approved financial inclusion plans (FIPs) since 2010 with self-set targets (Chakrabarty 2011). More recently, in 2014, the central government introduced one of its largest flagship schemes to promote financial inclusion in a mission mode under the PM Jan-Dhan Yojana (PMJDY). The PMJDY aims to provide universal access to banking services (including savings deposits with a small overdraft, micro-health and accidental insurance and debit card facilities) to all households.2 Moreover, the targets set by banks under FIPs were converged with those to be achieved under PMJDY to provide a more focused thrust on financial inclusion (RBI 2014). Apart from schemes for financial inclusion, the central government also stepped up the supply of agricultural credit between 2004 and 2007 in a targeted manner as part of its ‘comprehensive credit policy’ (Ministry of Agriculture 2007). The specific aim of this scheme was to address concerns relating to agrarian distress reported from various parts of India since the early-2000s (GoI 2010a). Banking policy in India can, thus, be divided into three broad phases: The phase following bank nationalisation (1969 to 1991), phase of banking sector liberalisation (1991 to 2005) and finally, the phase of financial inclusion (2005 onwards). Each of these phases showed distinct trends with regard to lending to rural areas, under-banked geographical regions and agriculture. With regard to the phase after bank nationalisation, studies have shown a phenomenal expansion in banks’ branch networks especially in rural areas (RBI 2008). Consequently, this phase saw a decline in the proportionate share of informal sources in the supply of rural credit (RBI 2008). The expansion was also significant in the under-banked regions in the country (Shetty 2005). Further, this branch expansion resulted in increased institutional credit support to agriculture and allied activities. Consequently, this phase saw agricultural credit growing at a rate higher than the growth in agricultural GDP (GoI 2007). However, this does not imply that this phase resolved all concerns relating to rural and agricultural credit. Several nation-wide and independent village studies showed continued marginalisation of small farmers from the ambit of institutional finance even after bank nationalisation (Dreze et al. 1998; GoI 2007; Walker and Ryan 1990). Studies also noted the bureaucratisation of procedures leading to high transaction costs, which often discouraged the poor from approaching sources of institutional finance (Dreze 1990). The 1990s witnessed a reversal of some of the achievements of the earlier phase. In many ways, this outcome was expected in the short-term given the emphasis of the policy of financial liberalisation on creating a sound and competitive banking sector (RBI 2008). There was a contraction in branch networks in rural areas as loss-making branches were either closed or converted into satellite offices (Chavan 2005). There was also a slowdown in the growth of agricultural credit during this decade (Ramakumar and Chavan 2007). The number of agricultural loan accounts too posted a decline in this period (GoI 2010a). Further, this period also saw worsening of some of the inequities in the distribution of formal finance: The gap in the per-account availability of bank credit between small/marginal farmers and other farmers widened; and there was also a fall in the shares of the economically backward and under-banked regions in total bank credit (Chavan 2005; GoI 2007). Finally, the share of formal sources witnessed a fall in the 1990s leading to a commensurate increase in the share of informal sources, particularly moneylenders (RBI 2008; Subbarao 2012). The period after 2005 is again marked by a number of changes with regard to rural credit in general and agricultural credit in particular. There has been an increase in branch penetration in rural areas, particularly in under-banked regions (RBI 2013; Chavan 2016). The various instruments/channels used for financial inclusion, including basic savings bank deposit accounts, Kisan Credit Cards (KCCs) and self-help groups (SHGs) too have shown a rapid expansion in this period. There has been a revival in the growth of agricultural credit taking it to a double-digit level during this period (Ramakumar and Chavan 2014). Thus, the literature has detailed accounts of changes in the rural-urban, regional and sectoral distribution of bank credit. However, there is little discussion on the credit flow to small borrowers (including various socially and economically under-privileged sections) over this period, particularly since the 1990s, a gap that this paper intends to fill. This paper looks at the reach of banking with regard to select sections of the population which have small credit needs and which have, in fact, been at the centre of the policy of financial inclusion after 2005. The paper is divided into six sections. Section II discusses the concept of ‘small’ borrowers, which is central to the analysis in this paper. It also has a brief discussion on the secondary data sources available for analysing credit supply to these borrowers. Section III highlights the changes in banking policy since bank nationalisation that have specific and direct implications for lending to small borrowers. In Section IV, the paper brings out the trends of bank lending to small borrowers at the aggregate level and in Section V it uses a mix of indicators based on supply (banking) and demand (household) side data to bring out the coverage of select socially and economically under-privileged and mutually non-exclusive sections, including small and marginal cultivators, rural and agricultural labourers, backward social groups (scheduled castes or SCs/scheduled tribes or STs) and women. Based on existing data, the paper also analyses state-level differentials/similarities in lending to small borrowers. Section VI summarises the major concluding observations from the paper. Section II Small Borrowers: Conceptual, Methodological and Data Issues The term ‘small’ in ‘small borrowers’ is a relative one and is difficult to define precisely. As per the RBI, a ‘small borrowal account’ (SBA) is defined as an account having a credit limit of up to ₹200,000 (₹25,000 till 1998 and ₹10,000 till 1983). The holders of these accounts are individuals/entities who have relatively small credit/borrowal requirements. The RBI also provides disaggregated information on SBA holders by social groups and gender, that is, SCs/STs and women. Further, the RBI also classifies loans to ‘weaker sections’ as part of priority sector credit, which includes loans to various socially and economically underprivileged sections – small and marginal farmers, village artisans, backward social groups, individual women beneficiaries (present credit limit of ₹100,000) and persons belonging to minority communities as notified by the central government from time to time.3 As these weaker sections generally reflect individuals with small means, and consequently small credit needs, there is an overlap between these sections and the holders of SBAs, although the two may not exactly match. This paper provides an analysis of SBAs as well as of select segments of weaker sections depending on the availability of data. Data on small borrowers are scattered and can be obtained from assorted secondary data sources. Sources which have supply-side data or data on credit flow to small borrowers include: (a) Basic Statistical Returns of Scheduled Commercial Banks in India (BSR) published by the RBI on an annual basis since 1972. It provides data on credit and deposits of scheduled commercial banks (SCBs) (including regional rural banks) based on Basic Statistical Returns 1 (1A (for other accounts) and 1B (for Small Borrowal Accounts)) and 2. Till 1996, this publication provided only limited data on SBAs by occupation categories. However, from 1996 onwards, it also started providing data on SBAs by population groups of centres (rural, semi-urban, urban and metropolitan) and geographical regions.4 Further, from 2013 onwards, the separate reporting of SBAs as per 1B was discontinued and the Basic Statistical Return 1 was revised to capture information on both SBAs and other accounts in a combined manner. (b) Exclusive data on SBAs are also provided by the RBI through its Survey of Small Borrowal Accounts, a periodical sample survey of SBAs. The information on SBAs through this survey is available for select years: 1993, 1997, 2001, 2004, 2006 and 2008. This publication provides data on SBAs by population groups and occupation categories (as also captured through the regular BSR publication) as well as data by social groups and gender of borrowers. (c) Data on various categories of ‘weaker sections’ are provided through priority sector returns submitted by banks to the RBI.5 Data on weaker sections are also published annually through Statistical Tables Relating to Banks in India. Formal credit flows to under-privileged sections having small credit needs can also be gauged from debt profiles of small and marginal cultivators, agricultural labourers, socially backward groups and women/female-headed households. Publications which give demand-side or household-level data include: (a) The decennial All-India Debt and Investment Survey (AIDIS) provides estimates of indebtedness (and assets) of rural and urban households. The first survey in this series, the All-India Rural Credit Survey (AIRCS), was conducted by the RBI in 1951-52. It collected data on liabilities of rural households and also undertook an investigation of the formal and informal agencies of rural credit (RBI 1956). From 1971-72 onwards, it was called AIDIS and canvassed both rural and urban households and the responsibility of conducting the survey was handed over to the National Sample Survey Organisation (NSSO). After 1971-72, the AIDIS was conducted in 1981-82, 1991-92, 2002-03 and 2012-13. Separate information on debt profiles by social groups is available for the rounds of 1991-92 and 2002-03. For the AIDIS round of 2012-13, however, only basic aggregated information on the debt profiles of rural households has been made available so far by the NSSO without any further break up.6 (b) The five-yearly Rural Labour Enquiry (RLE) provides data on the debt profiles of rural (agricultural and non-agricultural) labour households and is published by the Labour Bureau. The first RLE was conducted in 1963-65; the subsequent years of the RLE were 1974-75, 1977-78, 1983, 1987-88, 1993-94, 1999-2000, 2004-05 and 2009-10. The RLE was integrated with NSSO’s employment and unemployment surveys since 1977-78 (GoI 2010b). This paper uses information from all these sources to analyse the reach of banking with regard to small borrowers in general, and various segments of under-privileged sections in particular. It also uses unit-level data from the 66th Employment-Unemployment Round (EUS) for 2009-10 to supplement the published data from RLE to bring out recent trends in debt profiles of rural and agricultural labour households. Given the diverse sources of data with differing timelines, this paper focuses primarily on the 1990s and 2000s; these two decades capture the initiation of financial sector reforms as well as the policy of financial inclusion. Given that there was a change in the definition of SBAs (with an increase in the cut off limit from ₹25,000 to ₹200,000) in 1999, the paper uses SBA data from 1999 onwards to maintain comparability. As the cut-off itself is expressed in nominal terms, there is a methodological issue in comparing SBAs across time given the changes in price levels. However, in the absence of account-level information on loan accounts, this approximation in the comparison of SBAs is inevitable. The paper uses the indicators of distribution of bank credit/debt owed to formal sources, in particular banks, to understand the inclusion of small borrowers by the banking system. The reach of bank credit depends not just on the ability and willingness of the banking system to lend to these sections but also the ability and willingness of the borrower to approach the banking system for credit. Conceptually, even if it is assumed that there is both ability and willingness of the banking system to lend, an individual may still remain outside the reach of the banking system because she is either unable or unwilling to borrow. This leads to involuntary or voluntary exclusion of a borrower from the banking system (RBI 2008). However, literature, particularly on developing economies, suggests that the line between voluntary and involuntary exclusion is thin. Among those who appear to be voluntarily excluded, the real reasons for exclusion could be because the products/services are unaffordable, not conducive to their requirements or there is hesitation of being declined by the banking system (Bebczuk 2007; Diagne et al. 2000). Hence, studies on inclusion use a combination of (a) primary surveys of potential borrowers about whether they feel credit constrained, and (b) an analysis of their participation in various credit programmes/coverage by credit institutions to determine their inclusion by the banking system. In the absence of a primary survey, the extent of participation/coverage of these segments by the banking system vis-à-vis other segments using secondary data is the other feasible option, which has been followed in this paper. Section III Lending to Small Borrowers: Select Policy Changes In India, four specific policies have had direct implications for lending to small borrowers: (a) priority sector lending norms; (b) introduction of micro-finance; (c) interest rate regulations; and (d) introduction of credit products/services for financial inclusion. III.1 Priority Sector Lending – Targets and Definitions The inclusion of small borrowers in the banking system was the objective of the policy of social banking adopted after the nationalisation of major banks in 1969. Based on the Informal Study Group on Statistics relating to advances to priority sectors constituted by the RBI in 1971, the list of priority sectors was formalised in 1972.7 Since 1974, the RBI also started specifying targets for priority sector lending. Banks were asked to raise their proportion of credit to priority sectors to 40 per cent by March 1985. Further, sub-targets were also laid down for lending to agriculture and allied activities and to ‘weaker sections’ within the total lending to priority sectors. The target for weaker sections has since been fixed at 10 per cent of bank credit for domestic banks.8 Originally, weaker sections included small and marginal farmers (having less than 5 acres of landholdings), landless labourers, beneficiaries under the Differential Rate of Interest (DRI) scheme, tenant farmers and backward social groups. However in the 2000s, particularly after 2005 following the emphasis on financial inclusion, a number of new sub-categories were added to the list of weaker sections. Individual women beneficiaries (with a present credit of ₹100,000), distressed farmers indebted to non-institutional lenders and beneficiaries under the Swarna Jayanti Shahari Rozgar Yojana (SJSRY) (restructured as the National Urban Livelihood Mission or NULM) and the Swarnjayanti Gram Swarozgar Yojana (SGSY) (restructured as the National Rural Livelihood Mission or NRLM) organised into SHGs were also added to the list of weaker sections.9 Further, the small overdraft facility offered as part of PMJDY was also included as part of credit to weaker sections by banks. Agricultural credit is another important component of priority sector credit that has implications for lending to small borrowers, mainly by way of lending to small and marginal cultivators. In 2004, the government introduced the comprehensive credit policy to give a boost to agricultural credit.10 More recently, in 2013 the RBI modified priority sector lending guidelines to include a separate sub-target of 8 per cent for small and marginal farmers as part of the overall target of 18 per cent for agricultural credit.11 III.2 Introduction of Micro-finance Micro-finance was introduced in 1992 to reach bank credit to the poor, particularly poor women, organised into SHGs with the intermediation of non-governmental and non-bank players. This was promoted under two major approaches: The Bank-SHG Linkage Programme and the Bank-MFI Linkage Model (RBI 2008). Under the first approach, SHGs were promoted by non-governmental organisations (NGOs) or by banks themselves and were funded by banks. Under the second approach, banks lent to micro-finance institutions (MFIs), including NBFCs registered with RBI, which on-lent to SHGs and joint liability groups (JLGs) (RBI 2008). In order to give a boost to micro-finance, bank credit to SHGs and MFIs has been included as part of priority sector lending since 2000 (RBI 2008). Initially, micro-finance channelled through both bank-SHG and bank-MFI linkage models was recognised as an important part of the policy on financial inclusion (Thorat 2006). However, the promotional approach, particularly towards the bank-MFI linkage model became somewhat restrictive after 2010 following reports about high interest rates and coercive recovery practices by some of the MFIs. Fresh guidelines were laid down for NBFCs registered with the RBI and operating as MFIs to become eligible for priority sector credit from banks.12 Also, a greater thrust was laid on promoting the Bank-SHG Linkage Programme as the model of micro-finance (RBI 2011). In 2014, the RBI introduced small finance banks, a new variant of banks focused primarily on meeting small credit needs of the population. The NBFCs operating as MFIs figured prominently in the list of entities receiving approval from the RBI to set up small finance banks. And hence, the creation of these banks may see a new form of organisation of micro-finance/financing of small borrowers in India in the years to come. III.3 Interest Rate Regulations The Differential Rate of Interest (DRI) scheme which was introduced in 1974 aimed at providing bank credit at a subsidised rate of 4 per cent per annum to poor borrowers. Further, interest rate ceilings were specified for various loan slabs. With the objective of infusing greater competition in the banking sector, interest rate regulations on loans were gradually removed in the 1990s and 2000s. In 1993, the credit limit size classes on which administered rates were prescribed were reduced to three slabs: Advances of ₹25,000 and below; advances over ₹25,000 and up to ₹200,000; and advances above ₹200,000. Banks were given autonomy to determine the rates on loans above ₹200,000 first under the Prime Lending Rate (PLR) since 1993, and then under the Benchmark Prime Lending Rate (BPLR) since 2003. Under both these systems, PLR and BPLR rates announced by each bank served as a ceiling for loans up to ₹200,000 or SBAs. With the introduction of the base rate system in 2010, the ceiling on SBAs was removed giving complete freedom to banks to determine the rates on their loan portfolios (RBI 2010). The deregulation of the rates of interest was expected to infuse greater competition and, in the long run, improve the flow of credit to small borrowers at reasonable rates of interest (Chakrabarty 2010). In 2006, the central government introduced the interest subvention scheme to provide subsidised (direct) agricultural credit to farmers with relatively small credit needs (of up to ₹300,000).13 This policy broadly coincided with another policy initiative by the central government in 2004 of a targeted revival in the flow of agricultural credit over a three-year period. These two policy initiatives together were evidently aimed at raising the supply of agricultural credit in general, and credit to small and marginal farmers in particular, at subsidised rates. A similar scheme was introduced in 2013 to provide subsidised credit to women borrowers organised in SHGs up to ₹300,000 under the NRLM (a restructured form of the earlier SGSY).14 III.4 Introduction of Innovative Credit Products/Services for Financial Inclusion With the emphasis on financial inclusion in 2005, a number of new banking products/services were introduced and some of the old ones were revived with greater vigour; each of these was expected to have direct implications for catering to the credit needs of small borrowers. These included the Kisan Credit Cards (KCCs), General Credit Cards (GCCs) and overdrafts in Basic Savings Bank Deposit Accounts (BSBDA – earlier no-frills accounts). KCCs were aimed at a prompt supply of bank credit to the cultivating community in general with least procedural hassles. Although they benefited the cultivating community at large, they were expected to enhance the reach of bank credit to small and marginal farmers as well. GCCs were originally aimed at providing revolving credit of up to ₹25,000 and were aimed at catering to the consumption credit needs of borrowers in rural and semi-urban areas. The scheme was evidently focused on small borrowers. However, in 2013 the credit ceiling was removed and these cards were defined as means to provide non-farm entrepreneurial credit to rural and semi-urban borrowers.15 The focus of financial inclusion was initially on extending savings facilities in the form of easy deposit accounts for small depositors. However, as noted earlier, an element of credit was also introduced in 2010 through an overdraft on the deposit account to provide credit to small borrowers during exigencies and to incentivise the account holder to keep the account operational.16 This overdraft facility was also extended to all deposit accounts opened under PMJDY subject to a satisfactory operation of a given account over six months by the account holder.17 Further, an important component of FIPs and PMJDY was coverage of villages by the banking system through branch and non-branch (business correspondents/business facilitators as well as ICT-based platforms) means. The routing of wages, pensions and scholarships through bank accounts of the beneficiaries as part of the Direct Benefit Transfer scheme since 2013 was also an important step for improving financial inclusion of the marginalised sections. To sum up, redistribution was an important part of the banking policy in India since bank nationalisation. The 2000s, more so the period after 2005, witnessed several new policy initiatives directed towards the inclusion of small borrowers in the banking system. Section IV Trends in Lending to Small Borrowers IV.1 Lending to ‘Weaker Sections’ as part of Priority Sectors One of the ways to analyse lending to small borrowers is to look at the flow of credit to ‘weaker sections’ as defined under priority sectors. Over a major part of the 1990s, there was a decline in the share of weaker sections in the credit portfolios of domestic banks (Chart 1).18 This decline could be seen for both public and private sector banks. This drop needs to be seen in the broader perspective of the weakening of the reach of banking in the 1990s. As already discussed, this period saw a fall in branch penetration in rural areas and in the under-banked regions of the country. However, after 2007, there was a pick-up in this share for both the bank groups. This pick-up needs to be seen against the increased thrust on opening branches in rural areas, particularly in under-banked rural areas, and reaching out to the marginalised sections as part of the broader policy of financial inclusion during this period. 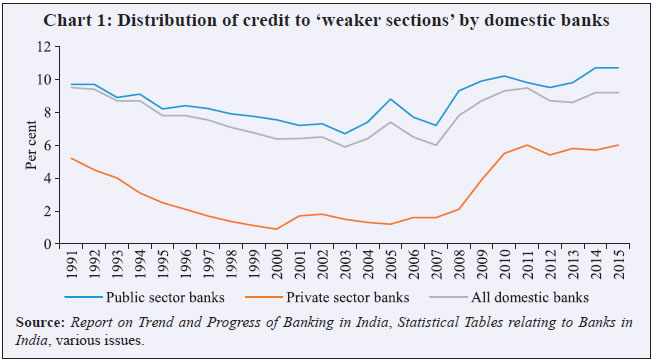 Notwithstanding the increase over the second half of the 2000s, credit to weaker sections by public sector banks barely touched the target of 10 per cent by 2015, while for private sector banks, it remained below the targeted level. At an individual level, there was a decline in the percentage of banks reporting a shortfall among public sector banks but the shortfall remained stubbornly high in the range of 60-80 per cent for private sector banks (Table 1). | Table 1: Number of Banks Failing to meet the 10 per cent Target under Weaker Sections | | Year | Public sector banks | Private sector banks | Year | Public sector banks | Private sector banks | | 2007 | 21
(75.0) | - | 2012 | 11
(42.3) | 12
(60.0) | | 2008 | 14
(50.0) | - | 2013 | 9
(34.6) | 12
(60.0) | | 2009 | 12
(44.4) | 18
(81.8) | 2014 | 5
(19.2) | 12
(60.0) | | 2010 | 8
(30.8) | 15
(68.2) | 2015 | 4
(14.8) | 13
(65.0) | | 2011 | 7
(28.0) | 11
(52.4) | | | | - Not available.
Notes: Figures in brackets indicate the percentage of total number of banks under each category.
Source: Calculated from Report on Trend and Progress of Banking in India, Statistical Tables relating to Banks in India, various issues. | IV.2 Analysis of Small Borrowal Accounts SBAs (at present, with a credit limit of up to ₹200,000) figured with a share of about 77 per cent in banks’ loan accounts in 2015 but their share in total amount of bank credit was close to 8 per cent (Charts 2 and 3).
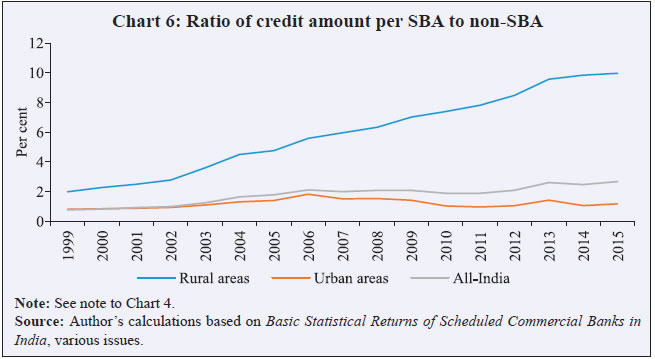
The share of SBAs both in numbers and amount of credit showed a non-declining trend in the 1970s and 1980s. By contrast, there was a steady fall in these shares over the 1990s and 2000s. This trend came out even after accounting for a change in the definition of SBAs. Again, this fall too needs to be seen in light of the trends in the distribution of banking that emerged during the 1990s. This fall has been highlighted in literature and has been described by studies as the side-lining of small borrowers by the banking system in the period of financial liberalisation (Shetty 2005). The decline in the share of SBAs in total bank credit after 1999 (to maintain consistency in the definition of SBAs) occurred in both rural and urban areas. The decline was more perceptible in rural areas from about 63 per cent to 32 per cent between 1999 and 2015. As against this, the share of SBAs in total bank credit fell from about 11 per cent to about 2 per cent in urban areas (Chart 4). Further, the decline could be seen in every region of the country (Table 2).  Notwithstanding the relatively steep decline in the share of SBAs in total credit to rural areas, there were certain other pointers which suggested an increasing allocation of credit to small borrowers in rural areas in the 2000s. First, the (deflated) amount of credit per SBA in rural areas was on a steady rise after 1999 (Chart 5). By contrast, the amount of credit per SBA in urban areas posted a decline during this period. Second, even when the ratio of the amount of credit per SBA to amount per non-SBA was taken, it showed a rising trend in rural areas. As against this, in urban areas it showed signs of stagnation or decline (Chart 6). On average, an SBA holder received about ₹10 as bank credit for every ₹100 received by a non-SBA holder in rural areas in 2015. In urban areas, the amount was much lower at Re 1. These two indicators suggest that the marginalisation of small borrowers by the banking system was, in fact, more pervasive in urban areas and had been growing over the last decade. 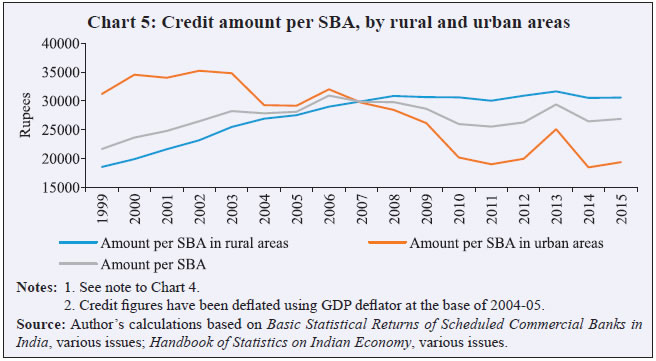
| Table 2: Share of SBAs in Total Bank Credit (region-wise, in per cent) | | Region | 1999 | 2001 | 2003 | 2005 | 2007 | 2009 | 2011 | 2013 | 2015 | | North-eastern region | 62.9 | 50.5 | 52.4 | 43.2 | 41.8 | 29.5 | 29.5 | 23.2 | 21.3 | | Central region | 45.9 | 41.3 | 43.3 | 37.8 | 31.2 | 22.1 | 22.1 | 19.0 | 16.2 | | Southern region | 30.3 | 27.5 | 28.4 | 24.9 | 20.9 | 15.1 | 15.1 | 17.2 | 15.8 | | Eastern region | 33.2 | 30.3 | 29.4 | 27.2 | 21.9 | 14.3 | 14.3 | 12.4 | 11.8 | | Northern region | 17.2 | 14.2 | 14.3 | 12.9 | 10.2 | 5.6 | 5.6 | 4.3 | 3.4 | | Western region | 10.6 | 8.5 | 7.2 | 7.1 | 6.5 | 3.4 | 3.4 | 3.3 | 2.7 | | All-India | 23.1 | 19.7 | 19.2 | 17.3 | 14.3 | 9.4 | 9.4 | 9.3 | 8.3 | Note: Regions have been arranged in descending order based on the figures in 2015.
Source: Author’s calculations based on RBI, Basic Statistical Returns of Scheduled Commercial Banks in India, various issues. | Further, the relative deployment of bank credit to small borrowers was more in the comparatively under-banked regions - north-eastern and central.19 By contrast, the ratio was relatively low and on a decline in the well-banked western and northern regions (Chart 7). In 2015, an average SBA holder in the north-eastern region received ₹8 as bank credit for every ₹100 received by a non-SBA holder; the amount was less than Re 1 in the western region. Thus, the well-banked the region, the more marginalised were its small borrowers. Moreover, in every region the relative credit allocation to small borrowers (vis-à-vis other borrowers) was more in rural areas than in urban areas (Chart 7). Also, the allocation of credit to small borrowers in rural areas broadly showed a rising trend in almost all regions after 1999. Similar rise, however, could not be seen for small borrowers in urban areas in these regions. Section V Trends in Lending to Select Segments of Small Borrowers V.1 Lending to Small and Marginal Cultivators Small and marginal cultivators (defined by the NSSO as cultivators operating landholdings of up to 5 acres) form an integral part of the agricultural sector in India. About 85 per cent of the total landholdings in India were operated under marginal and small holdings and these holdings accounted for 44 per cent of the total area operated in the country as per the latest round of the Agricultural Census of India in 2010-11 (GoI 2012) (Table 3). Small and marginal holdings also accounted for a major portion of the total leased-in area; this indicates the prominent presence of tenant cultivators under the category of small and marginal cultivators.20 The existing sources of data, including priority sector returns and Basic Statistical Returns, offer certain cues about the credit flow to small and marginal cultivators in recent years. | Table 3: Distribution of Land Operated by Size Classes (in per cent) | | Size class | Percentage of landholding | Percentage of area operated | 1990-
91 | 1995-
96 | 2000-
01 | 2005-
06 | 2010-
11 | 1990-
91 | 1995-
96 | 2000-
01 | 2005-
06 | 2010-
11 | | Small and marginal (up to 5 acres) | 78.3 | 80.3 | 81.8 | 83.3 | 85.0 | 32.5 | 36.0 | 38.9 | 41.1 | 44.3 | | Of which, marginal (up to 2.5 acres) | 59.4 | 61.6 | 62.9 | 64.8 | 67.0 | 15.0 | 17.2 | 18.7 | 20.2 | 22.2 | | Of which, small (between 2.5 and 5 acres) | 18.8 | 18.7 | 18.9 | 18.5 | 17.9 | 17.4 | 18.8 | 20.2 | 20.9 | 22.1 | | All other cultivators | 21.7 | 19.7 | 18.2 | 16.7 | 15.0 | 67.5 | 64.0 | 61.1 | 58.9 | 55.7 | | Total cultivators | 100.0 | 100.0 | 100.0 | 100.0 | 100.0 | 100.0 | 100.0 | 100.0 | 100.0 | 100.0 | Note: The years selected are the years of the Agricultural Census.
Source: GoI, Agricultural Census, various issues. | First, small and marginal cultivators together accounted for about 53 per cent of the direct agricultural credit in 2014-15 (Chart 8). Second, credit to small and marginal cultivators as per cent of total/direct agricultural credit posted a decline in the 1990s and even in the first half of the 2000s. The decline was arrested in the second half of the 2000s and showed an increase only after 2010, although marked by fluctuations. However, despite this increase the share of small and marginal cultivators in direct agricultural credit did not keep pace with the increasing share in the total area operated by these cultivators.21 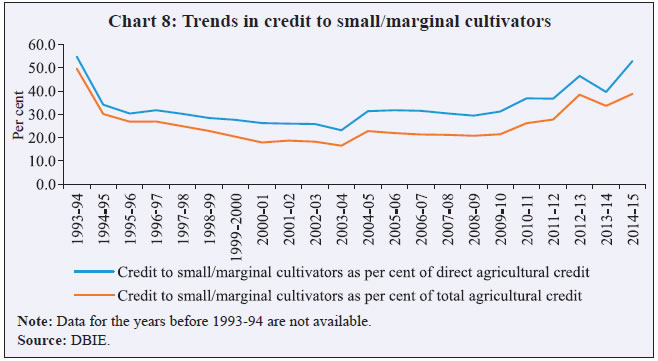 While the share of small and marginal cultivators in direct agricultural credit has been on a rise in recent years, there were also certain disquieting trends that emerged during this period: (a) there was a widening gap in the relative amount of credit per account going to small and marginal cultivators vis-à-vis other cultivators (including large cultivators and corporates/companies engaged in agricultural production) since the second half of the 2000s (Chart 9); (b) the size class-wise distribution of total and direct agricultural credit showed a continued decline in the share of SBAs (with a credit limit of up to ₹200,000) after 1999 as shown in Table 4. Interestingly, there was an increase in the share of large loan size classes in total and direct agricultural credit, including loans with very large credit limits of over ₹100 million during this period.22 Although there appears to have been a decline in the share of such large-sized loans in recent years, their share remained higher than what was recorded at the beginning of the 2000s. 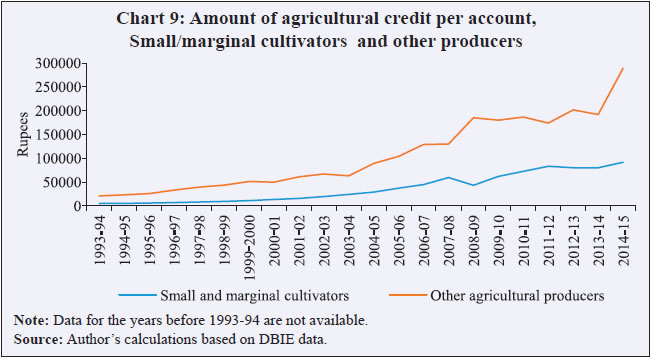 The decline in the share of SBAs can, in some ways, be interpreted as a marginalisation of small and marginal cultivators in the distribution of total and direct agricultural credit. This is because even though the category of SBAs may not exactly represent the credit going to small and marginal cultivators, the two are expected to be closely associated.23 | Table 4: Size Class-wise Distribution of Direct/Total Agricultural Credit (in per cent) | | Credit limit size class (₹) | 1999 | 2001 | 2003 | 2005 | 2007 | 2009 | 2011 | 2013 | 2015 | | Total agricultural credit | | Less than ₹200,000 | 68.0 | 66.0 | 57.9 | 51.8 | 42.6 | 44.3 | 41.3 | 43.7 | 42.6 | | More than ₹200,000 | 32.0 | 34.0 | 42.1 | 48.2 | 57.4 | 55.7 | 58.6 | 56.3 | 57.4 | | Of which, | | | | | | | | | | | a) more than ₹100 million | 8.5 | 9.0 | 14.4 | 15.9 | 22.9 | 20.4 | 19.5 | 12.0 | 9.0 | | a.1) more than ₹250 million | 6.7 | 6.8 | 10.4 | 12.6 | 19.0 | 17.7 | 16.5 | 10.0 | 7.4 | | Direct agricultural credit | | Less than ₹200,000 | 80.4 | 77.2 | 72.6 | 66.7 | 56.1 | 56.3 | 47.9 | 48.4 | 46.3 | | More than ₹200,000 | 19.6 | 22.8 | 27.4 | 33.3 | 43.9 | 43.7 | 52.0 | 51.6 | 53.7 | | a) more than ₹100 million | 1.3 | 1.8 | 3.7 | 3.4 | 8.0 | 6.0 | 10.9 | 6.3 | 4.2 | | a.1) more than ₹250 million | 0.6 | 1.2 | 1.9 | 2.0 | 5.4 | 4.5 | 8.5 | 4.9 | 3.3 | Note: Data are presented from 1999 onwards in order to maintain comparability with the earlier tables based on SBAs.
Source: RBI, Basic Statistical Returns of Scheduled Commercial Banks in India, various issues. | Thus, the various sources of data on small and marginal cultivators seem to suggest an increase in the credit availability to these cultivators in the 2000s. However, it is evident from the shares as well as amount of credit per account that the revival in agricultural credit during this period was more beneficial for agricultural producers other than small and marginal cultivators, including large cultivators/corporates/companies.24 V.2 Lending to Backward Social Groups There have been signs of a decline in the shares of backward social groups in the allocation of bank credit over the last two decades. This is borne out from both banking and household-level data.25 The proportion of credit going to backward social groups steadily fell from about 18 per cent in 1993 to about 4 per cent in 2008; this fall could be seen even after accounting for the change in the definition of SBAs. A fall was also evident in the proportion of loan accounts held by backward social groups. STs were evidently a more deprived section as far as the allocation of bank credit was concerned as compared to SCs (Table 5). The number of accounts and amount of credit (deflated) per capita was also on a declining trend between 1993 and 2008 for backward social groups. For every ₹100 of bank credit received by an average small borrower in 1993, a small borrower belonging to backward social groups received about ₹72. The amount received by a small borrower from backward social groups had fallen to ₹14 by 2008 (Table 6).26 | Table 5: Share in Population, Bank Credit and Number of Accounts, Backward Social Groups (in per cent) | | Variable | Year | Backward social groups | Total population | | All backward social groups | SCs | STs | | Share in population | 1991 | 24.6 | 16.5 | 8.1 | 100.0 | | 2001 | 24.4 | 16.2 | 8.2 | 100.0 | | 2011 | 25.2 | 16.6 | 8.6 | 100.0 | | Share in accounts | 1993 | 27.6 | 18.0 | 9.6 | 100.0 | | 1997 | 26.7 | 17.8 | 8.9 | 100.0 | | 2001 | 18.3 | 12.2 | 6.1 | 100.0 | | 2004 | 10.4 | 6.7 | 3.7 | 100.0 | | 2006 | 8.4 | 5.4 | 3.0 | 100.0 | | 2008 | 5.0 | 3.3 | 1.7 | 100.0 | | Share in amount | 1993 | 17.6 | 12.4 | 5.2 | 100.0 | | 1997 | 19.3 | 12.7 | 6.6 | 100.0 | | 2001 | 10.9 | 7.1 | 3.8 | 100.0 | | 2004 | 7.2 | 4.6 | 2.6 | 100.0 | | 2006 | 6.0 | 3.9 | 2.1 | 100.0 | | 2008 | 3.6 | 2.4 | 1.2 | 100.0 | Note: Given the change in the definition of SBAs in 1999, the figures for the survey years of 1993 and 1997 are not comparable with those from 2001, 2004, 2006 and 2008.
Source: RBI, Survey of Small Borrowal Accounts, various issues, GoI (1991; 2001) and censusindia.gov.in | The household-level AIDIS data from 1991 and 2002 rounds also indicate a similar decline in the share of formal sources and an increasing grip of informal sources, particularly moneylenders in the total debt taken by backward social groups. Between 1991 and 2002, the only two AIDIS rounds which give information on debt by social groups, the proportion of debt taken by households belonging to backward social groups from formal sources, particularly commercial banks, posted a fall (Table 7).27 Clearly, the backward social groups were more marginalised than the rest of the population going by the lower share of formal sources in their debt profiles. | Table 6: Amount of Credit Per Capita and Number of SBAs per 1,000 Persons among Backward Social Groups | | Social group | Amount of credit per capita (in ₹) | Number of SBAs per 1,000 persons | | 1993 | 1997 | 2001 | 2004 | 2006 | 2008 | 1993 | 1997 | 2001 | 2004 | 2006 | 2008 | | Backward social groups | 548 | 388 | 543 | 466 | 417 | 351 | 75 | 57 | 37 | 24 | 23 | 16 | | Others | 827 | 522 | 1411 | 1906 | 2674 | 3122 | 67 | 41 | 52 | 64 | 80 | 97 | | (backward social groups as % of others) | (66) | (74) | (38) | (24) | (16) | (11) | - | - | - | - | - | - | | All | 765 | 492 | 1215 | 1596 | 2137 | 2430 | 70 | 42 | 49 | 54 | 66 | 78 | | (backward social groups as % of All) | (72) | (79) | (45) | (29) | (24) | (14) | - | - | - | - | - | - | Notes : 1. Figures of credit per capita have been deflated using GDP deflator at the base of 2004-05.
2. The population for each year is extrapolated applying the respective exponential rates of growth of population of 1991- 2001 and 2001-11 for each of the categories.
3. Given the change in the definition of SBAs in 1999, the figures for the survey years of 1993 and 1997 are not strictly comparable with those from 2001, 2004, 2006 and 2008.
Source : Author’s calculations based on Survey of Small Borrowal Accounts, various issues, GoI (1991; 2001); censusindia.gov.in; and DBIE Database, RBI. | As already discussed, the 1990s witnessed a contraction in the share of formal sector in the rural credit system making way for informal sector to grow. The share of formal sources, particularly commercial banks, declined for all households in India between 1991 and 2012.28 In fact, this was the first time since 1951 that such a fall could be seen in the share of formal sources for rural households. Moreover, the fall was greater for backward social groups than it was for the rest of the population (Table 7). V.3 Lending to Rural and Agricultural Labourers Rural labourers in general and agricultural labourers in particular, constitute an important segment of the rural poor. Data on this segment are available only from household-level surveys conducted by the NSSO, which have been analysed in this sub-section. | Table 7: Distribution of Outstanding Debt of Backward Social Groups and Other Households by Source of Debt, 1991 and 2002 (in per cent) | | Source | Share of each source in total amount of debt | | Backward social groups | Others | | 1991 | 2002 | 1991 | 2002 | | Formal sources | 61.4 | 56.8 | 67.4 | 65.0 | | Of which, commercial banks | 30.9 | 24.8 | 28.4 | 26.7 | | Informal sources | 36.2 | 43.2 | 29.2 | 35.0 | | Of which, moneylenders | 18.5 | 20.1 | 13.9 | 15.8 | | | Percentage of households reporting at least one loan from each source | | Backward social groups | Others | | 1991 | 2002 | 1991 | 2002 | | Formal sources | 14.9 | 11.0 | 14.5 | 12.8 | | Of which, commercial banks | 7.5 | 5.1 | 6.1 | 5.0 | | Informal sources | 10.1 | 13.5 | 9.5 | 14.0 | | Of which, moneylenders | 3.0 | 5.5 | 2.4 | 5.4 | Note: These calculations are for all (rural plus urban) households.
Source: Author’s calculations based on NSSO (1998; 2006). | GoI (2006) defines a rural labour household as one that draws a major part of its income during the year preceding the survey from wage-paid manual labour from both agricultural and non-agricultural activities. Agricultural labour households are a segment within rural labour households which derive a major part of their income from wage-paid labour in agriculture. As per NSSO data, there was a fall in the share of formal sources in the total debt of rural labour households between 1999-2000 and 2004-05; the share showed no major change between 1993-94 and 1999-2000 (Table 8). Banks were the most important formal source of credit for rural labour households. As published data from NSSO are only available till 2004-05, these trends after 2004-05 are explained using the unit-level data on rural (agricultural) labour households from the Employment-Unemployment (66th) Round of 2009-10.29 Between 2004-05 and 2009-10, there was a resurgence of formal sources, particularly of banks, in the debt profiles of these households (Table 8).30 Yet, the increased presence of banks did not undermine the importance of informal sources, particularly moneylenders, as sources of credit for rural labour households. Moneylenders figured as their largest source of credit and the share of moneylenders in 2009-10, in fact, was higher than it was a decade ago in 1999-2000.31 | Table 8: Share of Debt (by source), Rural Labour Households (in per cent) | | Source | 1987-88 | 1993-94 | 1999-2000 | 2004-05 | 2009-10* | | Formal sources | 33.8 | 35.1 | 35.7 | 29.0 | 36.6 | | Of which, banks | 20.8 | 18.9 | 17.2 | 16.5 | 21.4 | | Informal sources | 66.2 | 64.9 | 64.3 | 71.0 | 63.4 | | Of which, moneylenders | 21.7 | 27.6 | 31.7 | 44.2 | 33.1 | | All sources | 100.0 | 100.0 | 100.0 | 100.0 | 100.0 | * Figures based on unit-level data from the Employment-Unemployment Round for this year.
Note: The years shown are years of the various rounds of the Rural Labour Enquiry.
Source: NSSO, Rural Labour Enquiry, various issues and author’s calculations based on unit-level data for 2009-10. | The trends for agricultural labourers were similar to that of rural labourers. There was a marginal increase in the share of banks in the total debt of agricultural labour households after 2004-05. However, it is evident that agricultural labour households were a more marginalised group within rural labour households as far as the allocation of bank credit was concerned. This could be understood from the lower share of banks in the debt profiles of agricultural labour households as compared to rural labour households (Table 9). Within agricultural labour households, landless labour households were an even more marginalised group. If a rural labour household reported 37 per cent of its debt from formal sources in 2009-10, for an agricultural labour household, the share was lower at 30 per cent and for a landless agricultural labour household, the share was even lower at 26 per cent (Table 10). | Table 9: Share of Debt (by source), Agricultural Labour Households (in per cent) | | Source | 1987-88 | 1993-94 | 1999-2000 | 2004-05 | 2009-10 | | Formal sources | 34.6 | 35.9 | 31.0 | 26.6 | 30.4 | | Of which, banks | 21.0 | 20.7 | 16.6 | 14.0 | 16.6 | | Informal sources | 65.4 | 64.2 | 68.9 | 73.4 | 69.6 | | Of which, moneylenders | 22.0 | 29.4 | 34.0 | 44.5 | 36.3 | | All sources | 100.0 | 100.0 | 100.0 | 100.0 | 100.0 | Note: See note to Table 8.
Source: NSSO, Rural Labour Enquiry, various issues and author’s calculations based on unit-level data for 2009-10. | Importantly, there was a resurgence of banks in the debt profiles of rural labour households in general after 2004-05, but not for the ones belonging to backward social groups (Table 11). For rural labour households belonging to backward social groups, the share of banks did not show any perceptible increase during this period. This is in line with the point made earlier about the declining share of backward social groups in the allocation of bank credit in recent decades. | Table 10: Share of Debt (by source), Agricultural Labour Households (with and without cultivated land) (in per cent) | | Source | Agricultural labourers | | Without cultivated land | With cultivated land | | 1999-00 | 2004-05 | 2009-10 | 1999-00 | 2004-05 | 2009-10 | | Formal sources | 21.1 | 20.5 | 26.1 | 39.6 | 38.8 | 41.0 | | Informal sources | 78.9 | 79.6 | 73.9 | 60.4 | 61.2 | 59.0 | | All sources | 100.0 | 100.0 | 100.0 | 100.0 | 100.0 | 100.0 | Note: See note to Table 8.
Source: NSSO, Rural Labour Enquiry, various issues and author’s calculations based on unit-level data for 2009-10. |
| Table 11: Share of Banks in Total Debt, Rural Labour Households (backward social groups and others) (in per cent) | | Type of household | 1993-94 | 1999-00 | 2004-05 | 2009-10 | | All rural labour households | 18.9 | 17.2 | 16.5 | 21.4 | | Rural labour households belonging to backward social groups | 27.5 | 11.2 | 13.1 | 13.6 | | Other rural labour households | 14.9 | 19.3 | 17.4 | 25.0 | Note: See note to Table 8.
Source: NSSO, Rural Labour Enquiry, various issues and author’s calculations based on unit-level data for 2009-10. | V.4 Lending to Women Women are a marginalised group in terms of distribution of general banking services given their involvement in unorganised sector employment at relatively lower wages and lack of access to land and other property titles. Bank credit is, of course, no exception to this. Women had a share of about 19 per cent of the bank credit given under SBAs in 2015; the remaining 81 per cent was taken up by men. An important point, however, is that over the 2000s, women’s share in bank credit showed a slow but steady pick up (Chart 10).32 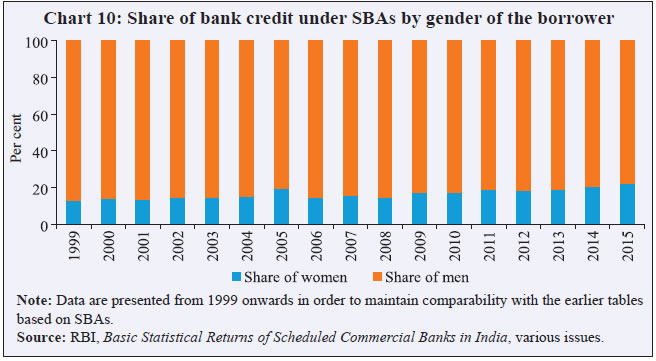 Further, there was a distinct change in the distribution of bank credit in favour of rural women after 2005.33 On average, for every ₹100 of bank credit received by a female borrower in urban areas in 2015, a woman borrower in a rural area received ₹202. In 2005, the amount of credit received by a woman borrower in rural areas was only ₹58. Similarly, for every ₹100 of bank credit received by an average male borrower in urban areas, an average woman borrower in rural areas received ₹36 in 2015; the corresponding amount was ₹15 in 2005 (Chart 11). By contrast, urban women seemed to be losing out not only with respect to rural women but also with respect to urban men in terms of allocation of bank credit. On average, for every 100 loan accounts held by rural men, rural women held about 32 accounts in 2015. As against this, urban women held only 16 loan accounts per every 100 loan accounts held by urban men during the same year. Further, an average rural woman borrower received ₹30 per every ₹100 received by a rural man in 2015. In urban areas, however, an average woman borrower received only ₹18 for every ₹100 received by a man. Moreover, the gap between rural and urban areas in terms of availability of bank credit and number of loan accounts widened over the second half of the 2000s with urban areas losing out as compared to rural areas (Chart 12).
V.4.1. Lending to Women belonging to Backward Social Groups Women belonging to backward social groups are expected to be socially and economically more marginalised than other women. Accordingly, in 2008, per every ₹100 of bank credit per capita among women in general, women from backward social groups reported a credit of only about ₹21 (Table 12). Moreover, women from backward social groups could not keep pace with the increase showed by other women in the amount of bank credit and number of loan accounts over the 2000s. | Table 12: Amount of Credit Per Capita and the Number of SBAs per 1,000 Women from Backward Social Groups | | Social group | Amount of credit per capita (in ₹) | Number of SBAs per 1,000 persons | | 1997 | 2001 | 2004 | 2006 | 2008 | 1997 | 2001 | 2004 | 2006 | 2008 | | Women from backward social groups | 174 | 190 | 218 | 213 | 124 | 15 | 16 | 13 | 12 | 7 | | Other women | 159 | 360 | 589 | 743 | 747 | 10 | 16 | 24 | 27 | 25 | | (Women from backward social groups as per cent of other women) | (109) | (53) | (37) | (29) | (17) | - | - | - | - | - | | All women | 163 | 322 | 497 | 613 | 590 | 11 | 16 | 22 | 24 | 20 | | (Women from backward social groups as per cent of All women) | (106) | (59) | (44) | (35) | (21) | - | - | - | - | - | Notes : 1. Figures of credit per capita have been deflated using GDP deflator at the base of 2004-05.
2. The population for each year is extrapolated applying the respective exponential rates of growth of population of 1991- 2001 and 2001-11 for each of the categories.
3. Given the change in the definition of SBAs in 1999, the figures for the survey years of 1993 and 1997 are not strictly comparable with those from 2001, 2004, 2006 and 2008.
Source : Author’s calculations based on Survey of Small Borrowal Accounts, various issues (GoI 2013); RBI: DBIE Database. | Section VI Concluding Observations This paper looked at the coverage of borrowers with smaller credit needs by the banking system using existing sources of secondary data. It studied the distribution of both bank credit and household debt to analyse how small borrowers were placed vis-à-vis other borrowers and how the relative position in accessing bank credit by small borrowers has changed over time. The period of analysis comprised the decades of 1990s and 2000s, which witnessed two major landmarks in the history of banking policy in India: the initiation of the policies of financial liberalisation and financial inclusion. Although a primary survey might possibly have been a more suited option for understanding the coverage of small borrowers, in the absence of such a survey the existing secondary data analysed in this paper brought out several revealing trends. The major findings from this paper are: Unlike the 1990s, the 2000s – particularly its second half – saw certain favourable changes with regard to the coverage of small borrowers by the banking system. There was an increase in the relative allocation of credit to small borrowers in rural areas vis-à-vis other borrowers in almost all geographical regions in the country during this period. The important gainers during this period were small rural women borrowers; there was a perceptible increase in the relative allocation of bank credit to rural women vis-à-vis rural men in the 2000s. The proportion of bank credit in the debt portfolios of rural labour households also showed an increase in the second half of the 2000s. The increase was noteworthy against the backdrop of a steady fall in the share of bank credit over the 1990s and early-2000s for these groups. The fall in the share of small and marginal cultivators in bank credit during the 1990s was arrested over the second half of the 2000s, and showed an increase in the first half of 2010s. Each of these trends needs to be seen in light of the broader changes in banking policy and the consequent changes in the rural branch network and supply of agricultural credit during the 2000s. From 2005 onwards, there has been a thrust on the policy of financial inclusion. Consequently, there were policy-induced efforts towards increasing the presence of banks in rural areas, particularly in under-banked regions through branch and non-branch means and reviving the flow of agricultural credit. The various trends based on data on banking and debt profiles of households during the 2000s bear out the broad impact of these policy measures. First, there has been an increase in the share of commercial banks in debt profiles of rural households in general and of cultivators in particular as per the latest round of the AIDIS in 2012-13.34 Second, this period was marked by an increase in the number of rural bank branches and a revival in the growth of agricultural credit. However, against these positive outcomes, there were also certain disquieting trends as far as the allocation of bank credit to small borrowers was concerned: (a) There was increasing marginalisation of small borrowers in urban areas across all geographical regions in the country. (b) Small urban women borrowers seemed to be losing out not just with respect to urban men but also with respect to rural women during this period. (c) The share of backward social groups in total bank credit also showed a persistent fall. The decline was also evident when we looked at the relative allocation of bank credit to women and rural labourers belonging to these groups. (d) Even though the fall in the share of small and marginal cultivators was arrested during the second half of the 2000s, the relative allocation of bank credit to these segments left much to be desired. This was evident from a widening gap in the relative allocation of credit per account between small and marginal cultivators and other categories of agricultural producers over the 2000s. (e) Even though there was a revival in the share of bank credit going to weaker sections, the share for banks – at the aggregate level and individual levels for certain banks – remained below targeted levels. The findings from this paper indicate that policy efforts for financial inclusion so far have resulted in positive outcomes for some, but not all, under-privileged segments of the population. The major policy implications that arise from the analysis relate to: (a) the need for banks to continue with their efforts in lending to weaker sections, particularly backward social groups and small/marginal cultivators, and give greater attention to meeting the existing targets set for these sections, (b) the need to continue with the policy on financial inclusion for strengthening banking presence in rural areas but also to give attention to urban poor in light of increasing urbanisation, particularly to women engaged in domestic and other forms of unorganised labour. The marginalisation of small borrowers in urban areas also lends credence to the point that the mere presence of banks/bank branches may not help in reaching out to small borrowers. This may be a necessary but not a sufficient condition. There is also a need to strengthen custom-made platforms to reach out to such borrowers.
References Bebczuk, Ricardo (2007), ‘Access to Credit in Argentina’, Development Studies Unit, Economic Development Division Santiago, Chile, April. Bell, Clive (1990), ‘Interactions between Institutional and Informal Credit Agencies in Rural India’, World Bank Economic Review, 4 (3), pp, 297-327. Chakrabarty, K. C. (2010), ‘Bank credit to Micro, Small and Medium Enterprises (MSMEs) – Present Status and Way Forward’, Address at the formal release of the India Micro, Small and Medium Enterprises Report, Kochi. _____ . (2011), ‘Financial Inclusion - A Road India Needs to Travel’. Available at: www.livemint.com ______. (2012), ‘Social Banking and Finance – Opportunities in Inclusion’, Keynote Address at the 2nd FT-YES Bank International Banking Summit in Mumbai, October 15. ______. (2013), ‘Financial Inclusion in India: Journey So Far And Way Forward’, Keynote address delivered at the Finance Inclusion Conclave organised by CNBC TV 18 at New Delhi on September 6. Available at: www.rbi.org.in Chandrasekhar, S. (2014), ‘Reading the Tea Leaves on Financial Inclusion – The Case of Rural Households’, Economic and Political Weekly, XLIX, pp. 43-51. (3). Chavan, Pallavi (2005), “Banking Sector Reforms and Growth and Distribution of Rural Banking in India” in V. K. Ramachandran and Madhura Swaminathan (eds.), Financial Liberalisation and Rural Credit, New Delhi: Tulika Books. _______. (2007), ‘Access to Bank Credit: Implications for Dalit Rural Households’, Economic and Political Weekly, 42 (31), pp. 3219-3224. _______. (2008), ‘Gender Inequality in Banking Services’, Economic and Political Weekly, 43 (47), pp. 18-21. ______. (2016), ‘Public Banks and Financial Intermediation in India: The Phases of Nationalisation, Liberalisation and Inclusion’, Christoph Scherrer (ed.) in Public Banks in the Age of Financialisation: A Comparative Perspective, Edward Elgar. Copestake, James, John Howell and Steve Wiggins (1984), The Structure and Management of Formal Rural Credit in Madurai and Ramanad Districts, Research Report No. 1, UK: The University of Reading. Diagne, Aliou, Manfred Zeller and Manohar Sharma (2000), ‘Empirical Measurements of Households’ Access to Credit and Credit Constraints in Developing Countries: Methodological Issues and Evidence’, FCND Discussion Paper No. 90. Dreze, Jean (1990) ‘Poverty in India and the IRDP Delusion’, Economic and Political Weekly, 25 (39), A95-A104. Dreze, Jean, Peter Lanjouw and Naresh Sharma (1998), ‘Credit’, in Peter Lanjouw and Nicholas Stern (eds), Economic Development in Palanpur Over Five Decades. Oxford: Oxford University Press. GoI (1991), Final Population Totals – Series 1, New Delhi, Office of the Registrar General and Census Commissioner, India. ____. (2001), Provisional Population Totals: Rural and Urban Distribution for India and States/Union Territories, New Delhi: Office of the Registrar General and Census Commissioner. _______. (2006), Rural Labour Enquiry 1999-2000 - Report on Wages and Earnings of Rural Labour Households, Shimla: Labour Bureau. _____. (2007), Report of the Expert Group on Agricultural Indebtedness (Chairman: R. Radhakrishna), New Delhi. __________. (2010a), Report of the Task Force on Credit Related Issues of Farmers (Chairman: U. C. Sarangi), New Delhi. _______. (2010b), Rural Labour Enquiry Report on Indebtedness among Rural Labour Households (2004-05). Shimla: Ministry of Labour and Employment. _____. (2012), Agriculture Census - 2010-11, New Delhi. ____. (2013), Census of India - Data Highlights on Scheduled Castes and Scheduled Tribes. Available at: www.censusindia.net.in Gothoskar, S. P. (1988), ‘On Some Estimates of Rural Indebtedness’, Reserve Bank of India Occasional Papers, 9 (4). Ministry of Agriculture (2007), ‘Agricultural Credit,’ in Annual Report: 2006–07. New Delhi: Ministry of Agriculture, Government of India. Available at: www.agricoop.nic.in. Ministry of Finance (2007), ‘Budget 2007-08’, Budget Speech, February 28. Available at: http://indiabudget.nic.in. Narayana, D. (1988), ‘A Note on the Reliability and Comparability of the Various Rounds of the AIRDIS and AIDIS’, Centre of Development Studies, Thiruvananthapuram, Unpublished. National Sample Survey Organisation (NSSO) (1998), Household Assets and Indebtedness of Social Groups as on 30-06-91, Report No. 432 (Part II), New Delhi: NSSO. _____. (2005), Some Aspects of Operational Land Holdings in India, 2002-03. Available at: www.mospi.nic.in ___. (2006), Household Assets Holding, Indebtedness, Current Borrowings and Repayments of Social Groups in India as on 30.06.2002, Report 503, New Delhi: NSSO. ______. (2015), ‘Key Indicators of Debt and Investment in India’. Available at: www.mospi.nic.in Ramakumar, R. and Pallavi Chavan (2007), ‘Revival in Agricultural Credit in the 2000s: An Explanation’, Economic and Political Weekly, 42 (52), pp. 57-63. ___. (2014), ‘Agricultural Credit in India in the 2000s: Dissecting the Revival, Review of Agrarian Studies, 4 (1), February-June. RBI (1956), All India Rural Credit Survey –The Survey Report (Part II: Credit Agencies) Volume I, Bombay. ______. (1991), Report of the Committee on the Financial System (Chairman: M. Narasimham), Mumbai, RBI. ______. (2008), Report on Currency and Finance - 2006-08, Mumbai: RBI. ______. (2010), Report of Trend and Progress of Banking in India – 2009-10, Available at: www.rbi.org.in. _____. (2011), Report of the Sub-Committee of the Central Board of Directors of Reserve Bank of India to Study Issues and Concerns in the MFI Sector (Chairman: Y. H. Malegam), Mumbai: RBI. ______. (2013), Report on Trend and Progress of Banking in India – 2012-13, Mumbai: RBI. ____. (2014), Financial Stability Report – December. Mumbai: RBI. ____. (2015), Report of the Internal Working Group to Revisit the Existing Priority Sector Lending Guidelines, Mumbai: RBI. Shetty, S. L. (2005), ‘Regional, Sectoral and Functional Distribution of Bank Credit’, in V. K. Ramachandran and Madhura Swaminathan (eds), Financial Liberalisation and Rural Credit. New Delhi: Tulika Books. Subbarao, D. (2012), ‘Agricultural Credit – Accomplishments and Challenges’, Speech delivered at the Thirty Years Anniversary Celebration of NABARD, Mumbai, July 12. Thorat, Usha (2006), “Financial Inclusion and Millennium Development Goals”, Speech delivered at the 4th Programme on Human Development and State Finances, at CAB, Pune, January 16, accessed at <www.rbi.org.in>. Walker, T. S. and James G. Ryan (1990), Village and Household Economies in India’s Semi-arid Tropics. Baltimore: John Hopkins.
Annexure | Annexure I: Indicators of Banking Development (by regions) | | Region | Population per branch (‘000) | Amount of credit per capita (₹ ‘00) | | 1991 | 2001 | 2011 | 2015 | 1991 | 2001 | 2011 | 2015 | | | Above national average | | Western | 12.8 | 14.0 | 12.1 | 9.4 | 29 | 119 | 794 | 1255 | | Northern | 11.0 | 12.3 | 9.8 | 7.2 | 23 | 92 | 601 | 929 | | Southern | 11.9 | 12.1 | 9.8 | 7.2 | 17 | 65 | 434 | 690 | | | Below national average | | Eastern | 16.4 | 23.7 | 17.9 | 12.8 | 8 | 16 | 117 | 194 | | Central | 15.8 | 14.7 | 16.9 | 14.1 | 7 | 21 | 93 | 150 | | North- eastern | 16.9 | 19.9 | 18.9 | 14.6 | 5 | 11 | 70 | 112 | | All-India | 13.7 | 15.2 | 13.1 | 9.7 | 15 | 52 | 337 | 532 | | Source: Author’s calculations based on Basic Statistical Returns of Scheduled Commercial Banks in India, various issues; GoI (1991, 2001); censusindia.gov.in |
| Annexure II: Share in Total Debt (in per cent) | | Source | Rural households | All households | | 1951 | 1961 | 1971 | 1981 | 1991 | 2002 | 2012 | 1981 | 1991 | 2002 | | Formal sources | 7.2 | 14.8 | 29.2 | 61.3 | 64.0 | 57.1 | 56.0 | 60.8 | 67.4 | 65.0 | | Of which, commercial banks | - | 0.4 | 2.2 | 28.0 | 33.7 | 24.5 | 25.1 | 26.2 | 28.4 | 26.7 | | Informal sources | 92.8 | 85.2 | 70.8 | 38.7 | 36.0 | 42.9 | 44.0 | 39.2 | 29.2 | 35.0 | | Of which, moneylenders | 72.6 | 60.8 | 36.9 | 17.1 | 17.6 | 29.8 | 33.2 | 15.4 | 13.9 | 15.8 | Note: The combined information for all households cannot be worked out for 2012 due to non-availability of data on the estimated number of households.
Source: RBI (2008) and NSSO (2015). |
|