Pratik Mitra, Anirban Sanyal, Sohini Choudhuri* Despite the real estate sector being among the major drivers of economic growth in India and contributing about 11 per cent to Gross Value Added(GVA) growth since 2011-12, non-availability of data in a timely manner hinders an objective assessment of the sector’s performance. This paper attempts to bridge this gap by employing Big Data Analytics to nowcast the sales growth of real estate companies using Google search data. The paper concludes that the search intensity information improves precision relative to other benchmark approaches while nowcasting the current quarter sales. JEL Classification : C32, C53, C55, C81 Keywords : Nowcasting, google trend, composite indicator, real estate Introduction In most emerging market economies (EMEs), the real estate sector has been an engine of growth and employment with both backward and forward linkages. In India, the growth of the real estate sector has averaged 14.8 per cent from 2011-12 to 2016-17, compared to 6.7 per cent average growth of GVA. Therefore, a fairly accurate assessment of the current state of the sector and its outlook assumes importance in policymaking. As the hard data are published with a considerable lag, information relating to the current quarter and sometimes even the previous quarter is not available at the time of, say, monetary policy meeting, let alone the union/state budget formation. In India, the data on quarterly aggregate supply, measured by Gross Value Added (GVA), are released with a lag of sixty days after the end of the quarter. The data compilation process relating to quarterly GVA follows a benchmark indicator approach in which the available economic indicators are tracked to gauge the state of activity in different sectors. In the case of real estate, corporate results of listed companies are used by the Central Statistics Office (CSO) as coincident indicators (Central Statistics Office 2017). In this context, the technique of ‘nowcasting’ assumes critical importance. It typically exploits either soft data like forward looking survey results or ‘hard’ indicators released at higher frequencies than the target variable of interest. With regard to the real estate sector, quarterly corporate results are reliable indicators for nowcasting real estate activities, but they face the same challenge of time lag as quarterly financial statements of corporates that are generally available with a lag of around forty-five days. Against this background, this paper explores the possibility of bridging the gap by introducing nowcasting sales growth of real estate companies using Google Search.1 From 2009, Google started disseminating search intensity data through the public interface of Google Trends. Following the seminal work of Choi and Varian (2012), a new branch of econometrics using Google Trends data has proliferated and examined the value added by Google Trends data while nowcasting labour market conditions, consumer sentiment, consumption outlook, housing market conditions, sales growth and inflation. Although advanced economies, especially the United States (US), have been the front runner in this context, research using Google search data for macroeconomic analysis and projections in the context of EMEs is scarce (Carrière-Swallow and Labbé, 2011). This paper seeks to correct this imbalance and is, to the best of our knowledge, a first in the Indian context. The paper demonstrates that the performance of nowcasted sales growth of the real estate sector improves2 when search data are used in the analysis. Further, ‘noise’ in search data was found creating volatility in the predictor space, thereby highlighting the importance of keyword selection in the domain of Big Data Analytics. In this paper, we have used the dynamic factor model (DFM) to nowcast real estate sector growth. This kind of framework has been extensively employed in short-term forecasting since the early 1980s. The DFM, an extension of factor models, popularised by Gweke (1977) and Sargent and Sims (1977), is well equipped for extraction of the factors from a larger set of economic indicators that spans the information set into a lower dimensional space. Such a dimensionality reduction approach works well on an information set with a balanced panel. However, in reality, the data of different economic indicators are released at different point of time during a month, making it an unbalanced data set. Further, each data release also involves revision of the earlier released data points. Hence, the information set keeps getting updated with every data release. The jagged edge3 in the information set can pose considerable challenges to the framework. Giannone et al., (2008) extended this standard framework for nowcasting macroeconomic indicators by introducing the Kalman smoother based factor updation approach suitable for non-synchronous data releases of high frequency economic indicators. The novelty of this approach, therefore, lies in the easy adaptability for nowcasting major macroeconomic indicators when relevant data are released at different time points (dates in a month) with considerable time lag. The framework was first used to nowcast the Gross Domestic Product (GDP) of the US (Giannone et al., 2008). They predicted real GDP growth using a large jagged edged information set and observed that DFM produced more precise forecast in short horizon compared to other benchmark models, including the Survey of Professional Forecasts. Subsequently, Angelini et al., (2011) introduced a similar framework for the European Central Bank (ECB) where it was observed that the short-term pooled forecast performance of the factor model using bridge equation improves the forecast accuracy. Also, Altissimo et al.,(2001), Schumacher (2010) and D’Agostino et al., (2008) introduced this framework in Banca d’Italia, Deutsche Bundesbank and Central Bank of Ireland, respectively, signifying its wide acceptance in the central banks of developed countries. Barhoumi et al., (2008) compared the forecast performance of such DFM vis-à-vis the purely quarterly model (auto regression, vector auto regression and bridge equations) for select European countries. Liebermann (2012) applied nowcasting using a large set of monthly macroeconomic data for Ireland and observed significant improvement in short-term forecast precision over other model-based forecasts suggesting robustness in performance of the DFM framework among competing models. Extending the footprint in EMEs, Kabundi et al., (2016) carried out nowcasting of real GDP growth for South Africa and observed that this nowcasting framework provides a more precise forecast of real GDP than other benchmark models. Sanyal and Das (2017) used this framework for nowcasting sales growth of listed manufacturing companies in India. Further, Chakravartti and Mundle (2017) used the automatic leading indicator-based approach in the DFM framework for forecasting aggregate and sectoral growth of GDP for 2016-17. The rest of the paper is organised as follows: Section II summarises the adaptation of search data in the available literature on Big Data Analytics; Section III outlines the empirical framework used for identifying suitable keywords and the Section IV discusses data used for analysis and stylized facts. The empirical findings are evaluated in Section V. Section VI concludes highlighting the limitations and the scope for future research. Section II
Use of Google Search Data for Nowcasting and Economic Research Increasing internet penetration and the overwhelming acceptability of Google as a search platform are cited as the drivers of Big Data and analytics thereon (Choi and Varian, 2012). This seminal work has been extended to harness the information content of Google search data to provide improved assessments of employment conditions; retail, house and car sales; tourism and consumer confidence (Choi and Varian, 2012). An intertwining stream in the literature has corroborated the utility of search intensities using Google search data to assess private consumption, leading to the development of a new index of consumer sentiment that was found to be more precise in predicting consumption growth than the University of Michigan Consumer Sentiment Index and the Conference Board Consumer Confidence Index (Penna and Huang, 2009; Vosen and Schmidt, 2011). The application of these data has been extended to predict the different aspects of economic activity, viz., tourism growth in Hong Kong (Gawlik, et al., 2011); the unemployment rate for Denmark (Zimmermann and Askitas, 2009), the US (D’Amuri and Marcucci, 2010, 2013), and for the UK (McLaren and Shanbhogue, 2011); housing market conditions (McLaren and Shanbhogue, 2011), to name a few. Suhoy (2009) conducted a business cycle analysis using Google search data for Israel and observed that the search data successfully identifies the business cycle turn around point. Koop (2013) used the dynamic model selection (DMS) in time varying framework on Google search data to forecast key macroeconomic indicators of the US, namely inflation, wages, unemployment, term spread, financial condition index, industrial production and money supply growth. He observed that DMS with Google search data improves forecast precision. Carrière-Swallow and Labbé (2011) developed an index of online propensity to buy cars and used that index to nowcast car sales growth for Chile. They observed that the use of this index significantly improves the forecast precision for both in-sample and out-of-sample forecasts. Google trend data has also been used to analyse the volatilities in currency markets (Smith, 2012). The practice of using Google search data for macroeconomic assessment and forecasting was formally adopted by the ECB and Bank of England in 2013. Beyond the realm of macroeconomics, Google search data has also been used in other areas such as tracking the flu status in the US (Yang et al., 2015). Notwithstanding the burgeoning literature on the use of internet search-based big data for nowcasting in the developed world, there is a dearth of similar studies in the context of emerging economies like India. This is primarily due to the lack of internet penetration and skewed usage of internet across the country. It is estimated that 19 per cent of India’s total population is extensively using the internet, with the majority being the youth (PwC, 2015). Despite poor infrastructure, internet usage in India has advanced exponentially and has, in turn, powered e-commerce, even at a relatively lower level of penetration (87 and 86 per cent in the US and Japan, respectively) (Chart 1). Internet users in India surged from 60 million in 2009 to 200 million in 2014 with a forecast of 580 million in 2018 (BCG and RAI4, 2017). The majority of the population contributing to internet usage is predominantly the urban young middle- and upper-income class with the knowledge of, and accessibility to, the internet. Although internet penetration in rural area has increased manyfold in recent years, infrastructure, especially connectivity, still remains a binding constraint. With increase in internet usage and awareness, internet-based search engines have gradually emerged as primary sources of information. The information on internet searches can be suitably used to understand the demand conditions in a particular sector of the economy. However, the spread of the internet, at present, is skewed-concentrated in urban areas-and hence the search pattern would represent pre-dominantly urban demand. The suitability of selecting the real estate sector lies in the fact that the real estate activities are heavily concentrated in urban areas and therefore internet searches on real estate are likely to reflect the demand condition of the sector. 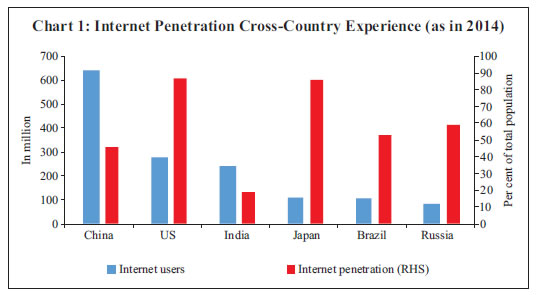 Section III
Methodology The steps followed in this paper begins with compilation of search intensity data in the first stage and then moving to nowcasting. The empirical exercise comprises the following steps: | Step 1 | Identification of keywords relating to real estate search | | Step 2 | Repeated sampling scheme | | Step 3 | Shortlisting keywords based on their information content | | Step 4 | Consolidation of search intensity across keywords to derive a search propensity indicator | | Step 5 | Exposition of nowcasting framework | | Step 6 | Selection of other economic indicators to facilitate nowcasting | | Step 7 | Evaluating forecasting performance using rolling forecast | Identification of keywords Related to Real Estate Search The choice of keywords plays a crucial role in determining the precision of the nowcasting exercise. Internet searches are often led by subjectivity that varies across users. The choice differs from time to time and user to user according to convenience and familiarity with words. Hence, the usefulness of the search intensity is contingent upon finalising a list of keywords representative enough to capture the real estate sector demand across regions and in different time periods. Following Choi and Varian (2012), Kholodin et al., (2010), we begin with an initial long list of keywords deemed relevant for the real estate sector. ‘Google Correlate’, a tool on ‘Google Trends’, provides a suggestive list of keywords with a similar search pattern. This suggestive list, after pruning down the unrelated words by manual screening, was added to the set of keywords. The initial list of keywords along with such suggested search words constitutes an ensemble representative set of the population keywords. An illustrative mechanism followed for creating such representative set is provided in Chart 2. Once the keywords were identified, the search intensity indices of these keywords were collected from Google Trends every month. The trend index represents a scaled version of search intensity, derived from the ratio of the total number of searches containing a particular keyword to the total number of searches during that time. Further, the relative intensity during a period is scaled from [0,100] scale in the following manner: where St is the relative search intensity. nt and Nt represent the number of searches on a specific keyword ‘X’ and total number of searches during that time, respectively. The novelty of this relative scaling is that any increase in number of users is taken care of. Repeated Sampling Scheme Since Google uses a sampling approach to gather search intensity data, making inference based on a single observation of search intensity would be inappropriate. The problem can be mapped with the typical sampling problem in statistics where the population search intensity is unknown and hence should be estimated based on sample observations. It has been observed that search intensity index extracted using Google Trends within a day remains the same, whereas samples drawn on different dates are found to vary. Accordingly, the information on search indices against the same set of keywords was collected on a daily basis for thirty days to understand the variation in search intensity. Further, the sample-resample scheme, popularly known as bootstrapping, was applied using these thirty samples to derive credible estimates of population parameters. Bootstrapping is defined as a metric which is derived based on the random samples drawn from a population with replacement. Bootstrapping is extensively used in statistics to derive a more precise estimate of population parameters. However, the underlying assumption of independence of sample members should be ensured for an unbiased estimate of population parameters. Bootstrapping can be of two types-parametric and non-parametric. Parametric bootstrapping is one where the underlying distribution of the population is known; its non-parametric counterpart extends the resampling mechanism under a non-parametric domain without assuming any particular form of distribution of the population. In this paper, a thousand instances of sample size of thirty were drawn, with a replacement for each keyword for every month. The median search intensity was calculated from each of these thousand bootstrapped samples for every time point. Due to the statistical regularity condition of the bootstrap procedure, the estimated median estimate is expected to provide a precise estimate of population search intensity. Further, the estimate of population average and standard deviation of the search intensity were derived from these bootstrapped samples for each keyword. Shortlisting Keywords Based on information content The first stage of shortlisting keywords from the long list was carried out based on the information content of these individual keywords about the demand conditions of the real estate sector. Higher search intensity is expected to indicate higher demand in the sector and is thereby likely to indicate higher sales growth. However, some users may search just to cross-check price movement or for any other purposes which may not translate into actual activity in the sector. Therefore, a judicious view needs to be taken to extract the information content from such an ensemble list and validate the same against realised growth figures. Autoregressive distributed lags (ARDL) technique was used to check the search momentum against target variable (i.e., sales growth). The ARDL framework can be illustrated as: where Sit is the year-on-year (y-o-y) growth of search intensity corresponding to ith keyword and ΔSalest is the real sales growth of real estate companies. The real sales growth has been derived by deflating the nominal sales growth by WPI headline inflation. The specification in equation (2) regresses sales growth on its own lag and the search intensity; it ignores the impact of other macroeconomic factors. Hence, robust standard error has been used to take care of heterogeneity in the residual structure. The coefficient is expected to be significant with a positive sign for those keywords where higher search volume translates into higher sales growth. Accordingly, all those keywords, for which the above condition is satisfied, have been shortlisted in the first stage. In the second stage, we selected only those keywords where the news content of search intensity was found to be higher. The noise in the search intensity indices can offset the information and therefore should be removed from the analysis. This paper validates the level of noise content of each keyword. If the inter-sample variation of the search intensity is found to be higher, the news content of the keyword search intensity can be lower than the noise component. Thus, this paper incorporates another level of filtration of keywords using an equivalent measure of news-to-noise ratio. Following Carrière-Swallow and Labbé (2011), the inter-sample variation has been measured in terms of ratio of average to standard deviation (i.e., inverse of coefficient of variation, also called Rose criteria). A higher value of Rose criteria would indicate higher news-to-noise ratio. A threshold of (+/-) 55 has been used on Rose criteria to determine the significant keywords exhibiting higher news content. Consolidation of search intensity across keywords to derive a search propensity indicator After finalizing the keywords pool, the next task is to derive a composite indicator of search intensity. As different keywords may be used to search for a particular activity in the sector by different users, inference drawn using a single keyword may not capture search intensity completely. At the same time, the problem of degrees of freedom creeps in when more keywords are used in the empirical models. An optimal trade-off between these two extremes can be achieved using a single indicator of search intensity which reflects the aggregate effect of the selected keywords. Such a composite indicator is useful to augment the information set of nowcasting framework bypassing the degrees of freedom problem. The composition of search intensities has been derived using three different approaches, namely: a) Simple average approach: In this approach, search intensities of all selected keywords are aggregated using equal weightage as follows: Here Rit is the scaled search intensity of ith keyword at time point t. b) Weighted average approach: One of the major drawbacks of using equal weightage is the assumption that every keyword contributes equally to the index. However, in reality, the search index of each keyword can exhibit different statistical properties and hence should be combined using a weighting diagram. While there could be many weighting pattern to choose from, inverse of variation seems to be a credible choice of the same. The significance of inverse variation is that, volatility, being a measure of noise, will reduce variation in a composite indicator. Inverse of the variation, therefore, can be considered as a measure of news. Using this approach, the composite search propensity indicator can be derived as: 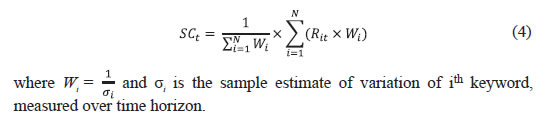 c) Principal Component Analysis (PCA): The dependence structure of search intensities across keywords, reflected in the correlation matrix, can be suitably transformed to reduce the dimensionality in such a manner that there is minimum loss of information. PCA provides an effective mechanism to extract orthogonal factors from the larger information set in such a manner that top factors explain the majority of variability in the information domain. However, inclusion of just one factor is likely to be sub-optimal as loss of information remains a major threat. The composite indicator, therefore, can be calculated as: where Git is the estimated ith factor at time t and vi is the proportional variability explained by ith factor. Nowcasting framework Following Giannone et al., (2008), nowcasting of real estate sales growth has been devised where the high frequency economic indicators are augmented with the composite google search index in the regressor set. Any typical nowcasting problem starts with projecting the target series (real estate sales growth in this paper) using the available information set. Giannone et al., (2008) suggested using DFM for nowcasting. One of the major advantages of DFM is that the curse of dimensionality can be dealt with using the factor setup where the factor estimates are updated at each point of data release. Dynamic factor model (DFM) The factor models are typically expressed as follows: Nowcasting using bridge model Once the factor estimates are available, the factors are linked with the target variable (i.e., quarterly sale growth of real estate companies) using the following bridge equation which can be used to forecast the sales growth of real estate companies using the latest available estimate of the factors. Here, the bridge equation is first estimated using the complete panel of observations; the estimates of the parameters help in assessing the impact of information on analysing the past growth pattern. Once the bridge equation is estimated, the estimated factor values are used for determining the quarterly sales growth projection of real estate companies. Selection of other economic indicators to facilitate nowcasting Apart from the search intensity data, the nowcasting exercise also needs to consider information on other economic variables influencing the growth of the real estate sector. Stock and Watson (2002a, 2002b) suggested the inclusion of a comprehensive set of economic indicators within the DFM framework. DFM has been developed on the principle of extracting information set (also called factors) from large number of variables which represent the common dynamics explaining the variability of the data. Thus, the information content of each variable should be cross-checked before being selected in the final pool. One of the most commonly accepted methods to check the nature of dependency is to perform a cross-correlation test. It not only tests the significance of cross-correlations at various lags, but also provides the nature of dependency using the sign of correlation coefficients. In this context, the variables which have significant cross correlation at 0 to 4 lags and have appropriate signs comprise the first-hand selection of pool of variables. However, high cross-correlation affirms a co-movement among the series but does not address one of the major aspects of a business cycle, i.e., the regime switching process, identified as the most critical property of any business cycle indicator by Burns and Mitchell (1946). In view of this, Lahiri and Yao (2006) used turning point analysis using the Bry-Boschan (1971) algorithm. The turning point analysis of the target variable and other economic indicators provides sufficient insights about the different phases of business cycle movement observable in each series. Though Lahiri and Yao (2006) proposed the statistical coherence test for identifying regime changes, for implementation it requires sufficiently large number of observations which were not available for majority of the series. So we rely on visual inspection of regime switches in the target variable and explanatory variables. Any variable (or regressor) having recession and boom regimes during different periods than that of the target series will not be able to predict the turnaround points of target variable efficiently. Hence, the cross-correlation test along with regime switching behaviour would provide sufficient screening of regressors to be selected for nowcasting. Adding up variables based on the above criteria defines a larger pool of variables. However, as identified by Boivin and Ng (2005), adding more and more variables into the data set may not result in improvement of forecasting performance, as some of the variables may be correlated with other variables and may not impact the target variable. Also, if the idiosyncratic components are large and correlated with each other, adding further variables may not result in better accuracy in forecasting. Thus, pre-selection of variables pose crucial challenge for forecasting. Marie (2013) used an elastic net framework using least-angle regression using elastic net (LARS-EN)7 for selecting the regressor. The LARS-EN algorithm typically uses sequential backward selection of variables using the ARDL model for checking the explanatory power of regressors and penalizing L1 and L2 norm8 of regression coefficients. The ARDL framework can be written as: EN9 criteria is represented as: where λ1 and λ2 are the penalty parameters of L1 and L2 norms of regression coefficients. Evaluating forecast performance using rolling forecast The forecast performance of the nowcasting model was measured following the rolling forecast mechanism. In this approach, the training data set was first determined by truncating the time horizon of the study up to a certain point of time. The model is first estimated on the training data set and the fitted model is then used for forecasting one period ahead forecast. The forecast value was then compared against the actual realisation of the target series (sales growth) using a squared error loss function. In the subsequent steps, one observation was augmented with the training data set and the forecast was made for the immediate future time point using re-estimated model. The process is continued till the end of the time horizon under consideration. The rolling root mean square error (RMSE) was estimated as: where M is total number of iterations in rolling forecast. In order to benchmark forecast performance, the nowcasting framework has been evaluated against linear and non-linear time series models which are generally used for short-term forecasting. These time series models, also called naïve models, were used under similar rolling forecast mechanism. Better forecast performance of nowcasting model, however, does not necessarily establish value addition of Google search intensity data in forecasting performance. Therefore, similar nowcasting framework, without using Google as one of the regressors, was framed and a similar rolling forecast mechanism was adopted. The forecast performance of nowcasting models with and without a Google-based index was compared to validate the usefulness of Google search data towards better forecast precision. Section IV
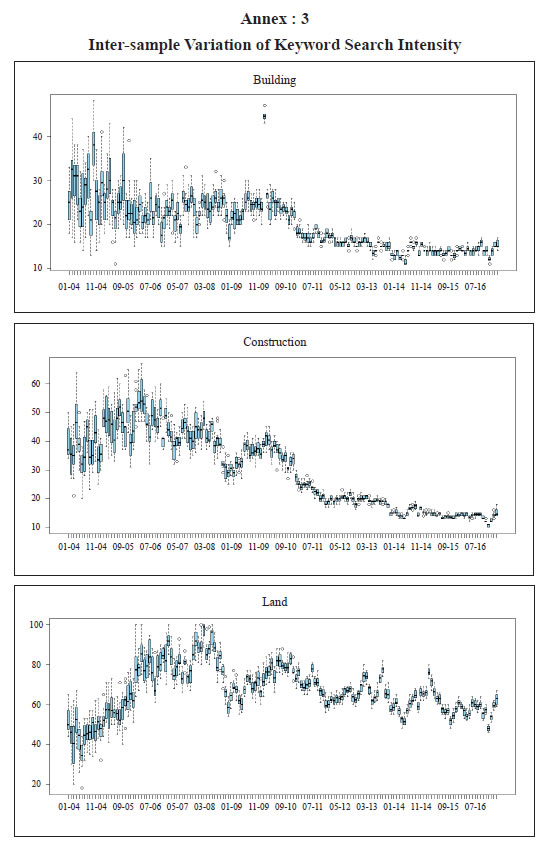
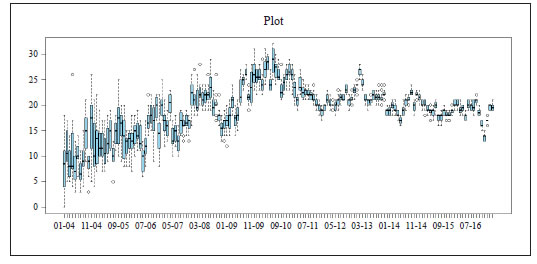
Data The data on target series, i.e., year-on-year (y-o-y) sales growth of real estate companies, is sourced from quarterly financial statements of listed real estate companies that have been considered in the analysis. Since Google Trends provides the search intensity data since 2004, the sales data have been taken from Q1: 2004-05. Due to limited coverage of the real estate companies in the initial period, the data exhibit high volatility till the end of 2010, creating hurdles for empirical exercise (Chart 3). Google keywords As indicated in the previous section, a total of 78 different keywords were considered for the analysis at the initial stage. Monthly search data were obtained from Google Trends. The monthly search data on these 78 keywords was analysed in terms of their inter-sample movements,10 which showed presence of between-sample volatility across the sample period and therefore indicates the possibility of high noise component vis-à-vis news content (Annex 3). The final set of keywords, selected after completing all the steps as discussed above, includes ‘building’, ‘construction’, ’land’, ‘plot’, ‘independent house’, ‘apartment’, ‘real estate’, ‘property for sale’, ‘flat’ and ‘house in Chennai’. Section V
Empirical Findings Google Search Intensity across keywords Once the keywords are selected, non-parametric bootstrapping of search intensity was carried out using 1,000 replications. The bootstrapped median estimate, an estimate of ‘population’ search intensity, indicated that the search volumes varied over time. Further, it was found that inter-sample variation of keyword searches was stable, indicating robustness in the search intensity over time (Chart 4). The momentum of search intensities was found to vary across keywords. The search volume attained peak levels at different time points for different keywords. The changing pattern of search intensity was found to be a reflection of the preferential shift of internet users towards some particular keywords. In this paper, we use a simple and weighted average of search intensities with weights being inverse of variation in the individual search intensities. The inter-quartile range has been used as measure of variation across search intensities in view of the presence of outliers. Apart from the average, the composition methodology was extended to Principal Component Analysis (PCA) harnessing the correlation structure of search intensity across keywords. The first three principal components explaining around 96 per cent of total variation were used for deriving the composite indicators with weights being proportional to variation explained by each factor. 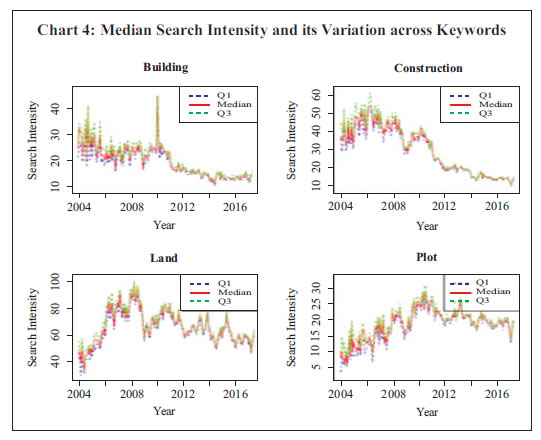 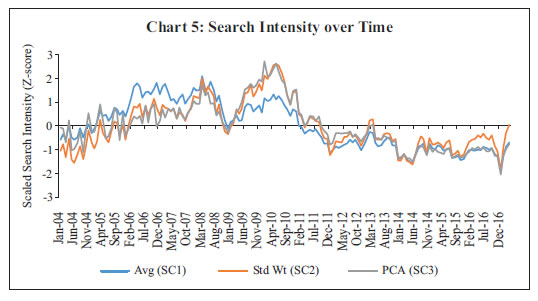 The composite search intensity indicator represents the generalised momentum across selected keywords and, therefore, overcomes the problem of preferential shifting towards any particular keyword. It is, therefore, prudent to analyse the momentum observed in the composite indicator across the time span to draw an inference about the underlying demand conditions of the real estate market. The z score of the composite search intensity derived from simple average, weighted average and PCA approach (say, SC1, SC2, and SC3, respectively) are plotted in Chart 5. All three composite indicators exhibited similar momentum in search intensities. Further, it was observed that the volatility of search volumes moderated and remained range bound since 2011. Nowcasting sales growth The composite indicator from all three approaches was used for nowcasting real estate sales growth. Apart from Google search data, other high frequency indicators were also used to augment search intensity for the nowcasting exercise. The list of such economic indicators is furnished in Annex 2. Nowcasting exercise was carried out on the information set comprising Google data in the first instance and without Google information in the second stage. Initially the Google indicator using simple average approach was used which was later substituted by weighted average and PCA-based indicators for forecast performance comparison. Using Google Search Intensity Following Giannone et al., (2008), factor models with 2, 3 and 4 factors were used for assessing the nowcast performance of target variables for each type of search composite indicator11. The performance using SC1 (i.e., simple average) was evaluated in term of the rolling window approach, extending window length by one quarter after each iteration. It has been observed that the real sales growth has stabilised since 2010 as the coverage of corporates firmed up. Hence, the in-sample fit was carried out using a training set comprising quarterly observations from June 2004 up to March 2013. The framework was used to nowcast the immediate next quarter, i.e., Q1:2013-14. The forecast deviation was calculated by comparing the forecast value of sales growth with the actual observation in Q1:2013-14. Next, the training sample was augmented with one additional observation and nowcasting was carried out for the immediate next quarter, i.e., Q2:2013-14. This process was repeated till the last quarter of 2016. Such an augmentative approach was adopted to utilise the maximum information available till the end of the training data set. Using this rolling forecast mechanism, the forecast values from each of the models were assessed vis-à-vis the actual realisation. The rolling forecast indicated weak performance of 2 and 3 factor models12 compared to the four factor model since 2014-15 for all type of search indicators. The four factor dynamic factor model performed most precisely and was able to track the turn around points of the target variable. Hence, the four factor model is recommended for nowcasting sales growth of real estate companies in the Indian context (Chart 6). Improvement in Forecast Performance due to Google Search With a view to ascertain the utility of Google search intensity, a nowcasting exercise was done using the economic indicators while excluding Google search data. The bridge equation comprising four factors was used in both frameworks to assess the relative improvement in nowcasting due to Google search data. The rolling forecast exercise indicated that the nowcasting framework using Google search intensity performs more precisely in one quarter ahead forecast compared to nowcasting model without Google information particularly since Q1:2016-17 (Chart 7). Comparative Analysis of forecast performance The rolling forecast performance using simple average and weighted average composite indicators followed a similar pattern during time horizon from Q1:2013-14 onwards. However, the forecast performance of the PCA-based composite indicator was found to be imprecise compared to the other two methods (Table 1).
| Table 1. Rolling Forecast Performance of Different Models | | Models | Average RMSE | | Simple average | Weighted Average | PCA | | Using Google Data | | 2-factor model | 17.8 | 17.1 | 21.1 | | 3-factor model | 15.5 | 15.1 | 23.1 | | 4-factor model | 9.7 | 9.0 | 16.5 | | Without using Google Data | | 2-factor model | 18.2 | 18.0 | 22.0 | | 3-factor model | 16.7 | 16.5 | 24.2 | | 4-factor model | 12.5 | 11.5 | 17.2 | The performance of the nowcasting model (using weighted average composite indicator) was also assessed against naïve models. Following the better forecast performance, the four factor model was used for validating any improvement in forecast precision using Google data. The forecast precision of the nowcasting framework was found to be better than the naïve models (Table 2). | Table 2. Rolling RMSE of Nowcasting Model with Naïve Models | | Models | Average RMSE | | Using Google Data | | 2-factor model | 17.1 | | 3-factor model | 15.1 | | 4-factor model | 9.0 | | Naïve Models | | ARIMA | 18.5 | | SETAR | 17.6 | | LSTAR | 17.8 | | Neural network | 17.2 | Section VI
Concluding Remarks The internet has emerged as a major medium of information search in the last decade in India. As users take recourse to internet searches for various kinds of information, the search intensities are likely to exhibit demand conditions of the concerned sector. The seminal paper by Choi and Varian (2012) unveiled the potential of the search data for nowcasting-related economic activities. The approach was later extended to nowcast different macroeconomic variables by different researchers across countries. However, the majority of such studies were confined to advanced economies. This paper, the first in the Indian context to the best of our knowledge, is an attempt to explore and apply the information content of these search intensities, to assess the current state of economy of a particular sector. As the majority of EMEs lack adequate availability of high frequency data for tracking economic activities, Google search data is likely to provide a possible solution. This paper observes that search intensities provide valuable insight in terms of assessing the current state of the economy. Further, the performance of the nowcasting framework using Google data showed improvement over naïve models and can, therefore, be suitably used to bridge the data gap for policy formulation. However, the nature of the sampling scheme used by Google to create the index, being unknown, may pose challenges in assessing the volatility of the search data. Therefore, this paper suggests incorporating bootstrapping to control the inter-sample variation. Google search data is found to provide real time insights to the policy makers. However, the utility of using such data depends on other preconditions, namely, internet penetration, user base volume and representativeness of the user base in terms of spatial diversity. These factors are critically important, particularly for EMEs, where the use of internet has gained considerable volume only in recent times. Another major challenge in using Google data lies in the fact that the search queries are dictated by behavioural dynamism and therefore differ across users. Bootstrapping addresses such variability estimation using statistical techniques, but behavioural patterns remain mostly untraceable. Hence, the news-to-noise ratio of a search would be difficult to assess, particularly during various turning points in the economy. Extracting noise out of the search data remains an open area of research.
References Altissimo, F., A. Bassanetti, R. Cristadoro, M. Forni, M. Hallin, M. Lippi, L. Reichlin (2001). ‘EuroCOIN: A real time coincident indicator of the Euro area business cycle’, No. 3108, CEPR Discussion Papers. Available at:
https://cepr.org/active/publications/discussion_papers/dp.php?dpno=3108 (last accessed June 29, 2018). Angelini, E., Camba-Mendez, G., Giannone, D., Reichlin, L. and Rünstler, G. (2011). ‘Short-term forecasts of euro area GDP growth’, Econometrics Journal, Volume 14 Issue 1 Pages C25–C44. Askitas, Nikolaos and Klaus F. Zimmermann (2009), ‘Google Econometrics and Unemployment Forecasting’, IZA DP No. 4201, June 2009. Baffigi, A., Golinelli, R., and Parigi, G. (2004). ‘Bridge models to forecast the euro area GDP’, International Journal of Forecasting, 20(3): 447–60. Bai, J. (2003). ‘Inferential theory for factor models of large dimensions’, Econometrica, 71(1): 135–71. Bai, J., and Ng, S. (2002). ‘Determining the number of factors in approximate factor models’, Econometrica, 70(1): 191–221. Banbura, M., Giannone, D., Modugno, M. and Reichlin, L. (2013). ‘Nowcasting and the real-time data flow’, No. 1564, Working Paper Series, European Central Bank. Barhoumi, Karim et al., (2008). ‘Short-term forecasting of GDP using large monthly data sets – A pseudo real-time forecast evaluation exercise’, Occasional Paper Series, No. 84, European Central Bank. Bates, B.J., Plagborg-Moller , M., Stock, J. H., Watson, M. W. (2013). ‘Consistent factor estimation in dynamic factor models with structural instability’, Journal of Econometrics, Volume 177, Issue 2, December 2013, Pages 289-304. Bhattacharya, R., Pandey, R. and Veronese, G. (2011). ‘Tracking India growth in real time’, Working Paper No. 2011–90, National Institute of Public Finance and Policy. Boivin, J. and Ng, S. (2005), ‘Understanding and comparing factor-based forecasts’, International Journal of Central Banking, vol. 1, Issue 3, pp. 117–151. The Boston Consulting Group (BCG) and Retailers Association of India (RAI) (2017). ‘Decoding the digital opportunity in retail’. Available at:
http://image-src.bcg.com/BCG-RAI-Decoding-the-Digital-Opportunity-in-Retail-Feb-2017_tcm9-145420.pdf (last accessed June 27, 2018). Carrière-Swallow, Yan, and Labbé, Felipe (2011). ‘Nowcasting with Google Trends in an emerging market’, Journal of Forecasting, 32(4): 289-98. Central Statistics Office (2011), “Methodology of Compiling Quarterly GDP Estimates”,
http://mospi.nic.in/sites/default/files/press_releases_statements/Methodology_doc_for_compilation_of_Quarterly_GDP_28july17.pdf Chakravartti, P., and Mundle, S. (2017). ‘An automatic leading indicator based growth forecast for 2016–17 and the outlook beyond’, Working Paper No. 193, National Institute of Public Finance and Policy. Choi, H., and Varian, H. (2012). ‘Predicting the present with Google trends’, Economic Record, 88(1), Issue s1, pages 2-9. Chow, G.C., Lin, A. (1971). ‘Best linear unbiased interpolation, distribution, and extrapolation of time series by related series’, The Review of Economics and Statistics, 53(4): 372–75. Croushore, D., and Stark, T. (2001). ‘A real-time data set for macroeconomists’, Journal of Econometrics, 105(1): 111–30. D’Agostino, A., and Giannone, D. (2006). ‘Comparing alternative predictors based on large-panel dynamic factor models’, Working Paper Series 680, European Central Bank. D’Agostino, A., Giannone, D. and Surico, P. (2006). ‘(Un) predictability and macroeconomic stability’, Working Paper Series 605, European Central Bank. D’Amuri, Francesco and Marcucci, Juri, (2012), The predictive power of Google searches in forecasting unemployment, No 891, Temi di discussione (Economic working papers), Bank of Italy, Economic Research and International Relations Area. Della Penna, N., and Huang, H. (2009). ‘Constructing consumer sentiment index for U.S. using Google searches’, Working Papers 2009-26, Department of Economics, University of Alberta. Doz, C., D. Giannone and Reichlin, L. (2011). ‘A step-step estimator for large approximate dynamic factor models based on Kalman filtering’, Journal of Econometrics, Volume 164, Issue 1, September 1, 2011, Pages 188-205. Eichler, M., Motta, G. and Sachs, R. von (2011). ‘Fitting dynamic factor models to non-stationary time series’, Journal of Econometrics, Volume 163, Issue July 1, 2011, Pages 51-70. Evans, M. D. D. (2005). ‘Where are we now? Real-time estimates of the macro economy’, International Journal of Central Banking, 1(2): 127–75. Fondeur, Y., and Karame, F. (2013). ‘Can Google data help predict French youth unemployment?’, Economic Modelling, Volume 30, January 2013, Pages 117-125. Forni, M., Giannone, D., Lippi, M. and Reichlin, L. (2007). ‘Opening the Black Box: Structural factor models with large cross-sections’, Working Paper Series, no 712 / January 2007, ECB. Gawlik, E., Kabaria, H., & Kaur, S. (2011). Predicting tourism trends with Google Insights.
http://cs229.stanford.edu/proj2011/GawlikKaurKabaria-PredictingTourismTrendsWithGoogleInsights.pdf. Geweke, J. (1977), “The Dynamic Factor Analysis of Economic Time Series,” in Latent Variables in Socio-Economic Models, ed. by D.J. Aigner and A.S. Goldberger, Amsterdam: North-Holland. Giannone, D., Reichlin , Lucrezia and Small, David (2005). ‘Nowcasting GDP and inflation: The real-time informational content of macroeconomic data releases’, Finance and Economics Discussion Series, Divisions of Research & Statistics and Monetary Affairs, Federal Reserve Board, Washington, D.C. Giannone, D., Reichlin , Lucrezia and Small, David (2008). ‘Nowcasting: The real time informational content of macroeconomic data’, Journal of Monetary Economics, Volume 55, Issue 4, May 2008, Pages 665-676. Huang, Jih-Jeng, Gwo-Hshiung Tzeng,Chorng-Shyong Ong (2006). ‘A novel algorithm for dynamic factor analysis’, Applied Mathematics and Computation, Volume 175; Issue 2: Pages 1288–1297. Humphrey, B. D. (2011). ‘Forecasting existing home sales using Google search engine queries’, Ph.D thesis, Duke University. Kabundi, Alain, Nel , Elmarie and Ruch, Franz (2016), “Nowcasting Real GDP growth in South Africa”, ERSA working paper 581, Economic Research Southern Africa. Kitchen, John & Monaco, Ralph (2003). “Real-Time Forecasting in Practice: The U.S. Treasury Staff’s Real-Time GDP Forecast System”, MPRA Paper 21068, University Library of Munich, Germany, revised Oct 2003. Koenig, E. F., Dolmas, S. and Piger, J. (2003). ‘The use and abuse of real-time data in economic forecasting’, The Review of Economics and Statistics, 85(3): 618–28. Lahiri, K., Yao, V. W. (2006). ‘Economic indicators for the US transportation sector’, Transportation Research Part A, Volume 40, Issue 10, December 2006, Pages 872-887. Lahiri, K., and Monokroussos, G. (2011). ‘Nowcasting US GDP: The role of ISM business surveys’, International Journal of Forecasting, Volume 29, Issue 4, October–December 2013, Pages 644-658. Liebermann, Joelle (2012), “Real-time forecasting in a data-rich environment”, MPRA Paper No. 39452, posted June 14, 2012. Bessec, M. (2013). ‘Short-term forecasts of French GDP: A dynamic factor model with targeted predictors’, Journal of Forecasting, Volume 32, Issue 6, 500–511. Marcellino, M., Stock, J. H. and Watson, M. W. (2003). ‘Macroeconomic forecasting in the Euro area: Country specific versus area-wide information’, European Economic Review, 47(1): 1–18. McLaren, Nick and Shanbhogue , Rachana (2011), ‘Using Internet Search Data as Economic Indicators’, Bank of England Quarterly Bulletin No. 2011 Q2. Negro, M. D., and Otrok, C. (2008). ‘Dynamic factor models with timevarying parameters: Measuring changes in international business cycles’, Staff Report, Federal Reserve Bank of New York. Orphanides, A. (2002). ‘Monetary-policy rules and the great inflation’, American Economic Review, 92(2): 115–20. Runstler, G., and Sedillot, F. (2003). ‘Short-term estimates of Euro area real GDP by means of monthly data’, Working Paper Series 276, European Central Bank. Sargent, T.J., and Sims, C.A. (1977), “Business Cycle Modeling Without Pretending to Have Too Much A-Priori Economic Theory,” in New Methods in Business Cycle Research, ed. by C. Sims et al., Minneapolis: Federal Reserve Bank of Minneapolis. Sanyal, A., and Das, A. (2017). ‘Nowcasting sales growth of manufacturing companies in India’, Applied Economics, Volume 50, Issue 5, 510–526. Silvia, J. E., and Lahiri, K. (2011). ‘Transportation indicators and business cycles’, Business Economics, 46(4): 260–61. Stock, J. H. and Watson, M. W. (2002a). ‘Forecasting using principal components from a large number of predictors’, Journal of the American Statistical Association, 97(460): 147–62. — (2002b). ‘Macroeconomic forecasting using diffusion indexes’, Journal of Business and Economics Statistics, 20(2): 147–62. Suhoy, T. (2009). ‘Query indices and a 2008 downturn: Israeli data’, Discussion Paper No. 2009-06, Bank of Israel. Varian, H. R. (2014). ‘Big data: New tricks for econometrics’, Journal of Economic Perspectives, Volume 28, Issue 2, Spring 2014, pp 3-28 Vosen, S., and Schmidt, T. (2011). ‘Forecasting private consumption: Survey-based indicators vs. Google Trends’, Journal of Forecasting, 30(6): 565–78. Zou, H., and Hastie, T. (2004). ‘Regularization and variable selection via the elastic net’, Journal of Royal Statistical Society, Series B, Volume 67, Issue 2, pp 301-320.
Annex : 1
Queries used in Google Trends | | independent house | www.magicbricks.com | BHK flat | | Building | www.sulekha.com | 1 BHK | | construction | www.99acres.com | 2 BHK | | Flat | estate agents | 3 BHK | | apartment | property dealers | 1 RK | | land | independent house in Mumbai | housing society | | land for sale | independent house in Bangalore | brokerage | | real estate | independent house in Chennai | SRA | | property sale | independent house in Kolkata | lease | | property | independent house in Delhi | storey building | | property for sale | flat in Chennai | farm house | | house | flat in Mumbai | real estate in Mumbai | | house for sale | flat in Bangalore | real estate in Chennai | | home | flat in Delhi | real estate in Bangalore | | home for sale | flat in Kolkata | real estate in Kolkata | | home loans | plot in Mumbai | real estate in Delhi | | plot | plot in Chennai | property in Mumbai | | plot for sale | plot in Bangalore | property in Chennai | | mortgage | plot in Kolkata | property in Bangalore | | north facing | plot in Delhi | property in Kolkata | | furnished | house in Mumbai | property in Delhi | | fully furnished | house in Chennai | land in Mumbai | | partially furnished | house in Bangalore | land in Bangalore | | south facing | house in Kolkata | land in Kolkata | | east facing | house in Delhi | land in Chennai | | west facing | India property | land in Delhi |
Annex : 2
Economic indicators used for nowcasting | | Index of Industrial Production (IIP) | IIP Manufacturing | | IIP Basic Goods | IIP Electricity | | IIP Capital Goods | IIP Consumer Durables | | IIP Intermediate Goods | IIP Consumer non-durables | | IIP Manufacturing NIC-2 digit level | Cement Production | | Steel Production | Eight Core Industries | | Baltic Dry Index | Cargo handled at major ports | | Commercial Motor Vehicle Production | Commercial Motor Vehicle Sales | | Passenger Car Production | Passenger Car Sales | | Three wheeler Production | Three wheeler Sales | | Two wheeler Production | Two wheeler Sales | | Air Traffic (Passenger) | Air Traffic (Cargo) | | Foreign tourist arrival | Railway freight | | WPI Headline Inflation | WPI Core Inflation | | Merchandise export | Non-oil Import | | Non-oil Non-gold import | Aggregate deposit | | Bank credit | Currency in circulation | | Currency with public | Demand deposits | | Reserve money | Narrow money | | Broad money | Non-food credit | | Call money rate | 10 year G-Sec yield | | PMI Manufacturing | PMI Services | | PMI New order (Mfg) | PMI output (Mfg) | | PMI input price (Mfg) | PMI Output price (Service) |
|