|
Abstract: The implementation and refund delays under the new tax regime of Goods
and Services Tax (GST) seem to have led to working capital constraints for firms, which in
turn might have hurt their exports in October 2017. We provide evidence supporting this
hypothesis using sectoral data on exports and find sectors that have high working capital
requirements took the maximum hit during this period. However, various initiatives by
the Government of India since then appear to have significantly alleviated exporters’
concerns which got reflected in the exports growth pick up in November and December
2017.
1 Introduction
India embarked on a new tax regime from July 1, 2017. With the advent of the new indirect
tax structure, there has been a growing interest to understand the impact of the new regime
on business activity in the economy, both in the short and long run.
The GST implementation, in the beginning, was marred by infrastructure snags and
implementation delays, which led to changing the date of filing tax returns for July multiple
times. Finally, firms were required to file their returns by 30th September under the last
revision. As per the implementation of the tax regime, exporters were supposed to get 90%
of the input tax refund within seven days of filing their returns. However, there had
been significant delays in receiving the input tax credit according to various reports, which
could have adversely affected the working capital of firms. This implies that the sectors
with high working capital requirements could have been hit more severely due to non-refunds than
those with low working capital requirements.
 To elaborate further, the impact of the implementation issues is more evident and severe
for the exporters. Prior to GST, the exporters were upfront exempted from paying any
duties. Now, under GST, they are required to first pay the tax and later claim refunds.
This constrained their working capital, at least once after the regime switch, since exporters
would have had to adjust to the new tax regime. Under GST, they can avail 90% of the
input tax refund within 7 days, but only after the goods are exported out of India.
The refunds filed in the month of July were sanctioned to the creditors only in late
October and November (CBEC Report). This could have jeopardized the working capital
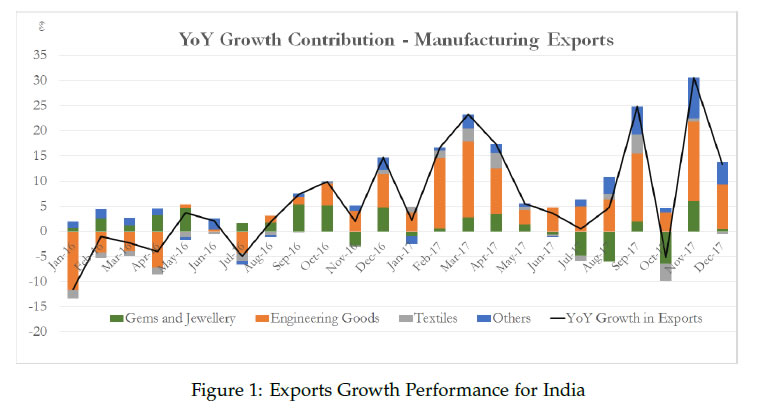
financing of the firms during the intermediate period between filing and refunds. If the first
round of refunds got blocked after tax filing in September, it would have started hurting
the firms’ working capital only around October 2017. This is reflected in the exports growth
number in October 2017, which declined to -1.2% (year-on-year) as shown in Figure 1 and
was broad based.
The relationship between the financial health of firms and exports decision has been
widely studied in trade literature. Beginning with Greenaway et. al. (2007) and recently
Wagner (2014), there has been ample evidence that exporting firms are less financially constrained than non- exporting firms. This study is different from the above strand of literature
because it analyzes the immediate impact of a temporary shock to exporters, which
has negative effect in the short run but might not have any long run impact.
Interestingly, exports growth showed a big revival in November and increased by 30.5%
(year-on-year). This is partially explained by the base year effect of low exports in November
2016 (demonetization month) and active intervention of the government in expediting the
refund claims of the exporters in November 2017. In December 2017, exports growth stood
at 13.3%, showing signs of continued growth, albeit, with moderation.
In the next section we present the data and the methodology. Section 3 provides the
main results, while section 4 explains the exports rebound in November and December
2017. Section 5 gives robustness results and preliminary evidence for our hypothesis from
firm level data. Finally, Section 6 concludes.
2 Data and Methodology
Were the sectors with high working capital requirement more severely hit by the lack of
tax refunds than the sectors with a low working capital requirement? We answer this using
trade data for exports which are available on a monthly level. We use the monthly trade
data on principal commodities published by the Ministry of Commerce. The production
information for the domestic economy is not available at a monthly frequency and hence
similar analysis cannot be performed there.
Apart from information on trade, we also used data on working capital at the sectoral
level. We calculate it using firm-level data from CMIE Prowess, which primarily consists of
publicly listed firms as well as some private limited companies. We calculate the average
working capital to sales ratio for each firm active during 2010-2016 and then use the median
for all firms as the benchmark sectoral ratio. After matching the two data sources, we are
left with a total of 17 sectors.
We have listed the median working capital/sales ratio for various sectors in Table 2. The
sectors related to food products, like Marine or Meat, Dairy and Poultry, are less working
capital intensive and have the lowest working capital/sales requirement. Electronics
and Engineering goods sectors are median in terms of this requirement, while Gems and
Jewellery and Petroleum have the highest need for working capital.
To test our central hypothesis, we look at the difference in export growth between October
and March 2017 for different sectors and see if this is correlated with the size of working capital to sales ratio. More precisely, we check whether (working capital/sales)i ratio for
sector i helps explain the sectoral variation in the following double difference:
The object in above equation (1) is a difference in difference variable, where the first
difference captures the change in exports between October and March 2017, i.e. impact of
GST, while the second difference corrects for seasonality. If the GST implementation has
led to an export deterioration in October 2017 due to the mechanism espoused above, then
we would expect a negative correlation between the above double difference and working
capital to sales ratio.1
We believe that differencing against January, February or March 2017 is the most suitable
one for this exercise as it avoids November and December 2016, the period of demonetization,
as well as the months just prior to July, when GST was implemented. The months
around demonetization and those just before GST implementation were marred by policy
breaks and could bias our results.
3 Results
We give the scatter-plot of the difference in exports growth between October and March vs
working capital to sales ratio in Figure 2. Each dot on the plot represents a sector. We can
clearly see that the relationship between the difference in export growth and working capital
to sales ratio is negative in this graph and has a slope coefficient of -0.18. Notwithstanding
the data limitation, it roughly implies that a 10% increase in the Working Capital/Sales ratio
led to a 1.8% decrease in the exports growth. Thus the sectors with high working capital
to sales ratio indeed took the biggest hit in exports growth between March and October.
For example- Petroleum and Gems and Jewellery have the highest working capital/sales
requirement and they were hit the most during October as reported in Table 2. Meat,
Dairy and Poultry on the other hand have low need for working capital and saw one of the
smallest decrease in exports growth. This result is robust and consistent even if we take a
difference between October 2017 and other months like January or February 2017.
But this graph is not sufficient to establish the causality as it is possible that we are
getting this relationship due to some other event which might have happened around the same time. To rule out such possibilities we do a placebo test in order to further establish
the relationship.
Given that the GST filing was supposed to be completed by the end of September, so,
working capital constraints would have hit the firms only towards the end or post- September,
when the refunds became due. We can thus use the growth difference for August and
September with March and test if a similar relationship holds with working capital to sales
ratio.
The results of the placebo test are shown in Figure 4 (Appendix) and favour our hypothesis.
As one can see, there is no significant relationship between exports growth difference
between September and March. Thus, it shows that there was a big event around October,
which suddenly generated this relationship between exports difference and working capital to sales ratio. It is less likely that any event other than GST could have generated a negative
relationship between exports and working capital to sales ratio for so many sectors in
October in such a brief period of time.2
4 The Rebound
Post dismal performance of exports in October, November 2017 exhibited a whopping
30.55% growth. This is one of the highest growth rates observed in the exports in the
last two years. There are two possible reasons for this export rebound: (i) fast-tracking of
GST refunds and exports sops and (ii) lower base of export growth in November 2016.
The exports growth in November 2016 was dismal at 2.6% and hence delivered a favourable
base effect of 14.2% for November 2017. The rest of the exports rebound can thus be accounted
for by the fast-tracking of GST refunds in November thus ending the period of economic
uncertainty which affected firm’s decision making after GST implementation. Post
export slowdown in October 2017, apart from expediting input credits the government also
announced a slew of measures to check export deterioration3. According to the recent press
release by the Central Board of Excise and Customs (CBEC, 29th November 2017), the majority
of tax credits filed in the month of July have now been sanctioned in November. The
report claims that CBEC has been working "seemlessly" to credit the IGST refund claims to
the tune of Rupees 6500 crores for the month of July, August and September.
We think that the expedition of GST refunds for exporters through active intervention
by the government slackened the working capital constraints, thus allowing the exporters
to finally fulfill their delayed export orders. This explains some part of the sharp rebound
in exports growth in November 2017. December 2017 numbers also continue to follow the
increased trend.
Since the working capital constraints got relaxed during November 2017, the high working
capital sectors which were the most constrained in October 2017, should return to their
long run growth path and register the biggest jump in their exports growth in November
2017. This can be seen in Figure 3, where we plot exports growth difference be- tween
November-October 2017 against the working capital to sales ratio. We find that indeed the
sectors with highest working capital requirements showed the highest exports growth rebound in November 2017. Also, the exports growth difference between December- November
2017 does not depend on working capital (Figure 5, top) thus implying that working
capital constraint lost its significance in predicting sectoral exports growth in December
2017. Both these graphs provide further evidence that the GST shock led to one period
deterioration in exports growth.
5 Robustness: Firm Level Evidence
To further dig into this issue, we looked at firm level data from CMIE Prowess to find firms’
reaction to working capital constraints, or whether such constraints actually hit the firms in Q3 and Q4 2017 (we are using calendar year notation in the whole analysis). We used
quarterly data from Q1 2014-Q3 2017 as reported in interim financial statements by firms.
Since the firms showed negative exports growth in October, any financial constraints should
be reflected in the financial statement prepared at the end of Q3 2017, i.e., September 2017.
We look at three crucial firm level variables- short term borrowings, ‘cash and bank
balance’ and capital expenditure. If GST led to a negative liquidity shock, we should expect
firms to increase their short term borrowings, run down their cash and bank balances and
reduce their capital expenditure. We run the following regression to test our hypothesis:
Columns (1) and (2) in Table 1 show the impact of GST on the short term borrowings
of firms. The coefficient on Dummy (Sep ’17) is insignificant, showing no direct impact of
GST, though 2 is significant in column 2 and shows a small but positive impact on short
term borrowings, i.e., firms in sector with high working capital requirements increased
their short term borrowing in September 2017. Here, it is important to mention that this
regression is conditional on firms’ reporting short term borrowings. So, the short term
borrowings increased for those firms that actually borrowed during this period as well as
in the past.4
We also find that in Q3 2017, firms reduced their ‘cash and bank balance’ during this
period as reflected in β1 coefficient in columns 3 and 4, although, in this case working
capital/sales ratio plays no role in firms’ decision-making as reflected by the fact that β2
is not significant in both these specifications. The results on cash and bank balance is fairly robust as Q3 2017 is among the few periods where the dummy variable on quarter
is significant. Lastly, the quarter dummies are negative though insignificant in the case of
capital expenditure as shown in columns 5 and 6, which suggests that capital expenditure
was not a dominant channel in this period..
| |
Log(Short
Term Borrowing |
Log(Cash and
Bank Balance) |
△
(Log Capital) |
| |
(1) |
(2) |
(3) |
(4) |
(5) |
(6) |
| D(Sep 17) |
0.00421
(0.115) |
-0.0386
(0.124) |
-0.171***
(0.065) |
-0.193***
(0.0702) |
-1.392
(0.739) |
-1.388
(0.738) |
D(Sep 17)*
WC Ratio |
|
0.00312**
(0.001) |
|
0.00177
(0.0006) |
|
0.000239
(0.0002) |
| Firm FE |
Yes |
Yes |
Yes |
Yes |
Yes |
Yes |
| Quarter FE |
Yes |
Yes |
Yes |
Yes |
Yes |
Yes |
| Observations |
16,436 |
14,171 |
23,332 |
20,213 |
19,292 |
17,934 |
| ** Significant at 5%, *** Significant at 1%. Errors clustered at firm level. |
| Table 1: Firm Reaction to working capital constraints |
Given these results, we can conclude that firms primarily ran down their cash and bank
balance during Q3 2017 in response to the GST shock. Lastly, it is important to mention
one caveat here. Ideally, we would like to run this analysis for exporting firms, given that
the results reported in the previous section were about exporters. But our sample has very
few exporting firms that report quarterly results, and so we cannot do a robust analysis by
restricting our sample to just the exporting firms. This maybe one of the reasons that we
do not find β2 significant in two out of three specifications above. But overall, this reduced
form analysis gives more confidence and credibility to the primary hypothesis in this study
and signals the presence of liquidity constraints throughout the economy at the end of Q3
2017.
6 Conclusion
This study indicates how a short term liquidity shock could impact firms in the export
sector, which are generally believed to be financially sound. We have shown that the export contributing sectors with high working capital/sales ratio were hit the most due to
these liquidity constraints. It is also corroborated by the various measures adopted by the
government during November to address the concerns of the exporters. Finally, the exports
rebound in November 2017 suggests these quick measures partly addressed the temporary
credit constraints faced by the exporters during October 2017.
Going forward, it would be interesting to look at the generic reaction of firms in response
to working capital crunch. How firms tackled this temporary liquidity crunch can be used
to study their short term borrowing behaviour and liquidity management. With firm level
data, one can also look at heterogeneity in firm response and identify which firms are more
vulnerable to such liquidity shocks. We have provided preliminary evidence for firm level
reaction, which can be further extended in future work.
7 References
Chaney, Thomas (2016), "Liquidity Constrained Exporters", Journal of Economic Dynamics
Control, 72: 141-54.
Greenaway, David, Alessandra Guariglia and Richard Kneller (2007), "Financial factors
and exporting decisions", Journal of International Economics 73 (2), 377-395.
Wagner, Joachim (2014), "Credit constraints and exports: a survey of empirical studies
using firm-level data", Industrial and Corporate Change, Volume 23, Issue 6, 1477–1492.
Central Board of Excise and Customs. Press Release. 29th November 2017
8 Appendix
| Sectors |
Working Capital/Sales |
Export Growth (%) |
| (%) |
Oct-Mar |
Nov-Oct |
Dec-Nov |
| Marine Products |
18.22 |
-34.17 |
23.70 |
-12.75 |
| Meat, Dairy and Poultry |
18.72 |
-14.45 |
7.55 |
70.63 |
| Cereal and Miscellaneous |
30.10 |
10.10 |
35.42 |
-17.96 |
| Textiles |
34.09 |
-35.38 |
24.41 |
-6.53 |
| Organic and Inorganic Chemicals |
36.58 |
6.85 |
31.99 |
-22.92 |
| Plastic and Linoleum |
37.10 |
5.35 |
16.49 |
-24.59 |
| Tea |
40.88 |
-23.72 |
26.43 |
-0.61 |
| Leather and Leather Products |
44.58 |
-9.96 |
10.84 |
9.07 |
| Electronic Goods |
45.41 |
-11.90 |
32.97 |
-21.28 |
| Drugs and Pharmaceuticals |
46.63 |
-14.28 |
22.13 |
-6.44 |
| Engineering Goods |
47.32 |
-34.90 |
31.99 |
-18.44 |
| Coffee |
51.39 |
-5.59 |
15.35 |
-10.28 |
| Ores and Minerals |
52.48 |
-67.27 |
4.60 |
-15.57 |
| Tobacco |
53.74 |
7.91 |
6.81 |
5.28 |
| Ceramic Products and Glassware |
55.21 |
-19.96 |
24.74 |
-5.16 |
| Gems and Jewellery |
60.81 |
-37.04 |
57.19 |
-30.30 |
| Petroleum |
68.34 |
-54.39 |
32.94 |
-22.54 |
| Table 2: Working Capital and Exports Growth |
PRESS RELEASE
29th November, 2017
ON GST REFUND
Exporters have been complaining about delay in grant of refunds pertaining to
Integrated Goods and Services Tax (IGST) paid on goods exported out of India and similarly
Input Tax credit (ITC) on exports. There are media reports with exaggerated estimations of
refund amounts which are held up for the period July to October 2017. It is clarified that the
quantum of IGST refund claims as filed through shipping bills during the period July to
October 2017, is approximately Rs 6500 Crores and the quantum of refund of unutilized
credit on inputs or input services, as per the RFD 01A applications filed on GSTN portal, is
to the tune of Rs 30 Crores.
Refund of IGST:
With regard to IGST paid on goods exported out of India, majority of refund claims
for exports made in July, 2017 where due have been sanctioned. Refund claims of IGST paid
for exports made in August, September and October 2017 are being sanctioned seamlessly
wherever returns have been accurately filed. The prerequisites for sanction of refund of
IGST paid are filing of GSTR 3 B and table 6A of GSTR 1 on the GSTN portal and
Shipping Bill on Customs EDI system by the exporter. It is essential that exporters should
ensure that there is no discrepancy in the information furnished in Table 6A of GSTR 1 and
the Shipping Bill. It has been observed that certain common errors such as incorrect Shipping
Bill number in GSTR1, mis-match of invoice number and IGST amount paid, wrong bank
account etc. are being committed by exporters while filing their returns. These errors are the
sole reason for delay in grant of refunds, or rejection thereof. While information has been
made available to Exporters on the ICEGATE portal if they are registered, they may also
contact jurisdictional Customs authorities to check the errors they have committed in
furnishing information in GST returns and Shipping Bill, and rectify them at the earliest.
As the Customs system is designed to automatically grant refunds without
involvement of any officer by matching information that is furnished on GSTN portal and
Customs system, the onus is on the exporters to fill in all the details accurately. Exporters
may therefore take due precaution to ensure that no errors creep in while filing Table 6A of
GSTR 1 of August 2017 and onwards. The facility for filing GSTR 1 for August 2017 would
also be ready by 4th December 2017. In case of wrong entries made in July, Table 9 of GSTR
1 of August month would allow amendments to GSTR 1 of July 2017.
Refund of Input Tax Credit:
As far as refund of the unutilized input tax credit on inputs or input services used in
making exports is concerned, exporters shall file an application in FORM GST RFD- 01A
on the common portal where the amount claimed as refund shall get debited from the
electronic credit ledger of the exporter to the extent of the claim. Thereafter, a proof of debit
(ARN- Acknowledgement Receipt Number) shall be generated on the GSTN portal, which is
to be mentioned on the print out of the FORM GST RFD-01A and to be submitted manually to the jurisdictional officer. The exporters may ensure that all the necessary documentary
evidences are submitted along with the Form GST RFD 01A for timely sanction of refund.
Exporters are therefore advised to immediately file (a) Table 6A and GSTR 3B, if not
already done, for processing of IGST refund (b) RFD 01A on GSTN portal for refund of the
unutilized input tax credit on inputs or input services used in making exports and (c) GSTR 1
for August 2017 for amending details provided in July GSTR1 wherever required.
Government has taken various measures to alleviate the difficulty and is committed to
providing speedy disbursal.
|