|
Abstract:
In this study, we document the important factors that affect automobile sales growth in India. We find that fuel price movements matter for aggregate growth in automobile sales while credit appears to have no significant impact. The impact of crude prices is also reflected in the market valuation of automobile firms. In addition, we use disaggregated data on vehicle registrations and provide evidence that exogenous policy changes such as vehicle insurance and the maturing of the ride-hailing services segment have generated short-term fluctuations in automobile sales. Overall, we find that the recent slowdown in automobile sales can broadly be explained by high fuel prices and exogenous policy changes.
I. Introduction
The automobile sector is one of the most dynamic sectors in India that contributes significantly to both growth and employment. In addition, it has a large labour-intensive ancillary sector, and has important horizontal and vertical linkages with other industries. The Indian automobile sector has shown phenomenal growth in the past five years, posting an average annual growth of around 8 per cent in the number of domestic vehicle sales. It has not only expanded in the domestic market but has also grown abroad and constituted 2.3 per cent (USD 16.6 billion) of the overall Indian exports in 2018.2 However, domestic auto sales witnessed slower growth in the past few months, especially during the Diwali festive season. This development warrants a critical understanding of the factors that have caused the recent slowdown in the auto sector.
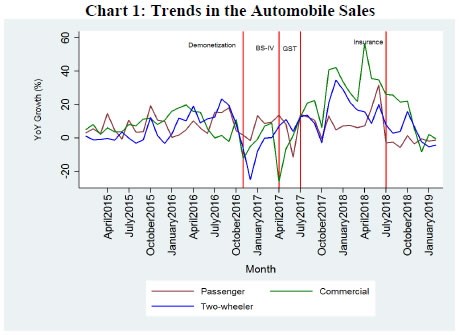
In this study, we first document the broad trends in the auto sector in the recent period between 2015 and 2018 (Chart 1) and the various developments that have influenced auto sales in this period. We then evaluate whether crude prices and credit have any bearing on automobile sales and overall performance of the automobile sector. Both crude prices and availability of credit can influence consumer decisions and have an impact on the overall demand for automobiles.
Between fuel prices and credit, we find that only domestic fuel prices have a lagged (two months) negative impact on auto sales growth. The biggest impact of crude prices is seen on the sales of commercial vehicles and passenger vehicles, suggesting fuel price is more important for these segments compared to two-wheelers. We further show that information on the recent crude price increase helps explain the recent decline in auto sales.
In addition, we look at the impact of crude prices on the adjusted stock market returns of companies in the automobile sector. Our analysis suggests that on average, the valuation of automobile companies takes a hit due to an increase in crude price. In fact, the negative impact of an increase in crude price on the adjusted stock returns of firms in the commercial automobile segment is the highest, which is in line with our results on automobile sales.
In the next part of the study, we evaluate the impact of policy shocks on automobile sales using micro data. For this, we look at district-level vehicle registration data from Karnataka3 which accounts for actual sales (and re-sales) of vehicles, unlike the aggregate data on automobiles sales which records the shipments to dealers. We look at the impact of the recent roll-out of the new insurance regime, which increased the mandatory number of years of third party insurance for new automobile registrations.4 This policy increased the insurance premium at the time of purchase and happened at the same time when crude prices were high which makes it empirically difficult to disentangle the two effects. However, the frontloading of registration as well as a higher impact of this policy on two-wheelers suggest that the increase in insurance premium had a larger negative impact on two-wheeler sales (two-wheelers saw a higher price change due to this policy) compared to four-wheelers.
In addition to the government-induced policy changes, discussed above, we also provide evidence that automobile sales in India were also affected by a surge in ride-hailing services across major cities in India. This development led to a sharp initial rise in new taxi registrations. At the peak, taxis accounted for 6 per cent of total car registrations across these cities. However, post 2015, the roll-out of ride-hailing services as well as the growth of taxis have declined significantly, due to maturity of these services. We show that this alone accounts for a 54 bps decline in car sales during the last two years.
This note is broadly related to two strands of literature on the automobile sector. First, it documents broad trends in the auto sector for India. A comprehensive survey on the auto sector in India relative to its global competitors is given by Narayanan and Vashisht (2008). Second, it is also broadly related to the work on understanding the impact of credit on demand for consumer durables. Ludvigson (1998) uses a vector autoregression (VAR) framework to study the transmission of monetary policy on auto sales (one segment of consumer durables) through auto credit. In addition, this note also quantifies the effect of recent policy developments on the overall auto sector at a disaggregated level. This note is also the first to document the effect of unanticipated policy changes, and the entry of ride-hailing services on automobile sales in the short run in India.
The rest of the study is organized as follows. We present the impact of macro factors (credit and crude prices) in the next section. Section III presents the analysis on the effect of policy shocks and ride-hailing services on automobile sales using regional registrations data. Finally, Section IV presents the conclusion.
II. The Macro Evidence
The automobile sector (sales) has seen a sharp decline in the recent period, as shown in Chart 1. This decline has been registered in all three segments- passenger vehicles, commercial vehicles and two-wheelers. In this section, we look at the fundamental factors that affect automobile sales in the medium term and whether they could also explain this recent decline.
II.1 Fuel prices matter
In this section, we evaluate the macro determinants of automobile sales using aggregate data. We start with the hypothesis that vehicle credit and fuel prices are the two most important observable factors that can affect vehicle sales. Since acquisition of vehicles is a lumpy investment, households might borrow to smooth consumption. Thus, availability of credit is likely to have a positive effect on vehicle sales. Fuel prices, on the other hand, are expected to have an effect on consumer sentiments which in turn may have a negative effect on the purchasing decisions of consumers. We start with the baseline specification given by:
 where the dependent variable (Gr.AutoSales) is the growth in vehicle sales (all growth numbers are in year on year [YoY] terms). We regress this on vehicle credit growth (Gr.Credit) extended by schedule commercial banks (SCBs) and fuel price growth (Gr.Fuelprice)5. Since there is a lag between the decision to purchase a vehicle and the actual purchase due to several administrative processes, we also include two lags of vehicle credit and fuel prices in addition to the contemporaneous terms in the specification. The year (YFE) and month number fixed effects (MFE) control for other time-varying macro-level factors that may affect vehicle sales which we are not controlling for in our specification. We use the same specification for total vehicle sales and different subcomponents of vehicles. The final data comprises 128 observations for the time period April 2008 to January 2019. The data source for each of the variables is provided in the Appendix (Table A.1).
 The results from the baseline specification are reported in Table 1. We find that, on average, automobile credit has no significant impact on automobile sales. This is consistent across all the sub-components of automobiles. Fuel prices, however, show an interesting picture. We find that both contemporaneous and lagged increases in fuel prices have no statistically significant effect on total automobile sales (column 1). This result is mainly driven by two-wheelers (column 5) as they constitute roughly 80 per cent of total vehicle sales. When we focus on automobile sales excluding two-wheelers (column 2), we see a significant impact of fuel prices on automobile sales with a two month lag. This is consistent with both passenger vehicles and commercial vehicles. On average, we find that a 100 basis points (bps) growth in fuel prices today will decrease automobile sales growth (excluding two-wheelers) by 72 bps two months down the line. Thus, by using this parsimonious specification, we find evidence that fuel prices do affect automobile sales (excluding two-wheelers); however the effects are not seen contemporaneously.6
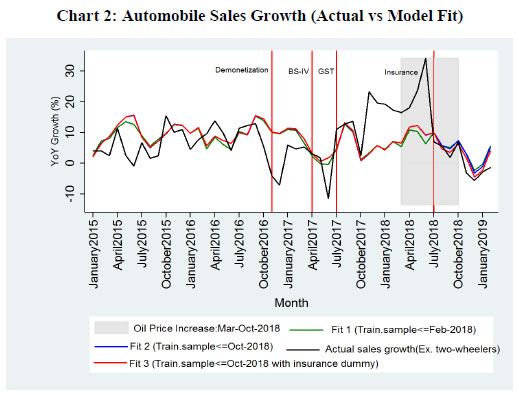
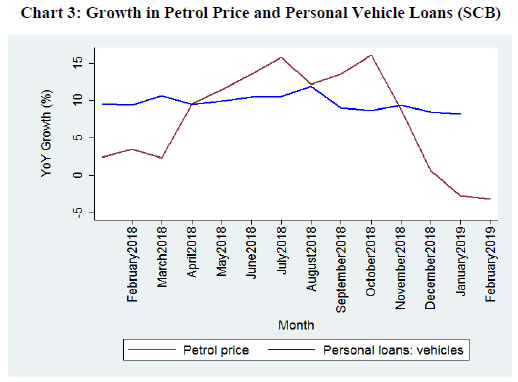
We are further interested in understanding the recent decline in vehicle sales and whether we can attribute this decline to any observable factors. Notice that the recent decline in vehicles started in July 2018 (Chart 2). This decline in vehicle sales was accompanied by an increase in fuel prices (March to October 2018) while vehicle credit (by SCBs) remained almost flat during the same period (Chart 3).
We now use the same specification as in equation (1) and see whether feeding in information on the increase in fuel price from March to October 2018 can explain the decline in vehicle sales. Specifically, we first estimate the baseline specification (1) for the sub-period April 2008 to February 2018 and use these coefficients to predict vehicle sales growth in subsequent months. This is shown by the green line (Fit 1) in Chart 2. The vertical lines in Chart 2 depict the major policy changes since demonetization (November 2016). It includes the introduction of Bharat Stage IV (BS-IV) pollution norms, Goods and Services Tax (GST) and insurance announcement. Since we are mainly interested in the recent decline in automobile sales, we focus on the recent period which includes the increase in fuel prices and the policy shock due to the insurance announcement.
| Table 1: Macro Determinants of Automobile Sales Growth |
| |
Total |
Total Excl. Two-wheelers |
Passenger |
Commercial |
Two-wheelers |
| |
(1) |
(2) |
(3) |
(4) |
(5) |
| Gr. (Fuel price)t |
0.19 |
0.26 |
0.21 |
0.69 |
0.16 |
| |
(0.24) |
(0.26) |
(0.25) |
(0.49) |
(0.25) |
| Gr. (Fuel price)t-1 |
-0.23 |
-0.23 |
-0.04 |
-0.87 |
-0.21 |
| |
(0.32) |
(0.35) |
(0.33) |
(0.65) |
(0.33) |
| Gr. (Fuel price)t-2 |
-0.40* |
-0.72** |
-0.50** |
-1.38** |
-0.32 |
| |
(0.23) |
(0.25) |
(0.24) |
(0.47) |
(0.24) |
| Gr. (Credit)t |
0.07 |
0.05 |
0.03 |
-0.20 |
0.07 |
| |
(0.17) |
(0.19) |
(0.18) |
(0.36) |
(0.18) |
| Gr. (Credit)t-1 |
-0.13 |
-0.01 |
0.00 |
0.07 |
-0.17 |
| |
(0.18) |
(0.20) |
(0.19) |
(0.38) |
(0.19) |
| Gr. (Credit)t-2 |
-0.05 |
0.13 |
0.10 |
0.19 |
-0.09 |
| |
(0.16) |
(0.18) |
(0.17) |
(0.33) |
(0.17) |
| Month FE |
Yes |
Yes |
Yes |
Yes |
Yes |
| Year FE |
Yes |
Yes |
Yes |
Yes |
Yes |
| N |
128 |
128 |
128 |
128 |
128 |
| R2 |
0.49 |
0.58 |
0.53 |
0.58 |
0.45 |
| ** p < 0.05 and *** p < 0.01 |
Second, we run the specification by including the period from March to October 2018, i.e., including the information on fuel price increase and use it to predict vehicle sales growth in subsequent periods (Fit 2). This is represented by the blue line. Lastly, we include a dummy for insurance announcement post July 2018 in the same specification which is shown by the red line (Fit 3). We find that including the information on the recent increase in fuel prices improves the prediction of our model (the blue line (Fit 2) is closer to the actual sales growth than the green line (Fit 1)). Further, we find that including the insurance dummy, the model predicts growth in vehicle sales more closely. Thus, we can conclude that the recent decline in vehicle sales can partially be attributed to both the increase in fuel prices as well as the policy shock of insurance announcement. Interestingly, the fuel prices softened after mid-October 2018 and we see an uptick in automobile sales (excluding two-wheelers) beginning January 2019 (Chart 2).
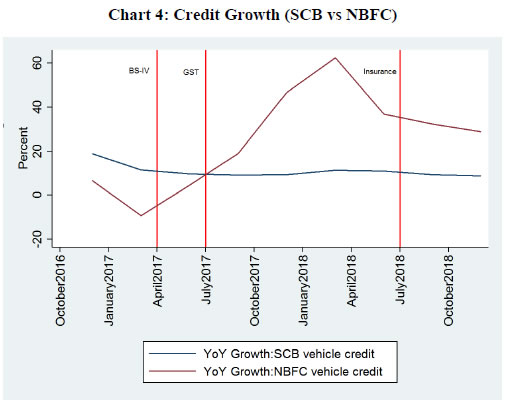
 In the above analysis, we use SCB credit as the dependent variable in our regressions. However, it is important to highlight that the share of vehicle credit by Non Banking Financial Company (NBFC) in the total vehicle credit (Chart A.1 in the Appendix) increased steadily over the last few years. Thus, it would have been ideal to include NBFC credit in the above regressions but the data on NBFC credit is available only at a quarterly frequency since 2015 which would significantly reduce the power of our model. However, Chart 4 clearly indicates that robust growth in NBFC vehicle loans substituted for the decline in SCB vehicle credit growth during the sample period. NBFC vehicle loans grew at a high rate till late 2017. In the recent period, the growth in NBFC vehicle credit might appear to be tapering off since June 2018, mainly because of the base effect, but it is still much higher (around 15 per cent) than the average growth in 2017 and nominal GDP growth rate. Thus, it is unlikely that the recent slowdown in automobile sales growth is driven by the minor blip in the growth of NBFC vehicle credit.
 II.2 Impact on stock market
The above subsection presented an aggregate picture of how fuel prices affect automobile sales. In this subsection, we try to establish a similar link between stock market returns and crude prices using high frequency data. We hypothesize that the market value of firms engaged in the automobile sector will pick up information on the crude price changes and get negatively affected by positive movements in crude price.
We use the daily stock prices of listed firms (April 2010 to January 2019) from Bloomberg and compute the weekly average stock prices of individual firms. Finally, we get 128,979 observations across 281 unique firms and 21 unique sub-sectors (15 unique firms in the automobile sector). Table A.2 in the Appendix summarizes the total number of observations in commercial automobiles, two-wheelers, passenger vehicles, tractors, and other sub-sectors.
For our analysis, we adjust the firm-level returns by the Sensex returns. The adjusted weekly return for firm i is given by:
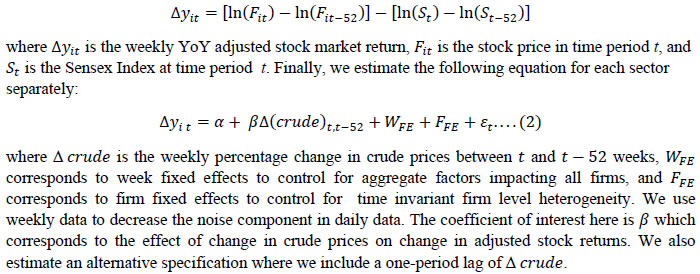 Our results show that adjusted stock market returns of automobile companies react negatively to a crude price increase. Chart 5 gives the coefficient plots of β for firms corresponding to different automobile sectors while Chart A.2 in the Appendix gives the coefficient plots for β for firms in the non-automobile sectors. Broadly, Charts 4 and A.1 suggest that the market adjusted stock returns of most sectors fall due to an increase in the crude prices but that of the automobile sub-sectors fall relatively more, especially for the automobile firms making commercial vehicles. In particular, from Chart 5 we see that a 100 bps growth in crude prices causes the growth of market adjusted stock returns of commercial automobiles to fall by 79 bps. In fact, apart from tractors, stock returns of all automobile sub-sectors fall significantly due to rise in crude prices. The overall results are summarized in Table A.3 in the Appendix.
III. Micro Evidence
In the previous section, we focussed on the impact of macro factors that affect aggregate automobile sales. This evidence was based on automobile dealer level data, which accounts for shipments to the dealers but not final sales. We conjecture that exogenous policy shocks may also affect automobile sales but dealer level data might smoothen out the impact as dealers might continue to build inventory even when there is a drop in sales due to policy change. In this section, we use disaggregated data from automobile registration to provide evidence for such policy changes.
III.1 Impact of policy shocks on automobile registration
In this subsection, we first investigate whether the reaction to exogenous policy shocks, as seen in the dealer level data, also holds true in the disaggregated data. We use monthly data on automobile registration from Karnataka between 2015 and 2019 for this exercise.7
Chart 6 shows the growth in two-wheeler registrations in five districts of Karnataka. There are a few notable trends from the two-wheeler segment in response to major policy shocks which were discussed in the previous section. First, the overall growth has been falling for the past few years. Second, each policy shock led to a decline in growth (except GST). The sharp decline immediately in the period following policy shock can be attributed to the shock itself, more so for the unanticipated shocks like demonetization and insurance policy change. BS-IV change was also unanticipated to some extent because auto firms were unsure about the precise details of the roll-out. Third, the Supreme Court in July 2018 announced the insurance policy change which led to frontloading of purchase in many districts like Belagavi and Mysuru, i.e., sharp growth between July and September 2018 and then a decline. Thus the decline in two-wheeler sales post September 2018 can partially be attributed to this frontloading of sales.
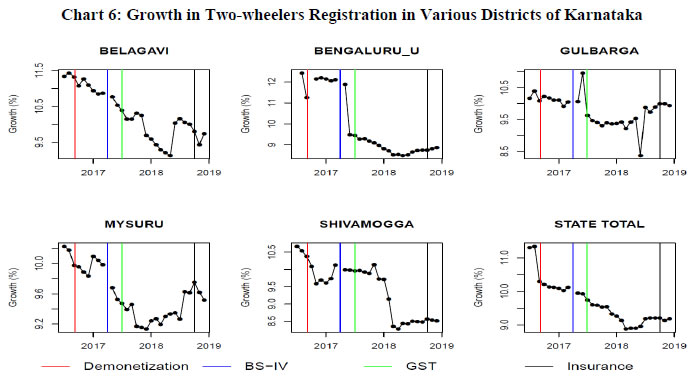
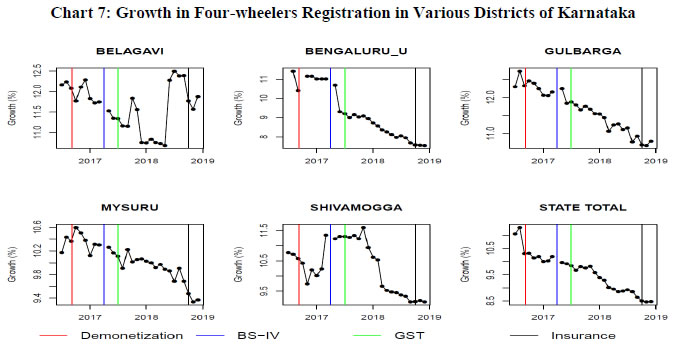 Since the insurance policy announcement period overlapped with the period when crude prices were going up, it is difficult to separate the impact of the two events quantitatively. However, we can look at the growth of four-wheelers at the disaggregated level to shed light on this issue. The growth of car sales for different districts in Karnataka is shown in Chart 7. We can see that four-wheeler sales have broadly followed a downward trend in the last two years, like in the case of two-wheeler. However, one difference between two-wheelers and four-wheelers is in their reaction to policy shocks; strong vs mild, respectively. This difference probably comes from the difference in incremental cost as a percentage of total value of the automobile. For example, the insurance policy change amounted to 8–10 per cent change in the initial cost of the two-wheeler segment while it was relatively lower for the four-wheelers8. Thus, one can say that insurance policy change impacted the two-wheeler sales relatively more compared to four-wheelers through bigger impact on prices.
In the next section, we look at another big development in the automobile sector driven by the launch of ride-hailing services across various cities in India. Although this is not a government induced policy shock, it had important consequences for the automobile sector.
III.2 Saturation in the ride-hailing services market
The last few years have seen phenomenal growth in ride-hailing services in India across cities with the expansion of Ola and Uber. This has led to the development and maturity of the taxi market in many cities. The rise in growth of taxi registrations during this time was one of the direct consequences of these services. The partial decline in taxi registrations seen since 2016 can possibly be attributed to the maturity of these services and overall saturation of taxi supply. Since taxi registrations account for around 6 per cent of the overall four-wheeler market, the decline in overall four-wheeler sales in the last two years can be partially attributed to this factor.
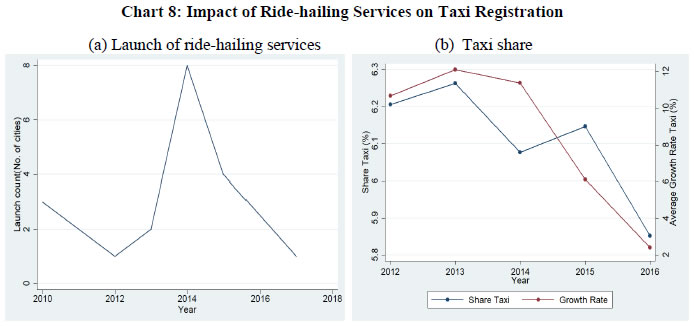 Chart 8a shows the number of cities which saw the launch of ride-hailing services since 20109. Suppose a city gets the first ride-hailing service in 2012, we count 2012 as the year of launch in that city. We see that the ride-hailing services expanded throughout the country and peaked in 2014 with launches across eight cities. This was accompanied with rapid rise in taxi registrations in cities where these services were launched. Chart 8b shows that average growth in taxi registrations until 2014 was above 10 per cent in these cities. However post 2014, the growth in taxi registrations declined as there were fewer number of new cities added by the ride-hailing companies. This is also reflected in the share of taxis in the total four-wheeler registrations, which went above 6.1 per cent and then declined to 5.8 per cent in 2016.
We can use the share of taxis in total four-wheelers (6 per cent of total) and slowdown in taxi registrations together to account for their contribution to the slowdown in aggregate four-wheeler growth. The growth rate in taxi registrations went down from 12 per cent to 3 per cent between 2014 and 2016. By simple accounting, we find that the taxi segment alone contributed to a decline of 54 bps (9 percentage point growth decline on 6 per cent share in four-wheeler registrations) in the overall four-wheeler market during the same period.
IV. Conclusion
The automobile sector is among the key sectors in India due to its significant weight in the overall Gross Domestic Product (GDP). In this memo, we evaluate the various factors that affect auto sales growth in India and provide a plausible explanation for the recent slowdown. We find that at the macro level, fuel price movement affects automobile sales negatively whereas credit appears to have no significant impact. Based on our analysis, we find that the recent slowdown can be explained by relatively high fuel prices. Using firm-level stock prices data, we further show that the valuation of auto firms reacts inversely to fuel price movements. This evidence corroborates the importance of fuel price movements for the automobile sector. In addition, the evidence from micro data on automobile registrations suggests that policy changes like vehicle insurance can also induce short-term fluctuations in the automobile sector. Finally, we show how maturity in the ride-hailing service segment may have also contributed to the slowdown in vehicle registrations over the last few years.
References
Ludvigson, S. (1998). “The Channel of Monetary Transmission to Demand: Evidence from the Market for Automobile Credit”, Journal of Money, Credit and Banking, 30(3), pp. 365–383.
Narayanan, G., and P. Vashisht (2008). “Determinants of Competitiveness of the Indian Auto Industry”, Working Paper No. 201, Indian Council for Research on International Economic Relations (ICRIER). Available at http://icrier.org/pdf/Working%20Paper%20201.pdf.
Appendix
| Table A.1: Variables and Sources |
| Variable |
Source |
Notes |
| Vehicle Sales |
Society of Automobile
Manufacturers Association (SIAM) |
|
| Vehicle Credit (SCB) |
RBI |
Sectoral deployment of credit (SCBs) |
| Vehicle Credit (NBFC) |
RBI |
Quarterly data, December 2018 latest available |
| Fuel Price |
Daily petrol and diesel prices, Indian Oil Corporation |
We have taken a monthly average across 4 metros: Delhi, Mumbai, Kolkata and Chennai. |
| Table A.2: Sample Details Across Sectors used in Regression Equation (2) |
| Sub-sector |
Number of Observations |
Number of Firms |
| Commercial |
2,295 |
5 |
| Two-wheeler |
1,836 |
4 |
| Passenger Vehicles |
1,836 |
4 |
| Tractors |
918 |
2 |
| Others |
122,094 |
265 |
| Table A.3: Dependent Variable: Firm-Level Weekly Adjusted Returns |
| |
Adjusted Stock Market Returns |
| |
Commercial
(1) |
Two- wheeler
(2) |
Passenger
(3) |
Tractor
(4) |
Commercial
(5) |
Two-wheeler
(6) |
Passenger
(7) |
Tractor
(8) |
| Δ(crude) |
-0.79***
(0.027) |
-0.23***
(0.026) |
-0.05***
(0.019) |
0.023
(0.05) |
-0.84***
(0.20) |
-0.19
(0.19) |
-0.10
(0.13) |
0.41
(0.36) |
| L.Δ(crude) |
|
|
|
|
0.04
(0.20) |
-0.04
(0.19) |
0.04
(0.13) |
-0.39
(0.36) |
| Firm FE |
Y |
Y |
Y |
Y |
Y |
Y |
Y |
Y |
| Week FE |
Y |
Y |
Y |
Y |
Y |
Y |
Y |
Y |
| N Obs. |
2035 |
1628 |
1628 |
814 |
2030 |
1624 |
1624 |
812 |
| R^2 |
0.34 |
0.20 |
0.25 |
0.00 |
0.34 |
0.20 |
0.25 |
0.01 |
|